Nanoscale protein architecture of the kidney glomerular basement membrane
- Washington University School of Medicine, United States
- Howard Hughes Medical Institute, Washington University School of Medicine, United States
Figures
Figure 1 with 3 supplements
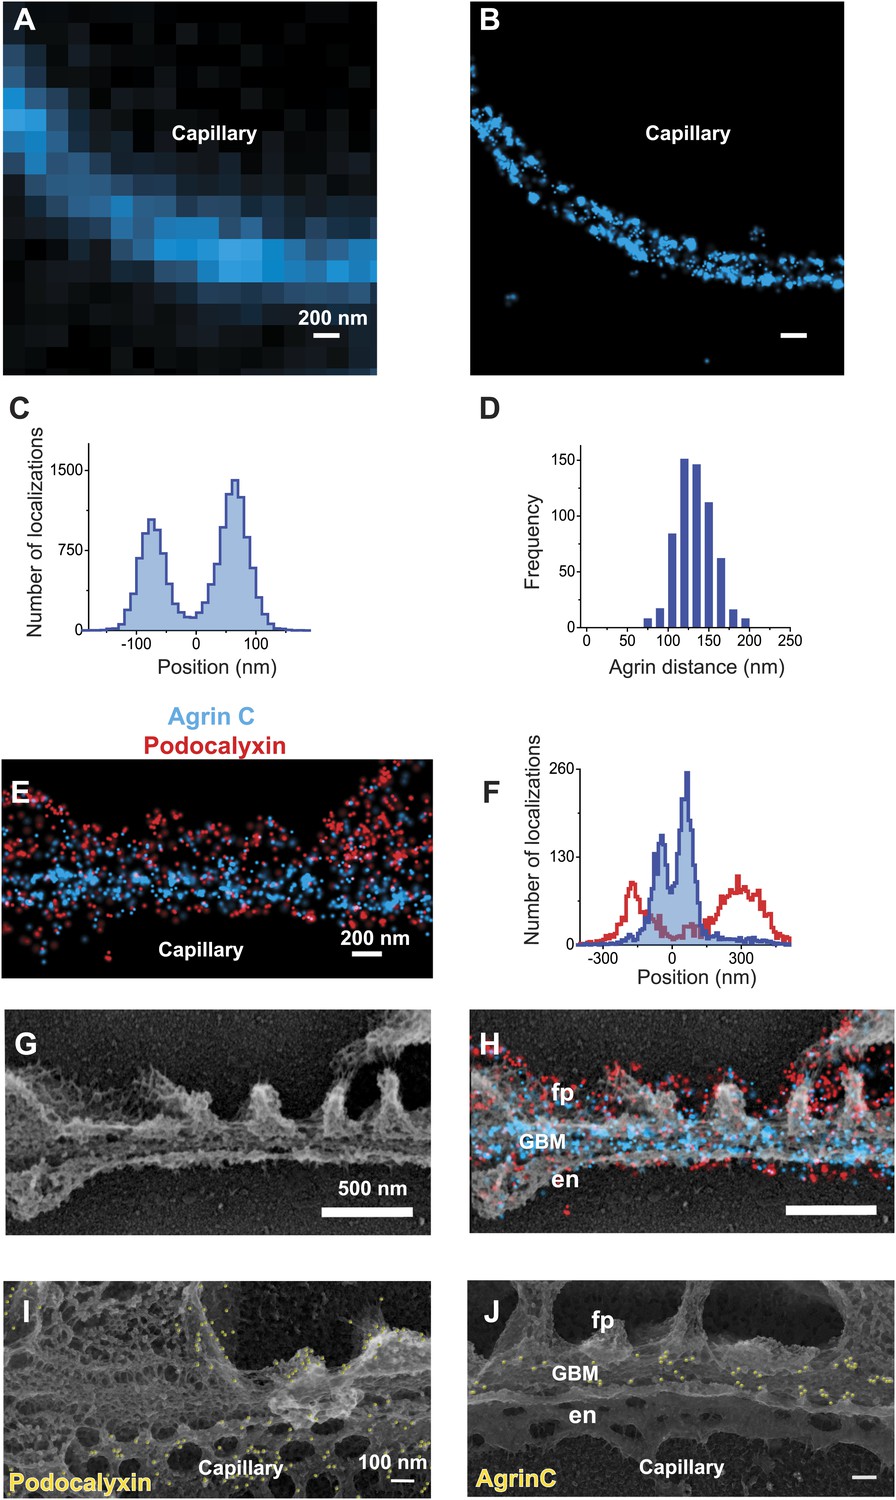
STORM and STORM-EM image correlation of the mouse GBM.
Conventional fluorescence (A) and STORM (B) images of a kidney glomerular capillary loop labeled with an antibody to agrin. (C) Projection histogram of agrin STORM localizations accumulated from 80 different capillary regions. (D) AgrinC peak-to-peak distance measured across 604 regions in this study. (E and F) 2-color STORM and quantification of agrinC and podocaylxin labeling along a capillary region. (G) Platinum deep etch replica prepared from the section shown in (E) and imaged by EM. (H) Overlay of the STORM and EM images shows ultrastructural features such as podocyte foot processes (fp), endothelial cells (en) and the GBM. Podocalyxin labeling is seen along the foot process periphery and agrin localization within the GBM. Figure 1—figure supplement 1 shows a wide field podocalyxin-agrin STORM image overlayed with its EM correlation and Figure 1—figure supplement 2 shows a schematic overview of the STORM–EM correlation procedure. (I and J) Immuno-gold labeling and platinum replica EM from a kidney section confirm podocalyxin localization to the fp and en sides (I) and agrinC localization in two layers in the GBM (J). Figure 1—figure supplement 3 shows a STORM image and histogram of two separate antibodies labeling the C-terminus end of agrin.
Figure 1—figure supplement 1
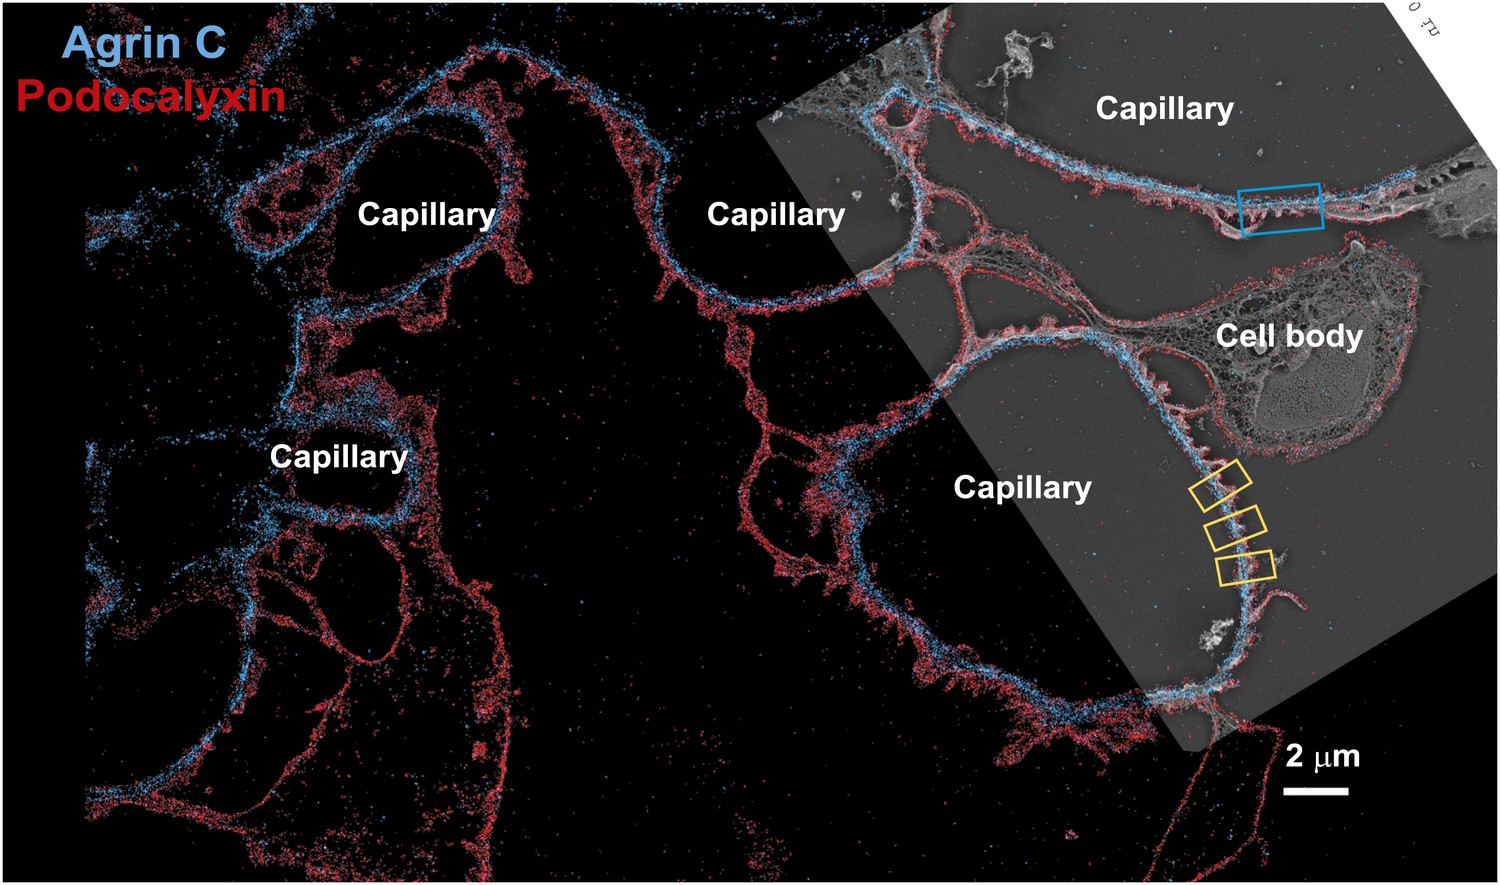
Low magnification image of EM/STORM correlation.
Wide-field STORM image of a kidney section labeled with podocalyxin and agrinC, overlaid with a platinum deep etch replica EM image obtained from the same section. Podocyte cell bodies and capillary loops are marked and the blue boxed region is zoomed in Figure 1E–H. Yellow boxes are examples of capillary loop regions used to quantify localizations.
Figure 1—figure supplement 2
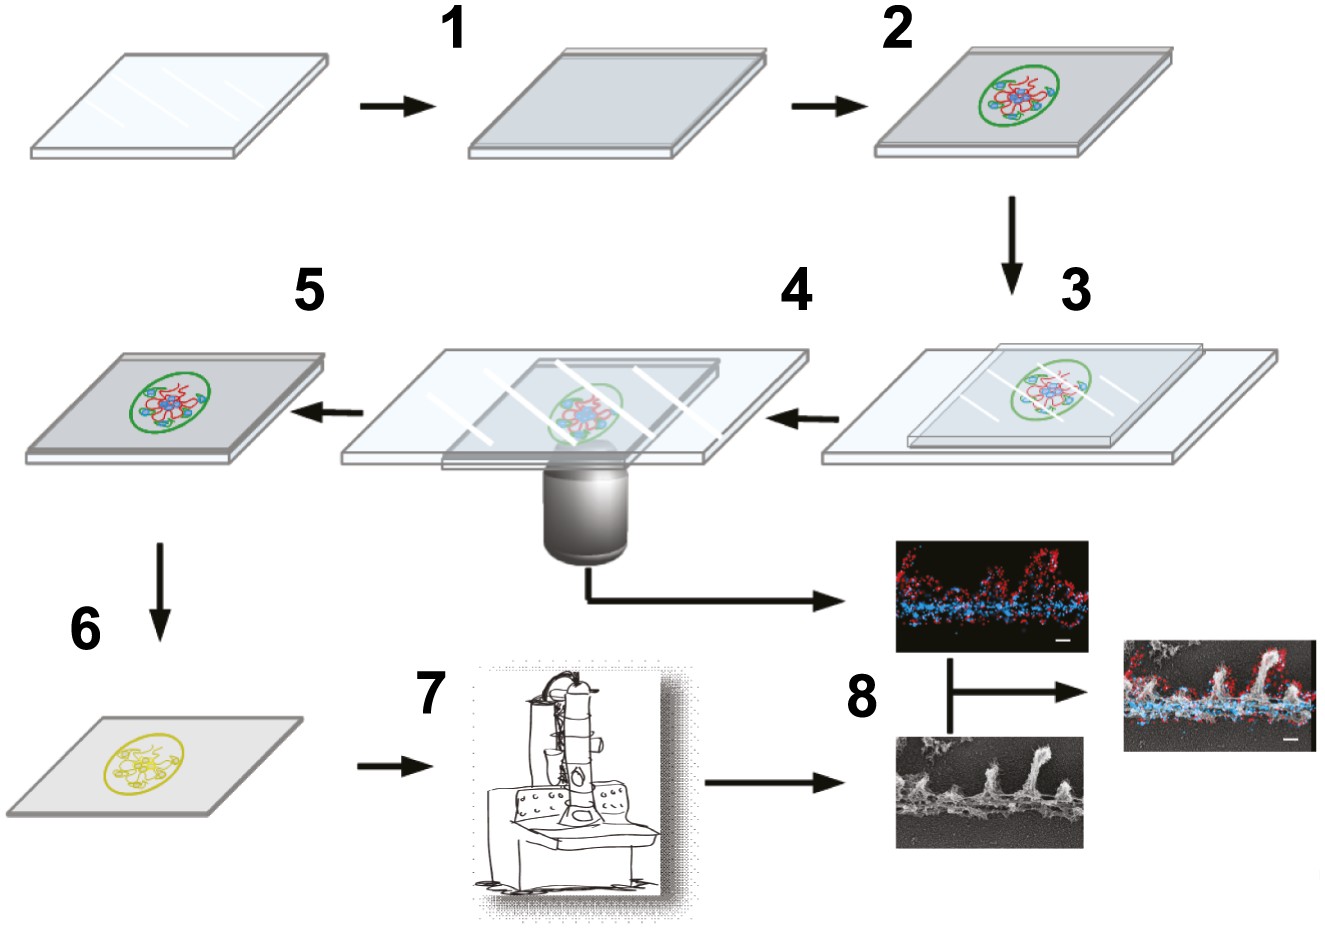
Schematic showing steps involved in processing of samples.
Schematic of the STORM–EM correlation procedure consisting of the following steps: (1) glass coverslip is coated with carbon and glow discharged, (2) Tokuyasu cryo-sections are collected on the carbon coated coverslip surface, (3) immunolabeled sections are inverted onto a glass slide containing STORM imaging buffer and coverslip edges sealed with nail polish. After STORM image acquisition on an inverted microscope (4), nail polish and coverslips are removed, fixed with 2% glutaraldehyde (5). (6) Coverslips are quick frozen and coated with platinum/carbon followed by dissolving the glass and tissue underneath the carbon. (7) Carbon films with platinum replicas are imaged by EM after transferring to a grid. (8) STORM and EM images are superimposed.
Figure 1—figure supplement 3
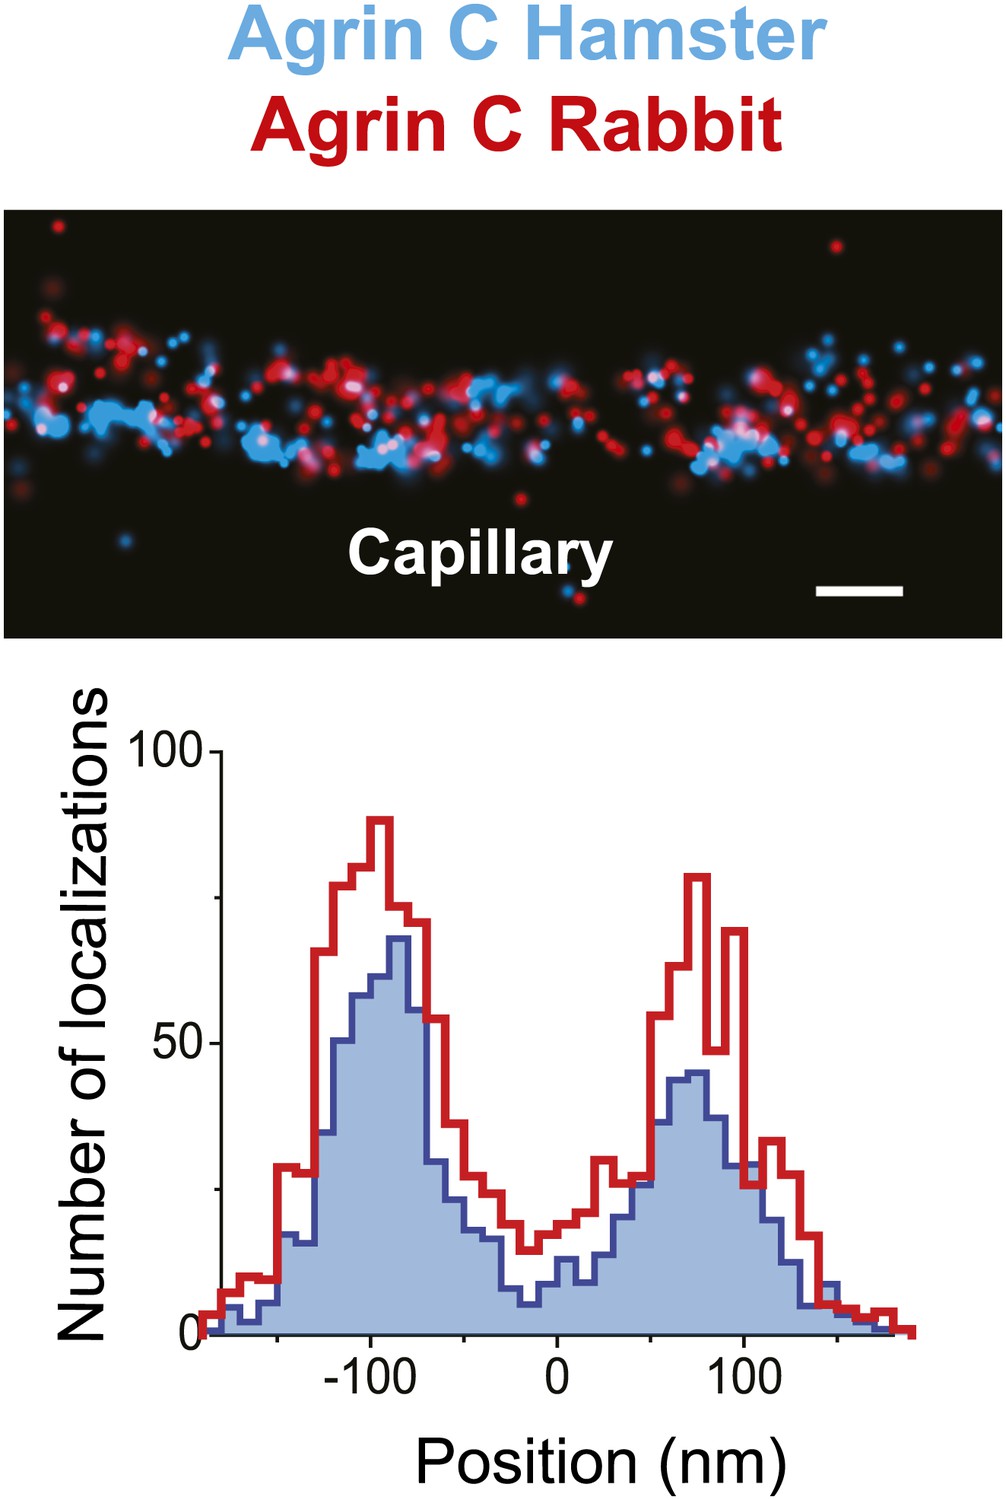
Similar pattern of staining from two different agrin antibodies.
STORM image and projection histogram of two separate antibodies labeling the C-terminus end of agrin. Scale bar: 200 nm.
Figure 2 with 2 supplements
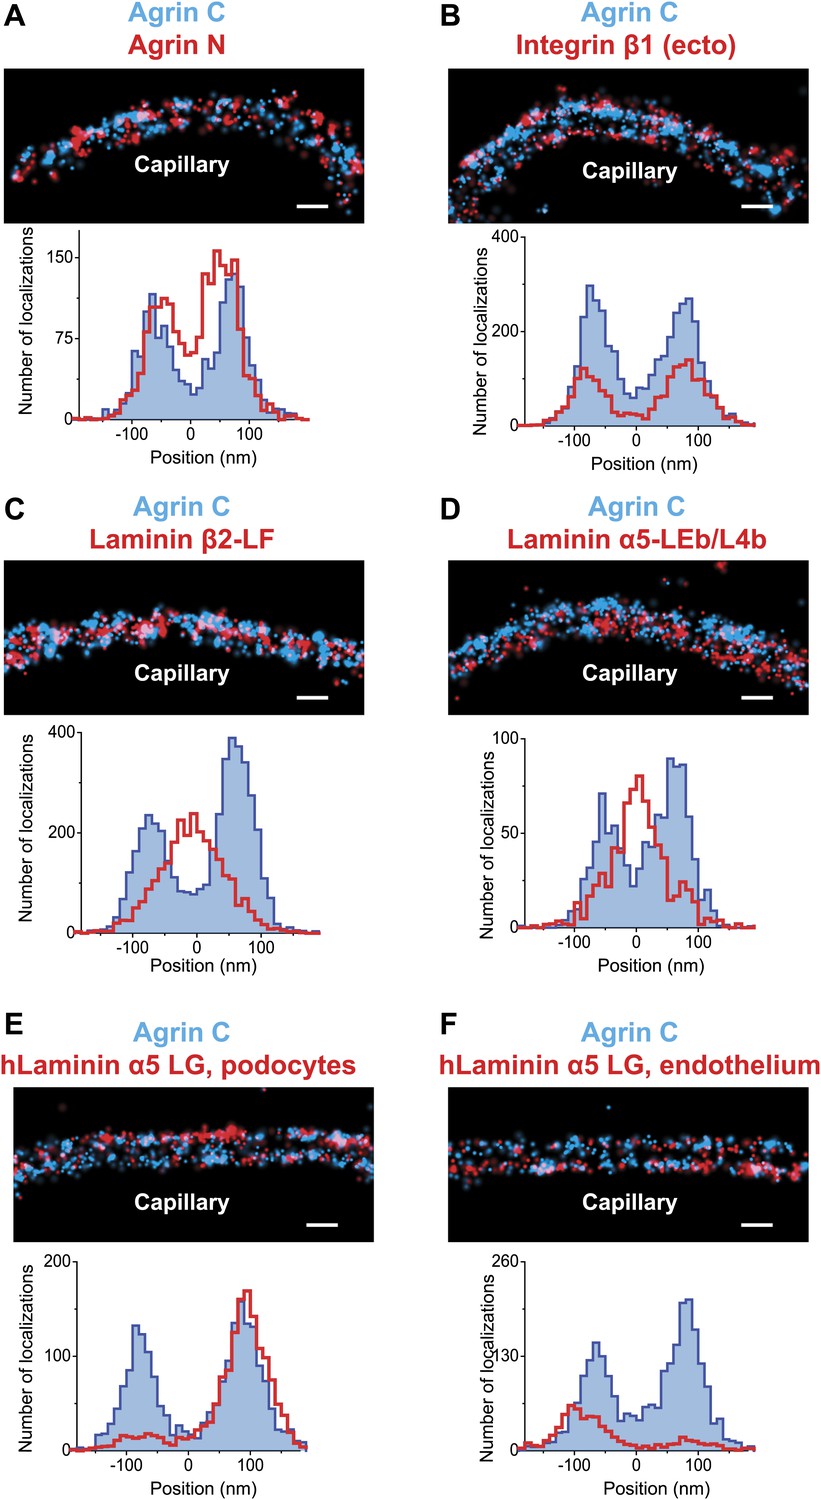
Positioning molecular domains within the GBM.
Two channel STORM of agrinC along with antibodies to agrinN (A), the integrin β1 extracellular domain (B), laminin β2-LF domain (C) and laminin α5-LEb/L4b domain (D). Sections from transgenic mice expressing hLaminin α5 either from podocytes (E), or from endothelial cells (F) were labeled using an antibody against the human laminin α5-LG domain along with agrinC. Representative STORM images are displayed along with projection histograms of STORM localizations quantified across several regions. Figure 2—figure supplement 1 illustrates domains of ECM molecules mapped in this study and Figure 2—figure supplement 2 is a STORM image and histogram of laminin β2-LF along with integrin β1. Scale bar: 200 nm.
Figure 2—figure supplement 1
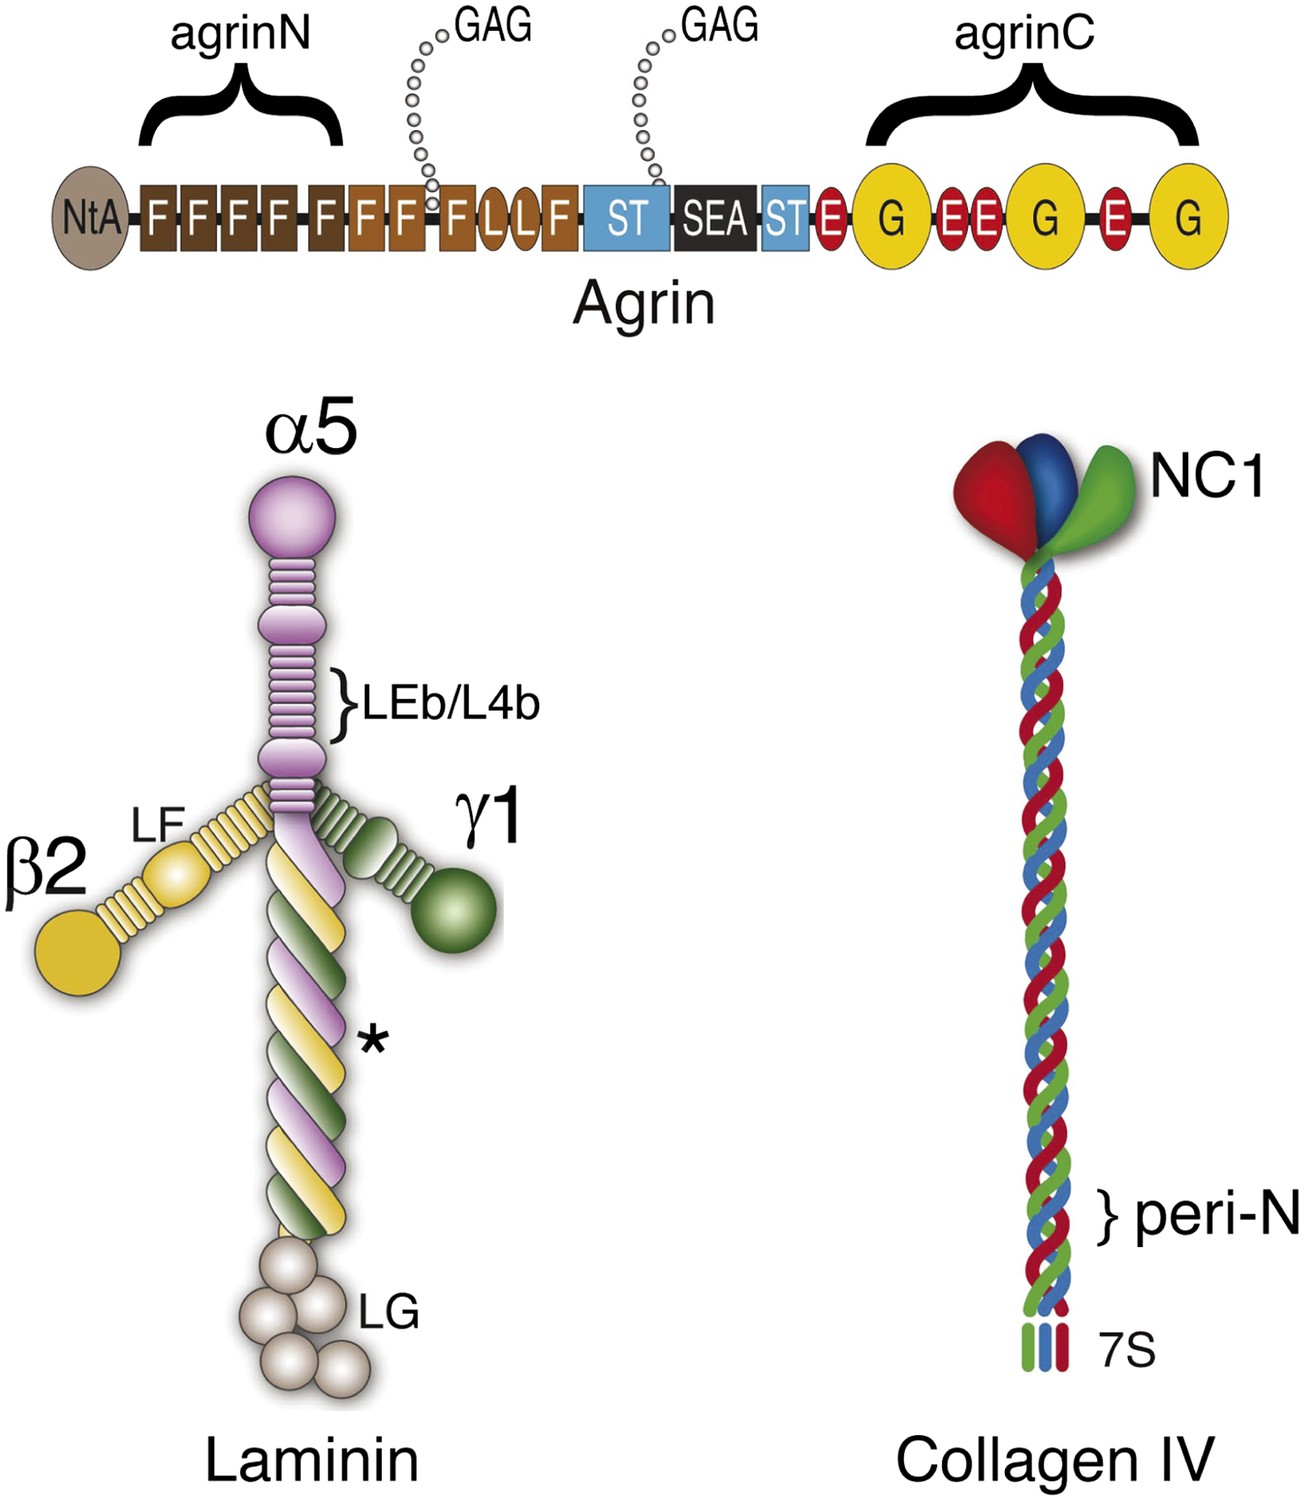
Cartoon showing the relationship between antigenic epitopes and the structure of Agrin, Laminin and Collagen IV.
Illustration of ECM molecule epitopes mapped by antibodies used in this study. Glycosaminoglycan (GAG) chains attached to agrin are shown. The asterisk indicates the approximate binding site for the agrin N-terminal domain (NtA) on laminin γ1.
Figure 2—figure supplement 2
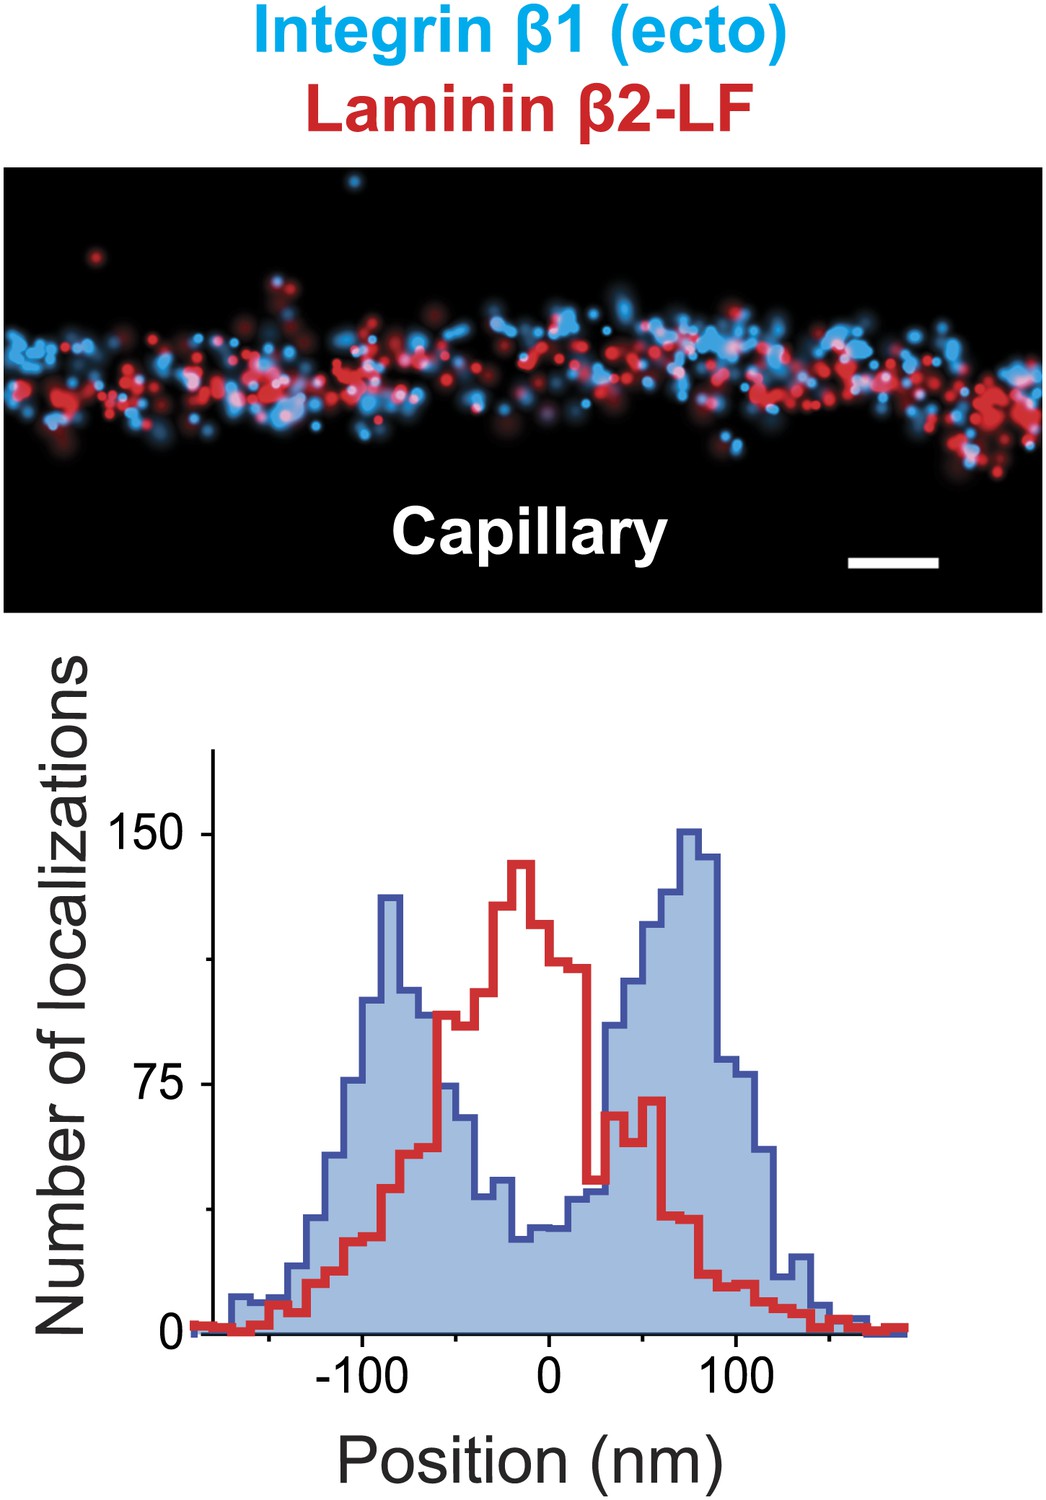
STORM image of Integrin β1 and Laminin β2 confirms the central localization of Laminin.
STORM image and projection histogram of laminin β2 along with integrin β1 antibody. Scale bar: 200 nm.
Figure 3
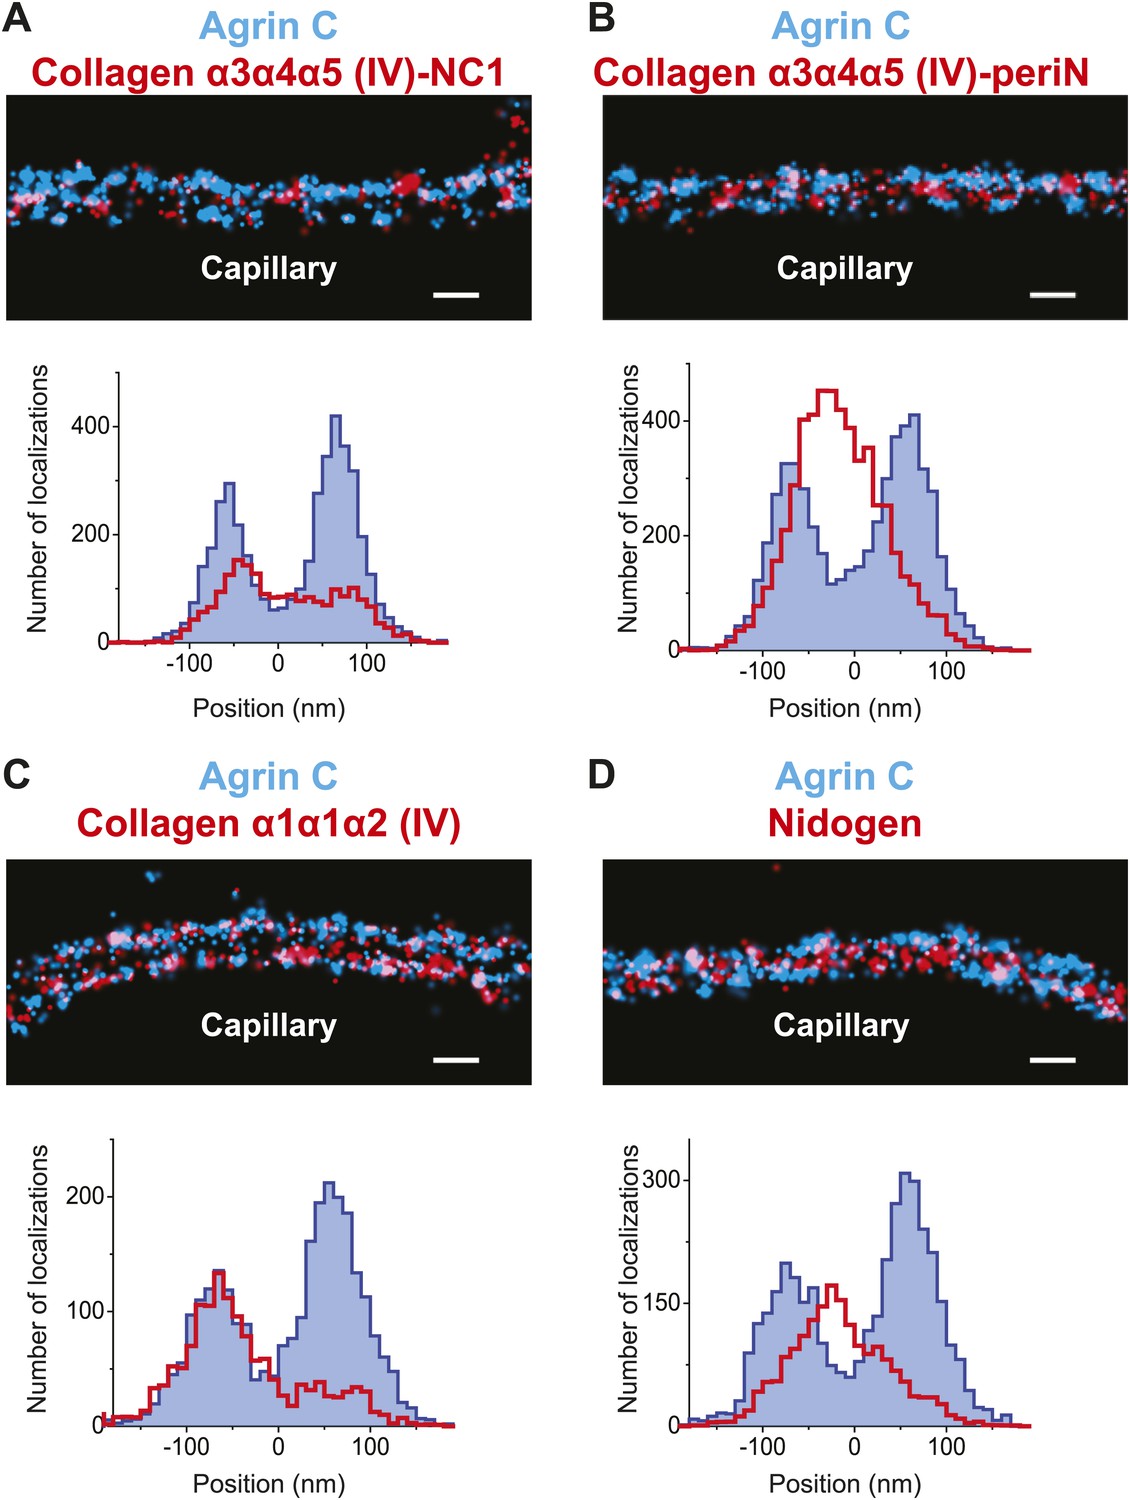
Collagen IV distribution in the GBM.
STORM localization of collagen α3α4α5 (IV)-NC1 (A) and collagen α3α4α5 (IV)-periN (B) domains along with agrinC show the position of the collagen α3α4α5 (IV) network towards the center of the GBM. In contrast, collagen α1α1α2 (IV) labeling (C) is restricted to the endothelial side of the GBM. (D) Nidogen localizes in the center of the GBM. Scale bar: 200 nm.
Figure 4
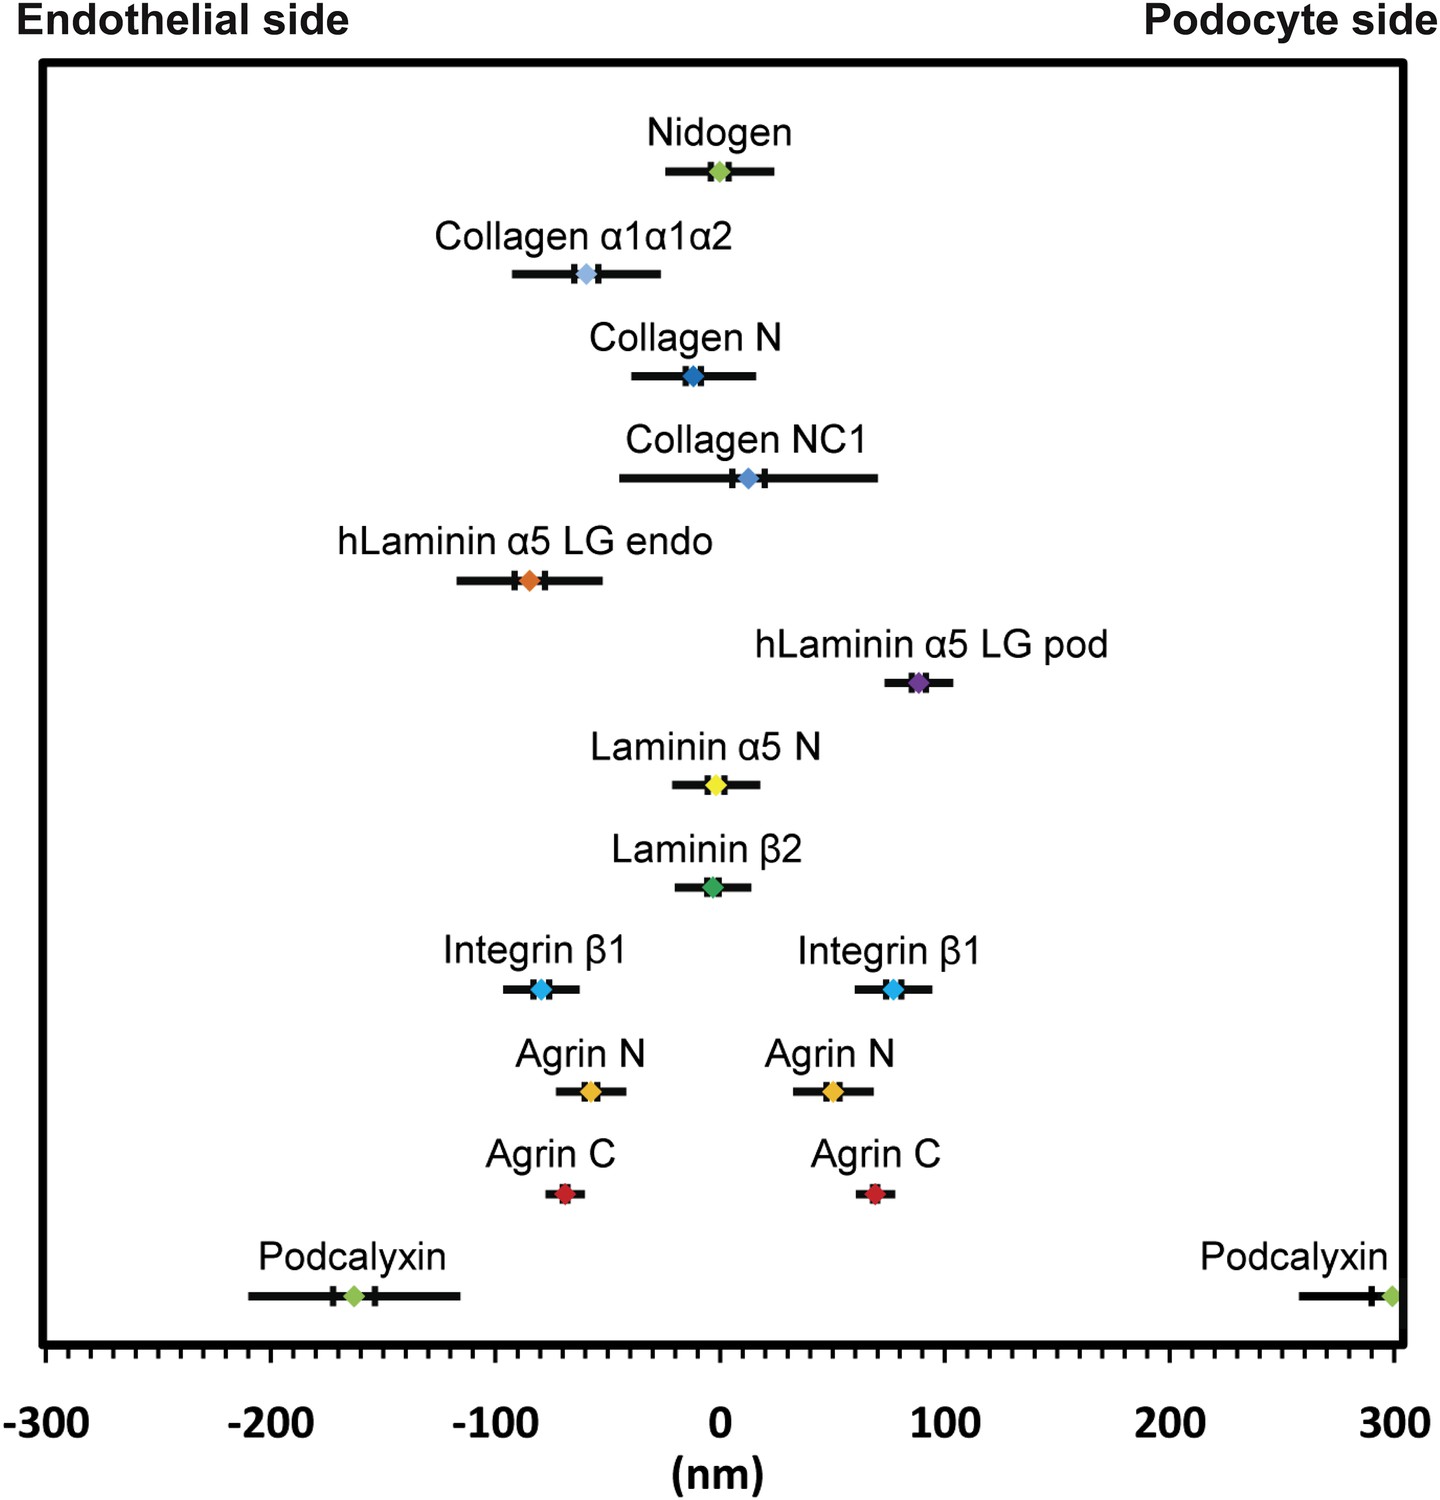
Positions of molecular epitopes within the GBM.
A map of axial positions of various GBM protein domains obtained from STORM imaging in this study. For each protein, the colored dot specifies the mean axial position; the two vertical lines represent the standard error of the mean, and the half-length of the horizontal bar denotes the standard deviation.
-
Figure 4—source data 1
Calculated relative position of molecules in the mouse GBM.
- https://doi.org/10.7554/eLife.01149.012
Figure 5 with 3 supplements
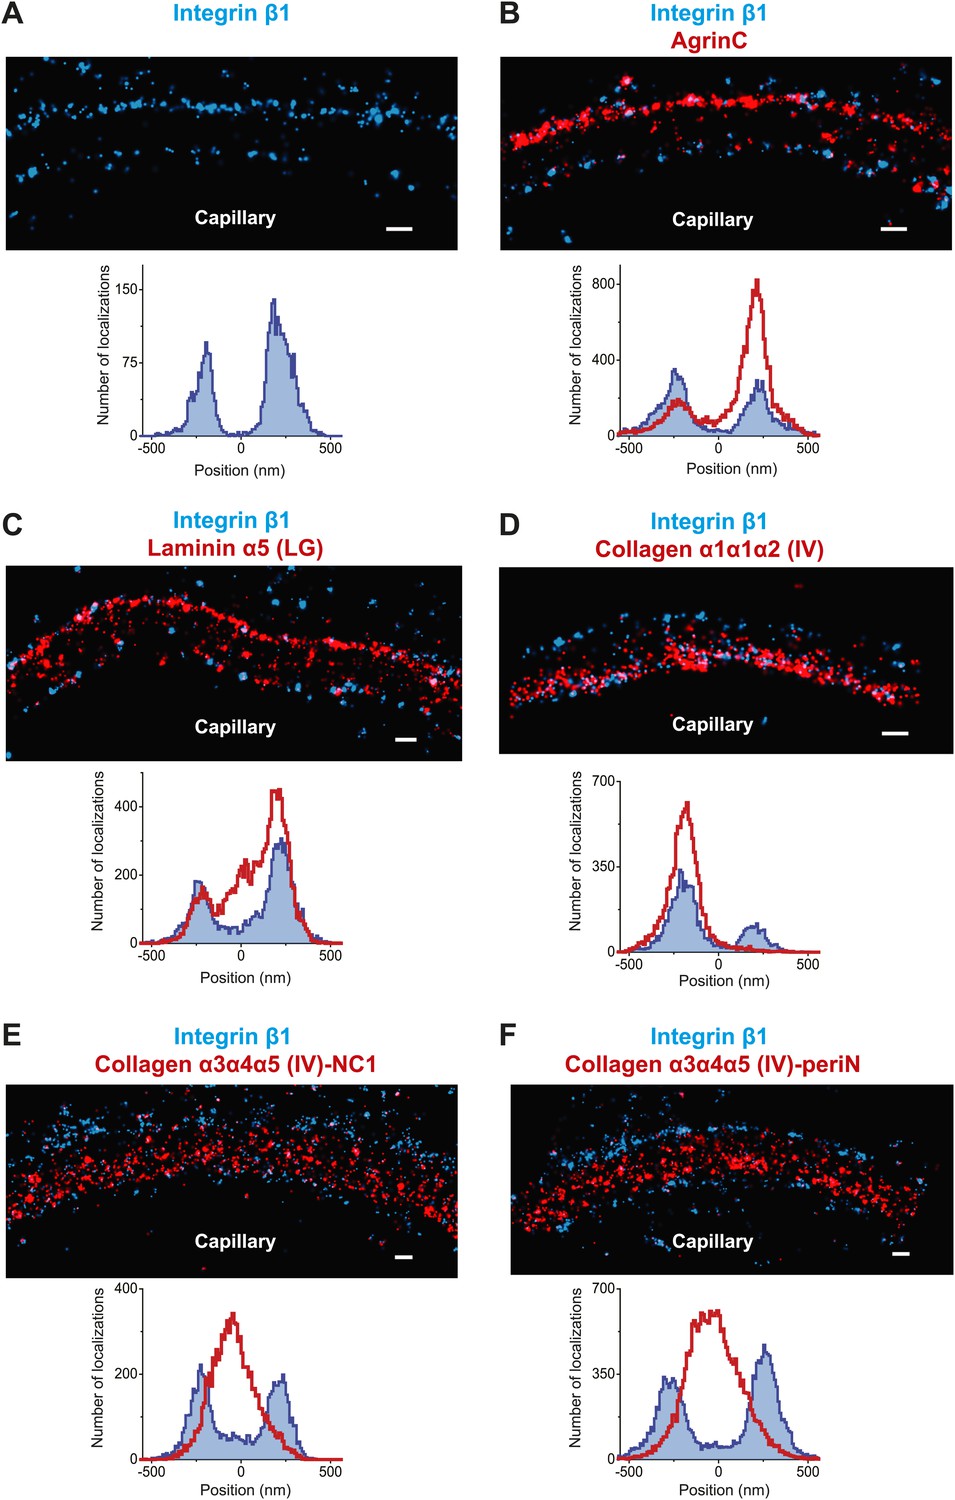
Molecular organization of the human GBM.
(A) Single channel STORM of integrin β1-labeled human GBM sections. Figure 5—figure supplement 1 shows two channel STORM using two different integrin β1 antibodies. Human kidney sections were labeled with antibodies to integrin β1 ectodomain and: agrinC (B), laminin α5 (LG) (C), collagen α1α1α2 (IV) (D), collagen α3α4α5 (IV)-NC1 (E) and collagen α3α4α5 (IV)-periN (F). Figure 5—figure supplement 2 shows anti-laminin α5-LG labeling of the human GBM and a replica EM image of the same section. Figure 5—figure supplement 3 shows anti-collagen α1α1α2(IV) and collagen α3α4α5 (IV)-NC1 labeling of a human GBM region. Scale bar: 200 nm.
-
Figure 5—source data 1
Calculated relative position of molecules in the human GBM.
- https://doi.org/10.7554/eLife.01149.014
Figure 5—figure supplement 1
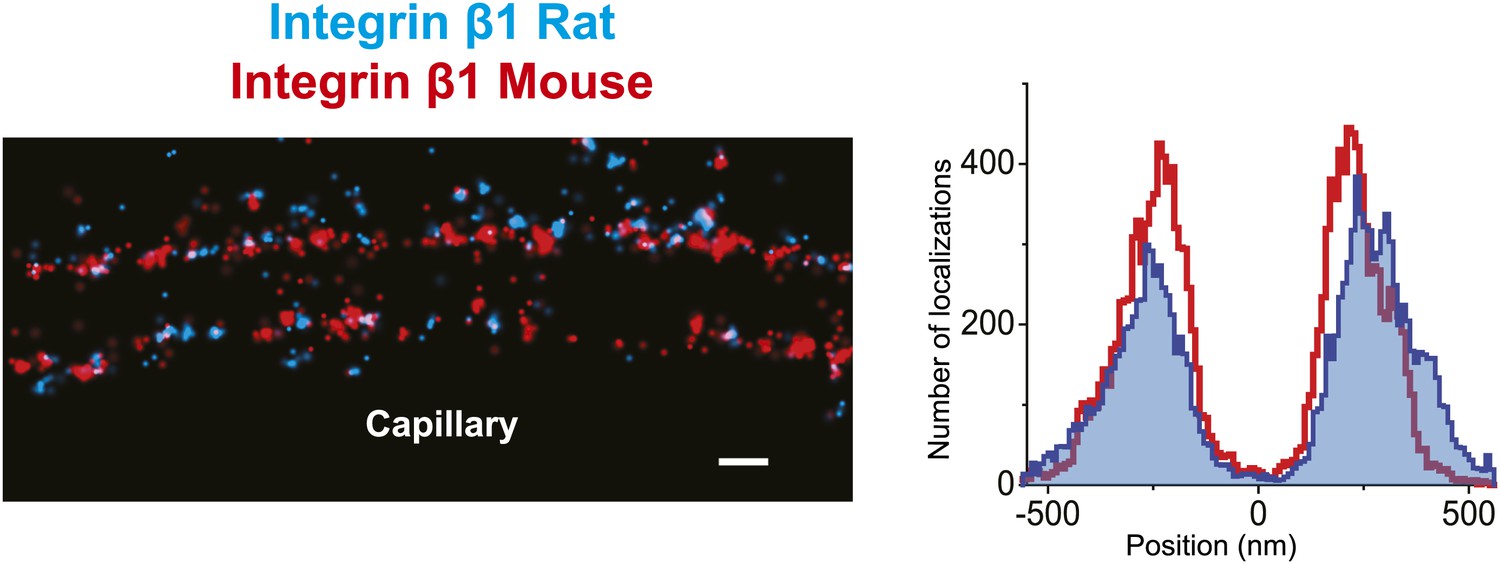
Similar pattern of staining obtained with two different human integrin β1 antibodies.
Double channel STORM using two different integrin β1 antibodies to label human GBM sections (MAB13: blue, TS2/16: red). The projection histogram reveals a peak-to-peak distance of ∼400 nm. Scale bar: 200 nm.
Figure 5—figure supplement 2

Laminin a5 stains multiple layers in normal human GBM.
(A and B) STORM image of laminin α5-LG labeling of the human GBM and a replica EM image of the same section. Scale bar: 200 nm.
Figure 5—figure supplement 3
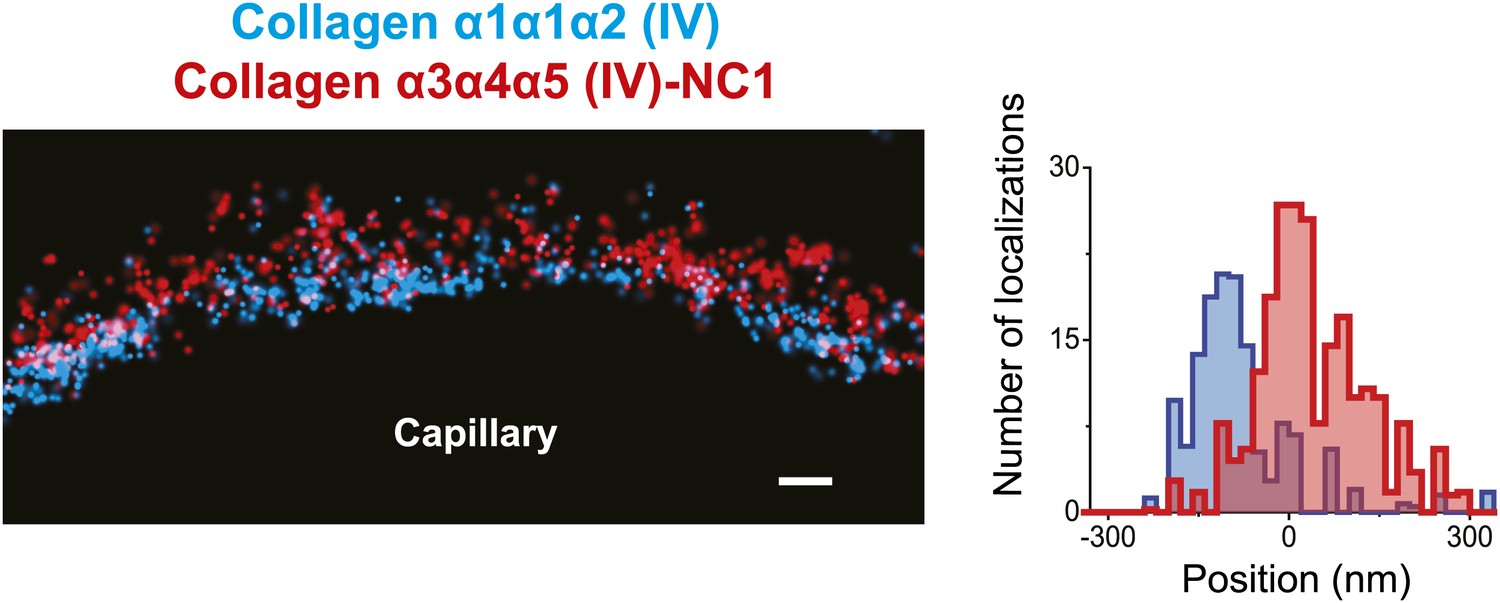
Distinct localization of Collagen α1α1α2 (IV) and Collagen α3α4α5 (IV) in human GBM.
Collagen α1α1α2(IV) and collagen α3α4α5 (IV)-NC1 labeling of a human GBM region. Since agrin or integrin were not used for orientation, the localizations from the region depicted in the image were quantified. Scale bar: 200 nm.
Figure 6
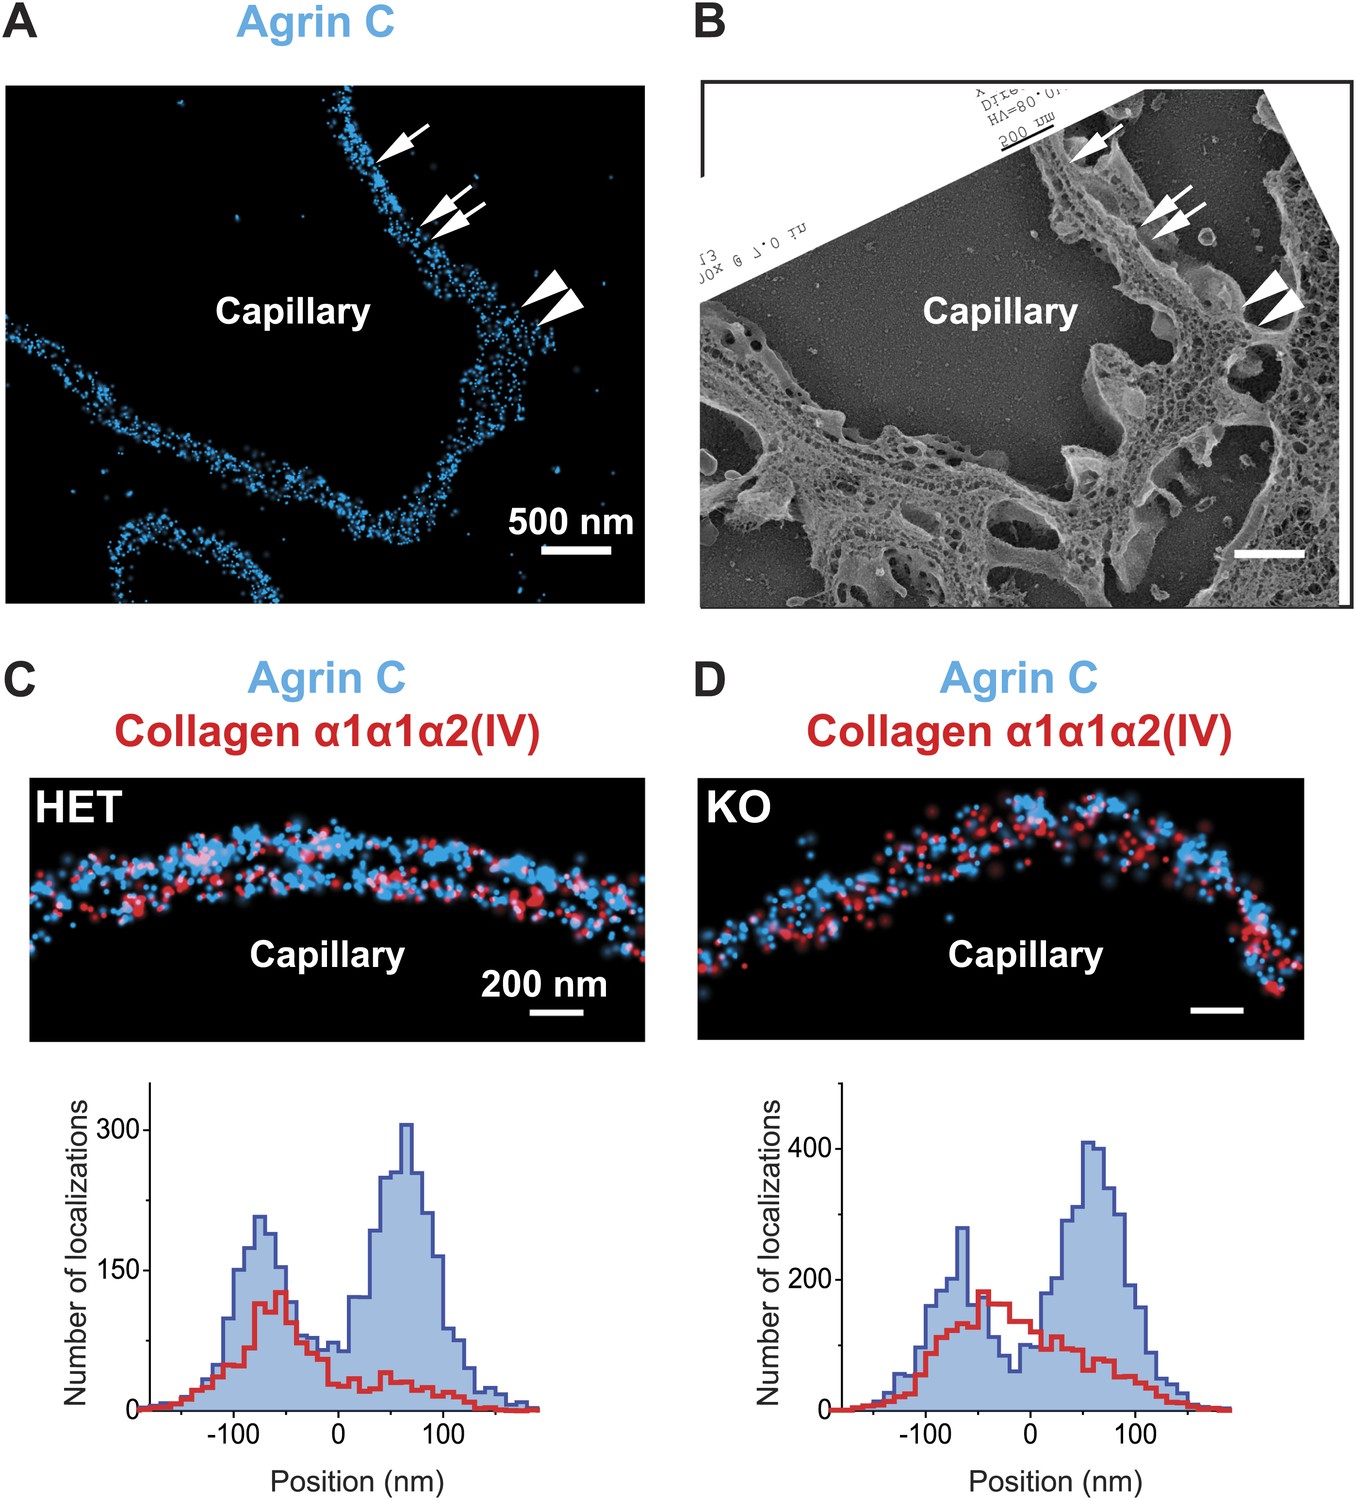
Breakdown of the GBM molecular architecture in a mouse model of Alport syndrome.
(A and B) STORM and EM images of a capillary loop from a collagen α3(IV) knockout (KO) mouse kidney labeled with agrinC shows a thin GBM with 2-layered agrin (single arrow) as well as a breakdown of the 2-layered agrin labeling pattern (double arrow) and a thick irregular GBM stretch showing disorganized, diffuse agrinC labeling (arrowheads). (C and D) Images and quantification of capillary loops selected from collagen α3(IV) KO and heterozygous (HET) kidney that show two layers of agrinC. Despite the intact agrin layers, collagen α1α1α2(IV) shows an atypical distribution spread across the GBM in the KO vs a single peak in the HET littermate control.
Additional files
-
Supplementary file 1
List of antibodies used in this study.
- https://doi.org/10.7554/eLife.01149.019
Download links
A two-part list of links to download the article, or parts of the article, in various formats.
Downloads (link to download the article as PDF)
Open citations (links to open the citations from this article in various online reference manager services)
Cite this article (links to download the citations from this article in formats compatible with various reference manager tools)
Nanoscale protein architecture of the kidney glomerular basement membrane
eLife 2:e01149.
https://doi.org/10.7554/eLife.01149


