Common resting brain dynamics indicate a possible mechanism underlying zolpidem response in severe brain injury
- Weill Cornell Medical College, United States
- University of Liège and University Hospital of Liège, Belgium
- Memorial Sloan Kettering Cancer Center, United States
- Boston University School of Medicine, United States
Figures
Figure 1
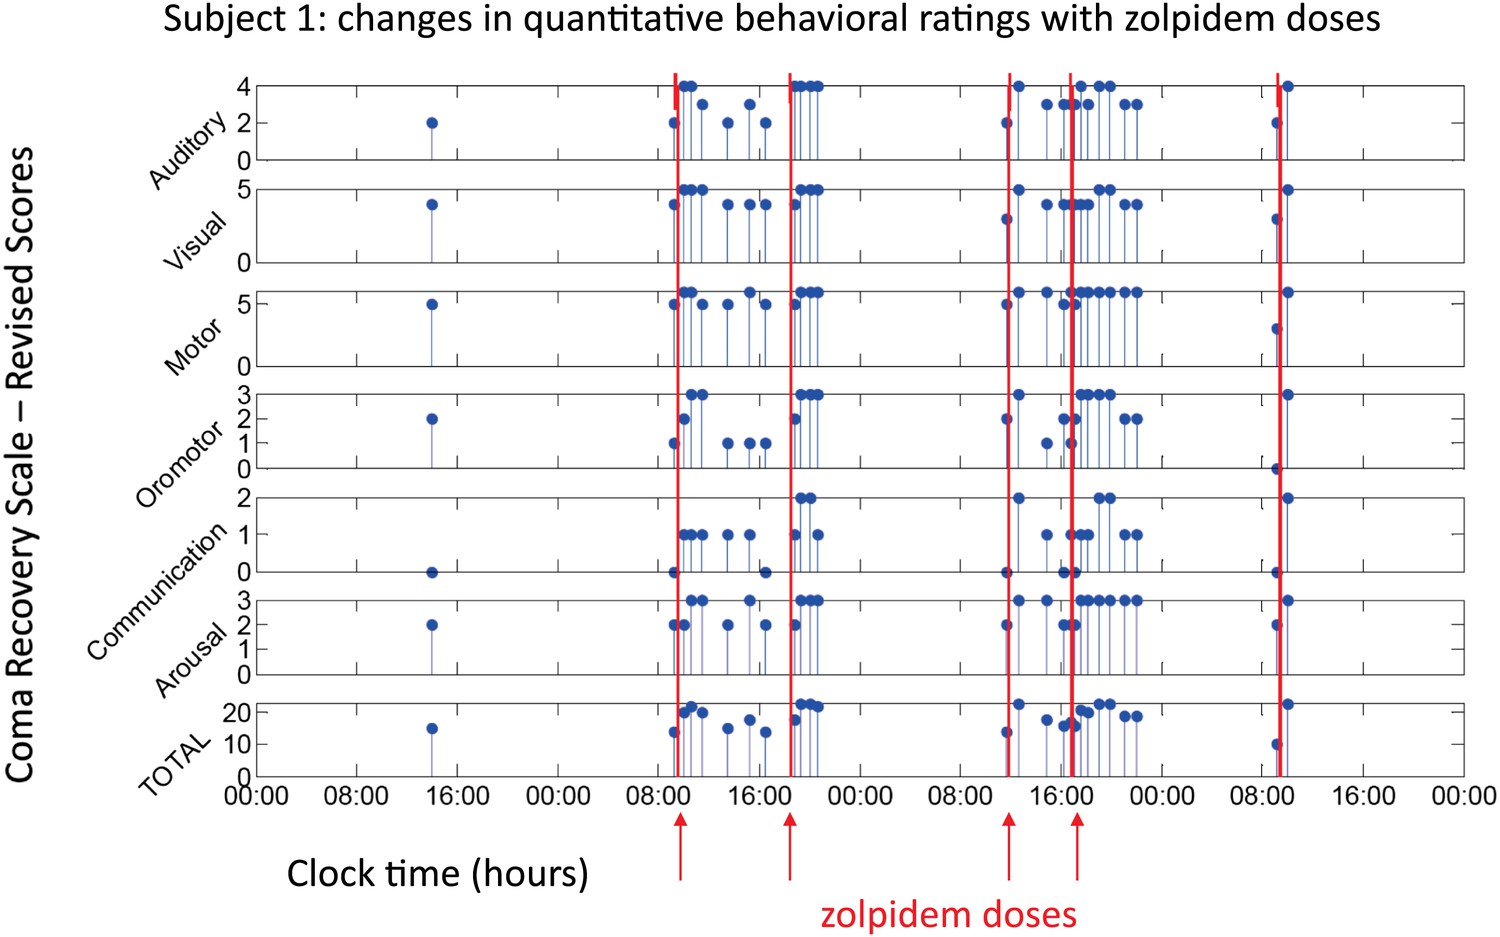
Behavioral changes associated with zolpidem doses in Subject 1.
Subject 1 demonstrated only a limited range of behaviors in the baseline (OFF drug) state including automatic motor responses (e.g., reaching to a hand extended for a handshake, CRS-R motor subscore 5), oro-motor behaviors (e.g., opening mouth when presented with a spoon CRS-R oro-motor subscore 2 or biting a tongue depressor, CRS-R oro-motor subscore 1), localization of sound with head turning (CRS-R auditory subscale score 2), and reaching to objects (CRS-R visual subscale score 4). During all baseline assessments the patient demonstrated no evidence of command following or a communication system (CRS-R communication subscale score 0). Across three assessments of baseline behavior OFF drug after overnight periods and a 62 hr washout period at the onset of the study total CRS-R scores ranged from 10–15 reflecting a lack of goal-directed behaviors, evidence of any communication systems either verbal or gestural, nor consistent response to command following. Across two assessments of baseline behavior at least 4 hr after a prior dose of zolpidem within a day (reflecting typical duration of action of the medication) maximal total CRS-R scores of 18 reflected evidence of command following with inaccurate communication and higher level motor function (CRS-R subscale motor score of 6) or consistent auditory command following (CRS-R auditory subscale score of 4). Compared with these baseline behavioral assessments, consistent achievement of a maximum possible total CRS-R scores of 23 was obtained during all ON drug periods reflecting a state in which the patient consistently demonstrated behavioral levels not captured by this psychometric instrument including recovery of consistent communication, fluent verbal communication, writing and complex organized movements (see ‘Clinical histories’ for further clinical details and additional neuropsychological assessments). As seen in graph, a maximal total CRS-R scores consistently appeared following drug administration within approximately 1 hr and had a variable duration of maintenance with second daily dose of the medication showing extended time periods of maximal total scores. Red arrows indicate zolpidem doses for which accompanying EEG data were available for analyses. Videos 1 and 2 illustrate aspects of the examinations to show correspondence of numerical ratings and behavior.
Figure 2 with 1 supplement
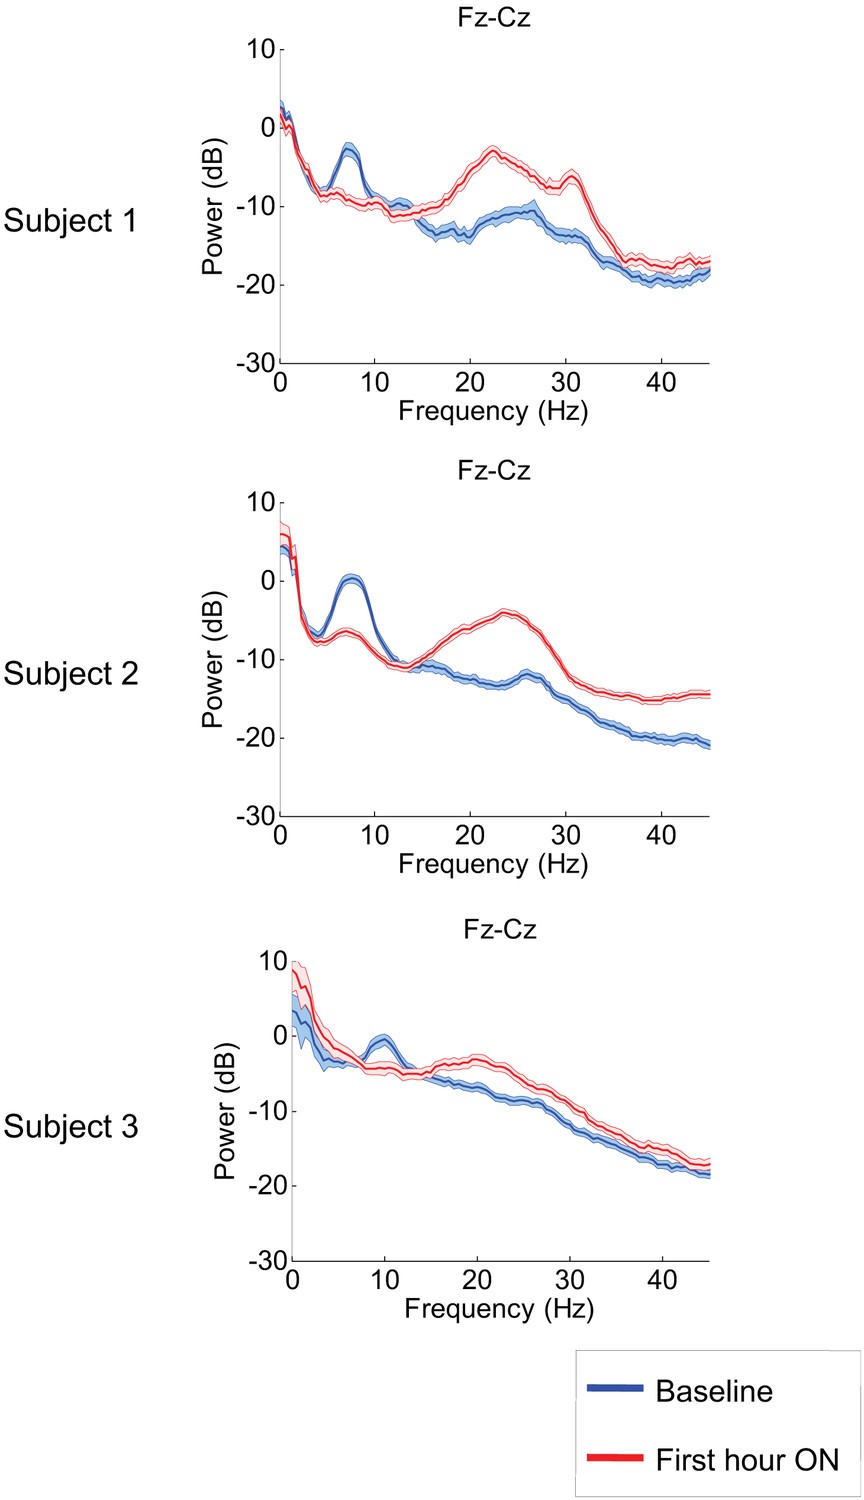
Power spectra estimated from midline EEG channel Fz-Cz recordings.
Power spectra from all three subjects (mean and 95% confidence intervals). Red: average spectral power in the hour prior to each zolpidem dose. Blue: 20–60 min after the zolpidem dose. Narrow, low frequency spectral peaks are apparent in the pre-drug state that are attenuated in the hour post-dose. Beta range peaks (20–30 Hz) are apparent in all post-drug spectra. Changes in ∼6–10 Hz peak between conditions are significant by two-group test (see ‘Methods’; Table 1).
Figure 2—figure supplement 1
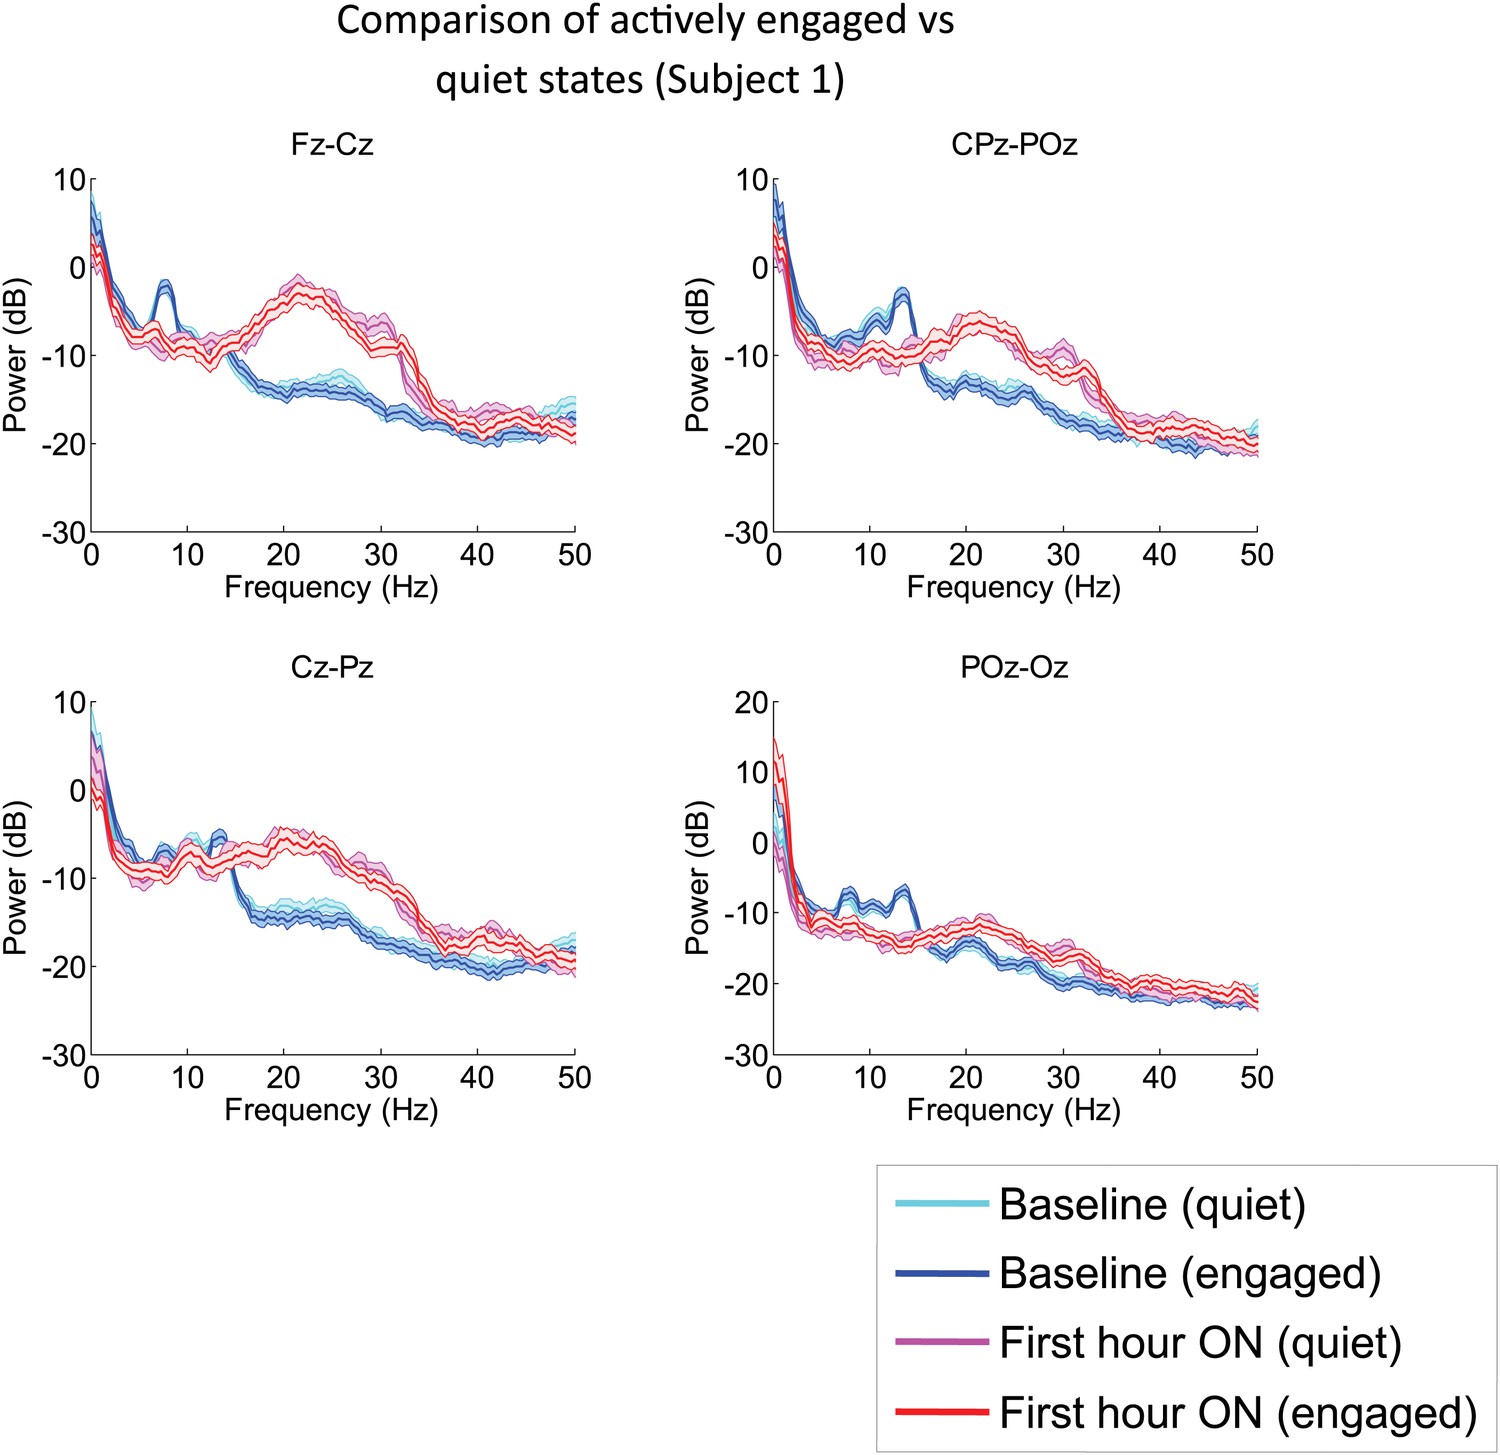
Analysis of EEG segments obtained during ON and OFF drug periods from Subject 1’s second zolpidem administration (cf. Figure 1; Table 1) subdivided according to periods of low and high levels of environmental stimulation, a distinction based on detailed review of the simultaneously recorded video.
‘Quiet’ segments were chosen from periods in which the subject appeared to be resting quietly with eyes open and there was no direct engagement of the subject (verbal engagement or physical manipulation). ‘Engaged’ segments were chosen from periods in which the patient was interactive with investigators at the bedside. EEG channels from the midline are analyzed, as these typically have less movement and muscle artifacts, and thus allow comparison during active engaged periods. The level of environmental interaction (quiet vs engaged) has no effect on either the background or the post-zolpidem spectra. In contrast, marked changes in spectral shape following zolpidem administration (first hour vs baseline) are seen for both quiet and engaged periods.
Figure 3 with 1 supplement
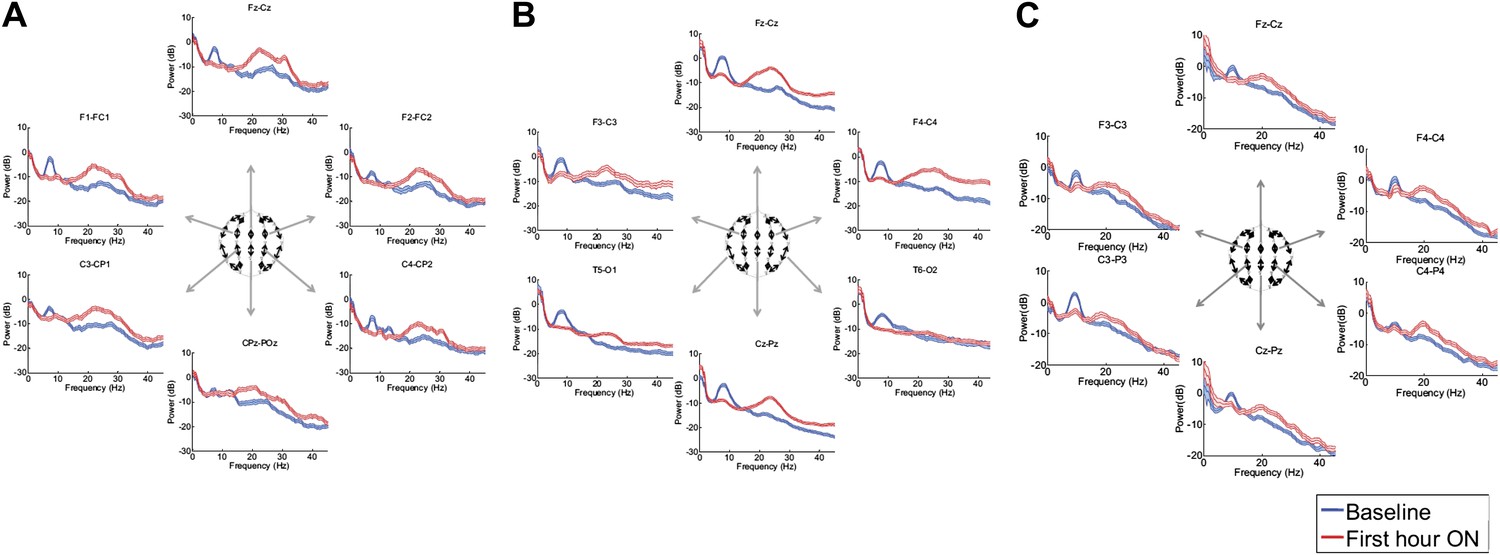
Power spectra (mean and 95% confidence intervals) estimated from selected EEG channel recordings across the head from all three subjects (A, B, and C).
Red: average spectral power in the hour prior to each zolpidem dose. Blue: 20–60 min after the zolpidem dose. Narrow, low frequency spectral peaks are apparent in the pre-drug state that are attenuated in the hour post-dose. Beta range peaks (∼20–30 Hz) are apparent in all post-drug spectra. Changes in ∼6–10 Hz peak between conditions are significant by two-group test (‘Methods’; Table 1).
Figure 3—figure supplement 1
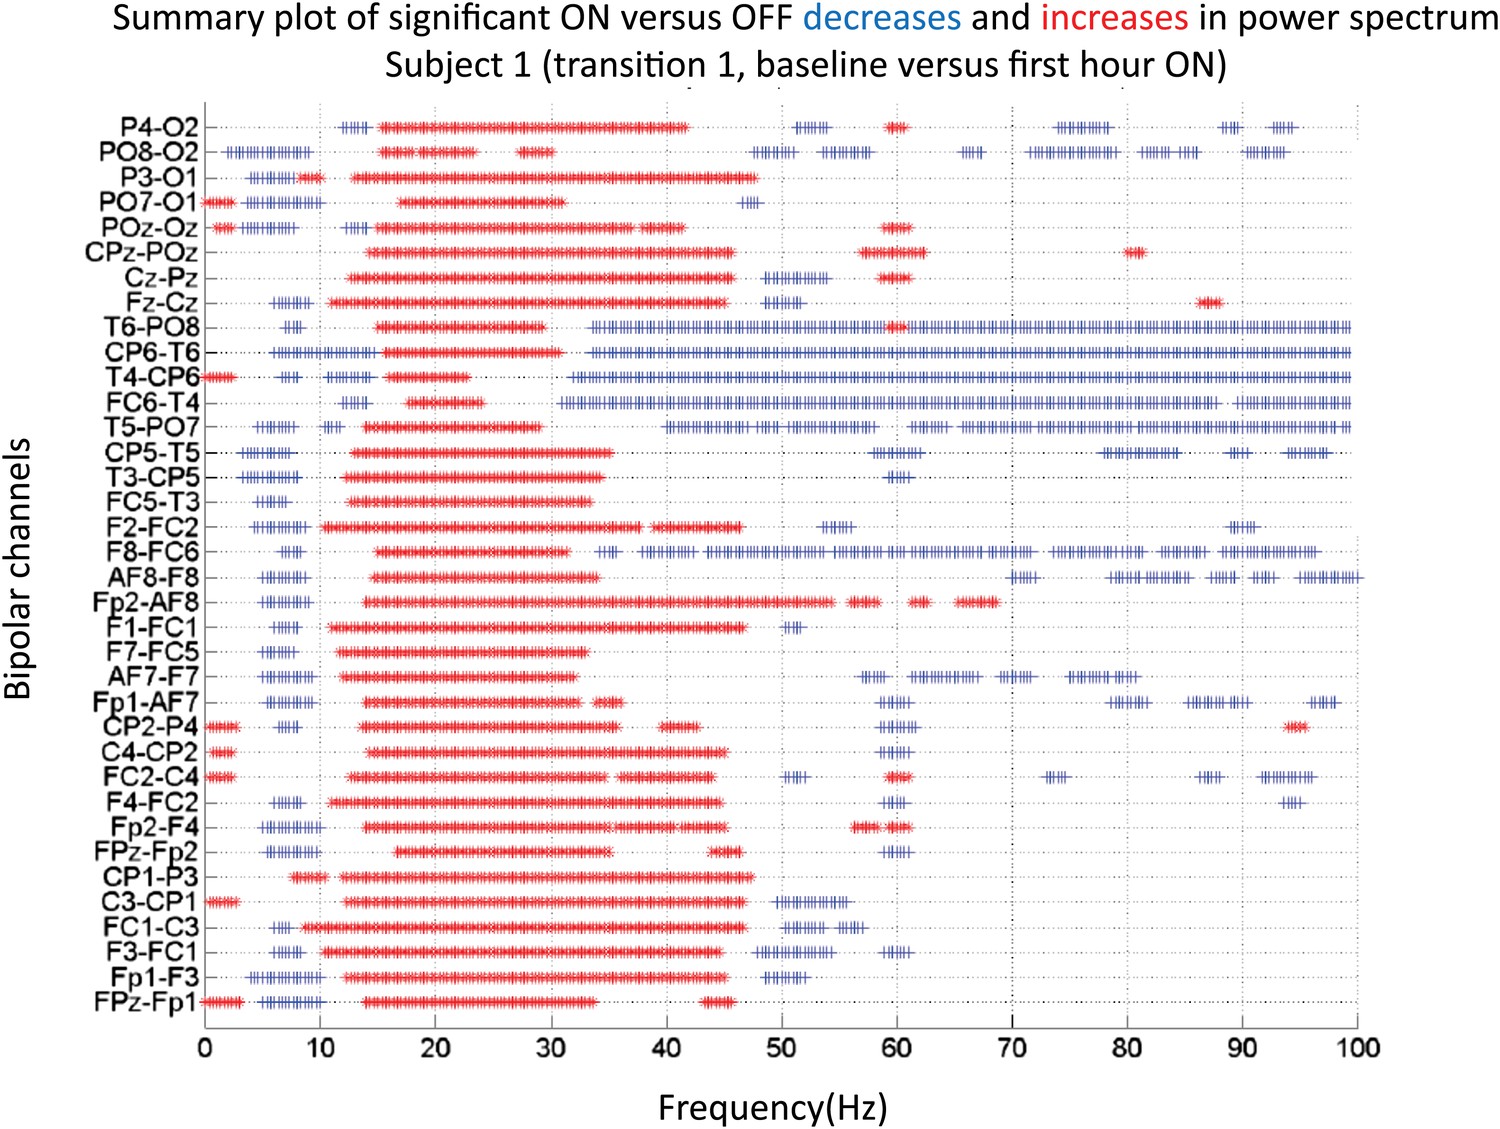
Significance testing of power across frequencies comparing the OFF and ON zolpidem states for Subject 1, transition 1 (baseline vs first hour) is summarized using two-group test (see ‘Methods’; Bokil et al., 2007 for further methods).
Significant increases in power with zolpidem administration compared to baseline are plotted as red asterisks, significant decreases are plotted as blue asterisks. Comparison of power at different frequencies in the OFF and ON zolpidem states shows that significant suppression of ∼6–10 Hz coherence is evident across a majority of channels with administration of zolpidem.
Figure 4
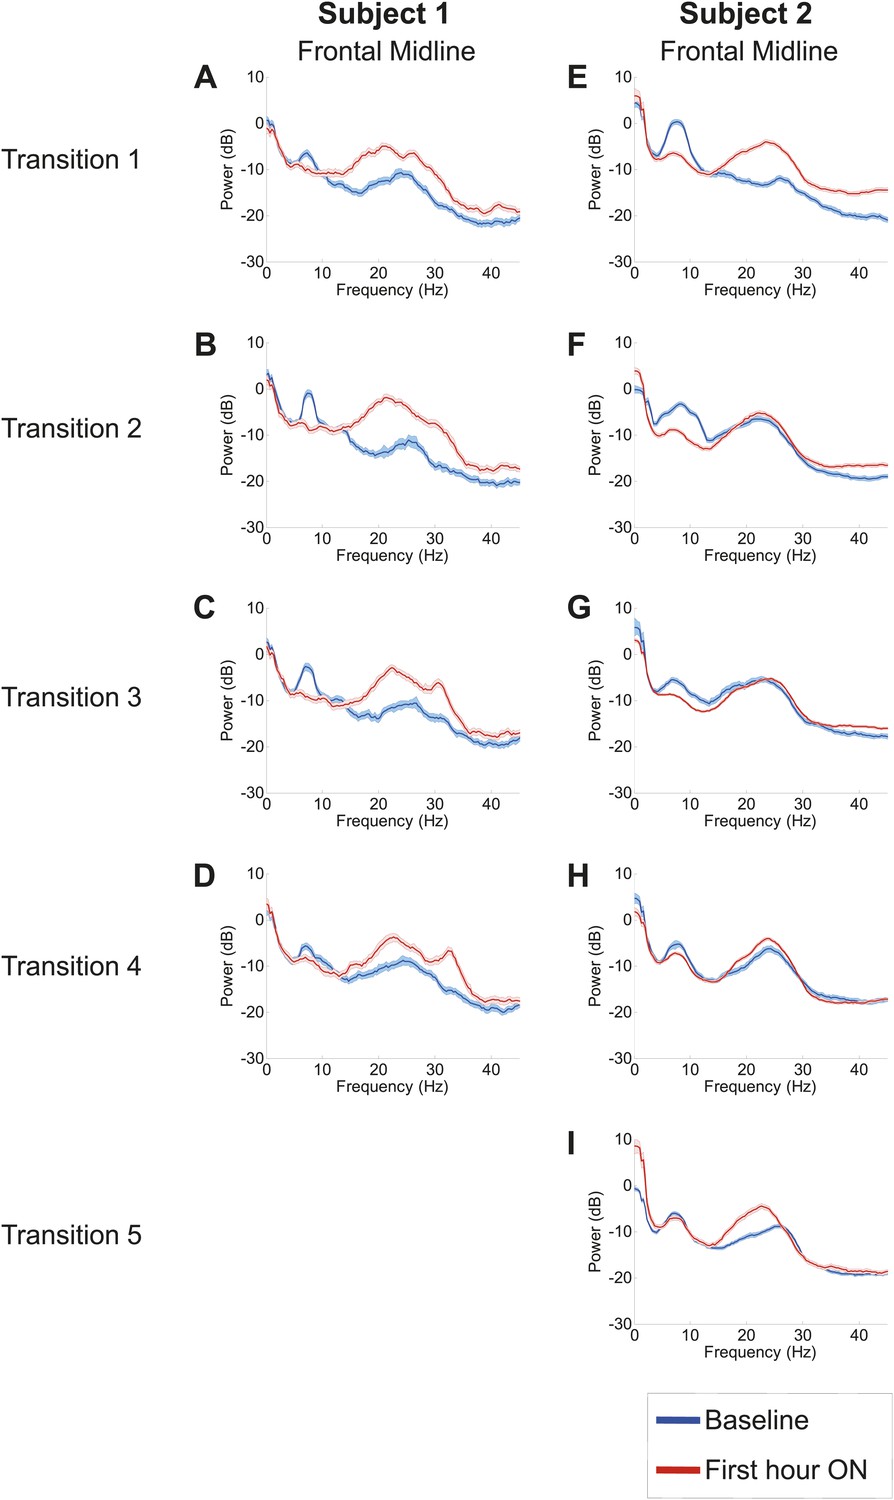
Power spectra from midline channels for subjects 1 and 2 across multiple transitions from a washout baseline to ON drug state.
Eyes open, awake epochs selected from one hour prior to 1 hr subsequent to each dose (Red) are shown and compared to 20–60 min after the zolpidem dose (Blue). Changes in ∼6–10 Hz peak between conditions are significant by two-group test (Tables 1 and 2).
Figure 5
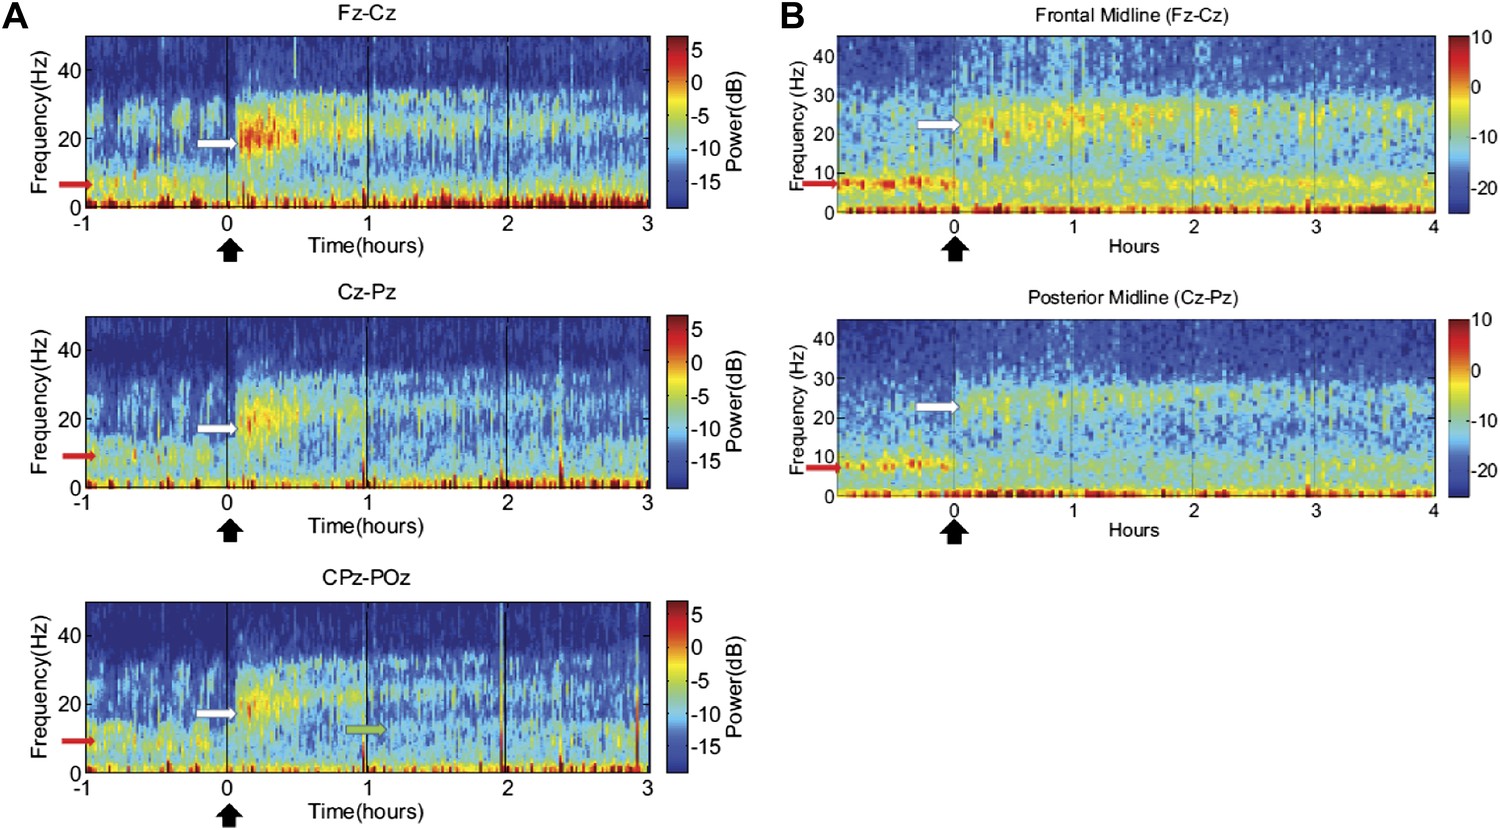
Time-frequency analysis of selected EEG channels from Subject 1 (A) and Subject 2 (B).
Frontal and posterior midline channels, for both subjects demonstrate a low frequency peak in power (red arrows) during the hour prior to zolpidem administration attenuates within the first 10–15 min after the drug is given. This corresponds to the time period when the subject begins to manifest improved behavioral function. Concomitant with the attenuation of the low frequency peak, there appears a broader ∼15–25 Hz peak during the 30 min after the drug is given (white arrows), which narrows and reduces attenuates slowly over the next 2–3 hr. In Subject 1 (A), a ∼10 Hz peak appears approximately 1 hr into the post-dose period in CPz-POz channel (green arrow).
Figure 6 with 1 supplement
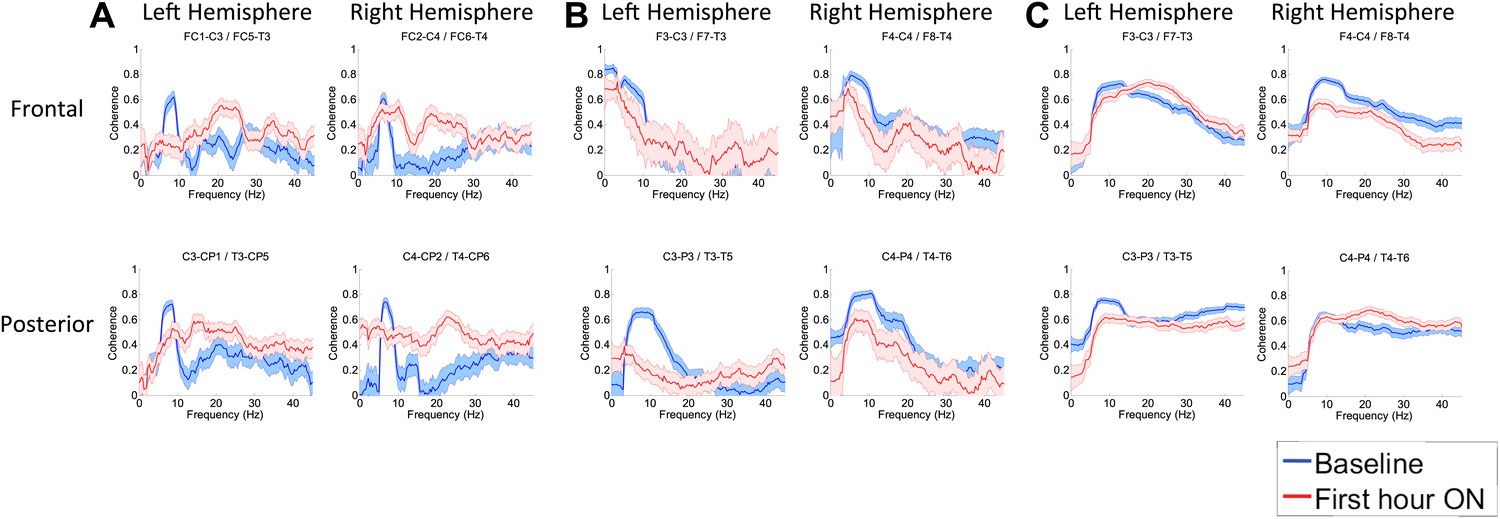
(A). Intra-hemispheric coherences (subject 1).
Pre-drug coherence peaks at 6–10 Hz. This peak is attenuated in the hour after the drug is given. Changes in ∼6–10 Hz peak between conditions are significant by two-group test (‘Methods’; Figure 6 Figure Supplement 1). (B) (subject 2). Intra-hemispheric coherences (subject 2). Pre-drug coherence peaks are evident at ∼ 6–10 Hz. This peak is attenuated in the hour after the drug is given. (C) (subject 3). Intra-hemispheric coherences (subject 3). Pre-drug coherence peaks at ∼ 6–10 Hz. This peak is attenuated in the hour after the drug is given.
Figure 6—figure supplement 1
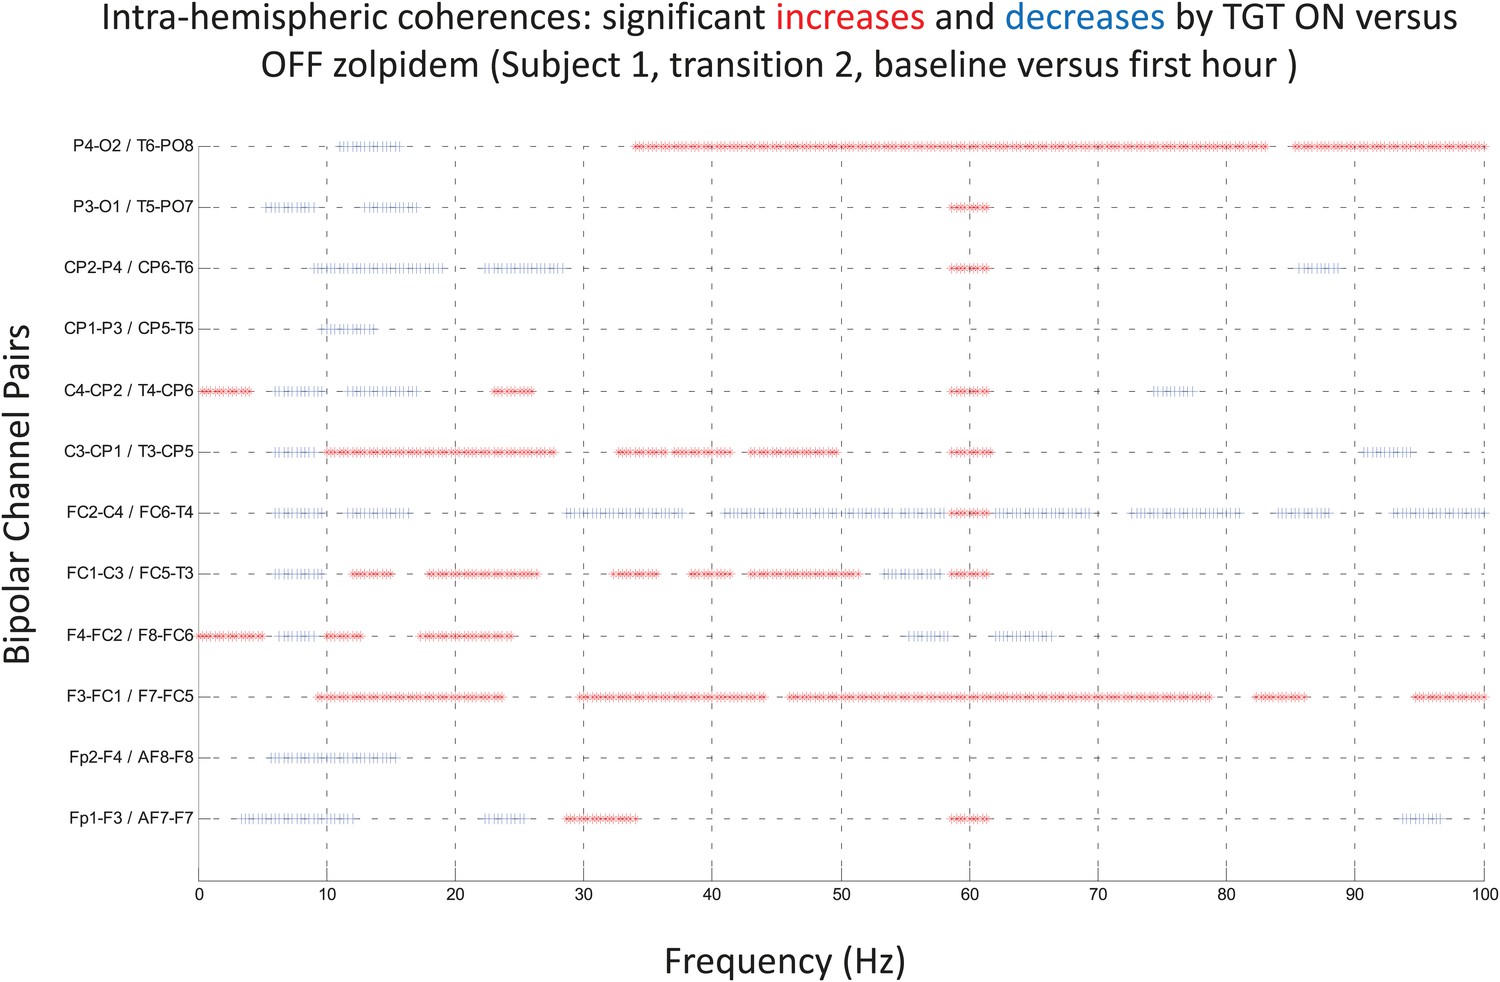
Significance testing of intra-hemispheric coherences for Subject 1, transition 2 (baseline vs first hour) is summarized using two-group test (see ‘Methods’; Bokil et al., 2007 for further methods).
Significant increases in coherence with zolpidem administration compared to baseline are plotted as red asterisks, significant decreases are plotted as blue asterisks. Comparison of coherence in the OFF and ON zolpidem states shows that significant suppression of ∼6–10 Hz coherence is evident across a majority of intra-hemispheric channel pairs with administration of zolpidem.
Figure 7 with 1 supplement
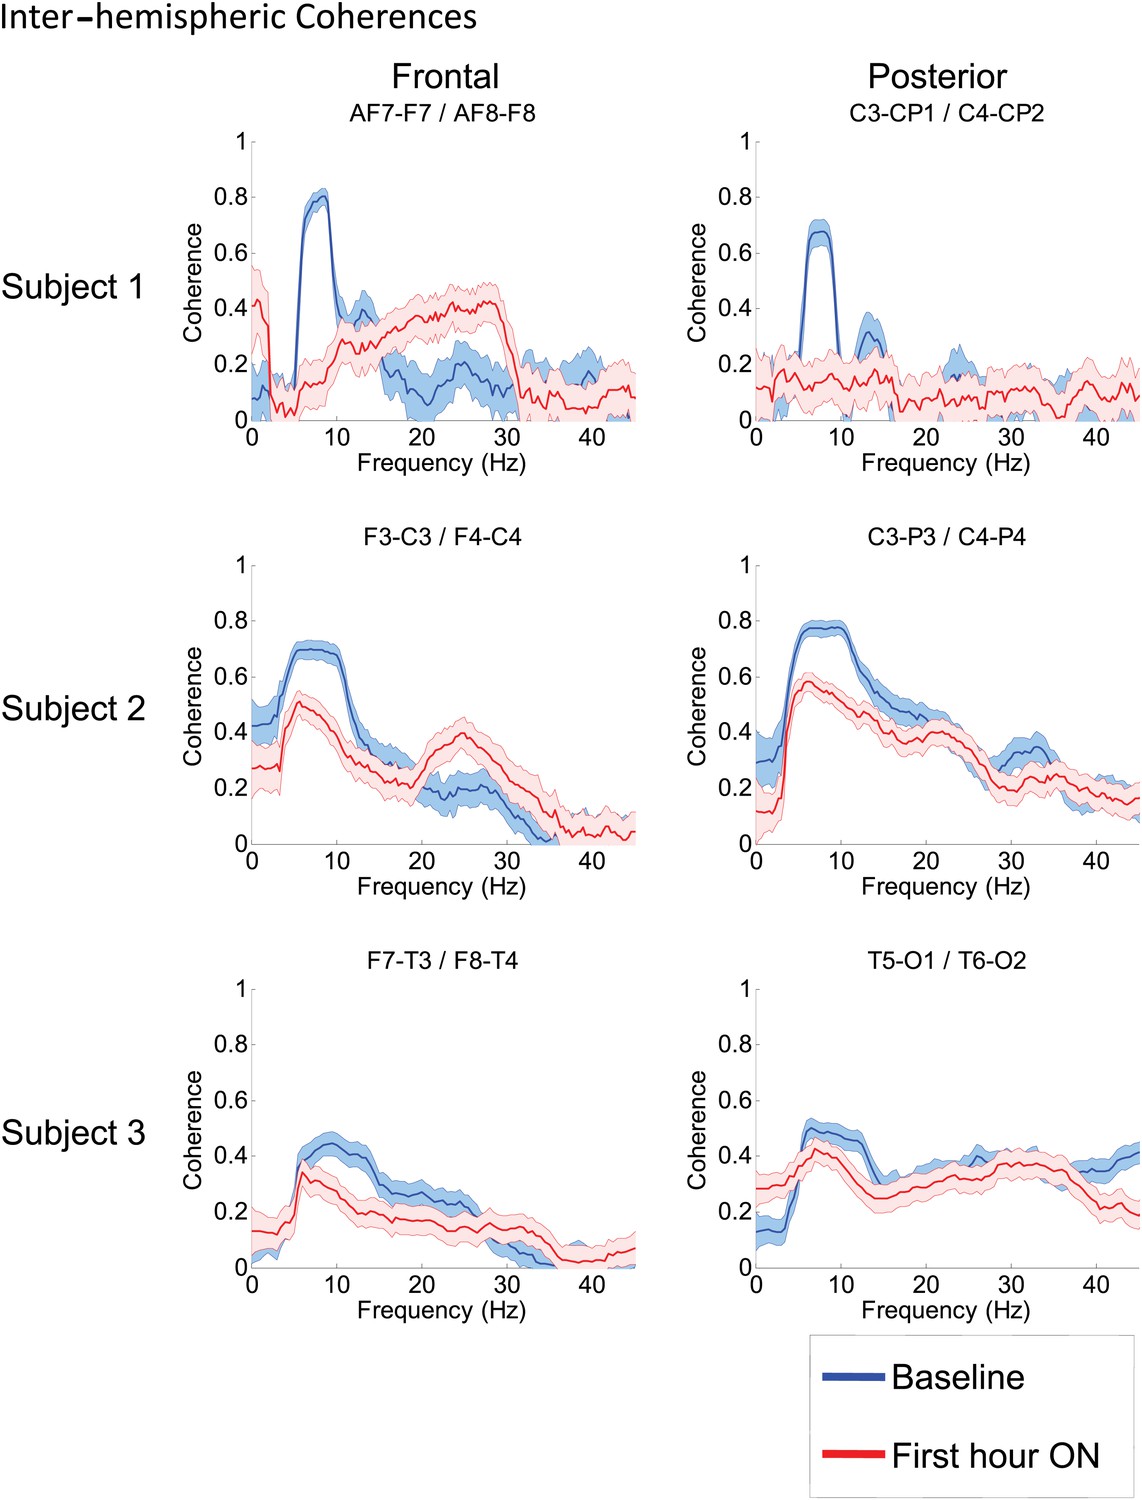
Inter-hemispheric coherences all three subjects.
Pre-drug coherence peaks at 6–10 Hz are seen in frontal and posterior channels comparisons for all subjects. This peak is attenuated in the hour after the drug is given. Changes in ∼6–10 Hz peak between conditions are significant by two-group test (see ‘Methods’; Figure 7—figure supplement 1, for Subject 1 coherences for example of coherence changes across all channel pairs in single dose).
Figure 7—figure supplement 1
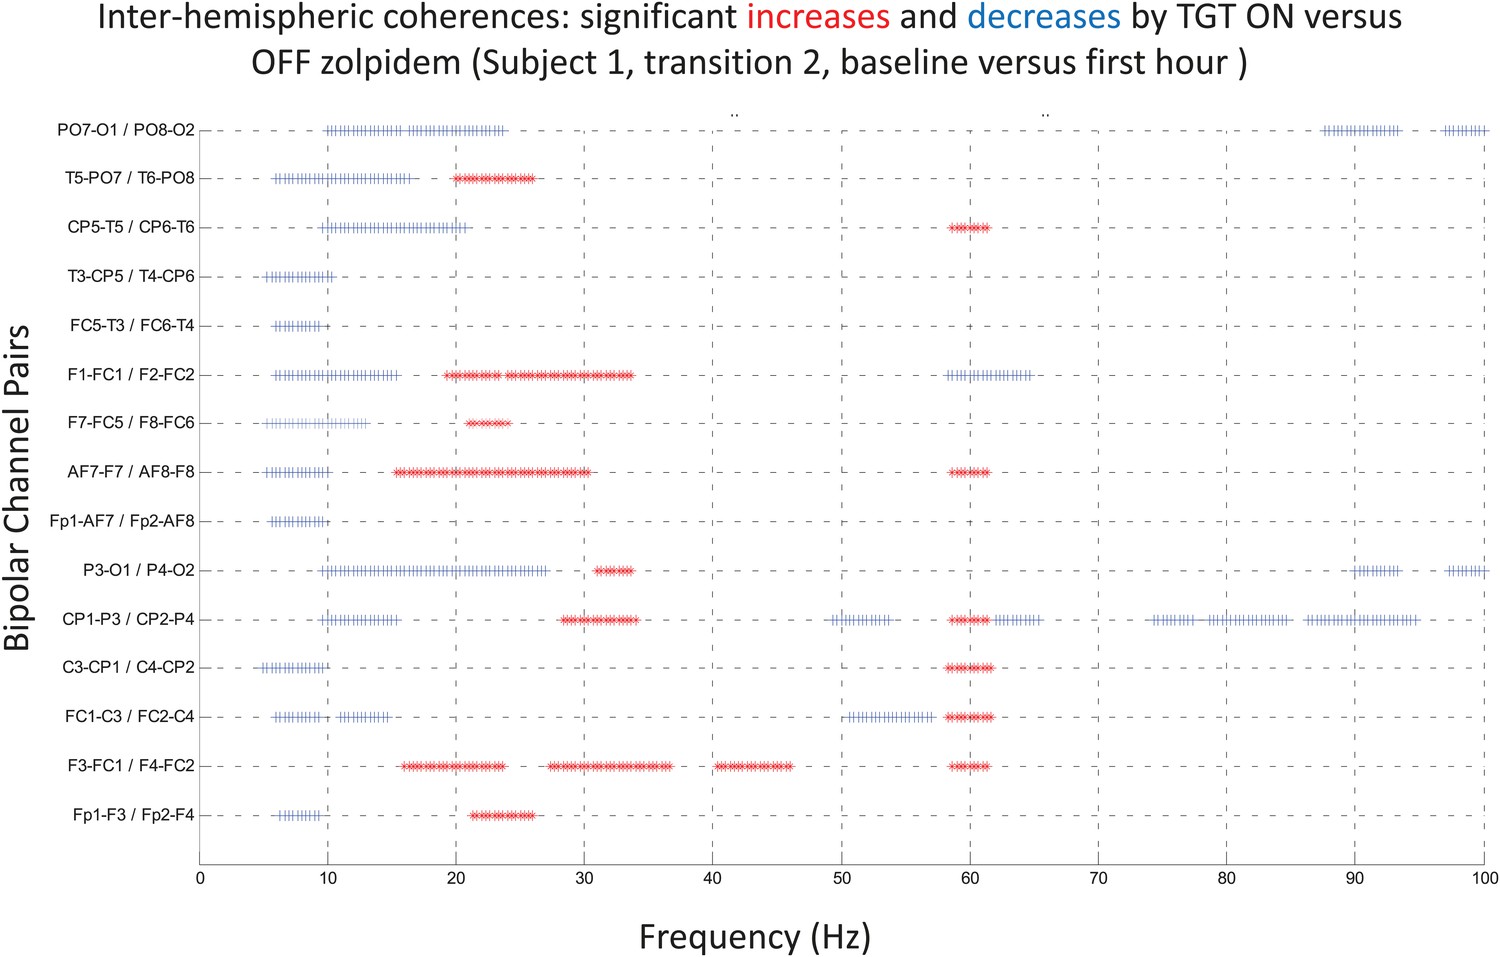
Significance testing of inter-hemispheric coherences for Subject 1, transition 2 (baseline vs first hour) is summarized using two-group test (see ‘Methods’; Bokil et al., 2007 for further methods).
Significant increases in coherence with zolpidem administration compared to baseline are plotted as red asterisks, significant decreases are plotted as blue asterisks. Comparison of coherence in the OFF and ON zolpidem states shows that significant suppression of ∼6–10 Hz coherence is evident across a majority of inter-hemispheric channel pairs with administration of zolpidem.
Figure 8

FDG-PET measured cerebral metabolism OFF and ON zolpidem for Subject 2.
A marked increase in global cerebral metabolic rate is seen with zolpidem administration, average increase is 1.97 times OFF baseline across cerebral structures (see ‘Methods’ and Table 3 for regional differences in metabolic rates for selected areas).
Videos
Video 1
Demonstration of CRS-R Motor subscale Subject 1 during off zolpidem state.
Prior to zolpidem administration subject is tested with two common objects (comb and spoon) and asked to demonstrate their use. While able to hold each object he is unable to demonstrate their use. This level of behavior corresponds to a 5 on the CRS-R Motor subscale. Note resting tremor of right hand.
Video 2
Demonstration of CRS-R Motor subscale Subject 1 following zolpidem administration.
Short legend: Following zolpidem administration subject is again tested with two common objects (comb and spoon) and asked to demonstrate their use. He is now able to demonstrate the use of each object. This level of behavior corresponds to a 6 on the CRS-R Motor subscale. Note that subject’s posture has changed and that the right hand is used.
Tables
Table 1
Relationship of low frequency peak in OFF zolpidem baseline and time interval between doses
https://doi.org/10.7554/eLife.01157.008| SUBJECT 1 center frequency for low frequency peak in hour prior to dose across channels and transitions | |||||||||
|---|---|---|---|---|---|---|---|---|---|
| Baseline 1 | Significant | Baseline 2 | Significant | Baseline 3 | Significant | Baseline 4 | Significant | ||
| (62 hr off drug) | On vs off | (17 hr off drug) | On vs off | (9 hr off drug) | On vs off | (5 hr off drug) | On vs off | ||
| Channel | Pairs | 9:30AM, 1st | suppression | 12:00PM, 1st | suppression | 6:30PM, 2nd | suppression | 5:00PM, 2nd | suppression |
| Fpz | Fp1 | 7.7 | * | 7.3 | * | 7.7 | * | – | – |
| Fpz | Fp2 | 7 | * | 7.3 | * | 7.3 | * | – | – |
| Fp1 | F3 | 7.7 | * | 7.3 | * | 7.3 | * | 7 | * |
| Fp2 | F4 | 7.3 | * | 7.3 | * | 7.3 | * | 6.3 | * |
| F1 | FC1 | 7.3 | * | 7.7 | * | 7.3 | * | 7 | * |
| FC1 | C3 | 7.3 | * | 7.7 | * | 7 | * | 7 | * |
| FC2 | C4 | – | – | 7.3 | * | 7 | * | – | – |
| F3 | FC1 | 6.7 | * | 7.3 | * | 6.7 | * | 7.3 | * |
| F4 | FC2 | 7.3 | * | 7.7 | * | 7 | * | 7.7 | * |
| F2 | FC2 | 7.3 | n.s. | 7.7 | * | 7 | * | 7 | n.s. |
| Fp1 | AF7 | 6.3 | * | 7.7 | * | 7.3 | * | 7 | * |
| Fp2 | AF8 | 7.3 | * | 7.3 | * | 7.3 | * | – | – |
| AF7 | F7 | 6.7 | * | 7.3 | * | 7.3 | * | 6.3 | * |
| AF8 | F8 | 7 | * | 7.3 | * | 7.3 | * | – | – |
| F7 | FC5 | 6.7 | * | 7.3 | * | 7.3 | * | 6.3 | * |
| F8 | FC6 | 7.7 | * | 7.3 | * | 7.3 | * | 8.3 | n.s. |
| FC5 | T3 | 6 | * | 7.3 | * | 7.3 | * | 7.3 | * |
| FC6 | T4 | 7.3 | n.s. | 7.3 | * | – | – | – | – |
| T3 | CP5 | – | – | 7.3 | * | 7.3 | * | 9.7 | * |
| T4 | CP6 | 7.7 | * | 7.3 | * | 7.7 | n.s. | 9.3 | * |
| C3 | CP1 | – | – | 7.7 | * | 7 | * | 7 | * |
| C4 | CP2 | – | – | 7.7 | * | 7.3 | * | 7 | * |
| Fz | Cz | 7.3 | * | 7.7 | * | 7 | * | 7 | * |
| Anterior Channels | |||||||||
| Average Center Freq | 7.1 | 7.4 | 7.2 | 7.3 | |||||
| Standard Deviation | 0.5 | 0.2 | 0.2 | 1.0 | |||||
| T5 | PO7 | – | – | 7.3 | * | 7.3 | * | 6.7 | n.s. |
| T6 | PO8 | 7.7 | * | 7.3 | * | 7.7 | * | 11 | * |
| CP1 | P3 | 7.7 | * | 7.7 | * | 6.7 | * | 6.7 | * |
| CP6 | T6 | 7.7 | * | 8.3 | * | – | – | 8 | n.s. |
| CP2 | P4 | 7.3 | n.s. | 8 | * | – | – | 9 | n.s. |
| CP5 | T5 | – | – | 7.7 | * | 7.3 | * | 9.7 | * |
| P3 | O1 | 7.3 | * | 7.7 | * | 7.3 | * | 9 | * |
| P4 | O2 | – | – | 8 | * | – | - | – | – |
| PO7 | O1 | 7.3 | * | 7.3 | * | 7.7 | * | 9 | * |
| PO8 | O2 | 7.7 | * | 7.7 | * | 7.3 | * | - | – |
| Cz | Pz | – | – | 7.7 | * | 7 | * | 7 | * |
| CPz | POz | 7.3 | n.s. | – | – | 6.7 | * | 6.7 | * |
| POz | Oz | 7.7 | * | 7.3 | * | 7.3 | * | – | – |
| Posterior Channels | |||||||||
| Average Center Freq | 7.5 | 7.7 | 7.2 | 8.3 | |||||
| Standard Deviation | 0.2 | 0.3 | 0.3 | 1.5 | |||||
| Average across all | |||||||||
| Average Center Freq | 7.3 | 7.5 | 7.2 | 7.7 | |||||
| Standard Deviation | 0.4 | 0.3 | 0.3 | 1.2 | |||||
-
Table 1 shows average center frequency of low frequency peak at∼6–10 Hz, if present, across all channels for Subjects 1 in relation to time off zolpidem prior to 1 hr baseline EEG measurements and clock time of each dose. In both patients, shorter zolpidem dosing intervals are associated with higher center frequencies across posterior but not anterior EEG channels. Similarly, an increased standard deviation of the measurement is observed as interval between doses is shorter for the posterior EEG channel measurements. Of note, for both subjects, anterior EEG channel pre-zolpidem dose baselines revealed a consistent∼7.4 Hz average center frequency with a small standard deviation. The consistency of these findings despite the wide difference in their underlying etiologies of injury support the proposed common cellular and circuit mechanism; the correspondence of the∼7.4 Hz peak and intrinsic oscillation frequency of neocortical Layer V cells (Silva et al., 1991) also support this model.
Table 2
Relationship of low frequency peak in OFF zolpidem baseline and time interval between doses
https://doi.org/10.7554/eLife.01157.009| SUBJECT 2 center frequency for low frequency peak in hour prior to dose across channels and transitions | |||||||||||
|---|---|---|---|---|---|---|---|---|---|---|---|
| Baseline 1 | Significant | Baseline 2 | Significant | Baseline 3 | Significant | Baseline 4 | Significant | Baseline 5 | Significant | ||
| (20 hr off drug) | On vs off | (16 hr off drug) | On vs off | (6 hr off drug) | On vs off | (5 hr off drug) | On vs off | (4 hr off drug) | On vs off | ||
| Channel | Pairs | 4:30PM, 1st | suppression | 8:30AM, 1st | suppression | 4:30PM, 2nd | suppression | 5:00PM, 3rd | suppression | 12:15PM, 2nd | suppression |
| Fp1 | F3 | 7 | * | – | n.s. | 7.3 | * | 7.7 | n.s. | 8 | n.s. |
| Fp2 | F4 | 7 | * | 8.5 | * | 7.3 | * | 7 | * | 7.7 | n.s. |
| F3 | C3 | 7.7 | * | 8.5 | * | 7.7 | * | 7.7 | * | 7.7 | * |
| F4 | C4 | 7.7 | * | 8 | * | 7.7 | * | 7.7 | * | 7.3 | * |
| F7 | T3 | 7.7 | n.s | – | * | 7.7 | n.s | 7.7 | n.s. | 6 | n.s. |
| F8 | T4 | (No data) | 8 | n.s. | 7.3 | * | 7 | n.s. | 7.3 | n.s. | |
| Fp1 | F7 | 7 | n.s | – | * | 7.7 | * | 7.7 | n.s. | 7 | n.s. |
| Fp2 | F8 | 7.7 | * | – | n.s. | 7 | * | 6.7 | n.s. | 7.3 | n.s. |
| Fz | Cz | 7.7 | * | 8.5 | * | 7 | * | 7.7 | * | 7 | n.s. |
| Anterior Channels | |||||||||||
| Average Center Freq | 7.4 | 8.3 | 7.4 | 7.4 | 7.3 | ||||||
| Standard Deviation | 0.4 | 0.3 | 0.3 | 0.4 | 0.6 | ||||||
| C3 | P3 | 8.3 | * | 8.5 | * | 7.7 | * | 8.3 | * | 8.7 | n.s. |
| C4 | P4 | 8 | * | 9 | * | 9.3 | * | 8.3 | * | 7.7 | n.s. |
| P3 | O1 | 7.7 | * | 9 | * | 11.3 | * | 8.7 | * | 8 | n.s. |
| P4 | O2 | 8.3 | * | 9 | * | 10 | * | 8.7 | * | 8.3 | n.s. |
| T3 | T5 | 7 | * | 8.5 | * | 7.7 | * | 11.7 | n.s. | 11.7 | n.s. |
| T4 | T6 | (No data) | 9 | * | 9.3 | n.s | 10 | * | 10 | n.s. | |
| T5 | O1 | 8 | * | 9 | * | 10 | * | 8.3 | * | 11.3 | n.s. |
| T6 | O2 | 8 | * | 9.5 | * | 10 | * | 9.7 | * | 11 | n.s. |
| Cz | Pz | 8.3 | * | 8.5 | * | 9 | * | 8.7 | * | 7.7 | n.s. |
| Posterior Channels | |||||||||||
| Average Center Freq | 8.0 | 8.9 | 9.4 | 9.2 | 9.4 | ||||||
| Standard Deviation | 0.4 | 0.3 | 1.2 | 1.1 | 1.6 | ||||||
| Average Center Freq | 7.7 | 8.7 | 8.4 | 8.3 | 8.3 | ||||||
| Standard Deviation | 0.5 | 0.4 | 1.3 | 1.2 | 1.6 | ||||||
-
Table 2 shows average center frequency of low frequency peak at∼6–10 Hz, if present, across all channels for Subjects 2 in relation to time off zolpidem prior to 1 hr baseline EEG measurements and clock time of each dose. In both patients, shorter zolpidem dosing intervals are associated with higher center frequencies across posterior but not anterior EEG channels. Similarly, an increased standard deviation of the measurement is observed as interval between doses is shorten for the posterior EEG channel measurements. Of note, for both subjects, anterior EEG channel pre-zolpidem dose baselines revealed a consistent∼7.4 Hz average center frequency with a small standard deviation. The consistency of these findings despite the wide difference in their underlying etiologies of injury support the proposed common cellular and circuit mechanism; the correspondence of the∼7.4 Hz peak and intrinsic oscillation frequency of neocortical Layer V cells (Silva et al., 1991) also support this model. Of note as an outlier is the second baseline for this subject which is the only measurement early in the morning (8:30) suggesting a possible interaction with diurnal activity of the brain arousal system, however, insufficient data is available to establish this linkage.
Table 3
Percent change in regional standardized uptake values with administration of zolpidem
| Region | Left(%) | Right(%) |
|---|---|---|
| Mesial frontal | 139 | 146 |
| Lateral frontal | 166 | 183 |
| Calcarine | 145 | 153 |
| Striatum | 156 | 156 |
| Thalamus | 148 | 127 |
Download links
A two-part list of links to download the article, or parts of the article, in various formats.
Downloads (link to download the article as PDF)
Open citations (links to open the citations from this article in various online reference manager services)
Cite this article (links to download the citations from this article in formats compatible with various reference manager tools)
Common resting brain dynamics indicate a possible mechanism underlying zolpidem response in severe brain injury
eLife 2:e01157.
https://doi.org/10.7554/eLife.01157


