Fitness benefits in fluoroquinolone-resistant Salmonella Typhi in the absence of antimicrobial pressure
- Wellcome Trust Major Overseas Programme, Vietnam
- University of Oxford, United Kingdom
- The London School of Hygeine and Tropical Medicine, United Kingdom
- The Wellcome Trust Sanger Institute, United Kingdom
Figures
Figure 1
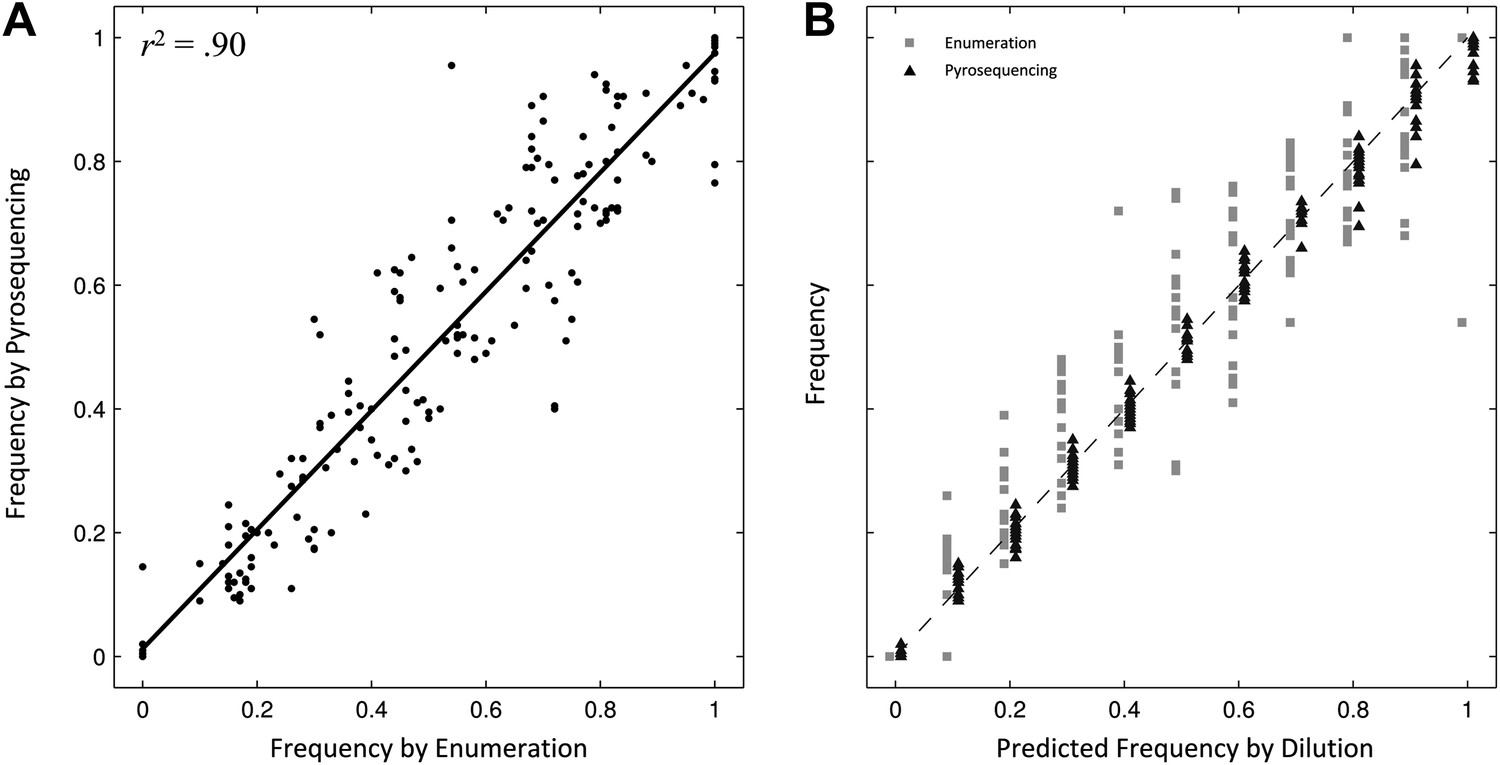
Comparing two methods for calculation of allele frequencies.
(A) Pyrosequencing-measured allele frequencies (y-axis) of a range of S83F/parent strain dilutions plotted against enumeration-measured frequencies (x-axis) (n = 198). A linear regression between the two variables (solid black line) explains 90% of the variation in the relationship between these two measurements. (B) The same 198 data points (y-axis) are shown plotted against the original bacterial dilution ratio (x-axis). The broken line is the diagonal highlighting where predicted frequency and measured frequency would be identical. 18 measurement replicates were performed for each predicted frequency of S83F from 0.0 to 1.0.
Figure 2
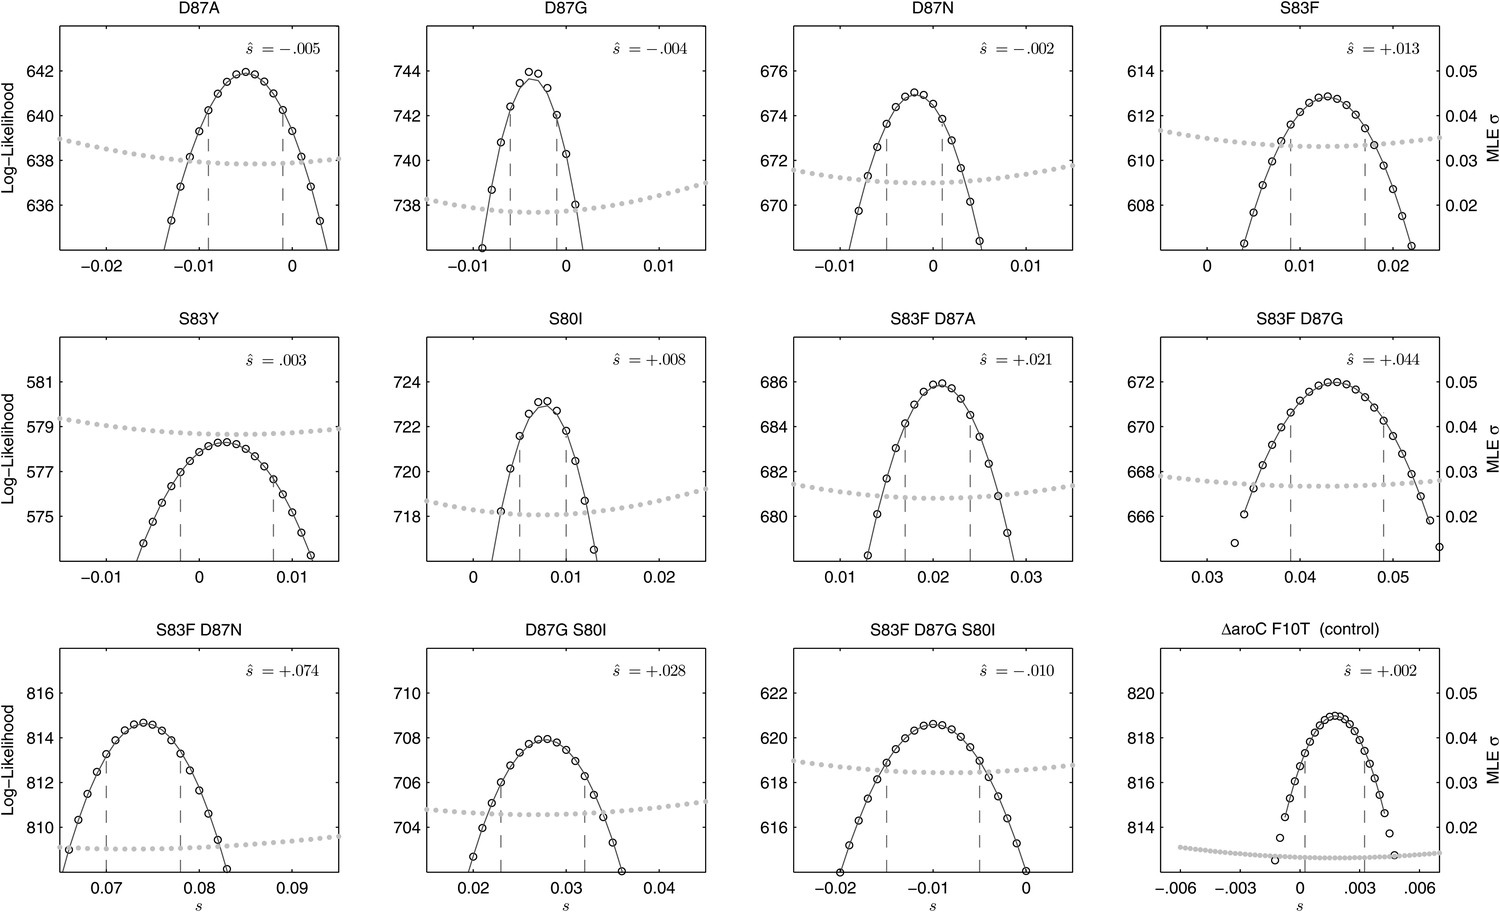
Likelihood profiles for the selection coefficients from 12 competition experiments.
Data generated by competing 12 S. Typhi mutants (labeled at the top of each panel) against the parent S. Typhi strain over approximately 150 generations. Open circles correspond to likelihood values over the entirety of the experiment (primary y-axis); the filled gray circles correspond to the maximum likelihood estimates (MLE) for the variance parameter σ (secondary y-axis), describing the 24-hourly variance in both process and measurement. The MLE selection coefficient () is shown in the top right of each panel. Vertical dashed lines demark the 95% confidence intervals for the MLE Note the compressed x-axis scale in the bottom-right panel.
Figure 3
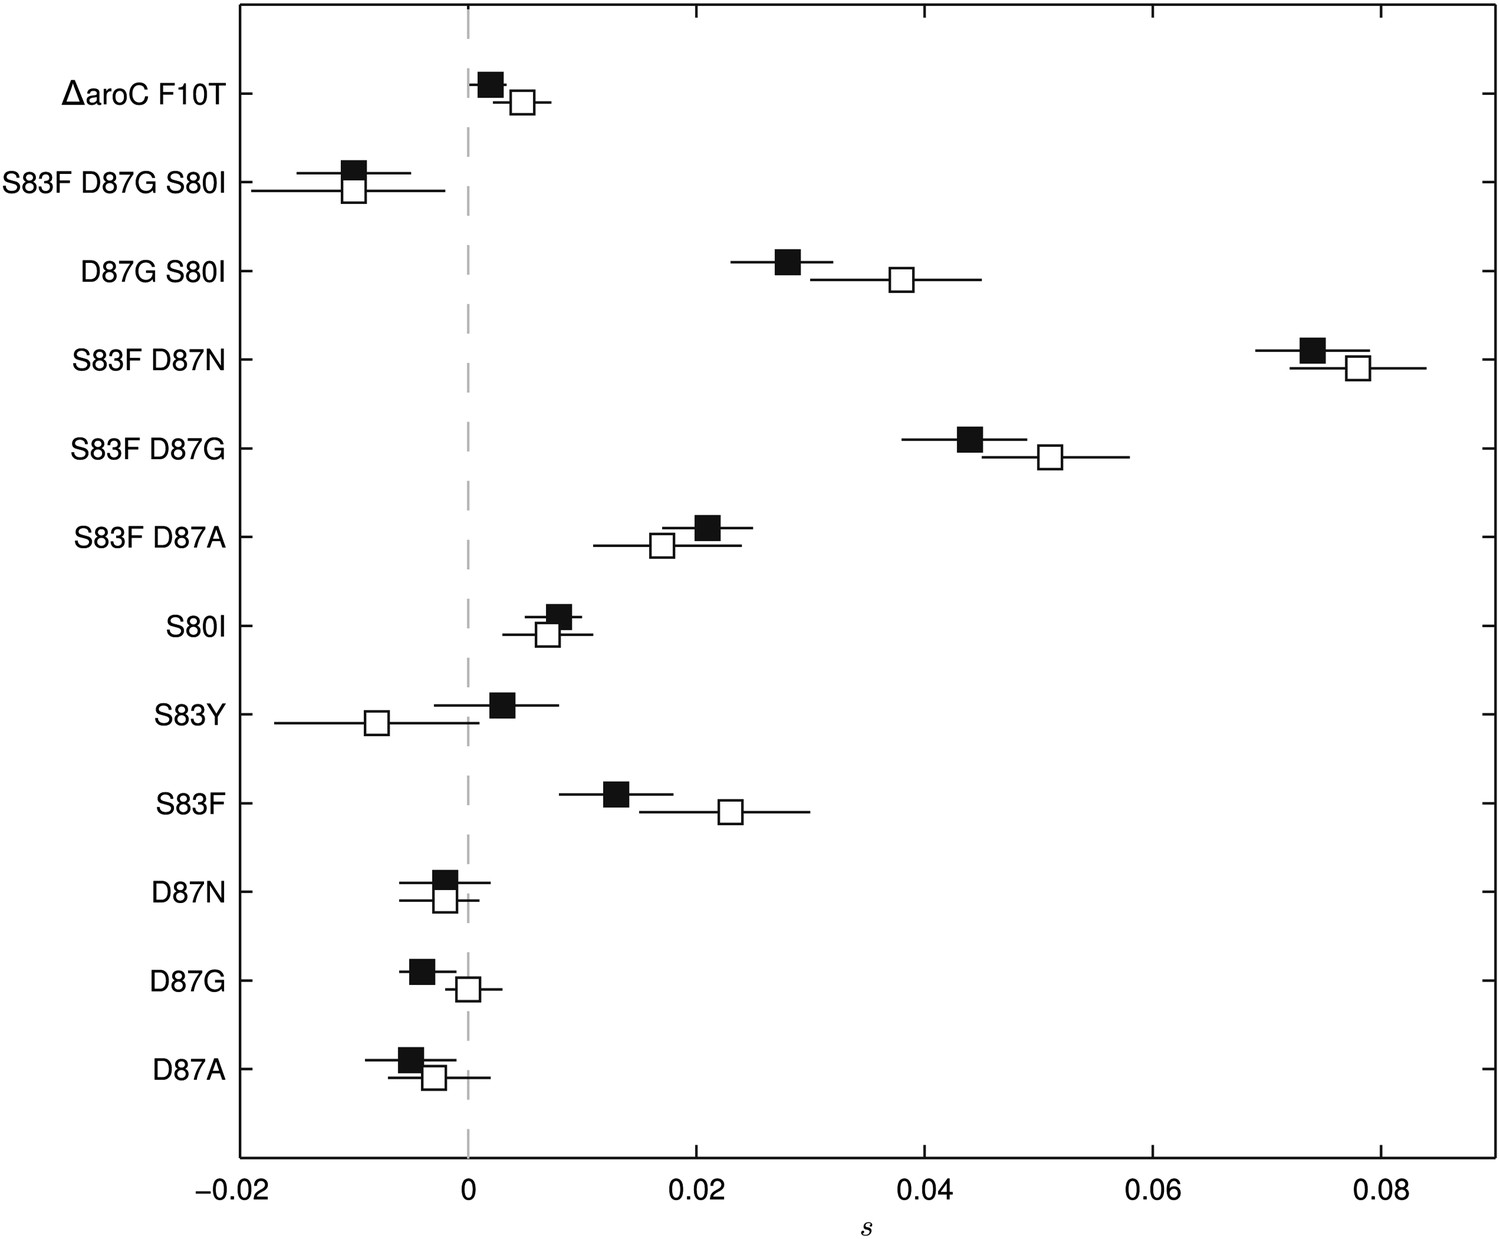
Fitness coefficients computed from 5 and 15 days of bacterial competition.
Black boxes show fitness coefficients computed across the entire 15-day competition. White boxes show fitness coefficients computed from the first 5 days only. The ΔaroC F10T mutation is that of the control strain. Horizontal lines are 95% confidence intervals. In a situation of compensatory evolution, we would expect to see the white box to the left of the black box.
Figure 4
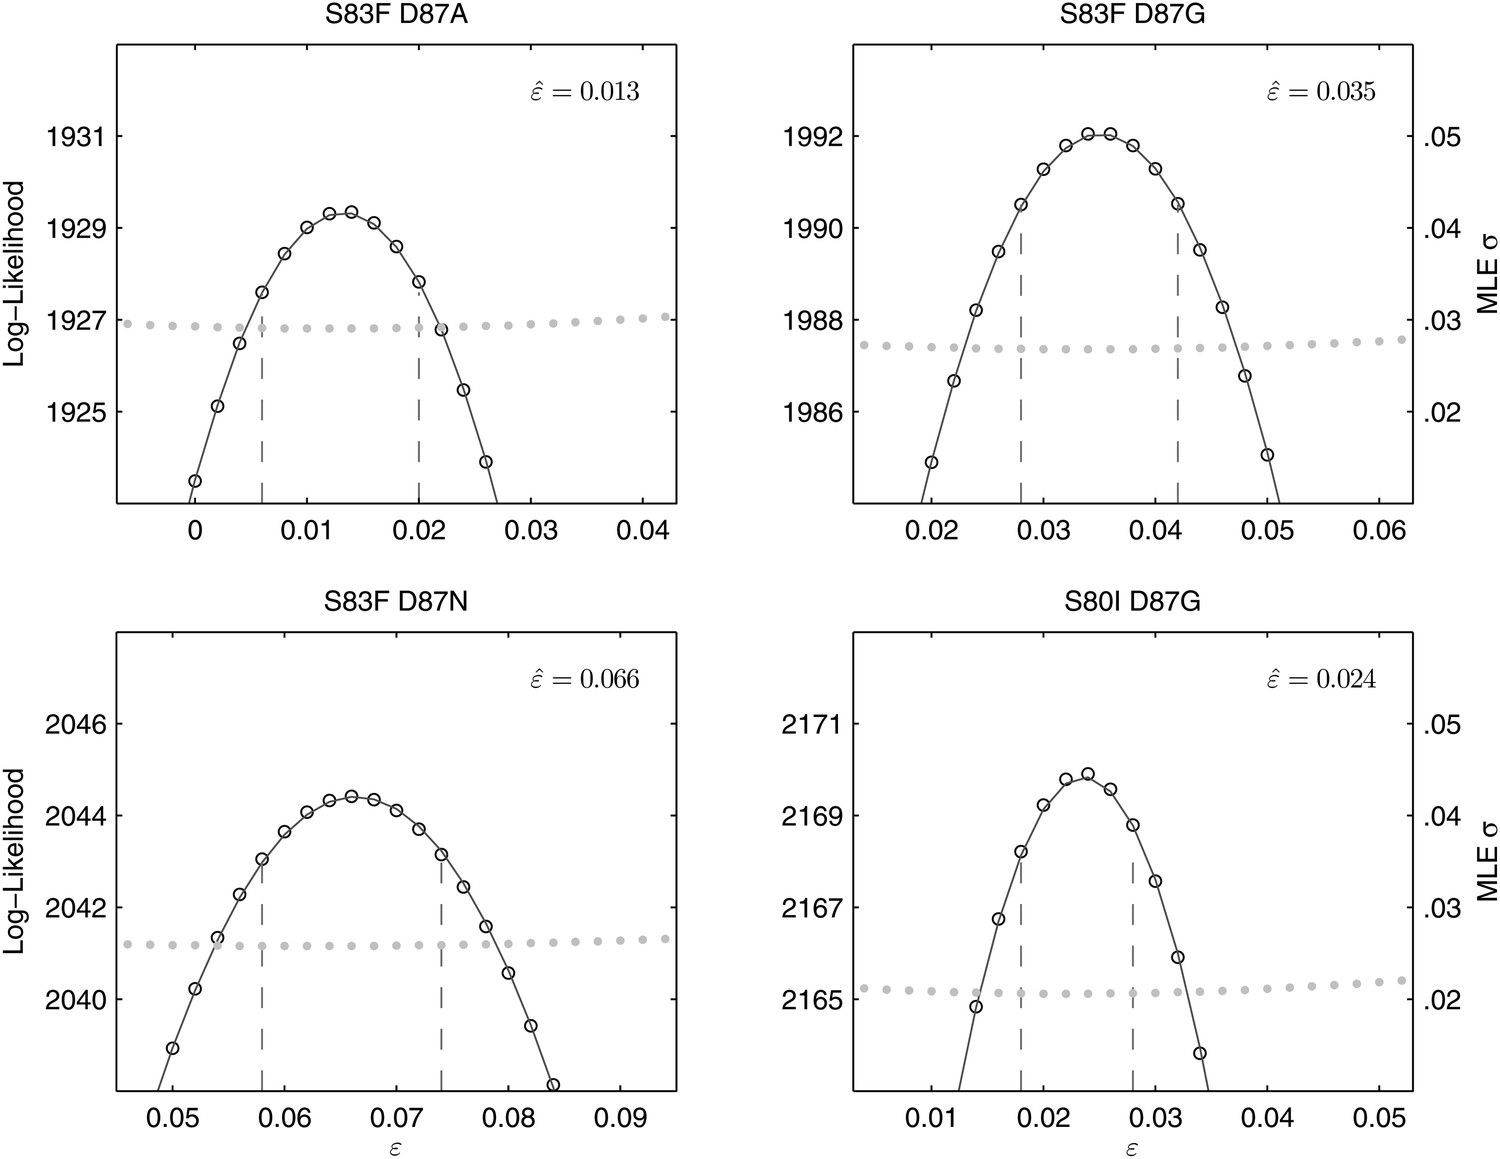
Likelihood profiles for the epistasis coefficient () from the four double mutant competition experiments.
Open circles correspond to likelihood values; the filled gray circles correspond to the maximum likelihood estimate (MLE) for the variance parameter σ, describing the 24-hourly variance in both process and measurement. The MLE epistasis coefficient is shown in the top right of each panel. Vertical dashed lines demark the 95% confidence intervals for the MLE .
Figure 5

Relationships among MICs, selection coefficients and epistasis parameters of S. Typhi mutants.
Diagram depicts the interactions among MLE selection coefficients () (x-axis), MICs to ciprofloxacin (y-axis), and MLE epistasis coefficients . Black circles denote S. Typhi strains that have been isolated clinically, while gray circles denote S. Typhi strains that have not been isolated clinically. Lines correspond to epistatic interactions of the four double mutants, two of which have been isolated clinically (black lines and value) and two of which have not (gray lines and value). The grayed upper half of graph highlights the current MIC breakpoint indicative of resistance and increasing risk of treatment failure (>0.125 μg/ml).
Figure 6

Likelihood profiles for the epistasis coefficient () of three possible epistatic interactions that could have generated the triple-mutant S83F-D87G-S80I.
The interaction types are described on the top of each panel. The left panel shows the epistatic interaction among three single mutations. The middle and right panels show the epistatic interaction between a single mutation and a double mutation (joined by a hyphen). Open circles correspond to likelihood values; the filled gray circles correspond to the maximum likelihood estimate (MLE) for the variance parameter σ, describing the 24-hourly variance in both process and measurement. The MLE epistasis coefficient is shown in the top right of each panel. Vertical dashed lines demark the 95% confidence intervals for the MLE .
Tables
Table 1
S. Typhi mutants constructed for this study
| S. Typhi strain | Genotype | Minimum inhibitory concentrations (μg/ml) | |||||
|---|---|---|---|---|---|---|---|
| Nalidixic acid | Norfloxacin | Ofloxacin | Ciprofloxacin | Gatifloxacin | Levofloxacin | ||
| Parent BRD948 | ΔaroA, ΔaroC, ΔhtrA | 1.5 | 0.064 | 0.047 | 0.008 | 0.008 | 0.012 |
| DPT001 | SNP in ΔaroC (codon 10) | 1.5 | 0.064 | 0.047 | 0.008 | 0.008 | 0.012 |
| S83Y | SNP in gyrA (codon 83) | 256 | 0.5 | 0.25 | 0.125 | 0.125 | 0.125 |
| S83F | SNP in gyrA (codon 83) | 256 | 0.75 | 0.38 | 0.125 | 0.125 | 0.125 |
| D87A | SNP in gyrA (codon 87) | 48 | 0.75 | 0.19 | 0.094 | 0.064 | 0.064 |
| D87N | SNP in gyrA (codon 87) | 48 | 0.75 | 0.25 | 0.125 | 0.125 | 0.125 |
| D87G | SNP in gyrA (codon 87) | 48 | 0.75 | 0.25 | 0.125 | 0.125 | 0.25 |
| S80I | SNP in parC (codon 80) | 3 | 0.19 | 0.047 | 0.016 | 0.016 | 0.016 |
| D87G-S80I | SNP in gyrA (codon 87) and SNP in parC (codon 80) | 256 | 1 | 0.25 | 0.125 | 0.094 | 0.094 |
| S83F-D87G | 2 SNPs in gyrA (codons 83 and 87) | 256 | 1 | 0.38 | 0.19 | 0.25 | 0.25 |
| S83F-D87A | 2 SNPs in gyrA (codons 83 and 87) | 192 | 1.5 | 0.38 | 0.25 | 0.38 | 0.25 |
| S83F-D87N | 2 SNPs in gyrA (codons 83 and 87) | 64 | 0.75 | 0.38 | 0.19 | 0.19 | 0.19 |
| S83F-D87G-S80I | 2 SNP in gyrA (codons 83 & 87) and SNP in parC (codon 80) | 256 | 24 | 16 | 8 | 2 | 3 |
Additional files
-
Supplementary file 1
Oligonucleotides used in this study.
- https://doi.org/10.7554/eLife.01229.010
Download links
A two-part list of links to download the article, or parts of the article, in various formats.
Downloads (link to download the article as PDF)
Open citations (links to open the citations from this article in various online reference manager services)
Cite this article (links to download the citations from this article in formats compatible with various reference manager tools)
Fitness benefits in fluoroquinolone-resistant Salmonella Typhi in the absence of antimicrobial pressure
eLife 2:e01229.
https://doi.org/10.7554/eLife.01229


