The transcription factor NRSF contributes to epileptogenesis by selective repression of a subset of target genes
- University of California, Irvine, United States
- Institut National de la Santé et de la Recherche Médicale, France
Figures
Figure 1
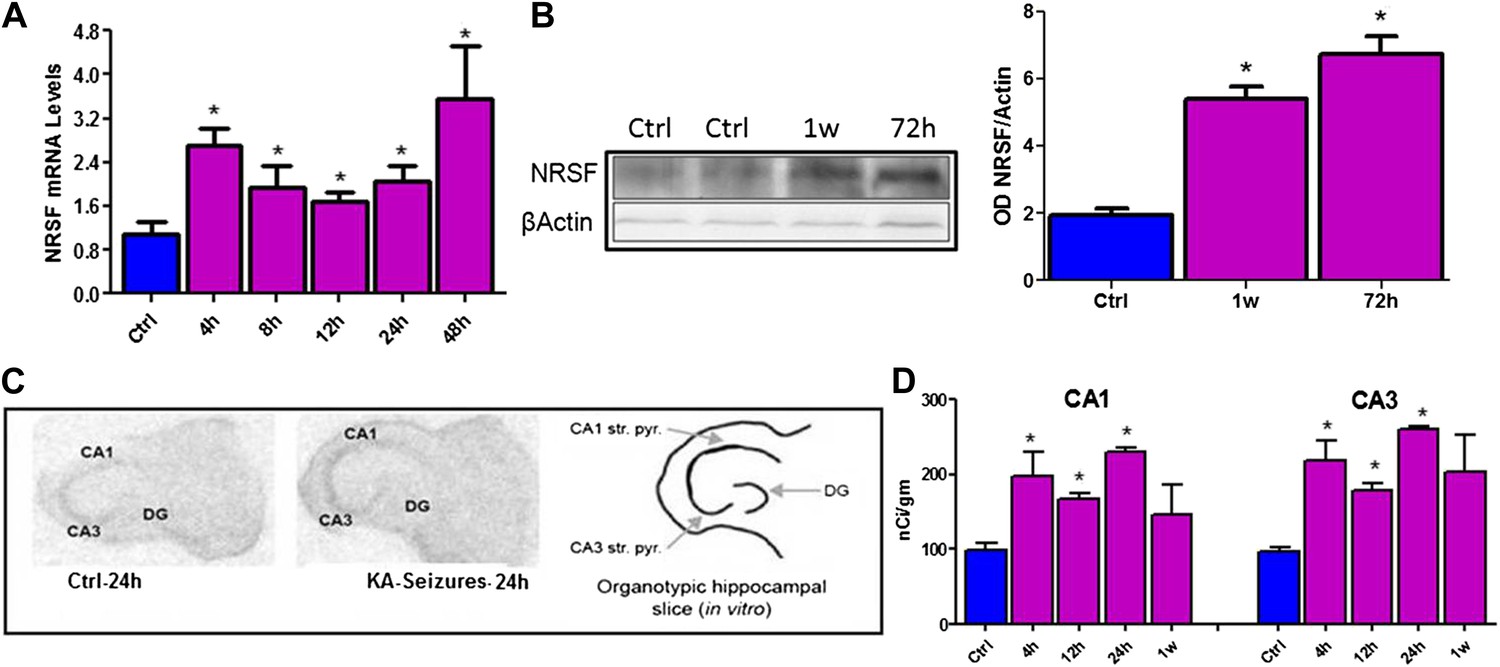
Kainic acid (KA)-seizure-induced increase of NRSF expression.
(A) Time-course of NRSF mRNA expression levels following KA-induced seizures, n = 4/group. (B) Representative western blot image of NRSF protein levels in control (ctrl) animals and animals at 72 hr and 1 week post KA-induced seizures. Quantification of NRSF protein levels using optical density measurements (ctrl 1.96 ± 0.18, n = 6; KA+72hr 6.75 ± 0.54, n = 3; KA+1 week: 5.42 ± 0.36, n = 3). (C and D) In situ hybridization and quantification of NRSF mRNA in organotypic hippocampal slice cultures which had undergone KA-induced seizure-like events. Quantification of mRNA in pyramidal cell layer was performed in control cultures as well as cultures 4 hr, 12 hr, 24 hr, and 1 week following seizure-like events in CA1 and CA3 region of the hippocampus, n = 4–8/group, *p<0.05.
Figure 2
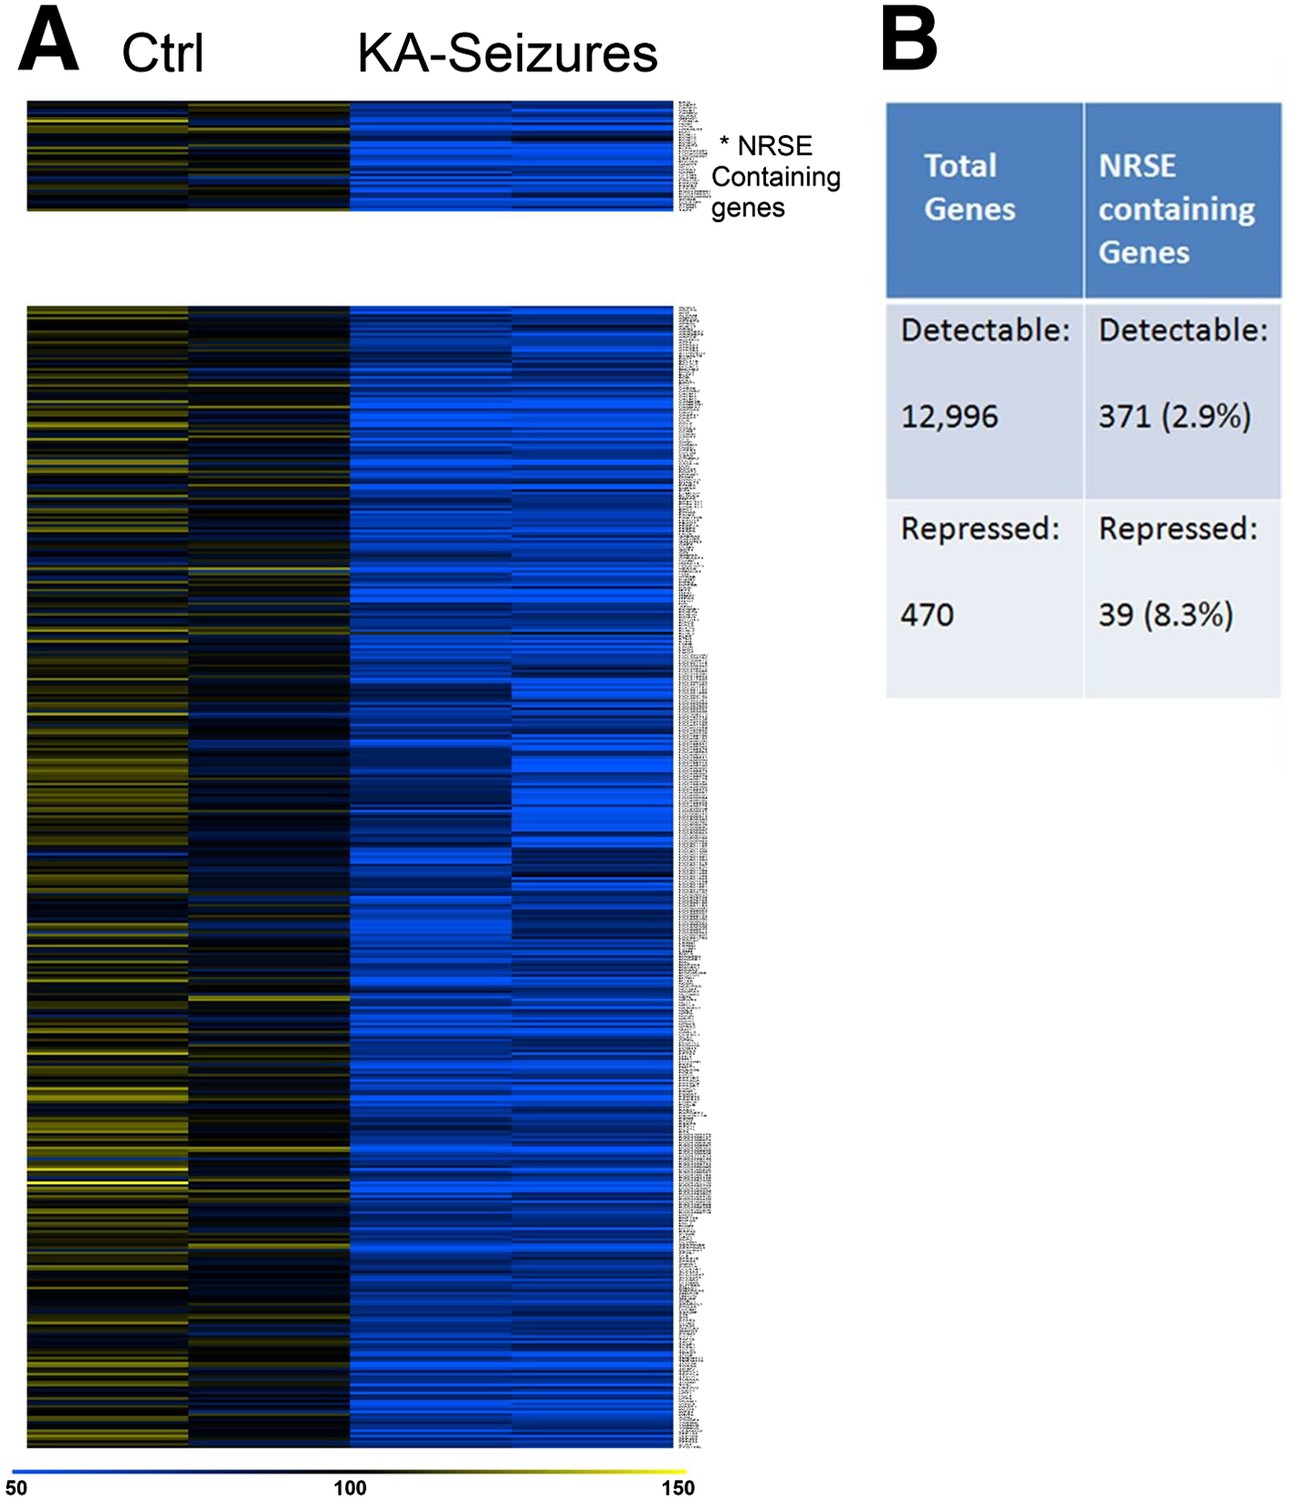
NRSE-containing genes are enriched among hippocampal genes repressed after network activity.
(A) Heat map representing genes with repressed mRNA expression levels in two representative samples from hippocampi derived from control (Ctrl) and from hippocampi from KA-seizures-experiencing rats. Expression levels are represented by color using a scale from 50% to 150% of expression, where yellow is the highest and blue is the lowest. (B) Relative abundance of NRSF target genes among total detected genes vs those repressed by KA-seizures.
Figure 3
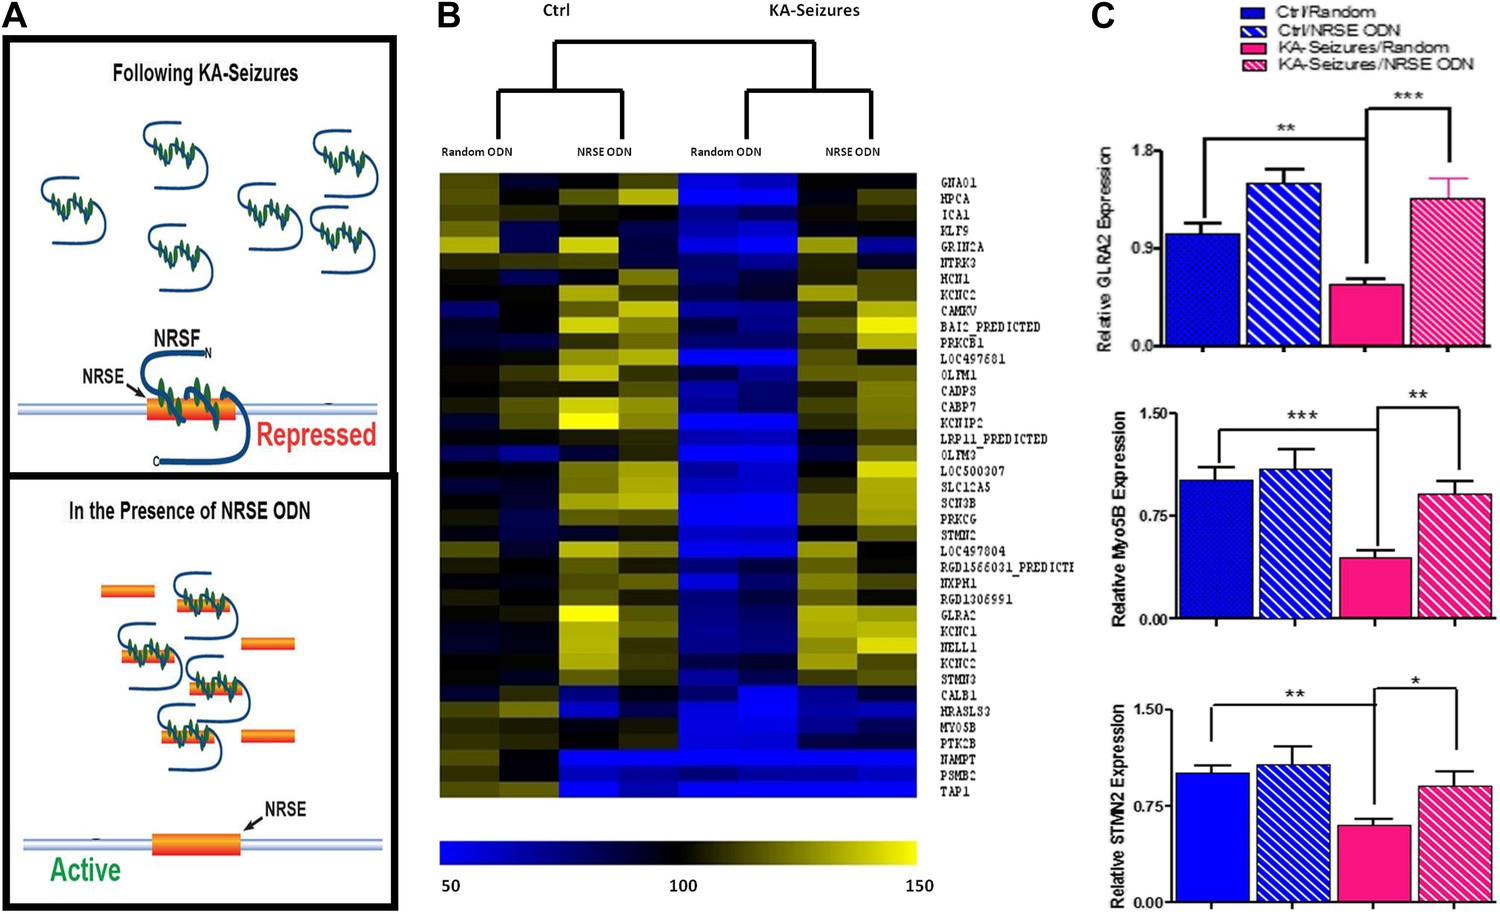
Abrogation of NRSF binding to target genes rescues the majority of NRSE-containing genes repressed by KA-seizures.
(A) A schematic illustrating the mechanism of action of NRSF following a seizure-induced increase and the decoy oligodeoxynucleotide (ODN) intervention strategy with the expected outcome. (B) A heat map representation of the changes in mRNA expression levels of genes that contain a putative NRSE site that were down-regulated 48 hr after KA-induced seizures. Heat map compares representative samples from two hippocampi, from each of four experimental conditions: 'controls' receiving random ODNs (n = 4); ‘controls’ receiving NRSE ODNs (n = 4); ‘KA-seizures’, rats sustaining KA induced seizure activity and receiving random ODNs (n = 3); ‘KA-seizures + NRSE-ODN’, rats sustaining KA-induced seizure activity and receiving NRSE-ODNs (n = 4). Samples and genes are plotted using hierarchical clustering using Euclidean distance and average linkage. Expression level is depicted by color using a scale from 50% to 150% of expression, where yellow is the highest and blue is the lowest. (C) Independent analysis of gene expression using qPCR. Several genes that were both repressed by seizure activity and rescued by interference with NRSF function were tested (Glra2, Myo5B, Stmn2), and results analyzed using two way ANOVA. Myo5B F(1,18) = 9.35, p = 0.007; Glra2 F(1,17) = 46.89, p = 0.0001; Stmn2 F(1,18) = 1.97, p = 0.047, n = 4/group.
Figure 4
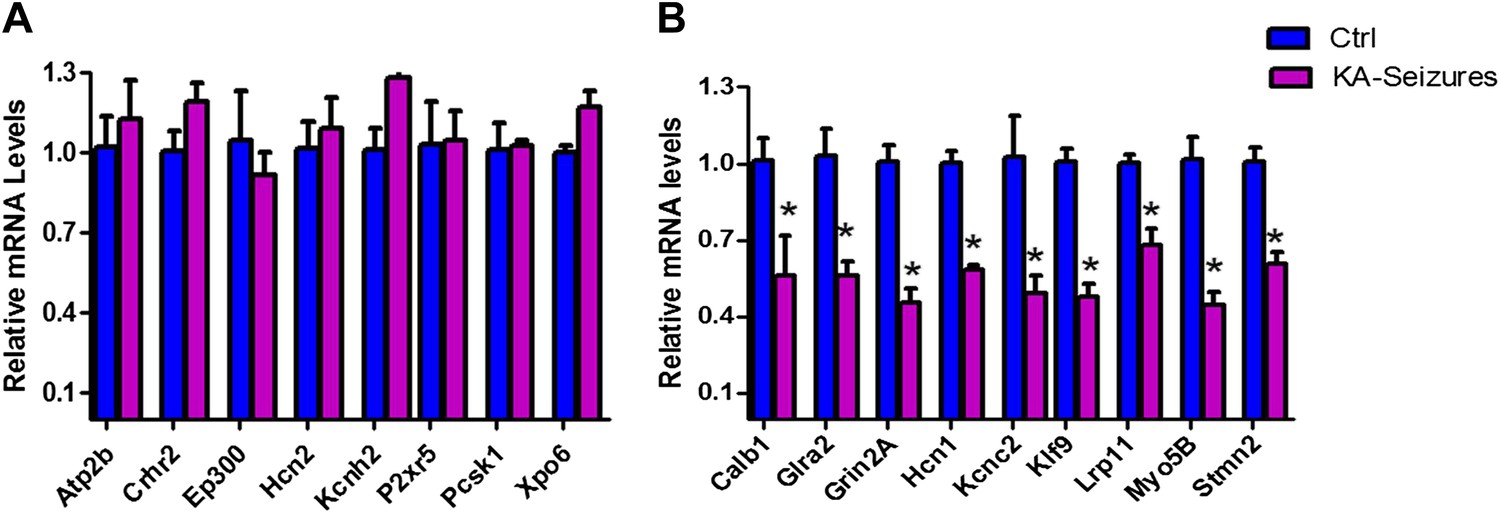
qPCR validation of microarray results.
(A) A selection of NRSE containing genes (Atp2b, Crhr2, Ep300, Hcn2, Kcnh2, P2xr5, Pcsk1, Xpo6) whose expression was unchanged according to the microarray following KA-seizures were measured using qPCR to validate the microarray n = 4/group. (B) qPCR measurement of a selection of the NRSE containing genes (Calb1, Glra2, Grin2a, Hcn1, Kcnc2, Klf9, Lrp11, Myo5b, Stmn2) whose expression was down-regulated following KA-seizures and rescued by NRSE-ODNs n = 4/group, p*<0.05.
Figure 5
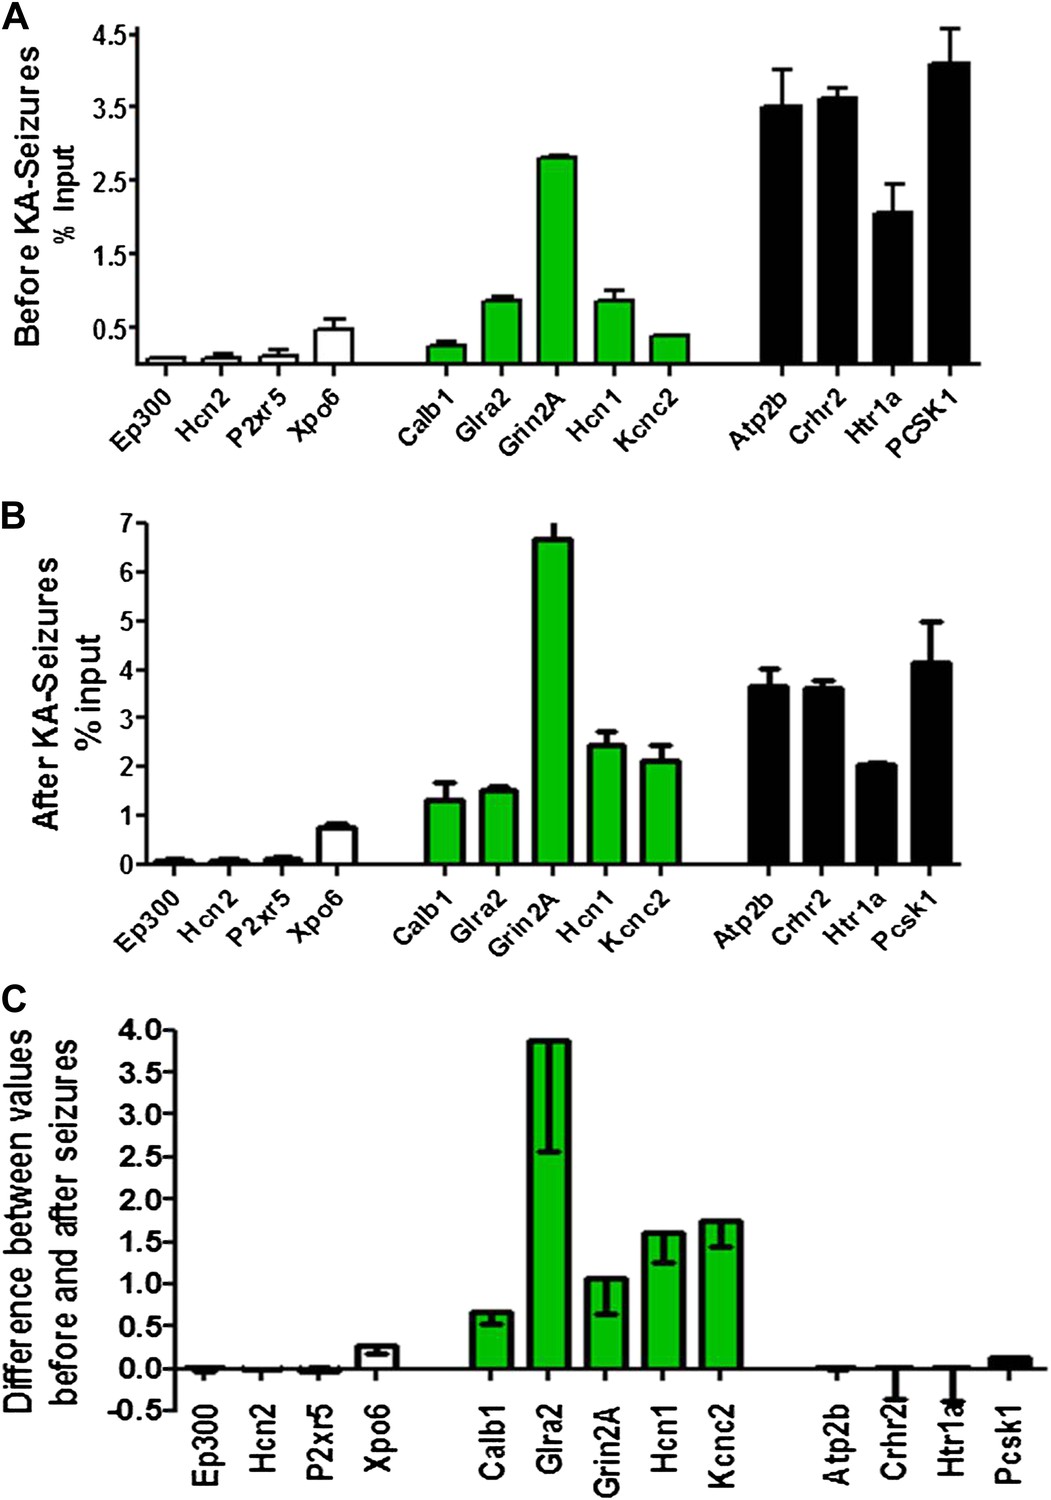
Physical binding of NRSF co-varies with tissue levels specifically at genes that are regulated by the repressor.
(A) NRSF binding (expressed as percent of input) to selected NRSE-containing genes in naive hippocampus with genes whose expression is repressed by seizure-induced NRSF increase represented in green, genes where NRSF occupancy was low are depicted in white, while genes where NRSF binding was abundant are depicted in black. (B) NRSF occupancy (percent input) at the same gene set in the hippocampus 48 hr following KA-induced seizures. (C) Graphical depiction of the changes (Delta) in NRSF occupancy at NRSE-containing gene sets comparing occupancy following KA-induced seizures to occupancy in the naive state. Genes whose expression was repressed are represented in green, n = 4–6/group, p*<0.05.
Figure 6
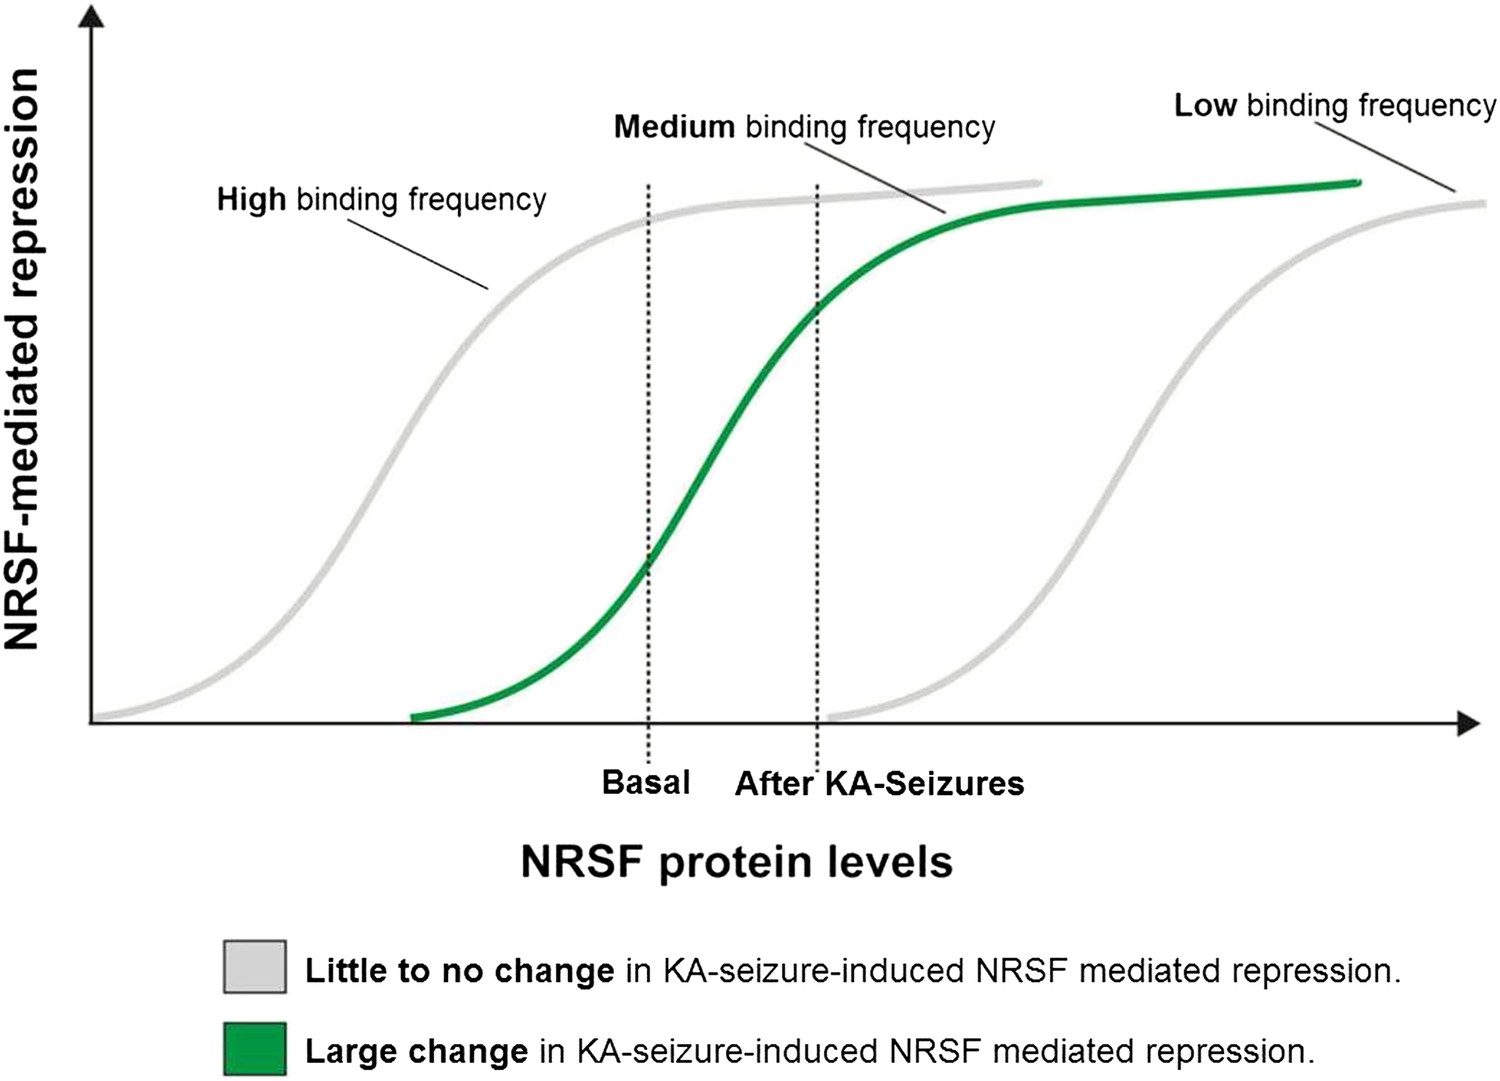
A potential ‘dynamic range’ of repressor binding might enable gene regulation by moderate fluctuations of NRSF levels.
A graphical representation of our proposed hypothesis based on our observations that only a subset of NRSE-containing genes are functionally repressed by seizure-induced increases in NRSF levels and that these genes appear to have moderate NRSF binding in the naive brain.
Figure 7

Genes regulated by seizure-dependent changes in NRSF function possess a distinct range of NRSF binding frequencies.
(A) Diagram illustrating sets of genes that were binned according to binding frequency based on Johnson et al., 2007. Gene sets were numbered in increasing order of their NRSF binding frequencies. Mid-range NRSF-binding frequencies are in green. (B and C) A binding frequency metric was established for each NRSF-binding gene based on the number of ChIP-Seq reads from published data (Johnson et al., 2007). The distribution of (B) all microarray-detectable NRSF-binding genes was compared to the distribution of (C) genes regulated by seizure-dependent NRSF changes, that is, those genes significantly repressed by network hyperactivity and rescued by NRSE–ODN treatment. Presented are scatter dot plots, with median with interquartile ranges. Below them are regression fit histogram plots. (D) Comparing microarray data from control rats to that of rats experiencing KA-seizures (both with scrambled ODN), using GSEA, illustrates that three gene-sets were significantly enriched in the control rats (repressed in the seizure + scrambled-ODN rats) and these fell in the mid-frequency category (see Table 1 for numeric values).
Figure 8
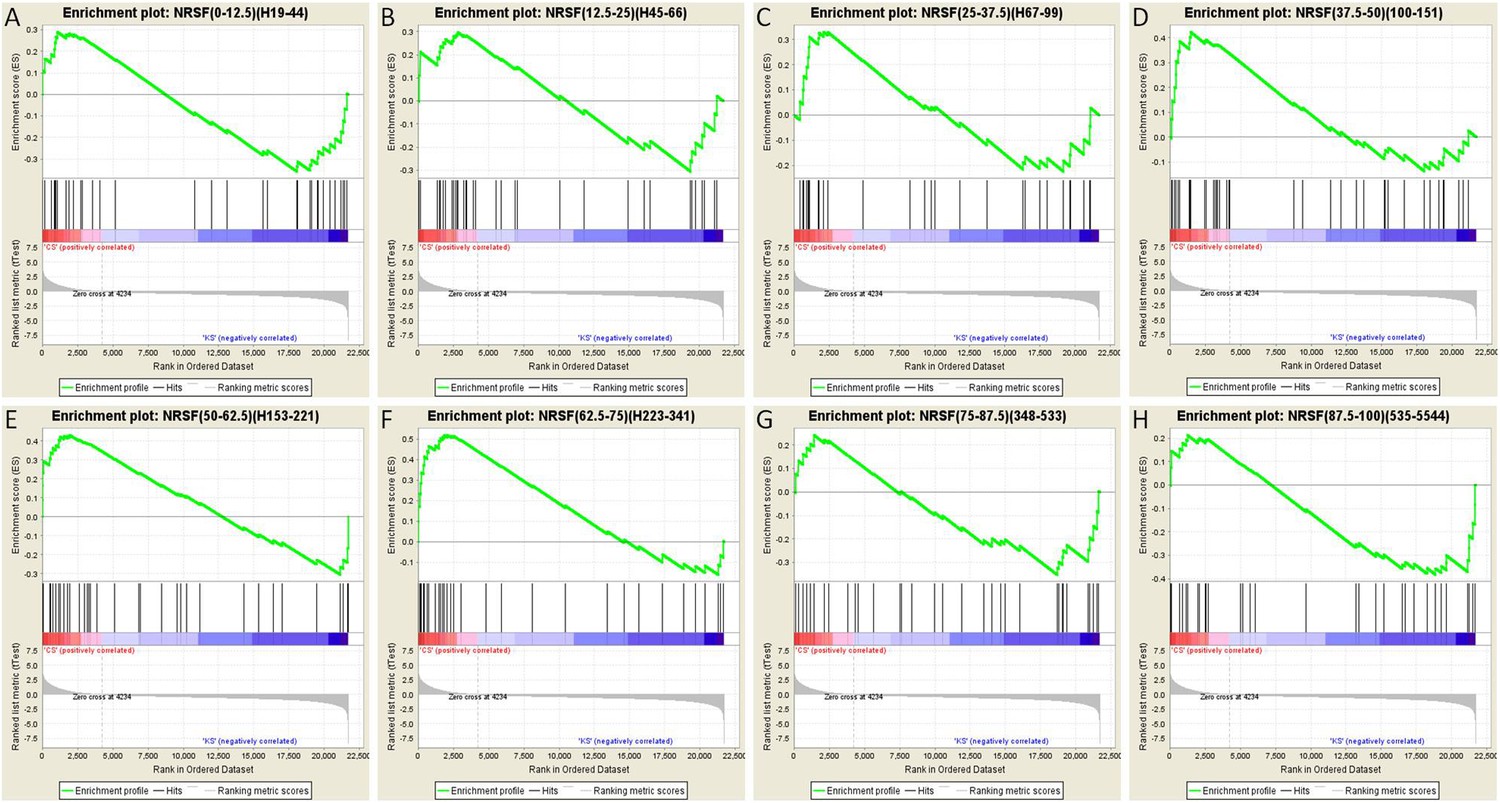
Gene set enrichment analysis (GSEA, Broad Institute, MIT) curves of hippocampal NRSE-containing genes.
These genes have been classified (‘binned’) into eight groups by increasing order of their NRSF binding frequency rank percentile. Hence, these genes might be categorized as low-binding frequency (A–C), mid-binding frequency (D–F), and high-binding frequency (G–H). Each graph shows enrichment plots comparing gene expression in KA-seizures vs controls in the presence of random ODNs. Please see Table 1, top, for the numeric values and parameters of the analyses.
Tables
Table 1
Gene-set enrichment analyses focusing on NRSF
| Gene set name | NES | NOM p-val | FDR q-val | FWER p-val |
|---|---|---|---|---|
| Ctrl vs Activity (both with scrambled ODN) | ||||
| NRSF(0-12.5)(19-44) | 1.1449 | 0.2891 | 0.3824 | 0.8710 |
| NRSF(12.5-25)(45-66) | 1.2296 | 0.5170 | 0.5150 | 0.9870 |
| NRSF(25-37.5)(67-99) | 1.1865 | 0.2140 | 0.2020 | 0.2940 |
| NRSF(37.5-50)(100-151) | 1.6817 | 0.0102 | 0.0212 | 0.0160 |
| NRSF(50-62.5)(153-221) | 1.6487 | 0.0258 | 0.0175 | 0.0210 |
| NRSF(62.5-75)(223-341) | 2.0243 | 0.0000 | 0.0000 | 0.0000 |
| NRSF(75-87.5)(348-533) | 1.1396 | 0.2777 | 0.5563 | 0.8600 |
| NRSF(87.5-100)(535-5544) | 0.9720 | 0.1868 | 0.7621 | 0.7200 |
| Ctrl vs Activity (both with NRSE-ODN) | ||||
| NRSF(0-12.5)(19-44) | 1.1485 | 0.2634 | 0.3881 | 0.6590 |
| NRSF(12.5-25)(45-66) | 1.1842 | 0.2000 | 0.2071 | 0.6050 |
| NRSF(25-37.5)(67-99) | 1.3069 | 0.1165 | 0.1323 | 0.3540 |
| NRSF(37.5-50)(100-151) | 1.4666 | 0.0458 | 0.0646 | 0.1450 |
| NRSF(50-62.5)(153-221) | 1.4762 | 0.0270 | 0.0880 | 0.1300 |
| NRSF(62.5-75)(223-341) | 1.5241 | 0.0294 | 0.1276 | 0.0970 |
| NRSF(75-87.5)(348-533) | 1.2320 | 0.4121 | 0.4184 | 0.8400 |
| NRSF(87.5-100)(535-5544) | 1.0232 | 0.1824 | 0.5207 | 0.5190 |
-
NRSF is significantly enriched in gene sets with moderate binding probability even after false discovery corrections (FDR q-val), when the control and activity groups are compared (top; in bold). When the function of NRSF is blocked, that is, when comparison groups are the control and seizure-activity groups both treated with the NRSE-ODN, NRSF target gene-sets the bins (gene-sets) with moderate binding-frequencies are no longer enriched among differentially expressed genes.
Table 2
Candidate list of seizure-dependent NRSF regulated genes
| Ion channels, accessory subunits or receptors | ||||
| HCN1 | hyperpolarization-activated cyclic nucleotide-gated channel 1 (Hcn1) | * | † | ‡ |
| LRP11 | low density lipoprotein receptor-related protein 11 | * | † | ‡ |
| KCNC2 | potassium voltage gated channel, Shaw-related subfamily, member 2 | * | † | ‡ |
| KCNIP2 | Kv channel-interacting protein 2 (Kcnip2), transcript variant a | * | † | |
| BAI2 | brain-specific angiogenesis inhibitor 2 (predicted) | * | † | |
| SCN3B | sodium channel, voltage-gated, type III, beta (Scn3b) | * | ||
| SLC12A5 | solute carrier family 12 member 5 (Slc12a5), (KCC2) | * | ||
| GRIN2A | Glutamate receptor, ionotropic, N-methyl D-aspartate 2A (Grin2a) | * | ||
| KCNC1 | K voltage gated channel, Shaw-related subfamily, member 1, transcript 2 (Kcnc1) | * | ||
| GLRA2 | glycine receptor, alpha 2 (Glra2) | * | ||
| NTRK3 | neurotrophic tyrosine kinase, receptor, type 3 (Ntrk3) | * | ||
| Calcium-mediated cellular cascades | ||||
| CADPS | Ca++-dependent secretion activator (Cadps) | * | † | ‡ |
| CALB1 | calbindin 1 (Calb1) | * | † | |
| HPCA | hippocalcin (Hpca) | * | † | |
| CABP7 | calcium binding protein 7 (Cabp7) | * | † | |
| MYO5B | myosin Vb (Myo5b) | * | ||
| CAMKV | CaM kinase-like vesicle-associated (Camkv) | * | ||
| Phosphoenzymes | ||||
| GNAO1 | guanine nucleotide binding protein, alpha O (Gnao1) | * | † | ‡ |
| PRKCG | protein kinase C, gamma (Prkcg) | * | ||
| PRKCB1 | protein kinase C, beta 1 (Prkcb1) | * | ||
| NELL1 | NEL-like 1 (chicken) (Nell1) | * | ||
| Others | ||||
| KLF9 | Kruppel-like factor 9 (Klf9) | * | † | ‡ |
| STMN2 | stathmin-like 2 (Stmn2) | * | † | |
| OLFM3 | olfactomedin 3 (Olfm3) | * | † | |
| ICA1 | islet cell autoantigen 1 (Ica1) | * | † | |
| STMN3 | stathmin-like 3 (Stmn3) | * | ||
| OLFM1 | olfactomedin 1 (Olfm1) | * | ||
| NXPH1 | neurexophilin 1 (Nxph1) | * | ||
-
Genes were designated as ‘NRSE-containing’ based on NRSF ChIP-sequencing data from previous studies (Johnson et al., 2007). For inclusion in the initial list of candidate genes for NRSF regulation, genes were considered significantly repressed if their expression was reduced by more than 20% after KA-induced seizures (p < 0.05). Genes considered ‘rescued’ were significantly repressed after seizures but not significantly repressed after ODN infusions [seizures + NRSE-ODN treatment]. This candidate gene approach was followed by measures to correct for FDR (see ‘Materials and methods’).
-
*
genes (28) with expression reduced by > 20% after KA-induced activity, and rescued by NRSF ODN; p < 0.05.
-
†
genes (14) found with ANOVA, Benjamini–Hochberg FDR <0.25.
-
‡
genes (6) found with one-way ANOVA, unadjusted p value <0.05.
Additional files
-
Supplementary file 1
(A) NRSE sequences for NRSF regulated and non-regulated genes. (B) Primers used in qPCR. (C) Primers used in ChIP.
- https://doi.org/10.7554/eLife.01267.013
Download links
A two-part list of links to download the article, or parts of the article, in various formats.
Downloads (link to download the article as PDF)
Open citations (links to open the citations from this article in various online reference manager services)
Cite this article (links to download the citations from this article in formats compatible with various reference manager tools)
The transcription factor NRSF contributes to epileptogenesis by selective repression of a subset of target genes
eLife 3:e01267.
https://doi.org/10.7554/eLife.01267


