Hydrogen bonds as molecular timers for slow inactivation in voltage-gated potassium channels
- University of British Columbia, Canada
- University of Iowa, United States
Figures
Figure 1
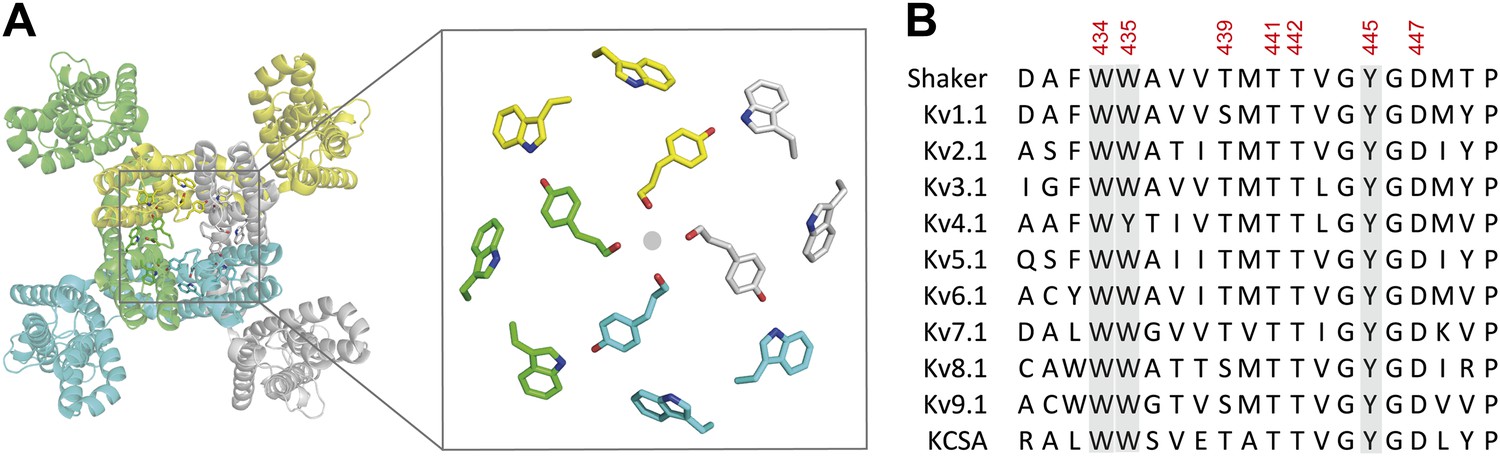
The aromatic cuff is part of a highly conserved region in potassium channels.
(A) Top view of a Kv channel based on the structure of the tetrameric Kv1.2/2.1 chimera (PDB 2R9R; individual subunits are colored in gray, cyan, green and yellow, respectively). The inset shows a magnified view of the side chains that form the ‘aromatic cuff’: Trp434, Trp435 and Tyr445 (by numbering in Shaker potassium channels). Note the backbone carbonyls are shown for Tyr445 to highlight their role in the coordination of potassium ions (gray circle); (B) Sequence alignment of the pore helix and the selectivity filter of various potassium channels: Shaker (GI:288442), Kv1.1 (GI:119395748), Kv2.1 (GI:84570020), Kv3.1 (GI:298603), Kv4.1 (GI:8272404), Kv5.1 (GI:24418476), Kv6.1 (GI:24418479), Kv7.1 (GI:6166005), Kv8.1 (GI:7657289), Kv9.1 (GI:219520418), and KCSA (GI: 61226909). Side chains constituting the aromatic cuff are highlighted in gray (see above) and all positions studied here are indicated using their numbering in Shaker potassium channels (these residues correspond to Trp362, Trp363, Ser367, Thr369, Thr370, Tyr373 and Asp375 in the Kv1.2/Kv2.1 [voltage-gated potassium channel isoforms 1.2 and 2.1] chimera crystal structure [PDB 2R9R]).
Figure 2 with 2 supplements
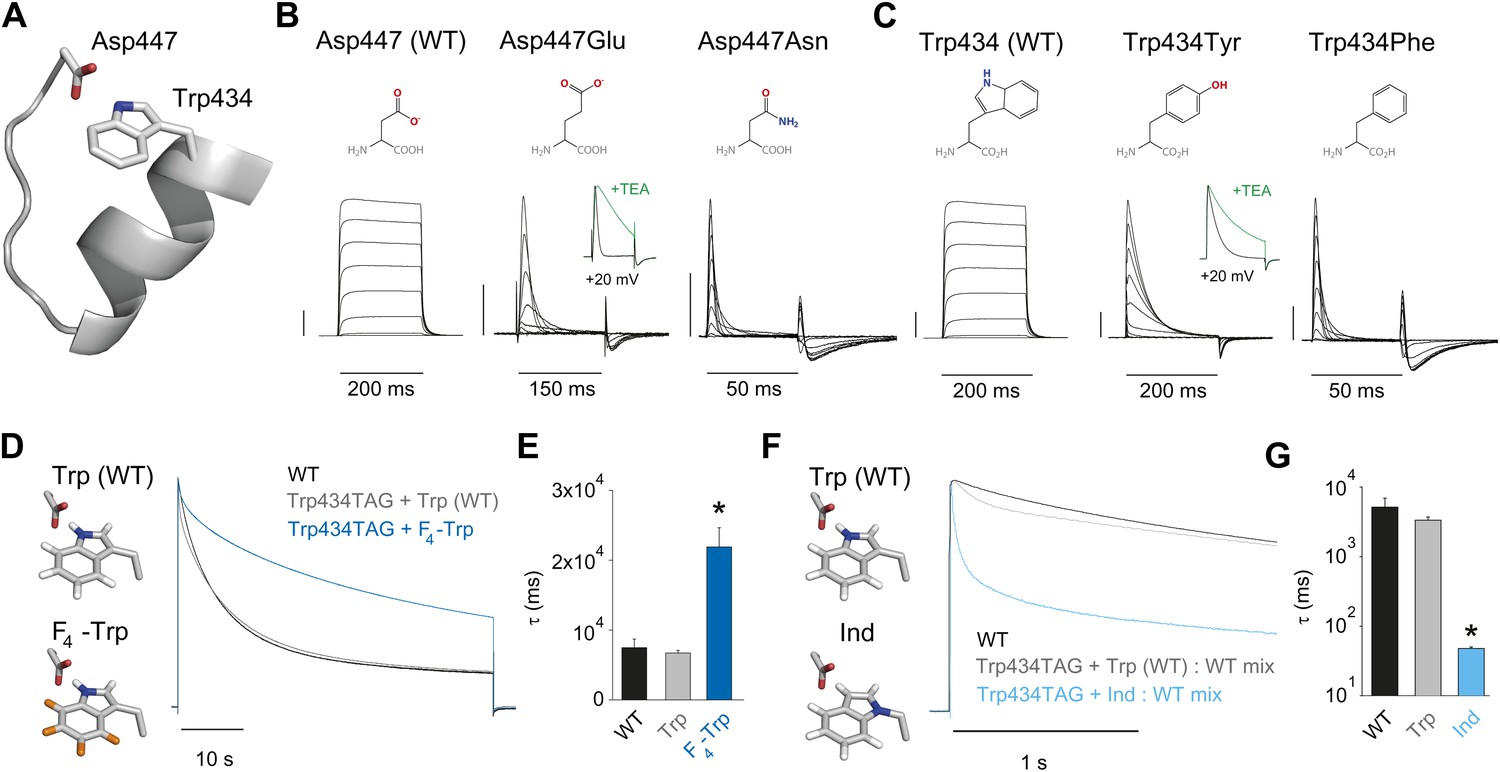
Evidence for an intra-subunit H-bond between Asp447 and Trp434.
(A) Structure of a Kv1.2/2.1 chimera (2R9R) pore region demonstrating the physical proximity of Asp447 and Trp434 (Shaker residue numbering); (B) Chemical structures of side chains at position 447 and (normalized) representative currents for Asp447 (WT), Asp447Glu and Asp447Asn (−80 mV to +20 mV in 10 mV increments). Inset for Asp447Glu shows the traces recorded for a pulse to +20 mV in the absence and presence of 30 mM TEA (see Figure 2—figure supplement 1 for further details); (C) Chemical structures of side chains at position 434 and (normalized) representative currents for Trp434 (WT), Trp434Tyr and Trp434Phe (−80 mV to +20 mV, 10 mV increments). Inset for Trp434Tyr shows the traces recorded for a pulse to +20 mV in the absence and presence of 30 mM TEA (see Figure 2—figure supplement 1 for further details). Unlike the Trp434Phe mutant the Asp447Asn mutant remained nonconducting on the Thr449Val background as shown in Figure 2—figure supplement 2; the vertical scale bar indicates 1 μA; (D)/(F) Left panels: model for the Asp447–Trp434 pair (based on PDB 2R9R) for either Trp and F4-Trp (D) or Trp and Ind (F); Right panels: normalized sample currents for WT, Trp434TAG + Trp or Trp434TAG + F4-Trp (D) or WT, Trp434TAG + Trp: WT or Trp434TAG + Ind: WT (F). The initial faster decay of the gray traces in (D) and (F) may indicate that a very small fraction of channels has incorporated amino acids other than the one ligated to the tRNA, see text for details. Note that for the experiments in (F) and (G) WT cRNA was mixed with Trp434TAG cRNA to account for the fact the Trp434TAG + Ind alone did not yield measurable ionic currents (see ‘Materials and methods’ for details). Note the different time scales in (D) and (F); (E)/(G) Averaged inactivation time constants for the constructs shown in (D) and (E), respectively. Single exponentials were fit to the entire (45 s) depolarizations in (D), while in (F) the time constants for Ind were determined by fitting only the initial 500 ms of the depolarization (5 s for WT and Trp434TAG + Trp: WT); Note the logarithmic scaling in (G); *p<0.05 (WT vs mutants).
Figure 2—figure supplement 1
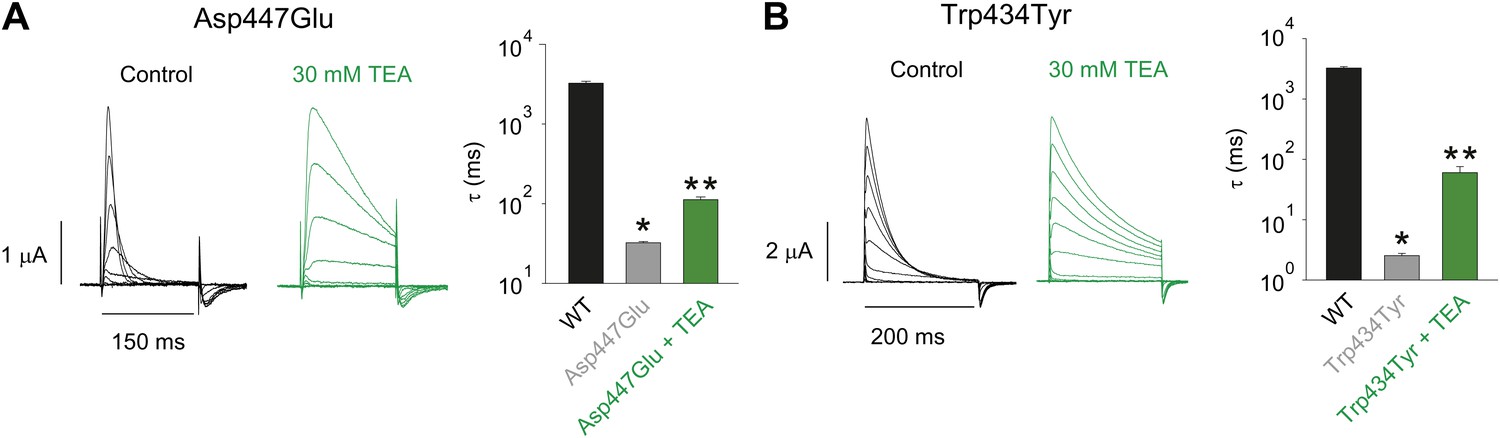
Tuning the Asp447–Trp434 intra-subunit H-bond.
(A)/(B) Recordings with Asp447Glu (A) and Trp434Tyr (B) in the absence (black) or presence of 30 mM TEA (−80 mV to +20 mV, 10 mV increments), clearly demonstrating their sensitivity to extracellular TEA, a hallmark of slow inactivation. The insets show the inactivation time constants at + 20 mV for WT and Asp447Glu or Trp434Tyr in the absence or presence of TEA; single exponentials were fit to the rst 100 ms (Asp447Glu control) or the entire length of the depolarization (all other currents shown above); *p=0.05 (WT vs mutant), **p=0.05 (control vs TEA for mutants).
Figure 2—figure supplement 2
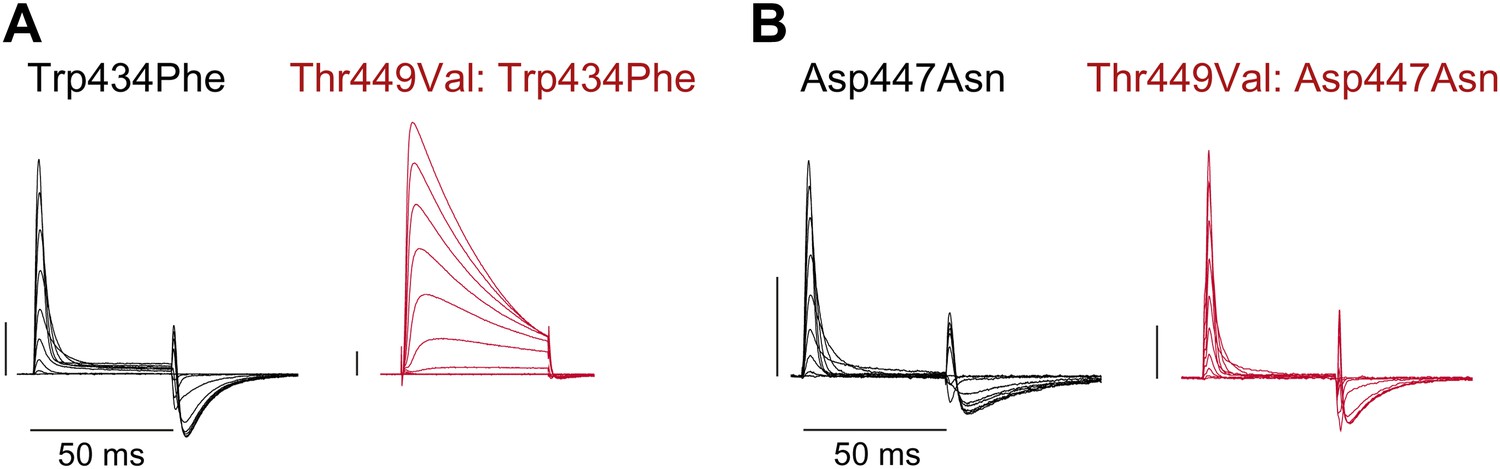
Unlike Trp434Phe, Asp447Asn remains nonconducting on the Thr449Val background.
(A)/(B) Representative currents of Trp434Phe (A) and Asp447Asn (B) on either the WT background (black) or the Thr449Val background (red) (−80 mV to +20 mV, 10 mV increments; the vertical scale bar indicates 1 μA).
Figure 3 with 1 supplement
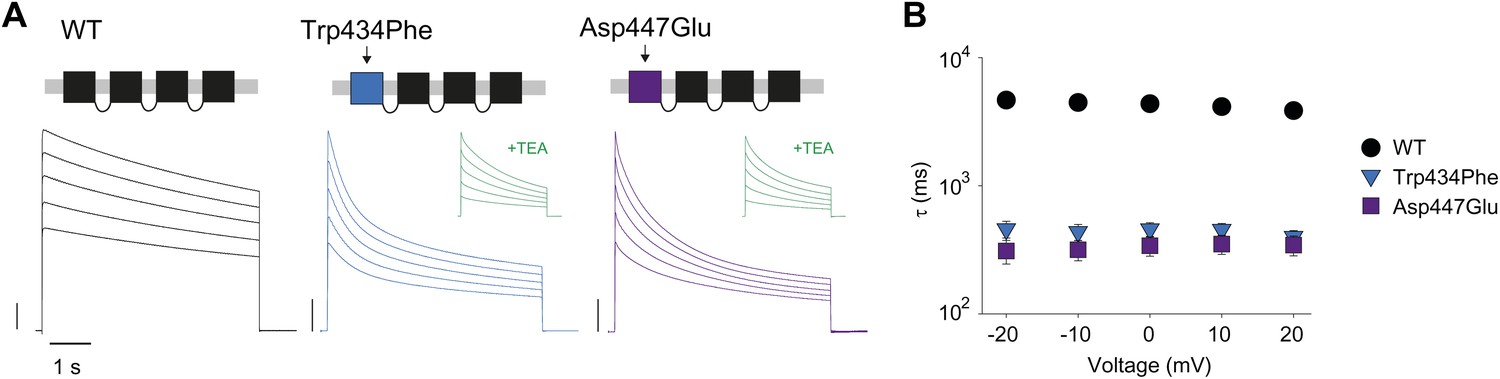
Concatemers support the notion of an intra-subunit H-bond between Asp447 and Trp434.
(A) Concatemer structure and (normalized) representative currents (5 s pulses from −20 mV to +20 mV, 10 mV increments) for WT, Trp434Phe and Asp447Glu concatemers, respectively. The vertical scale bars indicate 2 μA. The insets show recording from the same cells in the presence of 30 mM TEA; (B) Averaged inactivation rates (logarithmic scaling) over different voltages for the constructs shown in (A). Note that for the Trp434Phe and Asp447Glu concatemers only the first 2 s of the depolarization were fit with a single exponential. To avoid a potential bias of this approach, we have also analyzed the time to half-maximal current for all constructs. Importantly, this approach yielded similar results, see Figure 3—figure supplement 1.
Figure 3—figure supplement 1

Comparison of different metrics to determine the rate of inactivation.
The decay of ionic current of WT, Trp434Phe and Asp447Glu concatemers was either fit with a single exponential (colored symbols, reproduced from Figure 3B) or quantfied by analyzing the time to half-maximal current (empty symbols). Displayed is the data for depolarizations to +20 mV; note that long (20 s) depolarizations were necessary to determine the time to half-maximal current for WT concatemers.
Figure 4 with 3 supplements
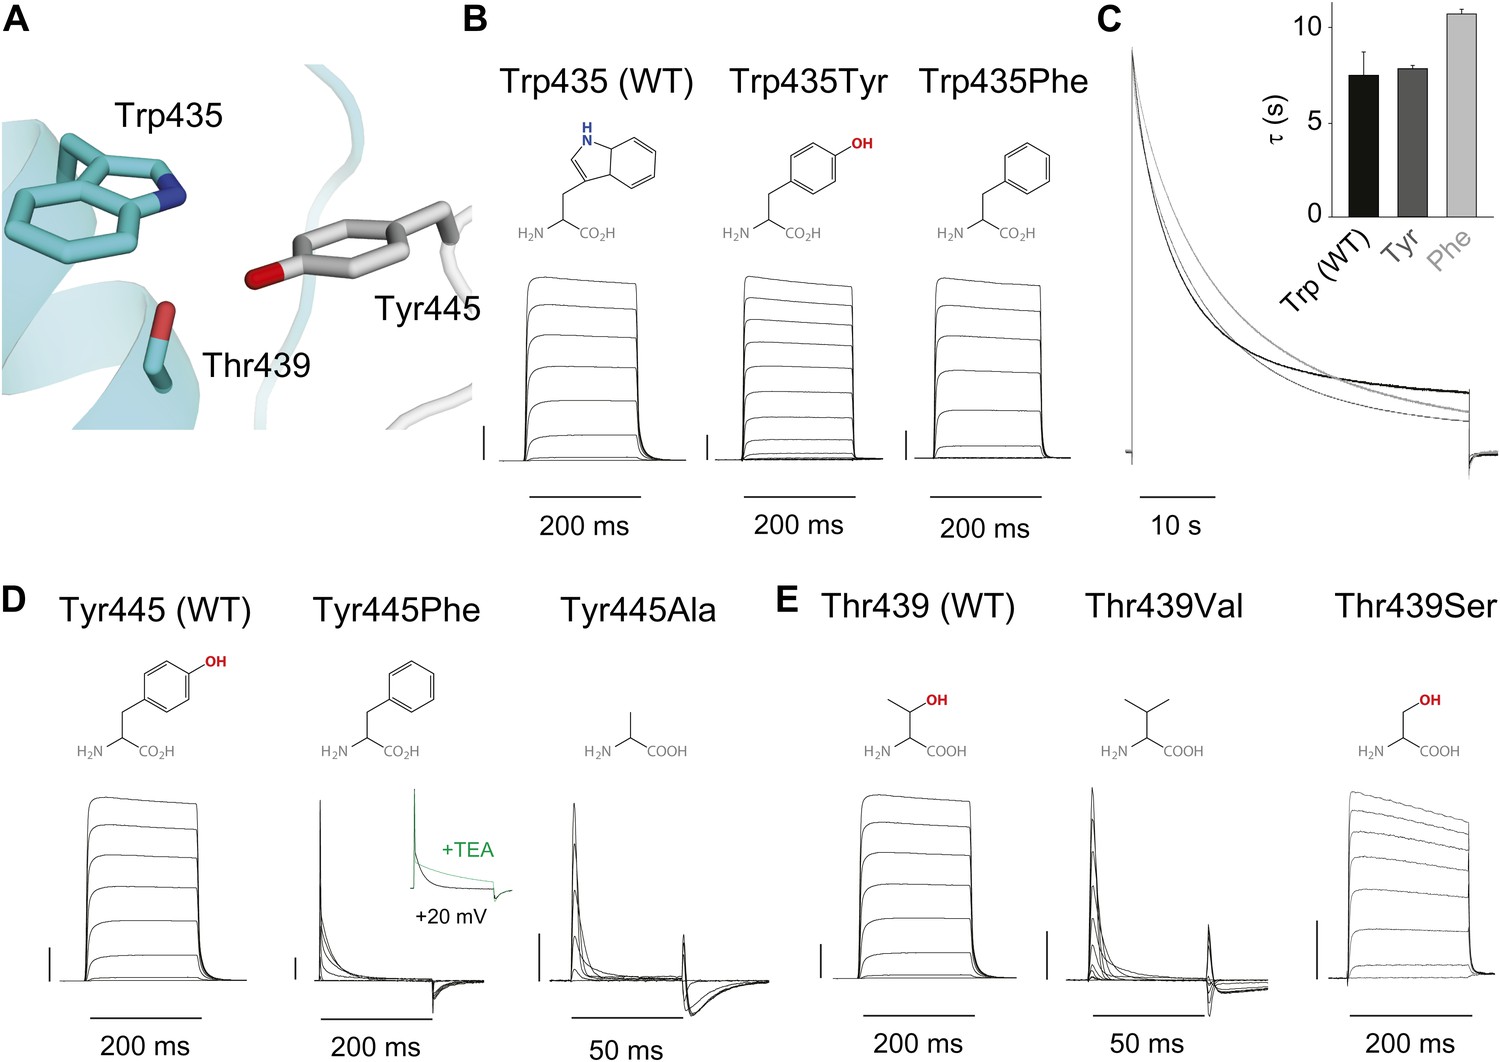
An inter-subunit H-bond connects Tyr445 with Thr439, not Trp435.
(A) Structure of a Kv1.2/2.1 chimera (2R9R) pore region demonstrating the physical proximity of Tyr445 to both Thr439 and Trp435 on the adjacent subunit (Shaker residue numbering). Note that the position equivalent to position 439 in Shaker (Thr439) is a serine in the Kv1.2/2.1 chimera; (B) Chemical structures of side chains at position 435 and representative currents for Trp435 (WT), Trp435Tyr and Trp435Phe (−80 mV to +20 mV, 10 mV increments). The vertical scale bar indicates 1 μA; (C) Representative normalized currents for a 45 s depolarization to +20 mV for Trp435 (WT), Trp435Tyr and Trp435Phe. Inset shows average inactivation time constants for the constructs shown in (B) (single exponential fit over the entire duration of the depolarization); (D)/(E) Chemical structures and (normalized) representative currents for different side chains in position 445 (D) and 439 (E), respectively (−80 mV to +20 mV, 10 mV increments). The vertical scale bars indicate 1 μA, note the different time scales. Inset for Tyr445Phe shows the traces recorded for a pulse to +20 mV in the absence and presence of 30 mM TEA (see Figure 4—figure supplement 1 for further details). The Tyr445Ala and Thr439Val mutants remained nonconducting on the Thr449Val background as shown in Figure 4—figure supplement 2. The inactivation time constant (τ) for Thr439Ser was 948 ± 30 ms compared to 3247 ± 186 ms for WT channels (see Figure 4—figure supplement 3 for further details).
Figure 4—figure supplement 1
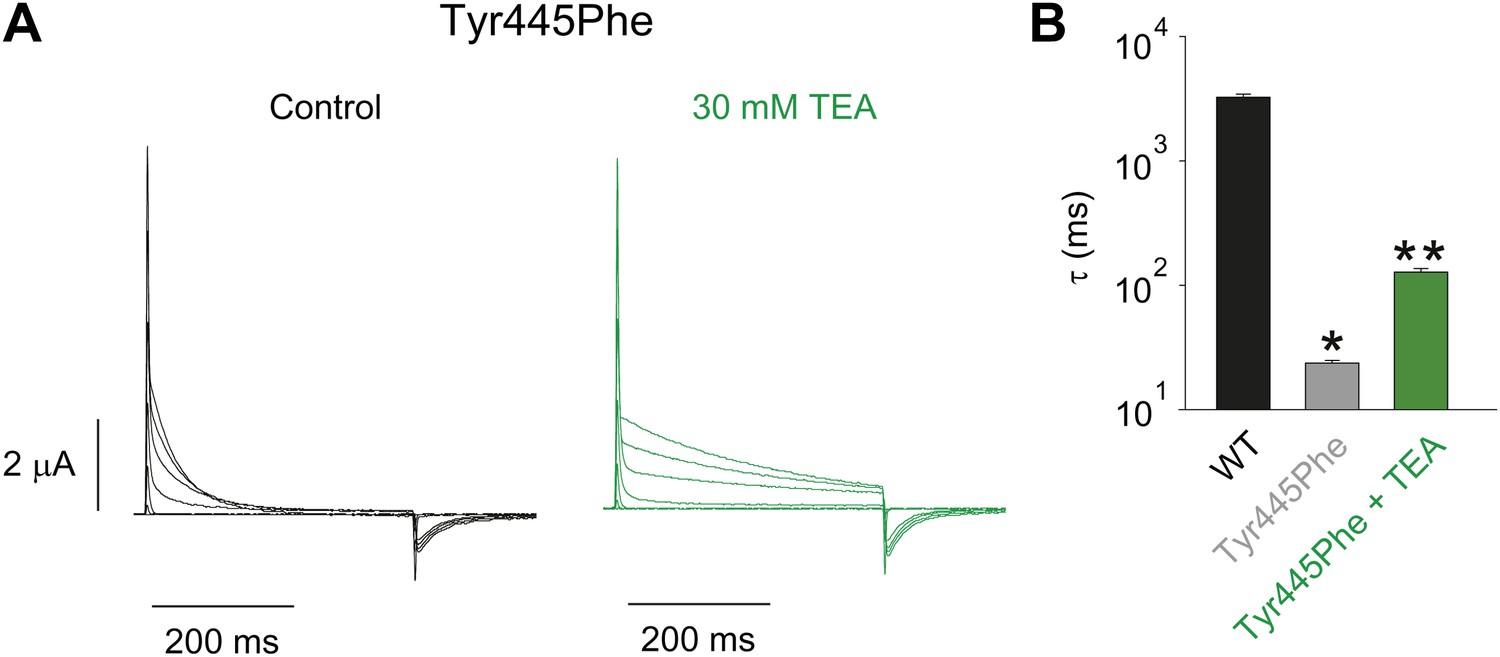
Tuning the Tyr445–Thr439 inter-subunit H-bond.
(A) Recordings with Tyr445Phe in the absence (black) or presence of 30 mM TEA (green) (−80 mV to +20 mV, 10 mV increments), clearly demonstrating the sensitivity to extracellular TEA, a hallmark of slow inactivation; (B) Inactivation time constants at + 20 mV for WT and for Tyr445Phe in the absence or presence of TEA; single exponentials were fit to the entire 200 ms of the depolarization; *p<0.05 (WT vs Tyr445Phe), **p<0.05 (control vs TEA for Tyr445Phe).
Figure 4—figure supplement 2
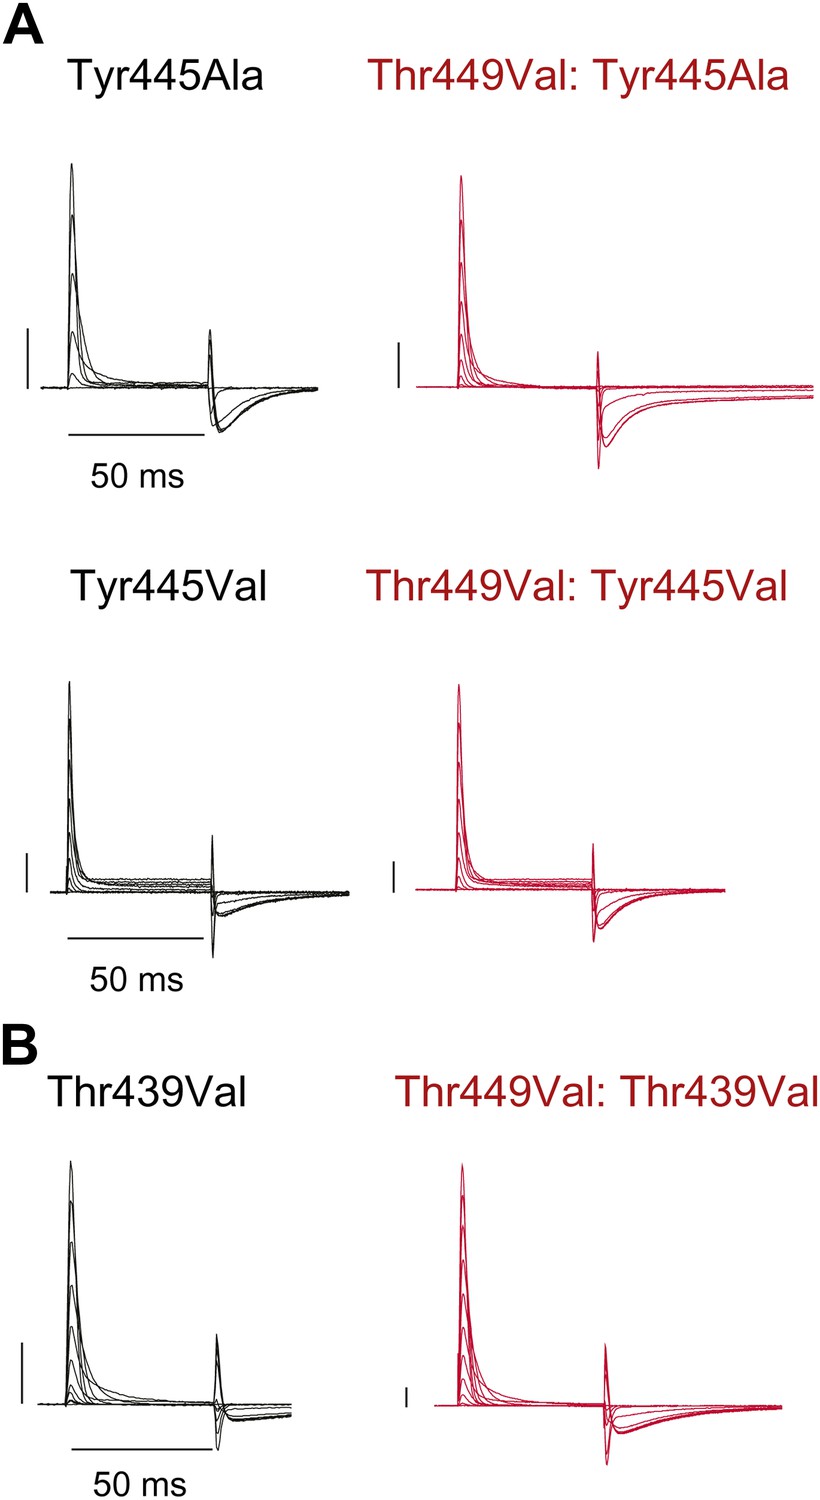
Tyr445Ala, Tyr445Val and Thr439Val remain nonconducting on the Thr449Val background.
(A)/(B) Representative currents of Tyr445Ala and Tyr445Val (A) and Thr439Val (B) on either the WT background (black) or the Thr449Val background (red) (−80 mV to +20 mV, 10 mV increments; the vertical scale bar indicates 1 μA).
Figure 4—figure supplement 3
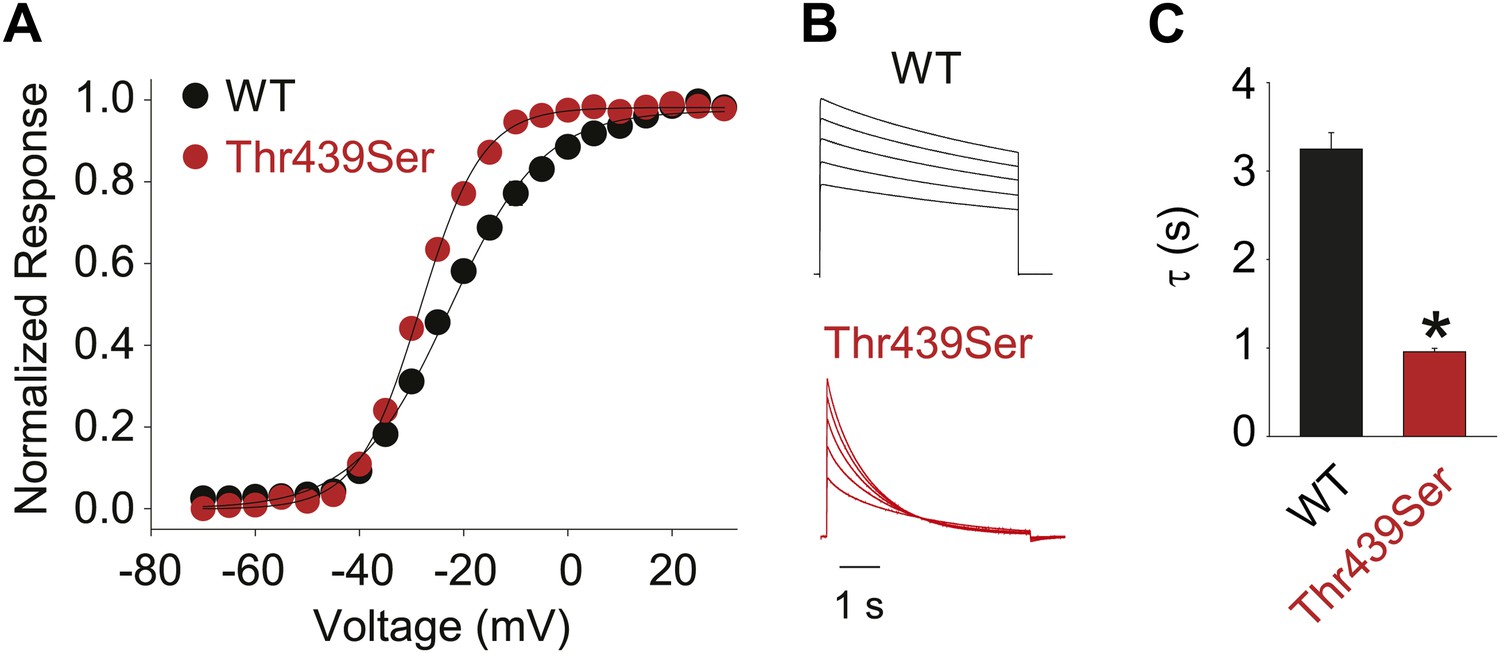
The methyl moiety of Thr439 may play a minor role in inactivation.
(A) GVs for Thr439Ser (V1/2 Thr441Ser: −28.4 ± 0.3 mV; vs V1/2 for WT: −23.5 ± 0.9 mV); (B) Representative currents for WT and Thr439Ser (5 s pulses from −20 mV to +20 mV, 10 mV increments); (C) Averaged inactivation rates at +20 mV for WT and Thr439Ser, respectively; *p<0.05.
Figure 5 with 2 supplements
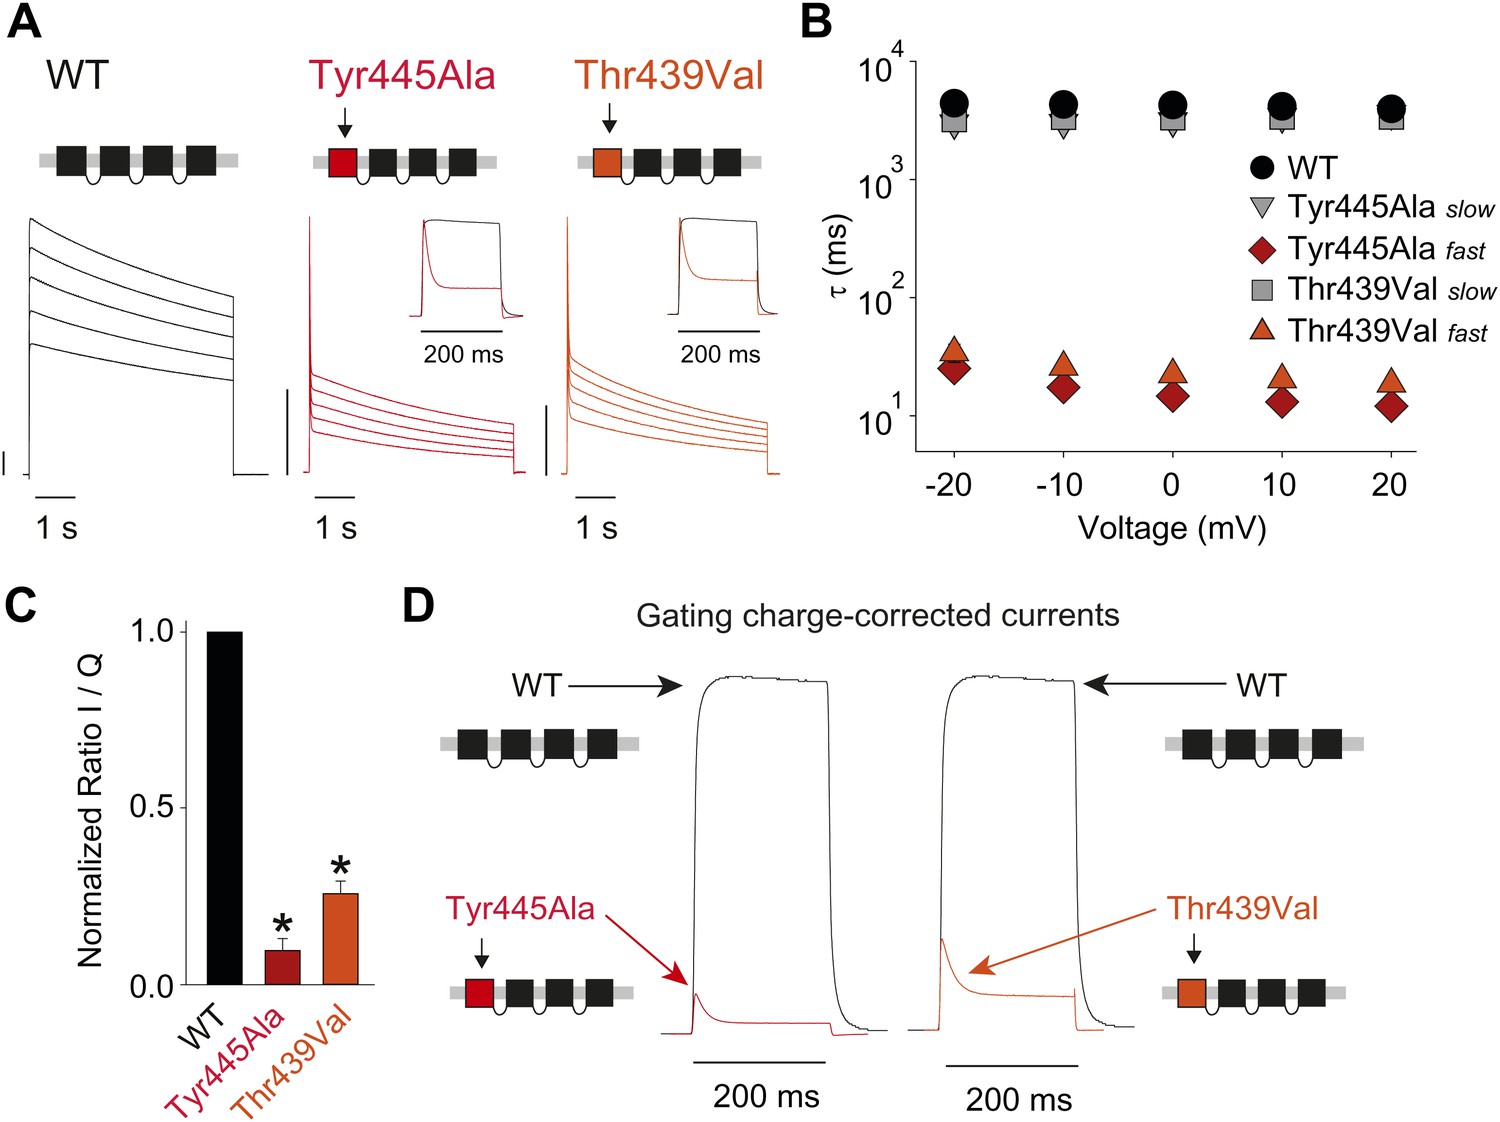
Breaking the Tyr445–Thr439 inter-subunit H-bond results in rapid inactivation.
(A) Concatemer structure and representative currents (5 s pulses from −20 mV to +20 mV, 10 mV increments) for WT, Tyr445Ala and Thr439Val concatemers, respectively. The vertical scale bars indicate 2 μA. The insets compare normalized currents in response to a +20 mV step for WT and Tyr445Ala or Thr439Val concatemers over a short (200 ms) time scale (see Figure 5—figure supplement 1 for details on TEA sensitivity; see Figure 5—figure supplement 2 for gating currents at hyperpolarized potentials with Tyr445Ala and Thr439Val concatemers); (B) Averaged inactivation time constants over different voltages for the constructs shown in (A), with rates for Tyr445Ala and Thr439Val concatemers split into fast and slow components (single exponentials were fit to the first 50 ms and the remainder of the depolarization, respectively). Note the logarithmic scaling; (C) Ratio of maximal ionic current to gating charge (both recorded at +20 mV) for WT, the Tyr445Ala and the Thr439Val concatemers (gating currents were recorded in the presence of 10 μM agitoxin II, not shown); *p<0.05 (WT vs mutants); (D) Comparison of ionic currents recorded at +20 mV normalized to the amount of gating charge recorded from WT concatemers and the Tyr445Ala (left panel) and the Thr439Val (right panel) concatemers, respectively.
Figure 5—figure supplement 1
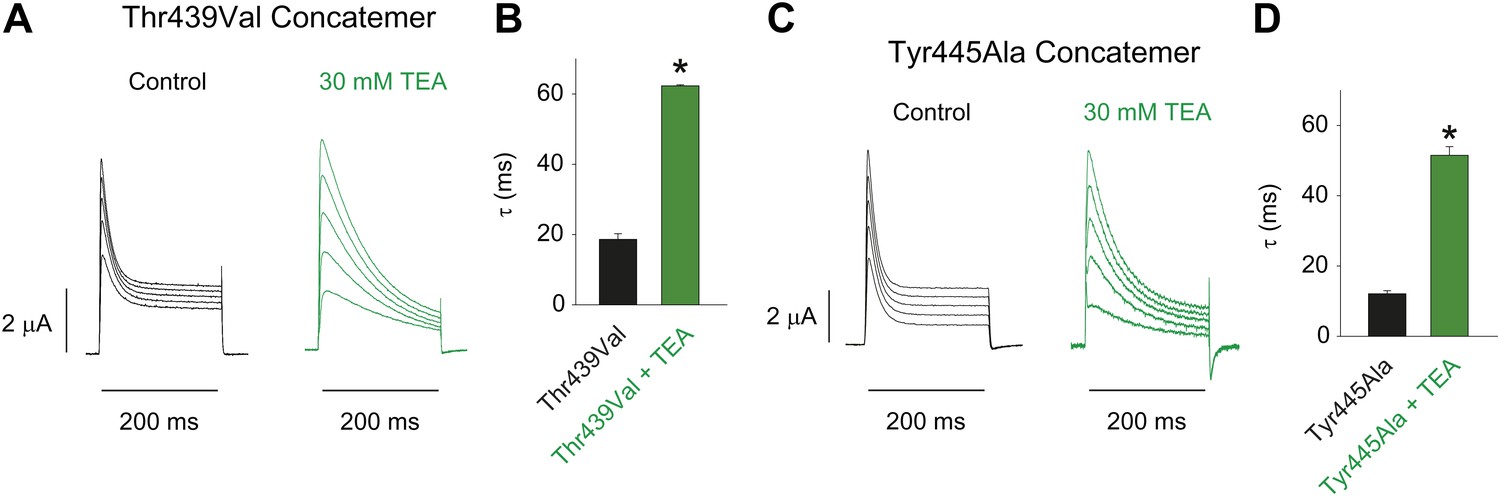
Characterizing the Thr439Val and Tyr445Ala concatemers.
(A)/(C) Representative recordings from Thr439Val (A) and Tyr445Ala (C) concatemers in the absence (black) or presence (green) of 30 mM TEA (−20 mV to +20 mV, 10 mV increments), clearly demonstrating their sensitivity to extracellular TEA, a hallmark of slow inactivation; (B)/(D) Averaged inactivation time constants at +20 mV for Thr439Val (B) and Tyr445Ala (D) concatemers (single exponentials were fit to the first 50 ms of the control, and to the entire 200 ms of the depolarization in the presence of TEA).
Figure 5—figure supplement 2
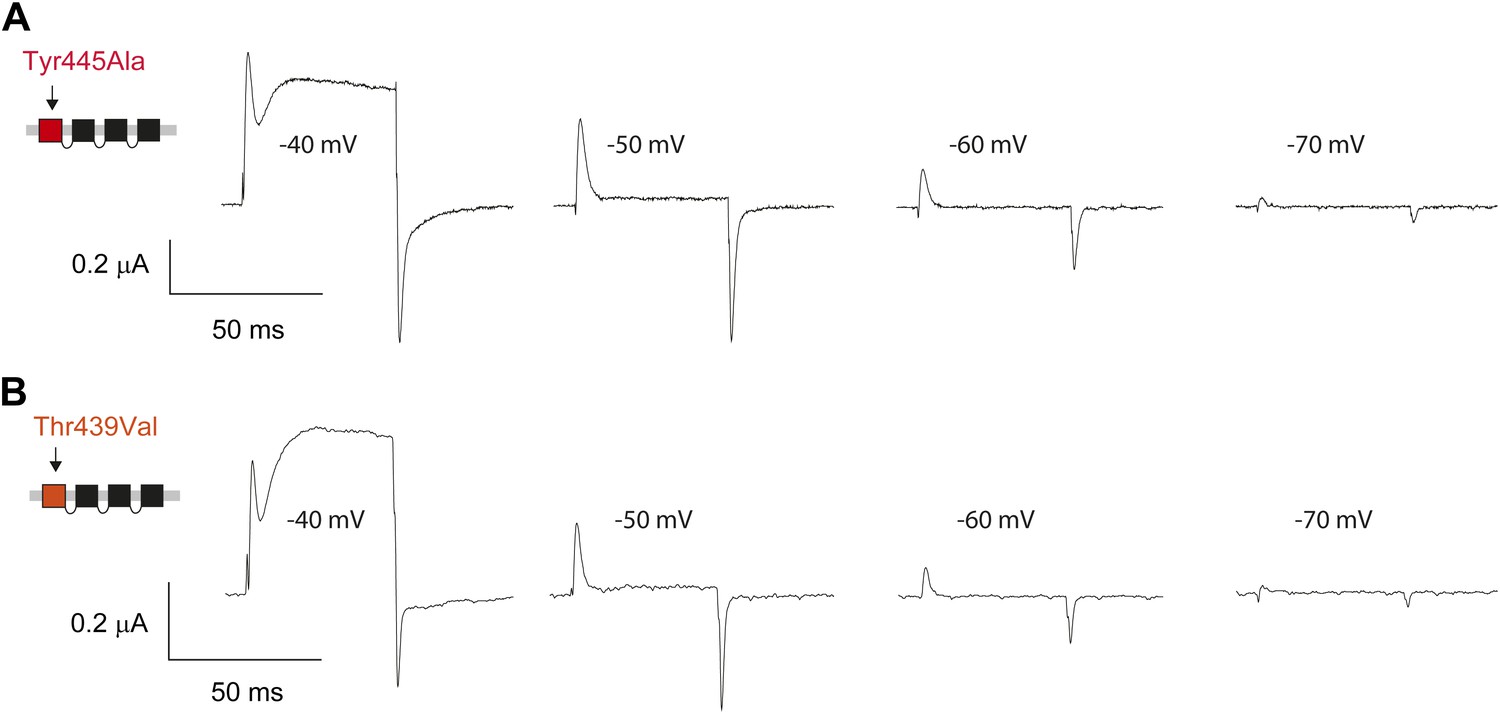
Pronounced gating currents at hyperpolarized potentials in Tyr445Ala and Thr439 Val concatemers.
(A)/(B) Representative currents of Tyr445Ala concatemers (A) and Thr439Val concatemers (B) showing signicant gating currents before the onset of ionic currents at around −40 mV (50 ms depolarizations from a holding potential to the indicated test potential).
Figure 6 with 3 supplements
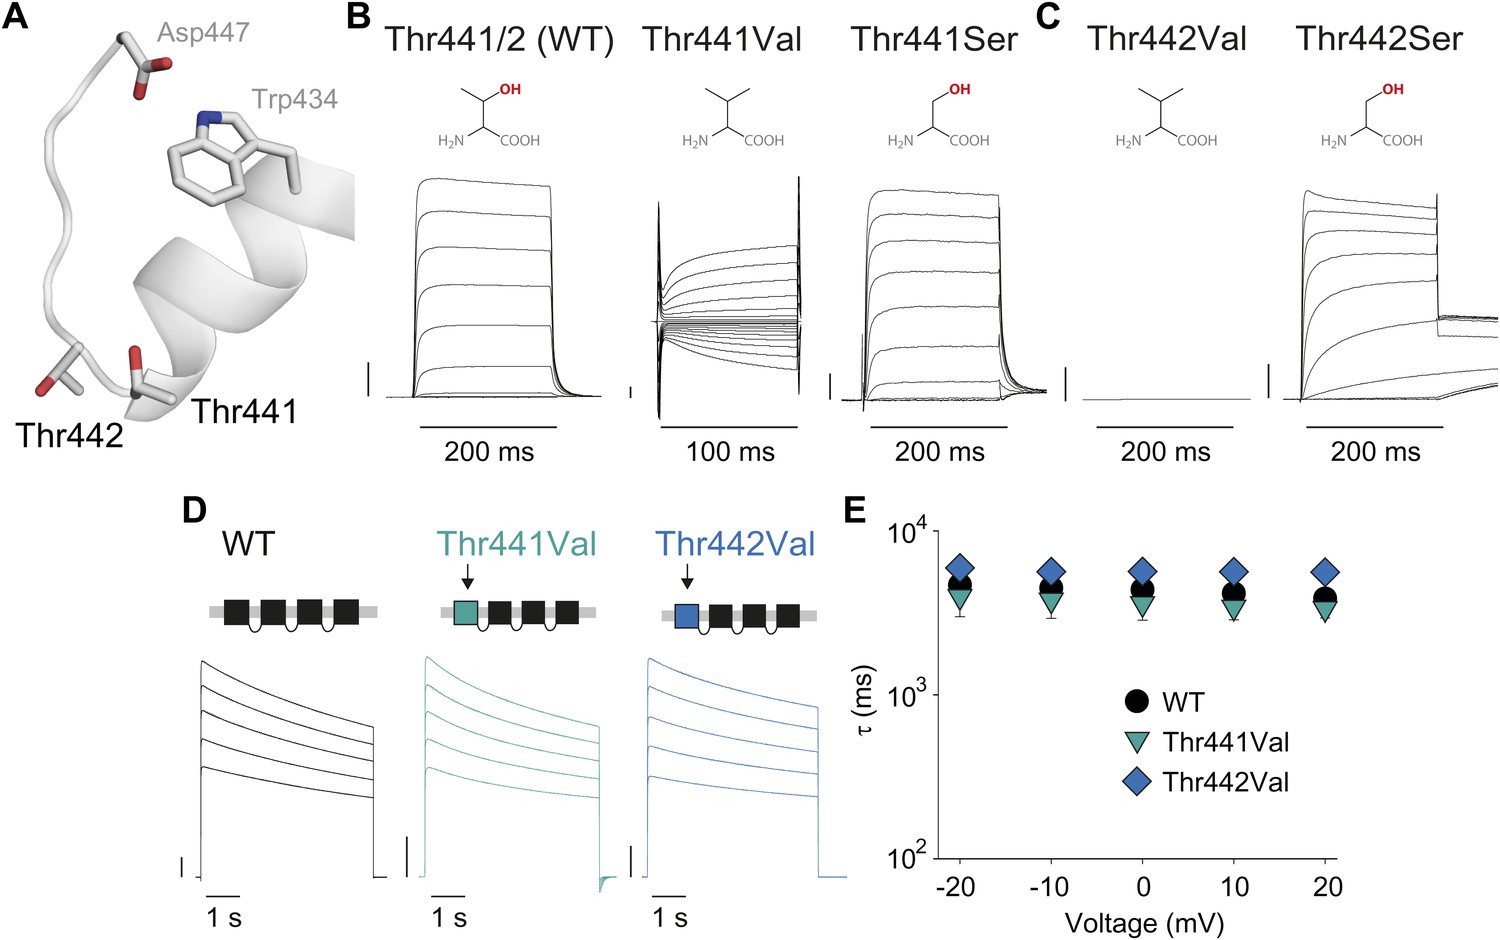
Thr441 and Thr442 are critical to channel function but not inactivation.
(A) Structure of a Kv1.2/2.1 chimera (2R9R) pore region highlighting the positions of Thr441 and Thr442 at the bottom of the selectivity filter (Asp447 and Trp434 are shown for reference; all by Shaker numbering); (B, C) Chemical structures and (normalized) representative currents for different side chains in position 441 (B) and 442 (C), respectively (−80 mV to +20 mV, 10 mV increments for WT, Thr441Ser and Thr442Ser; −200 mV to +150 mV, 10 mV increments for Thr441Val and a single pulse to +20 mV for Thr442Val). Note that recordings for Thr441Val were conducted from a holding potential of 0 mV with no leak subtraction. The vertical scale bars indicate 1 μA. See Figure 6—figure supplement 1 for details on the loss of potassium selectivity of Thr441Val. GVs and inactivation behavior of Thr441Ser and Thr442Ser are shown in Figure 6—figure supplement 2; (D) Concatemer structure and representative currents (5 s pulses from −20 mV to +20 mV, 10 mV increments) for WT, Thr441Val and Thr442Val concatemers, respectively. The vertical scale bars indicate 2 μA. The small inward tail current for Thr441Val could indicate reduced potassium selectivity; (E) Averaged inactivation time constants over different voltages for the constructs shown in (D); similar results were obtained with longer (20 s) depolarizations, see Figure 6—figure supplement 3.
Figure 6—figure supplement 1
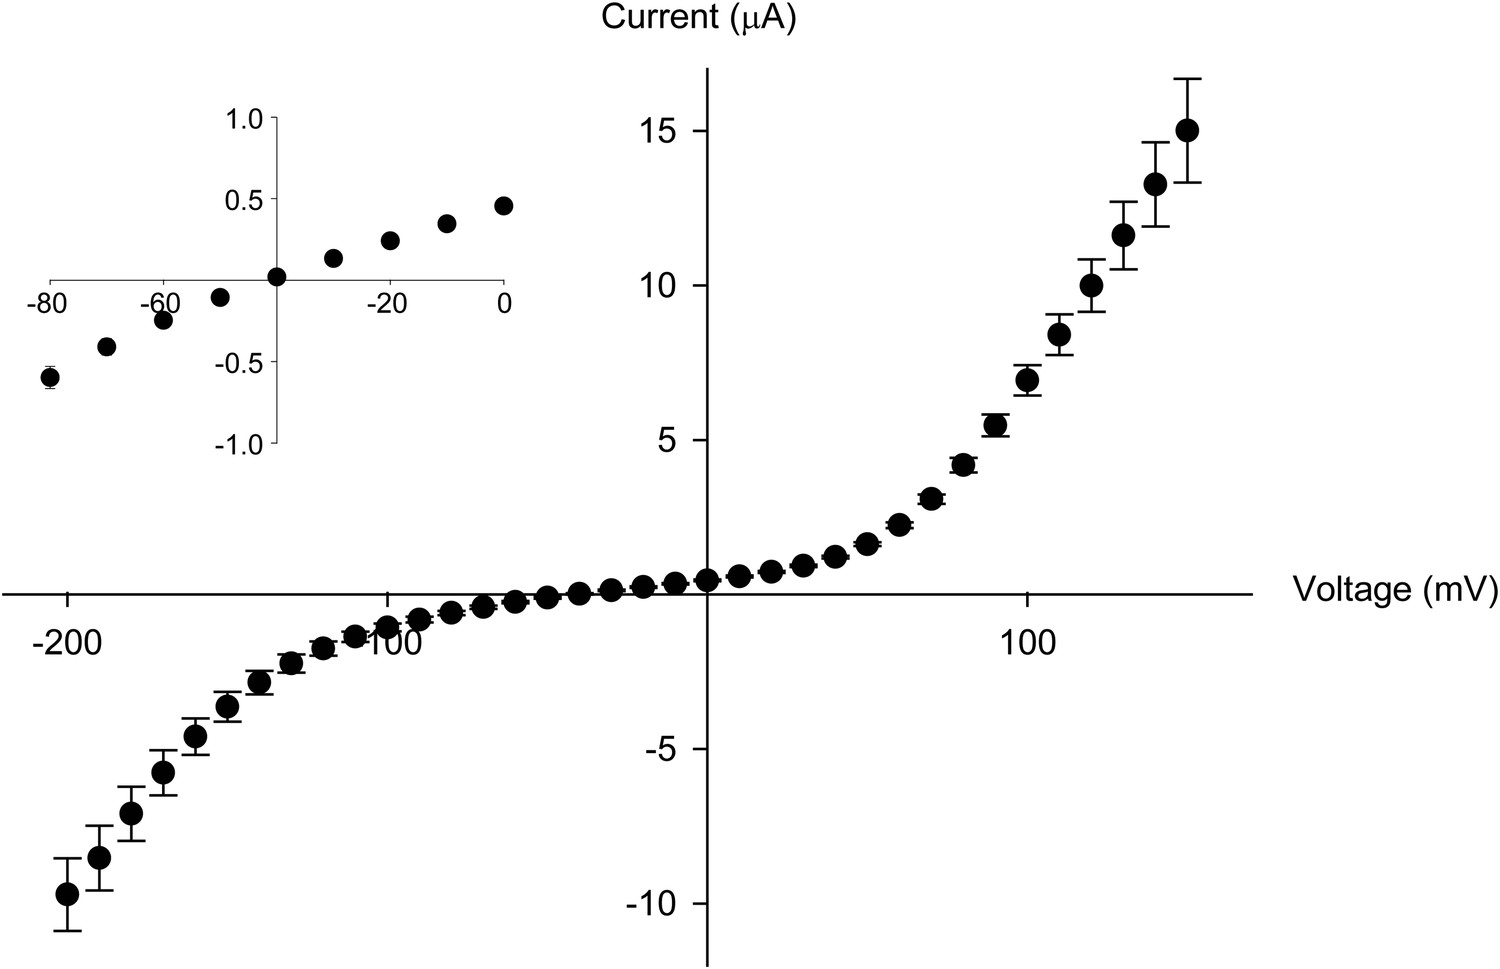
The Thr441Val mutation results in a loss of potassium selectivity.
Current vs voltage plot for the Thr441Val mutant (n = 9). The inset shows that the current reverses around −40 mV.
Figure 6—figure supplement 2
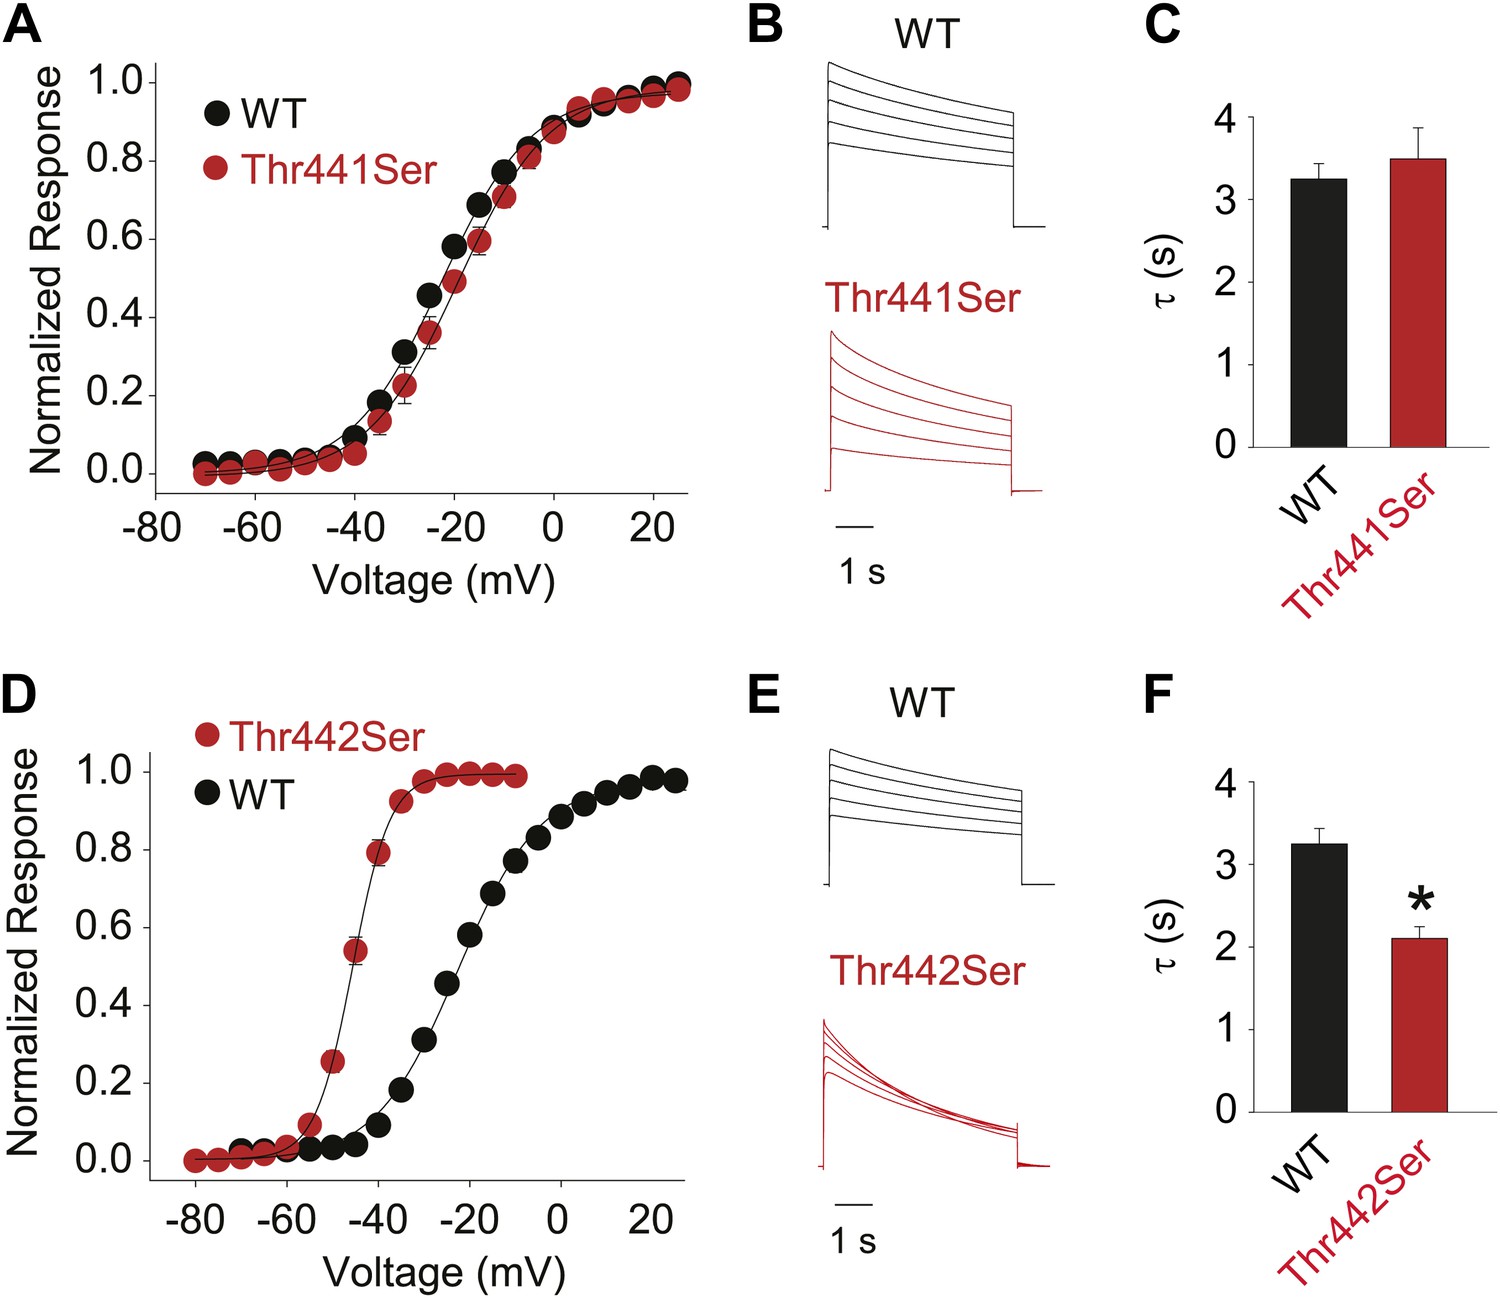
Hydroxyl moieties are critical to channel function in positions 441 and 442.
(A)/(D) GVs for Thr441Ser (A) and Thr442Ser (V1/2 Thr441Ser: −19.7 ± 1.5 mV; V1/2 Thr442Ser: −45.6 ± 0.6 mV; vs V1/2 for WT: −23.5 ± 0.9 mV); (B)/(E) Representative currents for WT and Thr441Ser (B) and WT and Thr442Ser (E), respectively (5 s pulses from −20 mV to +20 mV, 10 mV increments); (C)/(F) Averaged inactivation rates at +20 mV (fit with a single exponential) for WT and Thr441Ser (C) and WT and Thr442Ser (F), respectively; *p≤0.05.
Figure 6—figure supplement 3

Comparison of inactivation time constants using different pulse durations.
Averaged inactivation time constants obtained from WT, Thr441Val and Thr442Val concatemers by fitting the current decay during 5 s (colored symbols, reproduced from Figure 6E) or 20 s (empty symbols) depolarizations to +20 mV with a single exponential.
Figure 7
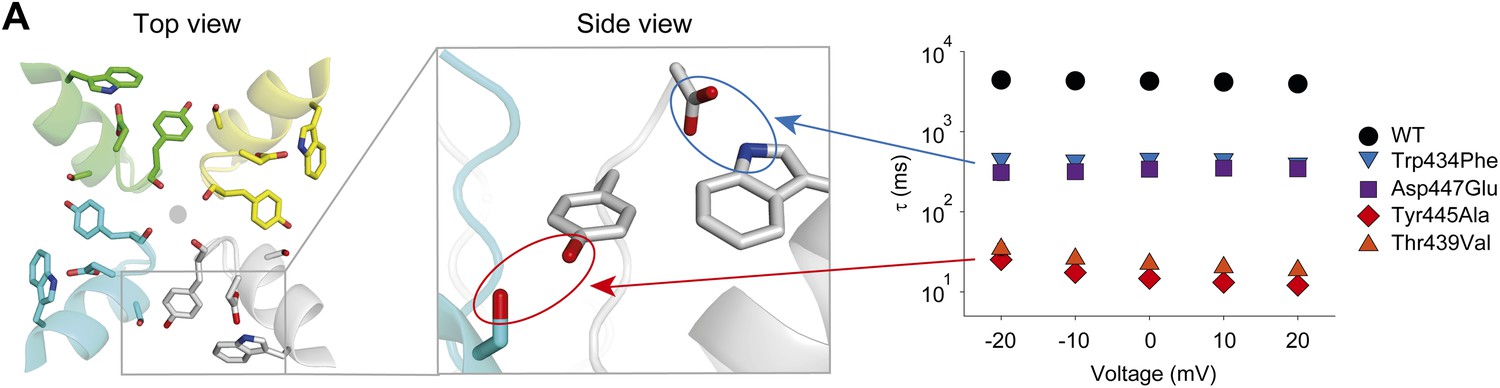
A network of inter- and intra-subunit H-bonds regulates slow inactivation.
(A) The left panel shows a top view of pore helix and selectivity filter (based on the Kv1.2/2.1 chimera structure (2R9R); individual subunits are colored in gray, cyan, green and yellow, respectively). Note the backbone carbonyls are shown for Tyr445 to highlight their role in the coordination of potassium ions (gray circle). The center panel highlights the two proposed H-bonds: Thr439–Tyr445 (inter-subunit, red oval,) and Asp447–Trp434 (intra-subunit, blue oval), all by Shaker numbering. The panel on the right compares the averaged inactivation time constants over a range of voltages for different concatemers (data reproduced from Figure 3 and Figure 5; note that for Tyr445Ala and Thr439Val only the fast components are displayed). Note the arrows pointing to the respective interactions in the model in the center.
Tables
Table 1
Mutants that result in gating currents only show very similar gating charge-voltage (QV) relations
| Construct | V1/2 (mV) | Z | n |
|---|---|---|---|
| Trp434Phe | −52.9 ± 0.9 | 5.2 ± 0.3 | 6 |
| Asp447Asn | −53.4 ± 0.9 | 5.3 ± 0.3 | 6 |
| Thr439Val | −51.0 ± 1.4 | 5.5 ± 0.3 | 5 |
| Tyr445Ala | −50.3 ± 2.1 | 5.3 ± 0.4 | 4 |
-
Displayed are the values for the midpoints (V1/2), the amount of gating charge (Z) of the QVs (derived from the OFF gating currents) and the number of experiments conducted (n).
Download links
A two-part list of links to download the article, or parts of the article, in various formats.
Downloads (link to download the article as PDF)
Open citations (links to open the citations from this article in various online reference manager services)
Cite this article (links to download the citations from this article in formats compatible with various reference manager tools)
Hydrogen bonds as molecular timers for slow inactivation in voltage-gated potassium channels
eLife 2:e01289.
https://doi.org/10.7554/eLife.01289


