Reciprocal virulence and resistance polymorphism in the relationship between Toxoplasma gondii and the house mouse
- University of Cologne, Germany
- Fundação Calouste Gulbenkian, Instituto Gulbenkian de Ciência, Portugal
Figures
Figure 1
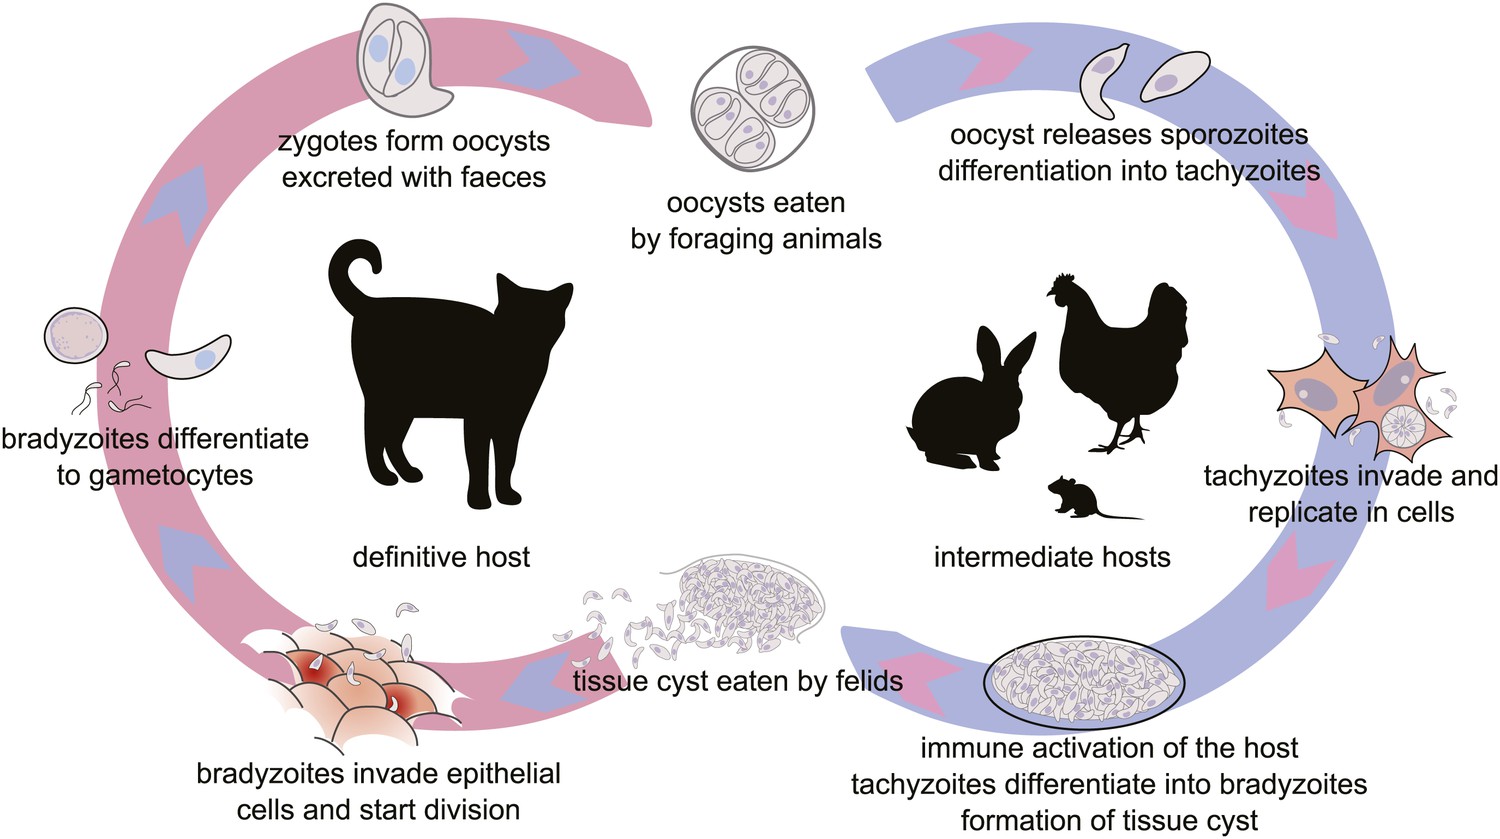
The life cycle of T. gondii.
All warm blooded animals may serve as intermediate hosts, which are infected by ingestion of food or water contaminated by oocysts. Felids, the definitive hosts, are infected by ingesting tissue cysts from their prey. The intermediate phase of the life cycle may be prolonged by carnivory between intermediate hosts (not shown). Modified from free-license pictures.
Figure 2 with 2 supplements
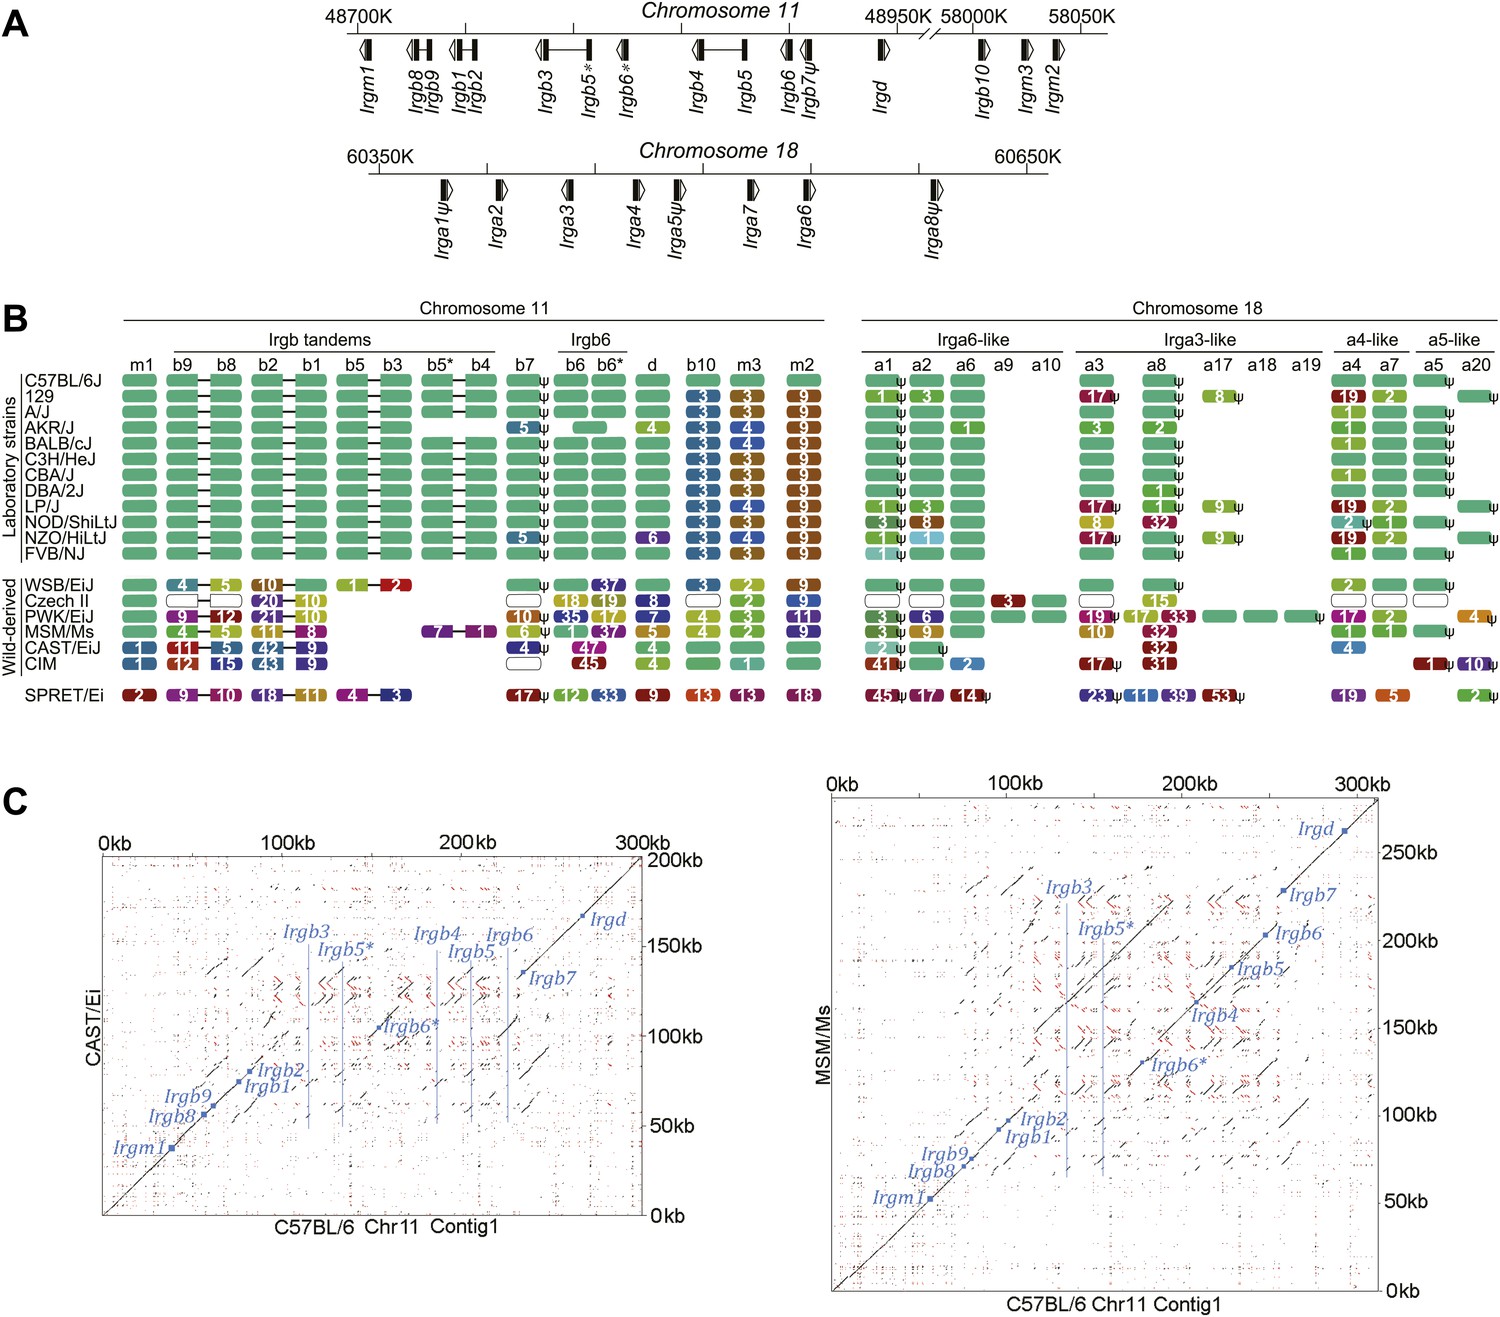
IRG protein polymorphism in inbred mouse strains.
(A) Linear order of IRG gene clusters on Chr 11 and Chr 18 of mouse strain BL/6. (B) Polymorphism at the protein level in the IRG genes of Chr 11 and Chr 18. Irga9–Irga20 are absent from BL/6 and are inferred from resequencing data. Each colour block represents one IRG open reading frame and shows the number of amino acid substitutions/indels relative to the BL/6 allele. The colours of the blocks indicate their phylogenetic relationship (Figure 2—figure supplement 1). Open blocks in strains Czech II and CIM indicate homologues expected but not yet found. ‘ψ’ indicates probable pseudogenes. (C) Dot plots of the longer IRG gene clusters on Chr 11 in CAST/Ei and MSM/Ms against the BL/6 genomic sequence. Small blue squares show the positions of homologous coding units, blue lines indicate the positions of genes in BL/6 that are absent from the other genomes.
Figure 2—figure supplement 1
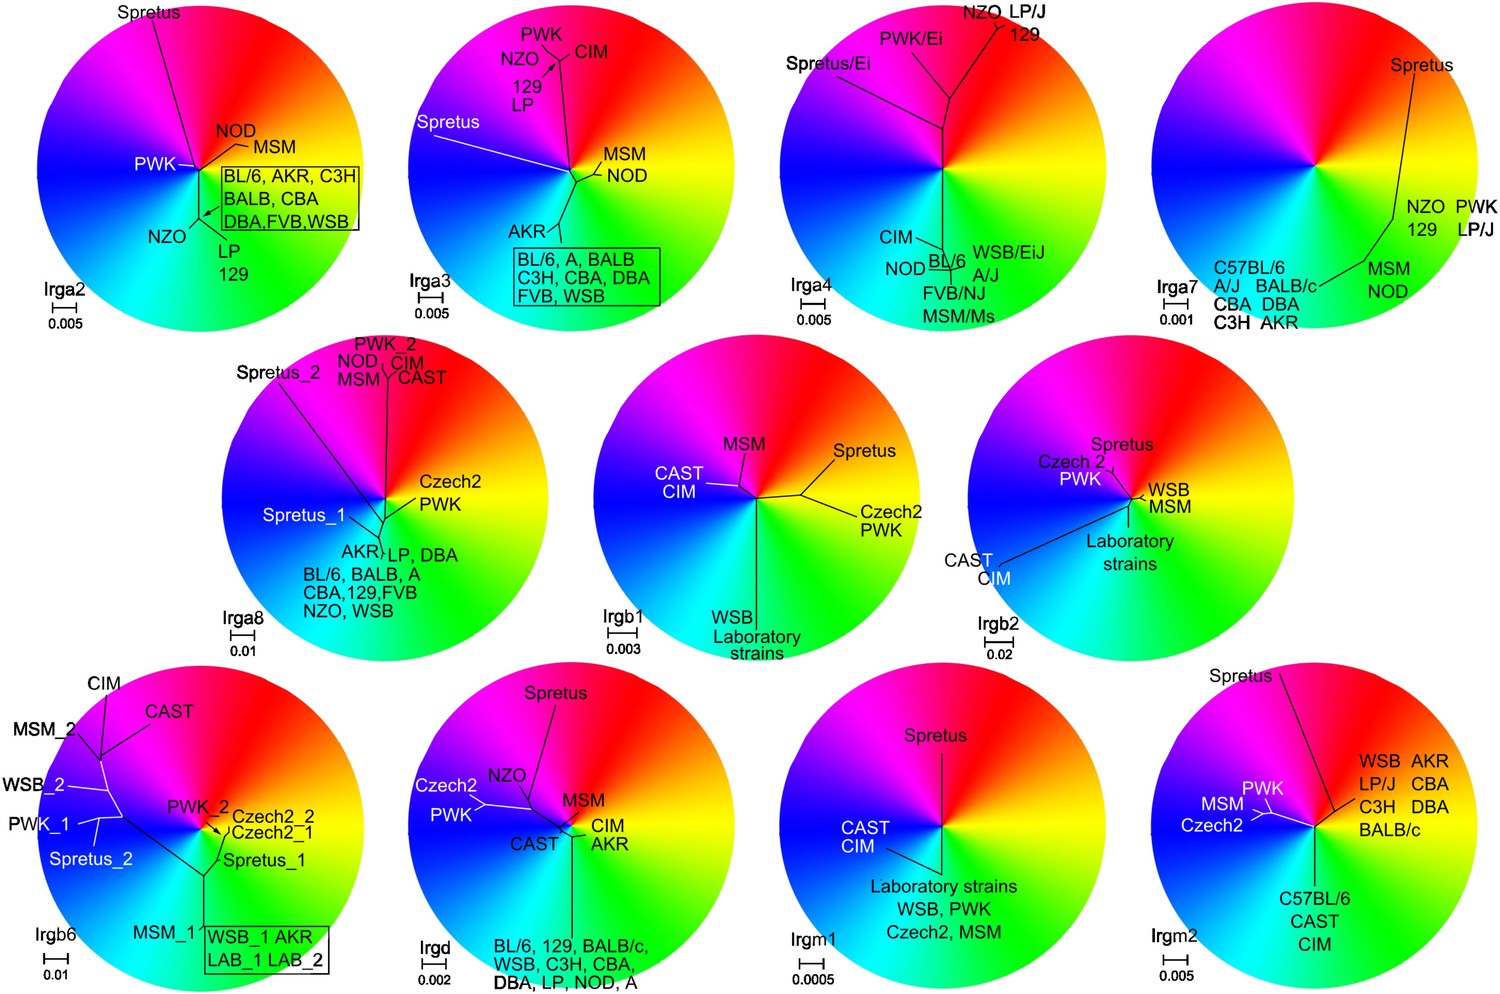
Unrooted phylogenetic trees of the indicated IRG genes were overlapped with RGB colour wheels.
In each case the branch containing the taxon of BL/6 was set to 6 o'clock on the colour wheel. The centre of the colour wheel in some cases represents one of the putative roots of the phylogenetic tree. In other cases, however, the position of the wheel centre was adjusted for a better resolution of sequence differences (e.g., for Irga7). Taxa with similar colours (e.g., red and orange) have a relatively closer sequence relationship than taxa with contrasting colours (e.g., red and green).
Figure 2—figure supplement 2
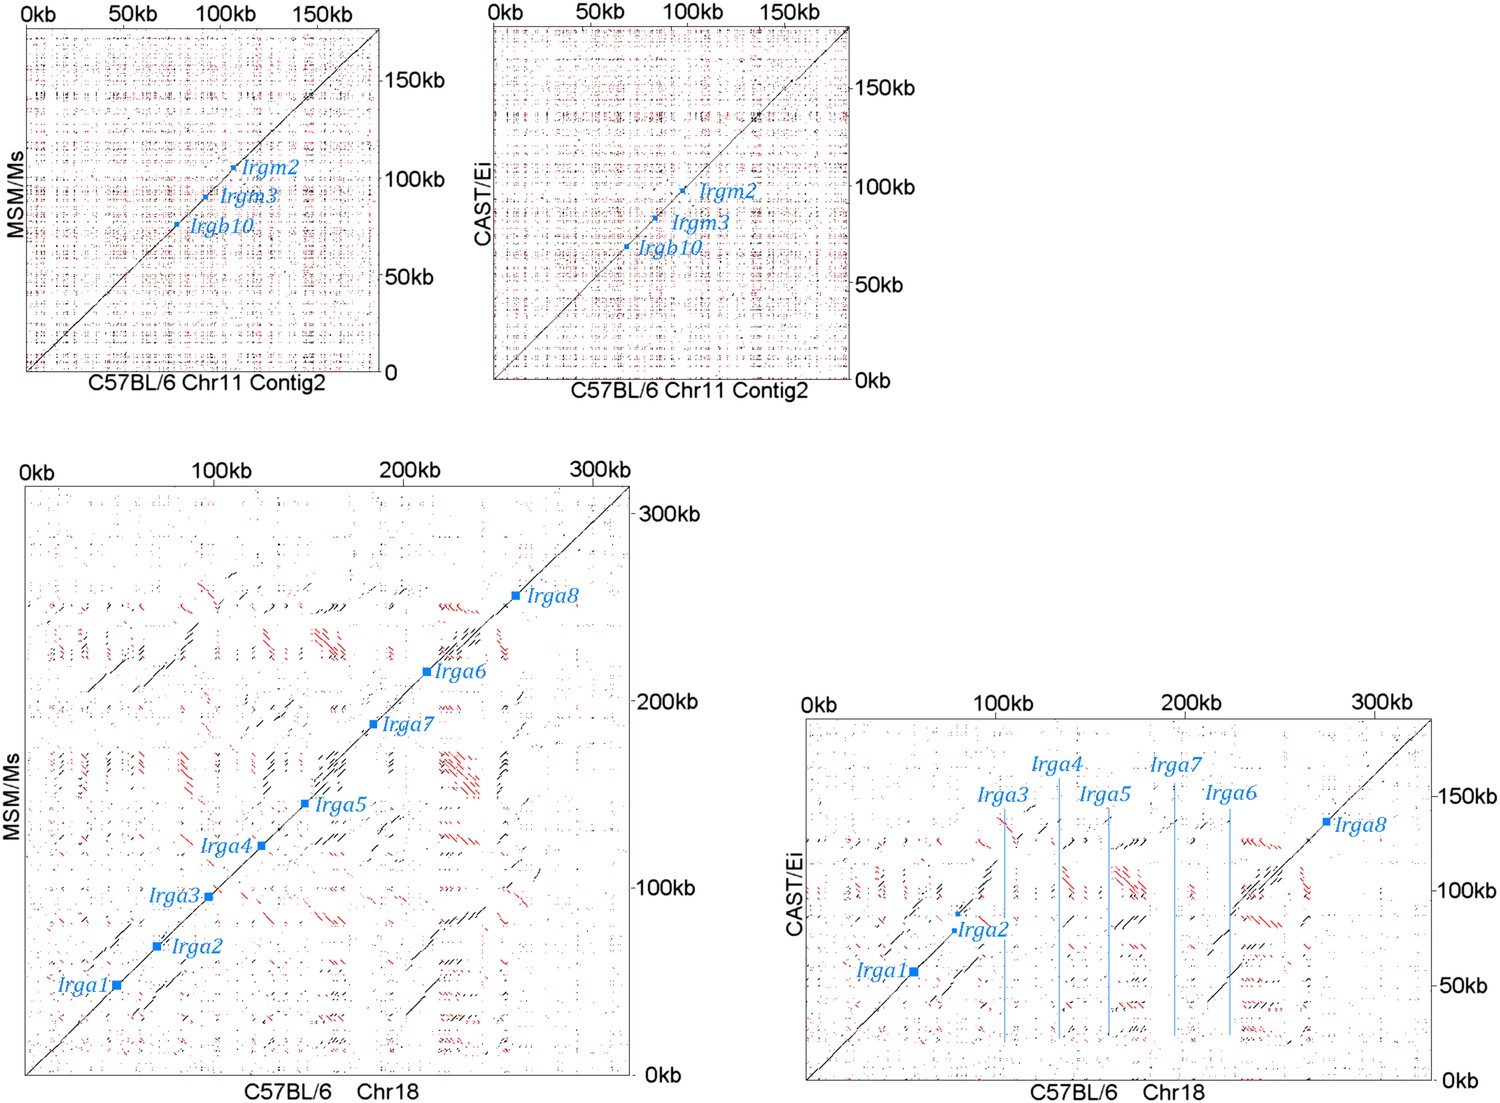
Chr 11 (shorter contig containing Irgb10, Irgm2 and Irgm3) of CAST/Ei and MSM/Ms against the BL/6 genomic sequence (Top).
Chr 18 contigs of CAST/Ei and MSM/Ms against the BL/6 genomic sequence (Bottom). Small blue squares show the positions of homologous coding units, blue lines indicate the positions of genes in BL/6 that are absent from the other genomes.
Figure 3 with 4 supplements

Polymorphism of five IRG genes.
(A) Phylogenetic trees of five IRG genes sequenced from DNA of wild mice collected from various sites in Eurasia. Green, blue and red taxa represent M. m. domesticus, M. m. musculus and M. m. castaneus samples respectively. The black taxon represents Mus spretus. Alleles found in heterozygous condition in certain mice are indicated by numbers appended to individual mouse identifiers (some haplotypes contain 2 Irgb6 paralogous genes (Figure 2B), hence potentially up to 4 alleles). Bootstrap values are shown if >90. The sequences are avaliable in (Figure 3—source data 2-6). (B) The nucleotide pairwise diversities (π) of genes across seven laboratory and wild-derived inbred mouse strains (BL/6, AKR/J, MSM/Ms, CAST/Ei, PWK/PhJ, WSB/Ei and Spretus/EiJ). Grey bars indicate the distribution of π from 50 ‘random’ genes (Figure 3—source data 1). The π values of individual IRG and MHC genes are indicated by arrows.
-
Figure 3—source data 1
Nucleotide diversities of 50 random genes in seven mouse strains.
Seven laboratory and wild-derived inbred mouse strains were analysed. The ORFs of 50 random genes were selected based on their position in the C57BL/6 genome (NCBI reference assembly build 37). In addition, selected IRG and MHC members were assembled, and Tajima's π values were calculated. Klra4 is closest to 130M in Chr 6, but lost in many mouse strains (Cutler and Kassner, 2008). The adjacent gene Klra5 was used instead.
- https://doi.org/10.7554/eLife.01298.008
-
Figure 3—source data 2
Alignment of Irgm1 alleles, in FASTA format.
- https://doi.org/10.7554/eLife.01298.009
-
Figure 3—source data 3
Alignment of Irga6 alleles, in FASTA format.
- https://doi.org/10.7554/eLife.01298.010
-
Figure 3—source data 4
Alignment of Irgb2 alleles, in FASTA format.
- https://doi.org/10.7554/eLife.01298.011
-
Figure 3—source data 5
Alignment of Irgb6 alleles, in FASTA format.
- https://doi.org/10.7554/eLife.01298.012
-
Figure 3—source data 6
Alignment of Irgb10 alleles, in FASTA format.
- https://doi.org/10.7554/eLife.01298.013
Figure 3—figure supplement 1
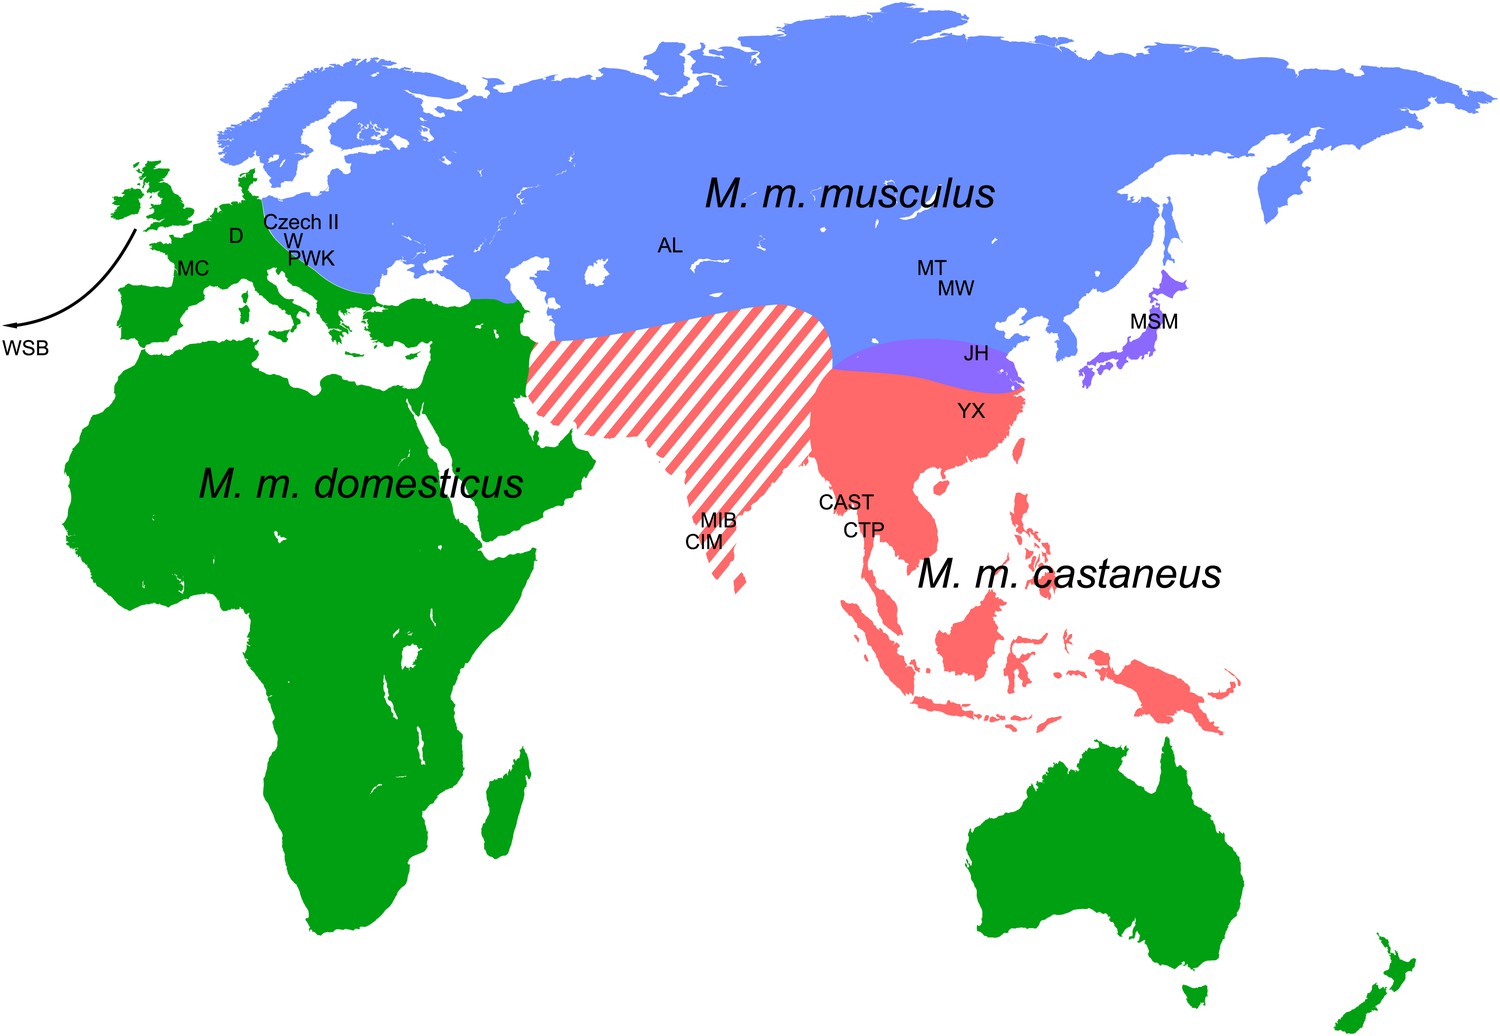
Mouse samples collected for this study.
Colour code relates to the individual subspecies (green—M. m. domesticus, blue—M. m. musculus, red—M. m. castaneus) and corresponds to the text colours for the phylograms displayed in Figure 3 and Figure 3—figure supplement 2–4. Purple colour indicates the hybrid zone of M. m. musculus and M. m. castaneus. The definition of M. m. castaneus in the Indian subcontinent is complex. Modified from Din et al. (1996); Guenet and Bonhomme, 2003.
Figure 3—figure supplement 2
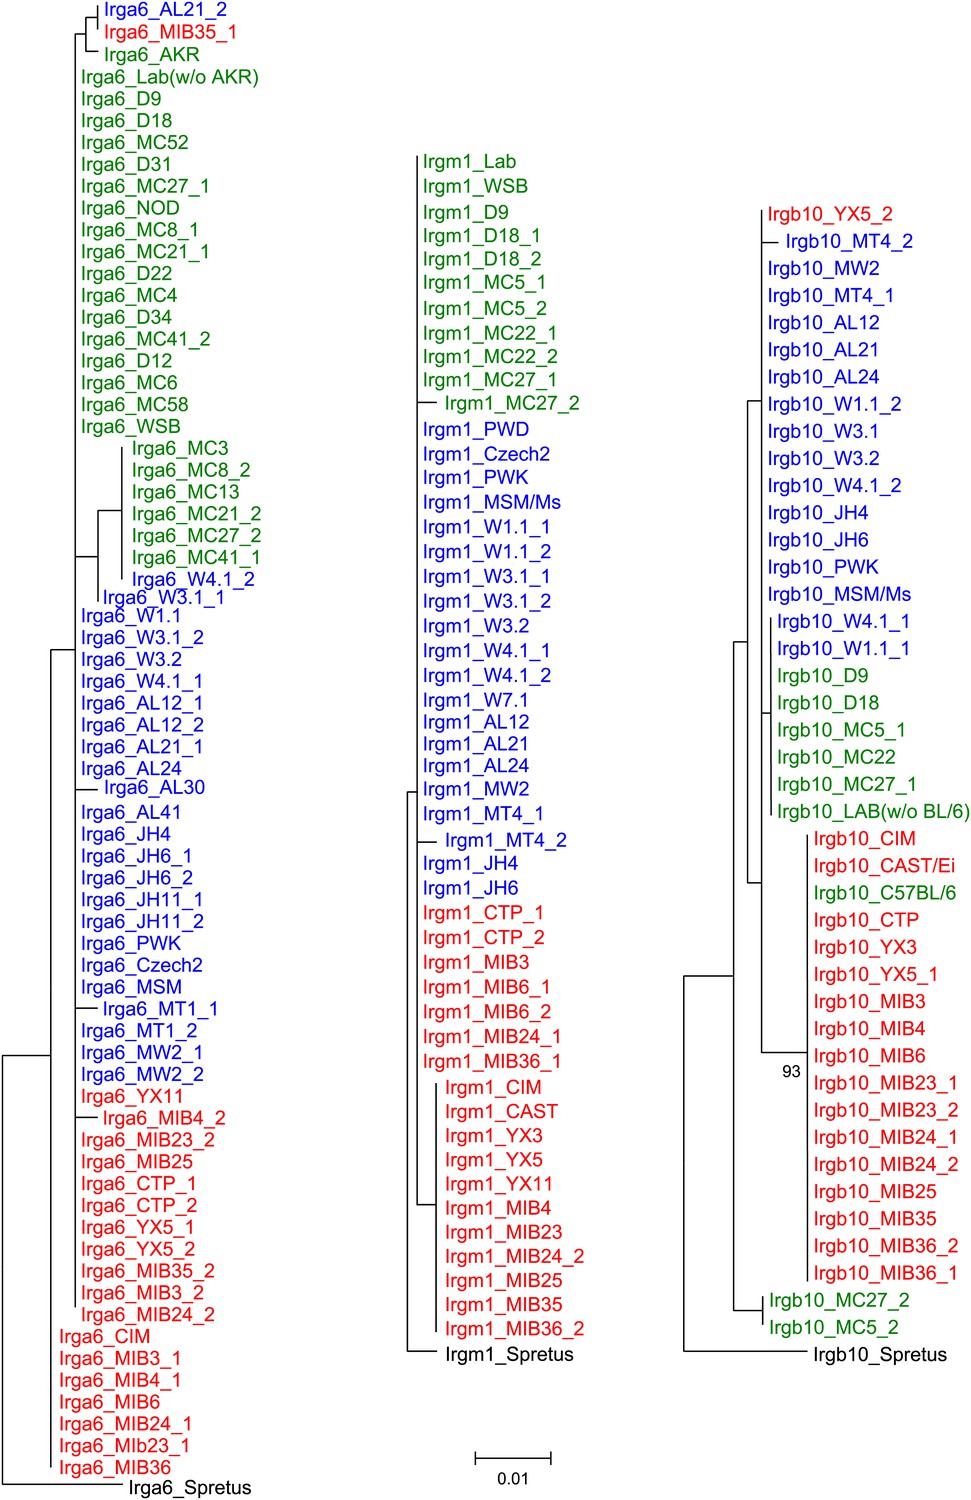
Phylogenetic trees of Irga6, Irgm1 and Irgb10 in mouse strains and wild mice.
https://doi.org/10.7554/eLife.01298.015
Figure 3—figure supplement 3
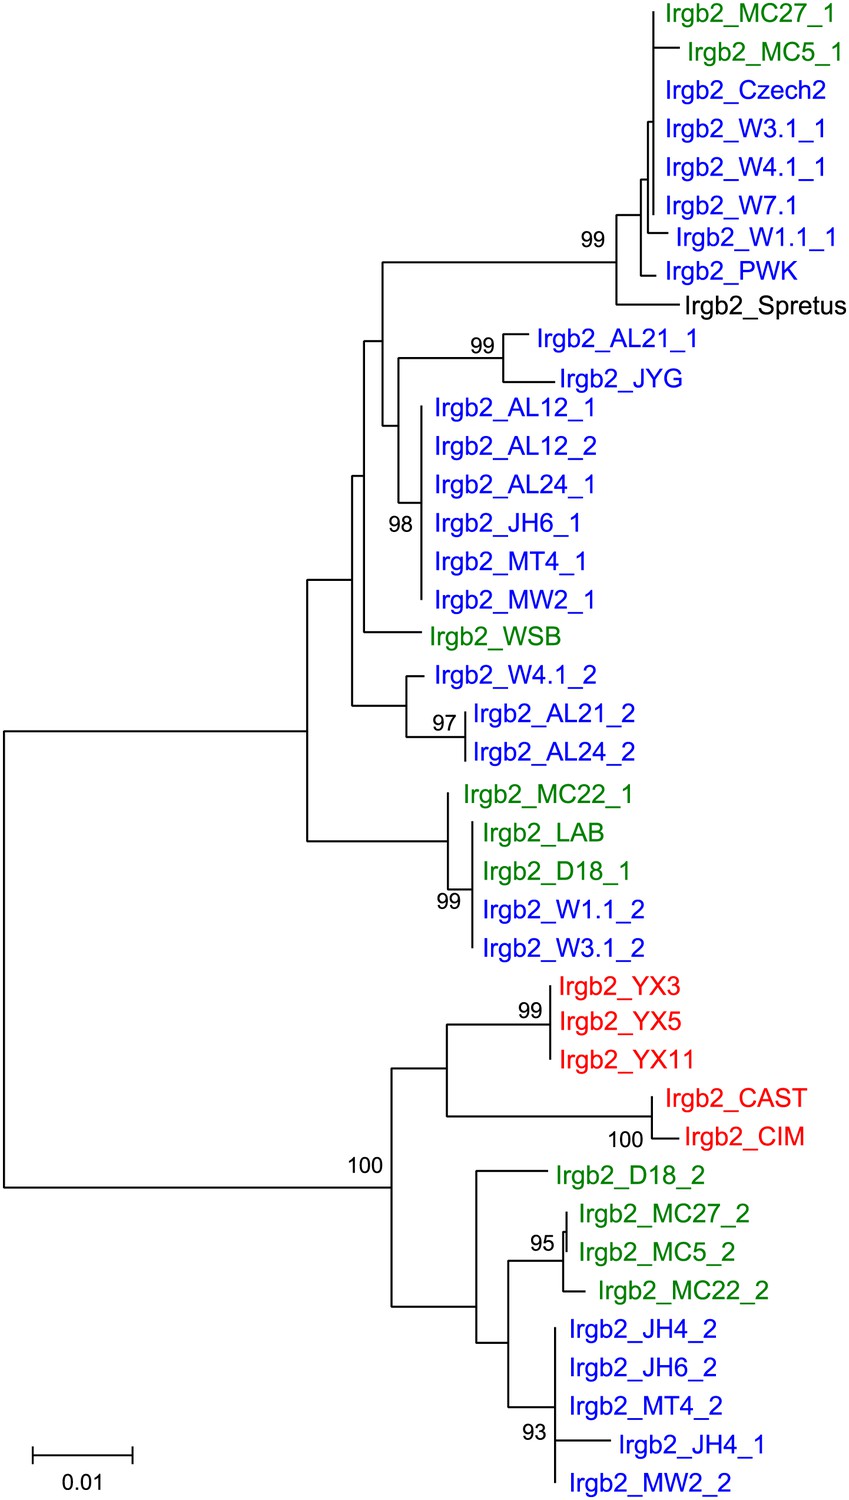
Phylogenetic tree of Irgb2 in mouse strains and wild mice.
https://doi.org/10.7554/eLife.01298.016
Figure 3—figure supplement 4
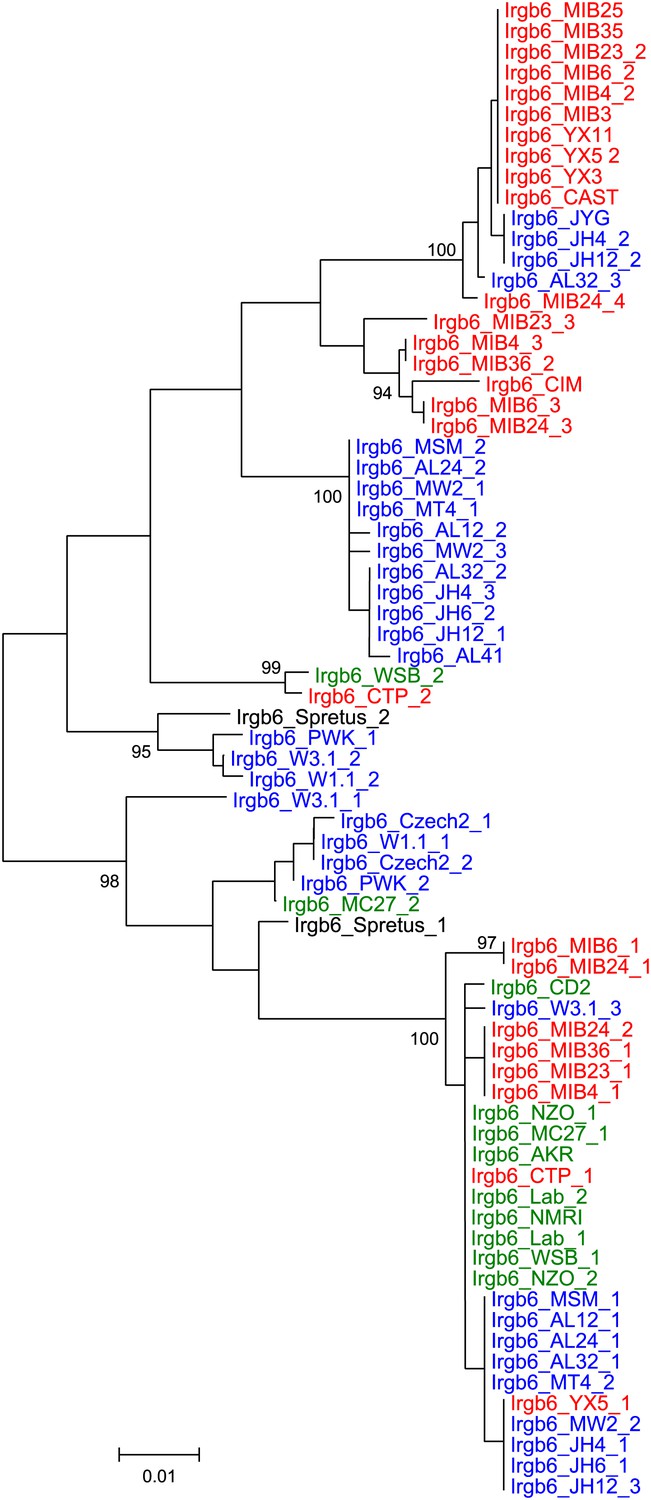
Phylogenetic tree Irgb6 in mouse strains and wild mice.
https://doi.org/10.7554/eLife.01298.017
Figure 4
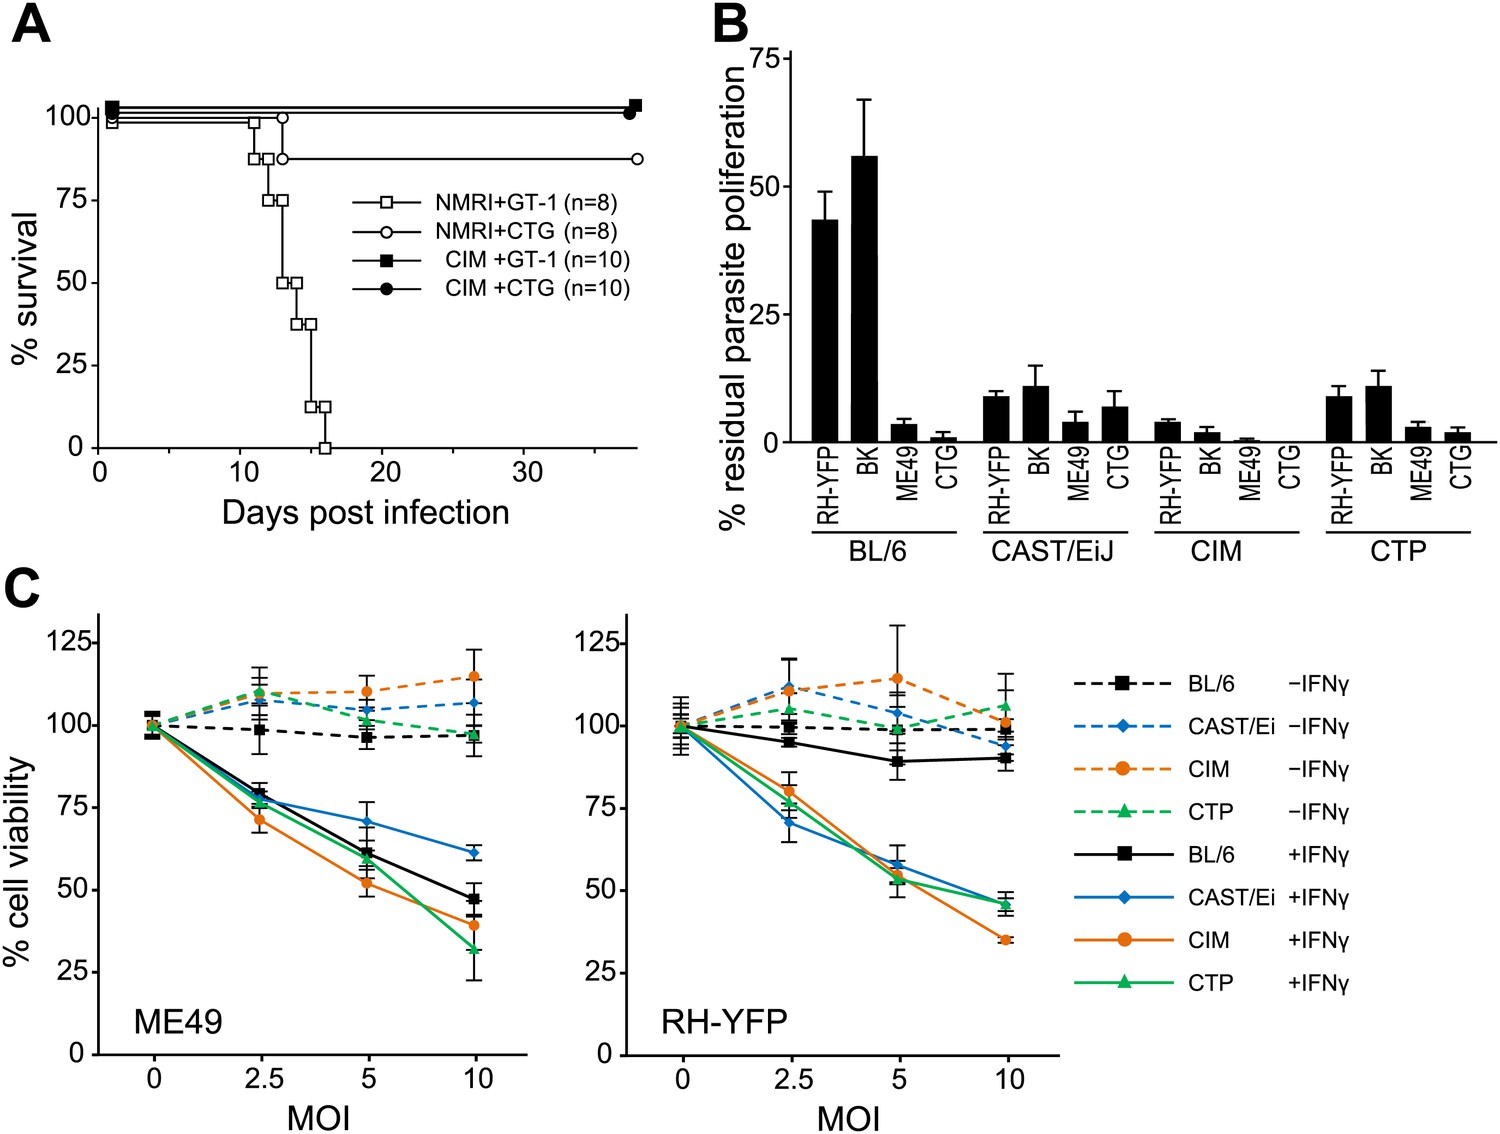
Resistance of wild-derived mouse strains to virulent T. gondii.
(A) Cumulative mortality of NMRI and CIM mice infected with 100 or 300 (data pooled) tachyzoites of the indicated T. gondii strains. (B) IFNγ-mediated growth inhibition of virulent (type I RH-YFP, BK) and avirulent (type II ME49, type III CTG) T. gondii strains in DDC of laboratory (BL/6) and wild-derived, inbred mice (CAST/Ei, CIM, CTP). Proliferation of parasites was measured by 3H-uracil incorporation and is displayed as percentage of residual T. gondii proliferation, as described in ‘Materials and methods’. Error bars show standard deviations of quadruplicate values. (C) IFNγ-dependent reactive cell death of mouse DDC cell lines infected with T. gondii. DDC were either stimulated with 100 U/ml of IFNγ 24 hr prior to infection or left unstimulated. Cells were infected with type II strain ME49 or type I strain RH-YFP at the indicated MOIs for 8 hr. Cell viabilities were measured as described in ‘Materials and methods’ and expressed as percentages of those recorded for uninfected cells (MOI = 0). Error bars show standard deviations of quadruplicate values.
Figure 5
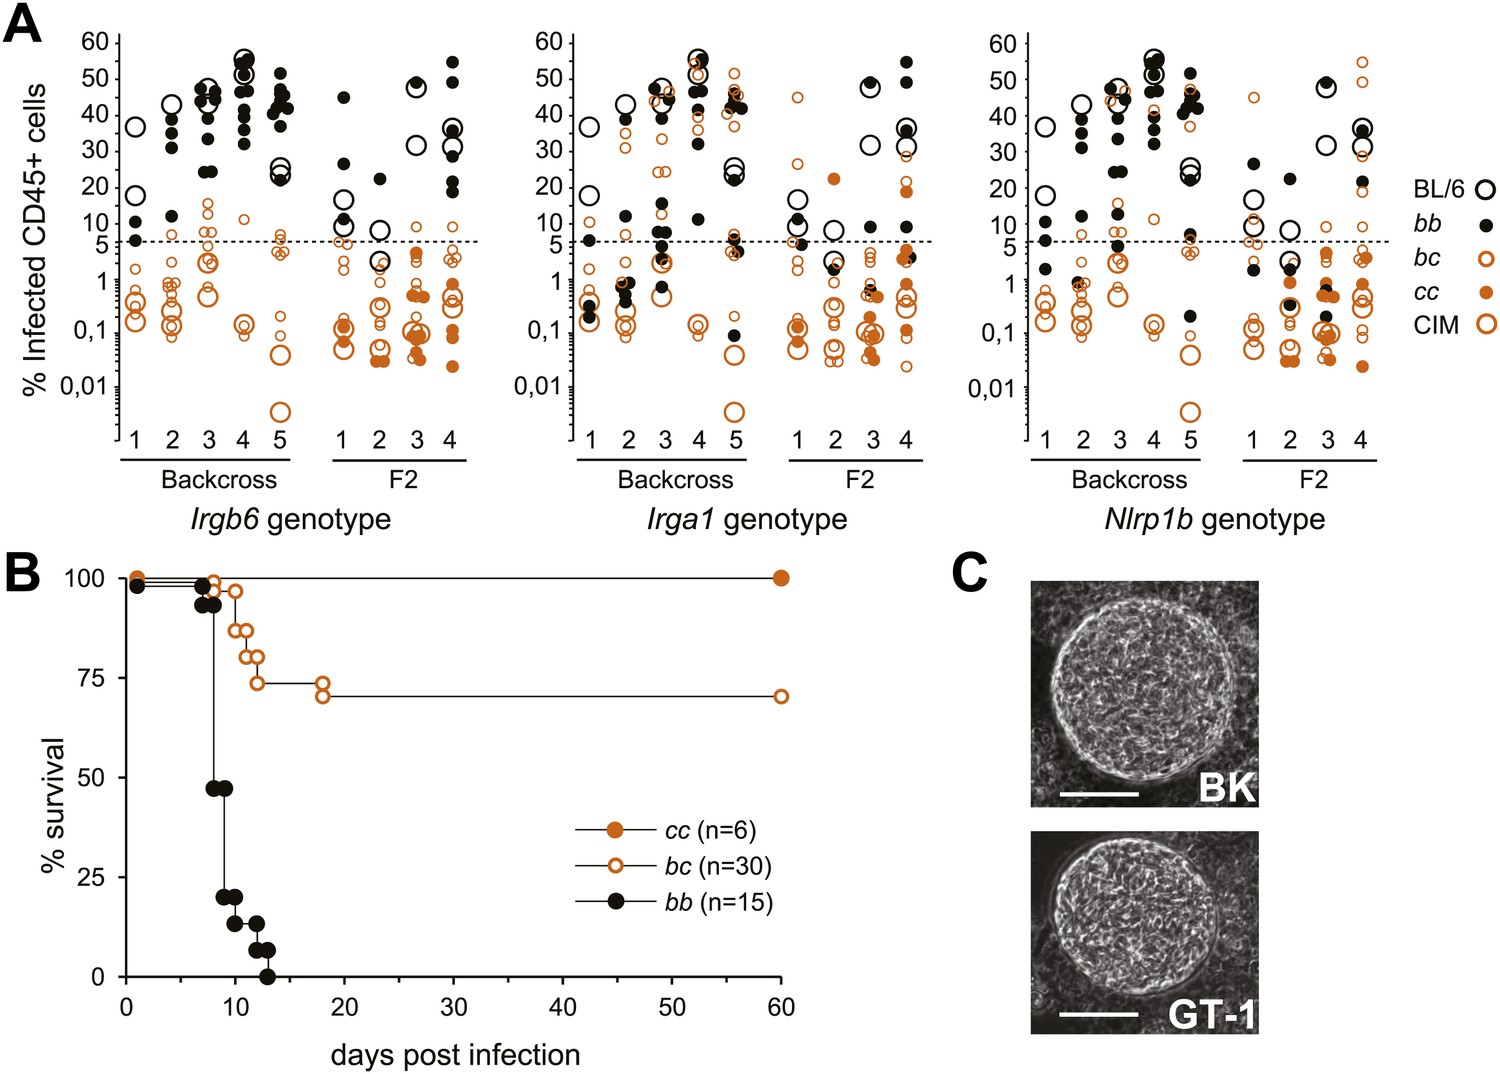
Resistance of CIM mice to virulent T. gondii is dependent on the Chr 11 IRG locus.
(A) Infected CD45+ peritoneal cells in (BL/6×CIM)F1×BL/6 backcross (5 experiments, total 83 mice) and (BL/6×CIM)F2 mice (4 experiments, total 69 mice) 5 days after i.p. injection of 500 RH-YFP tachyzoites. Genotypes at IRG loci and at the Nalp1 locus for backcross and F2 mice are shown (see key) as bb (homozygous BL/6), bc (heterozygous BL/6/CIM) or cc (homozygous CIM). Elimination of infected cells is linked to the CIM haplotype on Chr 11 (n.b. the y-axis is logarithmic below 5%). (B) Cumulative mortality of (BL/6×CIM)F1×BL/6 and (BL/6×CIM)F2 mice infected with 500 RH-YFP tachyzoites. Irgb6 genotypes are shown as in (A). (C) Cysts of type I T. gondii strains in brain homogenates of CIM mice infected 6–8 weeks earlier (quantitation in Table 1). Bar = 20 µm.
Figure 6
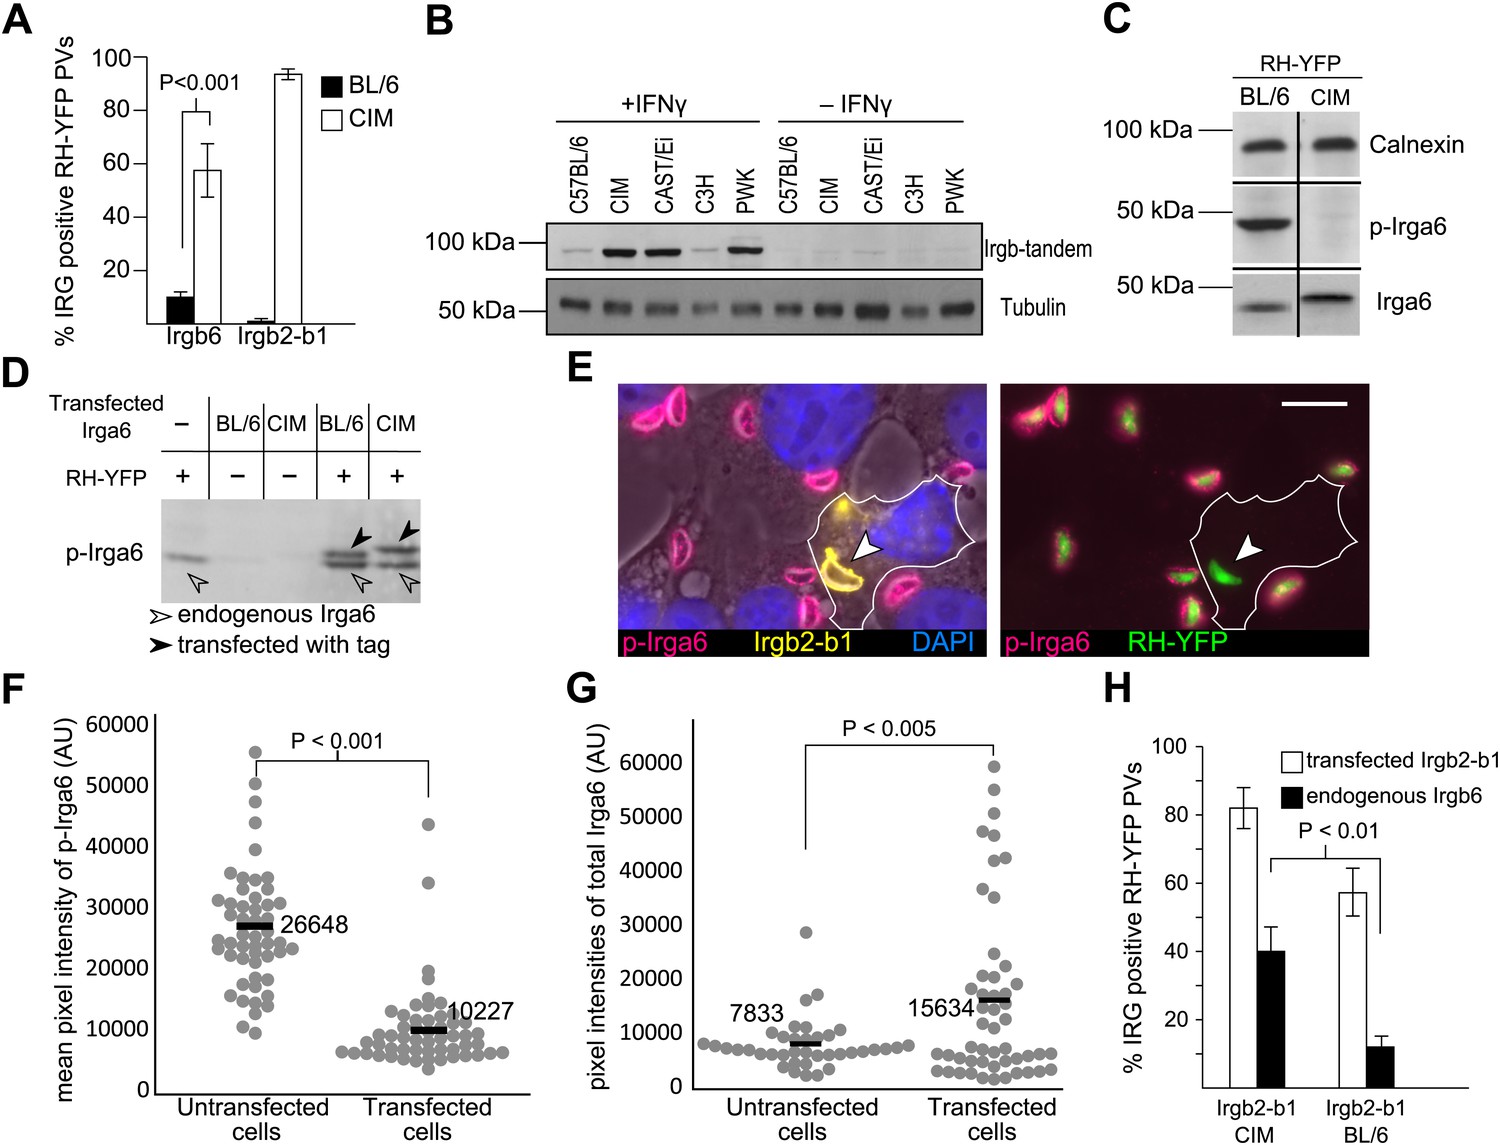
Irgb2-b1CIM protects other IRG members from inactivation.
(A) Immunofluorescent quantitation of loading of Irgb6 and Irgb2-b1 on to RH-YFP vacuoles in IFNγ-induced BL/6 and CIM DDC. (B) Strain dependence of expression levels of Irgb-tandem proteins. (C) Reduced phosphorylation of Irga6CIM on T108 by RH-YFP in IFNγ-induced CIM DDC (chopped western blot for calnexin, phosphorylated Irga6 and total Irga6). n.b. Irga6CIM characteristically runs at a higher apparent molecular weight than Irga6BL/6 (D) Transfected Irga6CIM and Irga6BL/6 are both phosphorylated in IFNγ-induced L929 cells infected with RH-YFP as shown in western blot of detergent lysates. Phosphorylation of Irga6 is indicated by a size-shift (black arrowhead) for both Irga6BL/6 and Irga6CIM in infected cells. The lower band in the two transfected/infected tracks is the endogenous Irga6BL/6. (E) Irgb2-b1CIM (yellow) transfected into IFNγ-induced BL/6 MEFs inhibits phosphorylation of Irga6 (red) by RH-YFP seen in untransfected cells serving as control. Bar = 10 µm. (F) Immunofluorescent quantitation of phosphorylated Irga6 on the PVM of RH-YFP in Irgb2-b1CIM-transfected cells and untransfected cells prepared in (E). (G) Immunofluorescent quantitation of total Irga6 on the PVM of RH-YFP in Irgb2-b1CIM transfected and untransfected cells prepared in (E). (H) Enumeration of Irgb6-positive vacuoles in BL/6 MEFs induced by IFNγ and transfected with Irgb2-b1CIM or Irgb2-b1BL/6.
Figure 7
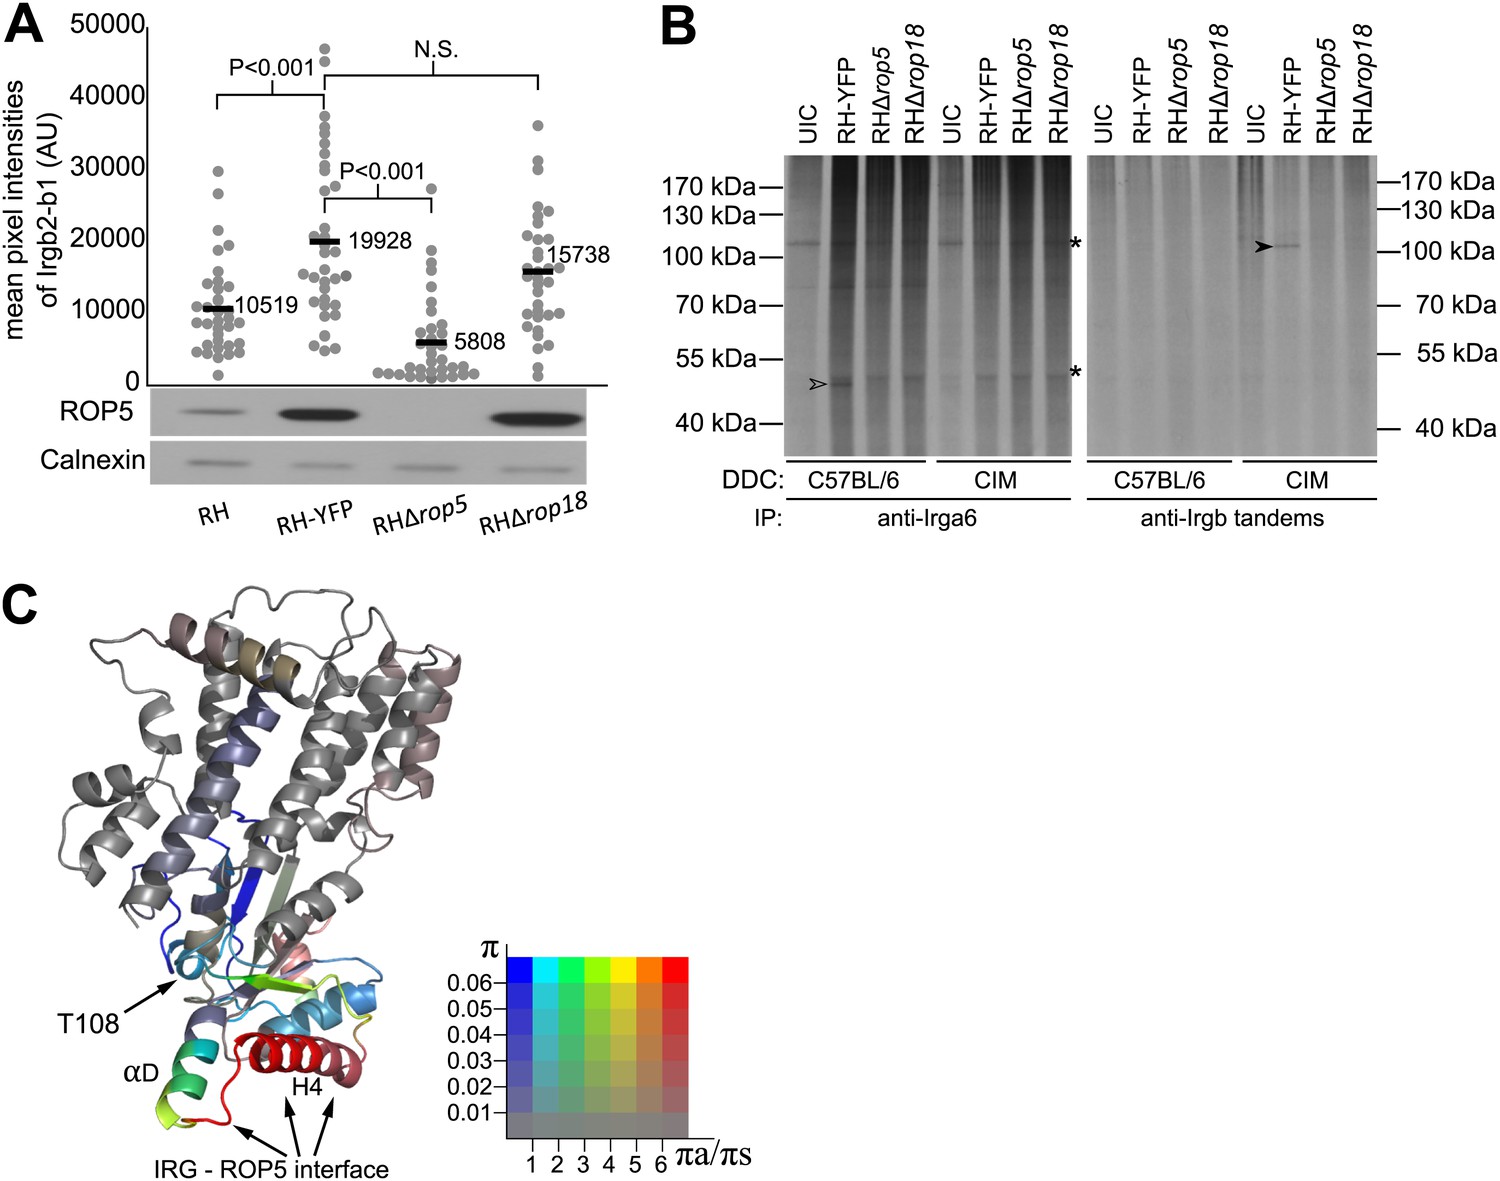
IRG-tandem proteins interact with virulence factors.
(A) Loading of Irgb2-b1CIM on to vacuoles of RH variants in IFNγ-induced CIM DDC. Irgb2-b1CIM loading (dot plots, upper image) is positively correlated with ROP5 expression level in the parasite (western blot, lower image). (B) Autoradiogram (33P) of immunoprecipitated IRG proteins in DDC infected with T. gondii. Irga6 was phosphorylated (open arrow head) by virulence factors of T. gondii in BL/6 DDC, but not in CIM DDC. Irgb-tandem proteins were phosphorylated only in CIM DDC (filled arrow head) in a ROP5/ROP18-dependent manner. UIC = uninfected control. Asterisk (*) indicates non-specific phosphorylated proteins (C) Ribbon model of Irgb2 predicted based on the structure of Irga6, showing diversifying selection associated with H4 and αD of the G-domain. The colours of the ribbons are based on the π and πa/πs values among 40 alleles sequenced from mouse strains and wild mice with a 120 bp slide window and 10 bp step. The colours indicate the πa/πs value, from purifying selection (blue) to significantly diversifying selection (red). The saturations of colours are defined by overall π value in the sliding window, indicate conserved regions of the protein (low saturation) to highly polymorphic regions (high saturation).
Tables
Table 1
Cyst counts in T. gondii infected mice
| Mouse | UIC* | CIM | CIM | CIM | CIM | CIM | CIM | CIM | NMRI | NMRI | NMRI | NMRI |
|---|---|---|---|---|---|---|---|---|---|---|---|---|
| T. gondii (# injected) | – | GT-1 500 | GT-1 1000 | BK 5000 | BK 10,000 | NED 10,000 | NED 10,000 | NED 10,000 | GT-1 500 | BK 500 | NED 10,000 | NED 10,000 |
| Q-PCR (cycle) | >35 | 22.9 | 24.2 | 18.7 | 22.0 | 26.9 | 26.2 | 28.8 | Dead | Dead | 22.6 | 20.3 |
| Cysts per brain | 0 | 100 | 50 | 130 | 150 | 220 | 90 | 15 | 720 | 4800 | ||
| Antibody test | – | + | + | + | + | + | + | + | + | + |
-
*
Uninfected control.
-
Mice were sacrificed 5 weeks (NED) or 6–8 weeks (BK and GT-1) after tachyzoite injection. Infection was verified by serum antibody. Cysts were evaluated by direct counting in homogenised brains and by quantitative PCR of a repeat element of T. gondii (Reischl et al., 2003) in genomic DNA samples isolated from mouse brains.
Table 2
IRG sequences from NCBI database
| Gene | Strain | Type | Access number |
|---|---|---|---|
| Irgm1 | Czech II | ESTs | BI150356, BF161711, BF168437, BF164781, BE367794 |
| Irgb2-b1 | Czech II | mRNA | BC022776 |
| JYG | mRNA | AK145236 | |
| Irgb6 | Czech II | mRNA | BC093522 |
| Czech II | mRNA | BC034256 | |
| JYG | mRNA | AK166353 | |
| NMRI | mRNA | BC085259 | |
| C.D2 | mRNA | U15636 | |
| Irgd | Czech II | mRNA | BC001986, BC009131 |
| Irgm2 | Czech II | ESTs | BG518498, BF137080, BE284209, BF168033, BI149246, BI414397, BE283352, BE306442 |
| Irgm3 | Czech II | ESTs | BI414397, BI149246, BF163420, BE283352, BF168033, BI153387, BE281683, BE306442, BI106672, BI150745, BF225799, BF168273 |
| Irga6 | Czech II | ESTs | BF143764, BI150692, BF163277, BE369870, BI152144, BF168743, BF022265, BI105027, BE306549, BF140175 |
| NMRI | ESTs | BG862486, BI654967, BI854263, BI654186, BG974278, BI662561, BI853679, BG864306, BI658908 | |
| Irga8 | Czech II | mRNA | BC023105 |
| Irga9 | Czech II | mRNA | BC040796 |
| Irga10 | Czech II | mRNA | BC020118 |
Table 3
Primer list
| Name | Sequence 5′ to 3′ | Function |
|---|---|---|
| Irga6_56B_fw | CTACTATGAATGGTATATGTAGCATTGTG | Irga6 amplification |
| Irga6_56B_bw | CAGGACTTCAGCTTAATTAGAAGGC | Irga6 amplification |
| Irgb2_66F_f | CTGGACTCTGCGCTTTTATTGG | Irgb2 amplification |
| Irgb2_66F_b | CTGGAAACACTTTGCCCACG | Irgb2 amplification |
| Irgb6_67Y_fw | CCTCTCTTCTCCATTCAGCTTC | Irgb6 amplification |
| Irgb6_67Y_bw | CCAAGGTGAAGCTAAGAGTGAAC | Irgb6 amplification |
| Irgb10_682_fw | CTCCAGTGTCCTGTGTGCCC | Irgb10 amplification |
| Irgb10_682_bw | CAGGAATGCCCTCAGTCGTC | Irgb10 amplification |
| Irgm1_655_fw | CTGCCGATTCGATTCATAAAC | Irgm1 amplification |
| Irgm1_655_bw | CCTCTCAGAGAATCTAAAACCC | Irgm1 amplification |
| Irgm1_66F_bw | GAGACAGGGGAGATGAGTGAT | Irgm1 amplification |
| Irga1_221_fw | ATCGATAGTTCCCTTGTCAATGTGG | backcross and F2 mice genotyping, Chr 18 |
| Irga1_221_bw | TTTGTAGAGTTTGGCTAGGGCCTG | backcross and F2 mice genotyping, Chr 18 |
| Irgb6_21D_fw | ATGGCTTGGGCCTCCAGCTT | backcross and F2 mice genotyping, Chr 11 |
| Irgb6_614_bw | CCACCATTCCACTTGGTGG | backcross and F2 mice genotyping, Chr 11 |
| Tox-9 | AGGAGAGATATCAGGACTGTAG | T. gondii qPCR primer |
| Tox-11 | GCGTCGTCTCGTCTAGATCG | T. gondii qPCR primer |
| Nlrp1_FW | AACTTATCTCAGGTCTCTGTGATT | Nlrp1b genotyping, forward |
| Nlrp1_BL6 | GATATAGGTCAGGACCAATGC | Nlrp1b backward, BL/6 specific |
| Nlrp1_CIM | GATATAGGTCAGGACCATCAA | Nlrp1b backward, CIM specific |
Table 4
T. gondii strains used in this study
| Type | Strain name | Reference | Note |
|---|---|---|---|
| I (virulent) | RH | (Albert and Sabin, 1941) | |
| RH-YFP | (Gubbels et al., 2003) | transgenic RH strain expressing YFP | |
| RHΔrop5 | (Behnke et al., 2011) | transgenic RH strain, the ROP5 locus has been deleted | |
| RHΔrop18 | (Reese et al., 2011) | transgenic RH strain, the ROP18 locus has been deleted | |
| BK | (Winsser et al., 1948) | ||
| GT-1 | (Dubey 1980) | canonical type I strain, full sequence in ToxoDB Database | |
| II (avirulent) | ME49 | (Lunde and Jacobs, 1983) | |
| III (avirulent) | NED | (Darde et al., 1992) |
Table 5
Origin of mouse samples and mouse genomic DNA
| Sample name | Subspecies | Origin | Location of collection | Provided by |
|---|---|---|---|---|
| D9, D18, D12, D22, D31, D34 | M. m. domesticus | Germany | 50°50′N 6°45′E | Genomic DNA provided by B Harr Max Planck Institute for Evolutionary Biology, Germany |
| MC8, MC4, MC6, MC52, MC13, MC27, MC58 | M. m. domesticus | France | 44°20′N 3°0′E | |
| W1.1, W3.1, W3.2, W4.1, W7.1 | M. m. musculus | Austria | 48°12′N 16°22′E | |
| AL12, AL21, AL24, AL30, AL32, AL41 | M. m. musculus | Kazakhstan | 43°N 77°E | |
| MW2, MW4 | M. m. musculus | Inner Mongolia China | 41°5′N 108°9′E | Caught by J Lilue for this study. Institute for Genetics, University of Cologne, Germany |
| MT1, MT2 | 40°47′N 111°1′E | |||
| JH4, JH6, JH11, JH12 | M. m. musculus or Hybrid zone | Hebei Province China | 37°37′N 115°19′E | |
| YX3, YX5, YX11 | M. m. castaneus | Henan Province China | 32°4′N 115°3′E | |
| MIB3, MIB4, MIB6, | M. m. castaneus | India | 13°3′N 77°34′E | Caught by UB Müller for this study. Institute for Genetics, University of Cologne, Germany |
| MIB23, MIB24, MIB25 | 13°6′N 77°34′E | |||
| MIB35, MIB36 | 12°54′N 77°29′E | |||
| CTP (living mice) | M. m. castaneus | Thailand | Mouse strain | F Bonhomme, Institut de Science de l’Evolution, Montpellier, France |
| CIM (living mice) | M. m. castaneus | India | ||
| CAST/Ei (living mice) | M. m. castaneus | Thailand | Inbred strain | The Jackson Laboratory, Bar Harbor, Maine, USA |
| C57BL/6 (living mice) | M. m. domesticus | Lab mouse | Inbred strain | Centre for Mouse Genetics, University of Cologne, Germany |
| NMRI (living mice) | M. m. domesticus | Lab mouse | Inbred strain | Charles River Laboratories, Sulzfeld, Germany |
Download links
A two-part list of links to download the article, or parts of the article, in various formats.
Downloads (link to download the article as PDF)
Open citations (links to open the citations from this article in various online reference manager services)
Cite this article (links to download the citations from this article in formats compatible with various reference manager tools)
Reciprocal virulence and resistance polymorphism in the relationship between Toxoplasma gondii and the house mouse
eLife 2:e01298.
https://doi.org/10.7554/eLife.01298


