A Gata3–Mafb transcriptional network directs post-synaptic differentiation in synapses specialized for hearing
- Harvard Medical School, United States
- Children’s Hospital Boston, Harvard Medical School, United States
Figures
Figure 1

Mafb is expressed in SGNs during synaptogenesis.
(A) Schematic representation of a mouse inner ear indicates the levels of section planes in (B–F). (B) In situ hybridization shows Mafb expression in E13.5 SGNs. (C and C′) Mafb (C) and Neuronal Class III β-Tubulin (TuJ1) (C′) double staining at E13.5 shows a lack of Mafb protein in the spiral ganglion (sg), which is marked by TuJ1. (D–F) Anti-Mafb immunostaining of the cochlea at E15.5 (D), E16.5 (E) and P3 (F) confirmed specific expression of Mafb in differentiating SGNs. Mafb protein can be detected in SGNs in the basal and middle turns at E15.5 (D) and in all SGNs at E16.5 (E). High expression persists through early postnatal stages (F). At all stages, Mafb protein is restricted to SGNs. Asterisks indicate the cochlear duct. a: apex; m: middle; b: base; sg: spiral ganglion; sv: scala vestibuli; sm: scala media; st: scala tympani. (G–I) Anti-Mafb immunostaining of transverse sections through the middle turn of the cochlea at P6 (G), P10 (H) and P15 (I). Mafb protein is present at high levels in SGN nuclei at P6, then gradually translocated to the cytoplasm. Only a few SGNs maintained nuclear expression of Mafb at P10 (arrowheads). Mafb is present at low levels in the cytoplasm of all SGNs at P15. (J) Western blots of P3, P6, P10, and P15 cochlear lysates using anti-Mafb and β-actin (loading control) antibodies. Mafb protein level peaks at P6 and decreases afterward. (12 cochleae from 6 mice per age group). Scale bar in F is 200 µm (B, D–F) or 100 µm (C and C′); and in I is 50 µm (G–I).
Figure 2
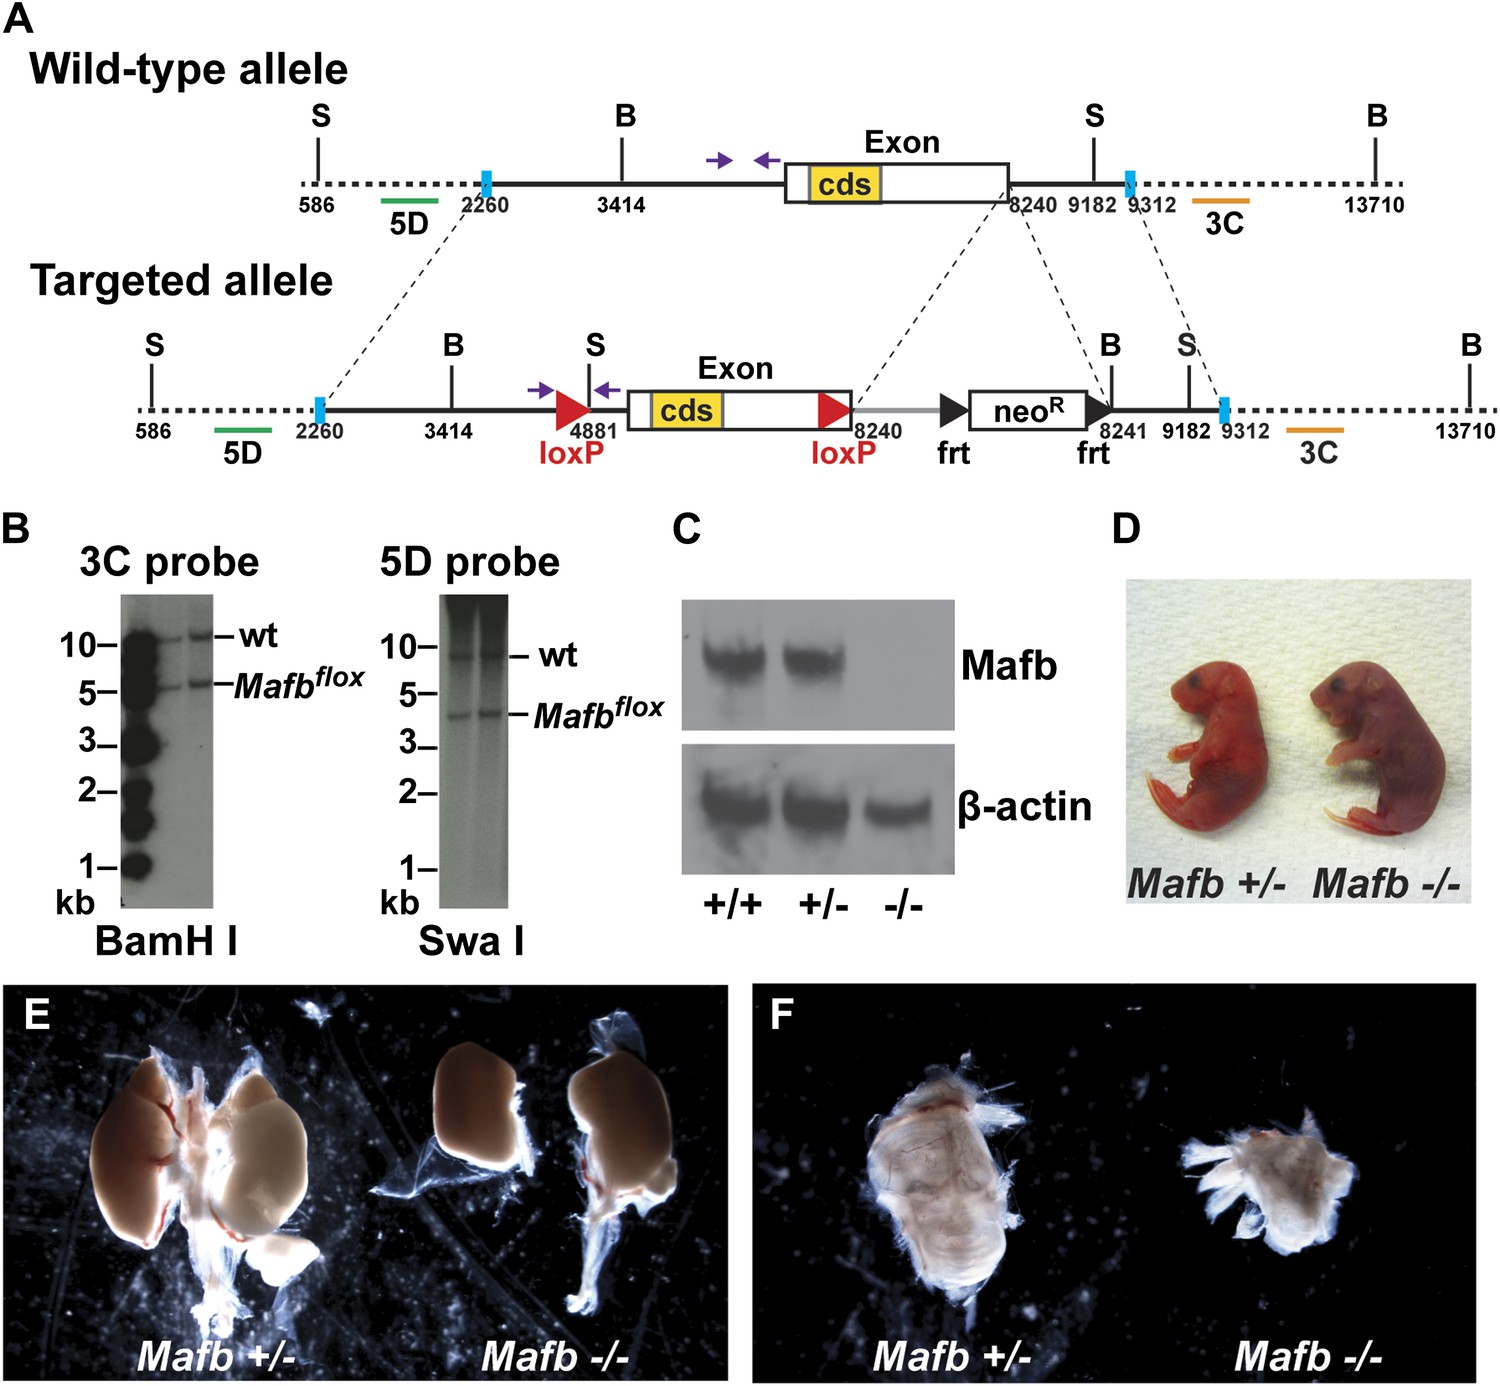
Generation and validation of floxed Mafb alleles.
(A) A map of the Mafb locus in wild-type and floxed alleles. Two LoxP sites flank the Mafb coding region that is contained in a single exon. A neoR cassette was used for positive selection and can be removed by FLP-mediated recombination of FRT sites. B: BamHI site, S: SwaI site. cds: coding DNA sequence. Purple arrows indicate forward and reverse primers used for genotyping. Green and orange bars indicate 5D probes or 3C probes used for Southern blotting in (B). Blue vertical bars demarcate the sequence used to target to the Mafb genomic locus. (B) Southern blotting of the 3′ (left) and 5′ (right) Mafb genomic region confirmed successful homologous recombination in two different ES cell clones. (C) Western blot with anti-Mafb antibodies (top) confirms loss of protein from E16.5 Mafb null mutants generated from the Mafbflox line. β-actin serves as a loading control. (D) Mafb null neonates take only occasional gasping breaths, show cyanosis, and die within 2 hours after birth. (E) E18.5 Mafb null mutants have dystrophic kidneys compared to control littermates. (F) Mafb null mutants develop a small and cystic inner ear compared to control littermates.
Figure 3 with 1 supplement
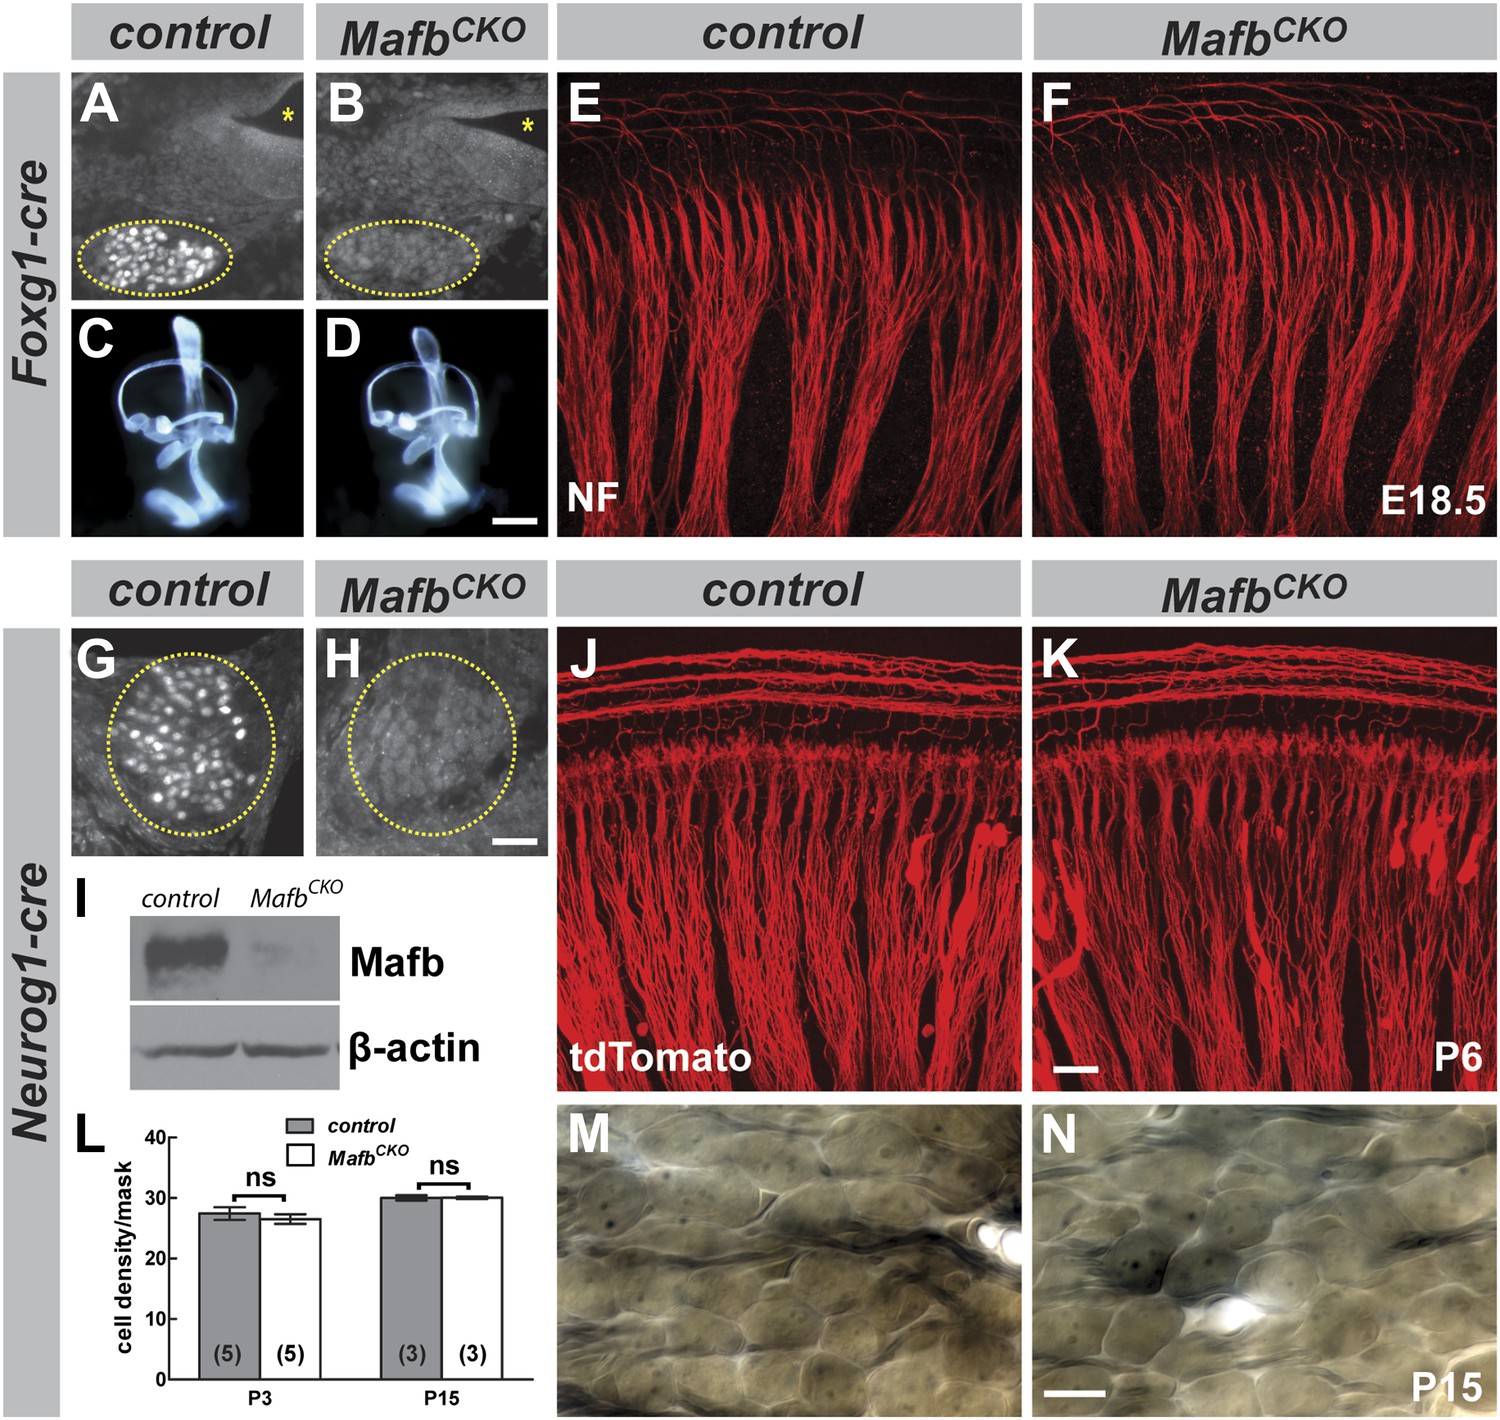
Mafb is not required for inner ear patterning or extension of SGN peripheral projections.
(A and B) Anti-Mafb immunostaining of transverse sections through E16.5 control (A) and Foxg1Cre/+;Mafbflox/GFP mutant (B) cochleae confirms Mafb is not produced in mutant SGNs (circled area). (C and D) Light microscope images of E14.5 control (C) and Foxg1Cre/+;Mafbflox/GFP mutant (D) inner ears filled with paint show normal inner ear morphology in mutants. (E and F) Confocal stacks from E18.5 control (E) and Foxg1Cre/+;Mafbflox/GFP mutant (F) cochlear whole-mounts stained for Neurofilament (NF) to label all neuronal processes. Cochlear wiring is normal in mutant animals. (G and H) Anti-Mafb immunostaining of transverse sections through P5 control (G) and Neurog1-Cre;Mafbflox/GFP (MafbCKO) mutant (H) cochleae shows Mafb is not expressed in MafbCKO SGNs (circled area). (I) Western blot using anti-Mafb and β-actin (loading control) antibodies on P5 cochlear lysate (20 cochleae from 10 mice per genotype) confirms loss of protein from MafbCKO cochleae. (J and K) P6 cochlear whole-mounts from Neurog1-Cre;Mafbflox/+;tdTomato (J) and Neurog1-Cre;Mafbflox/GFP;tdTomato (K) mice imaged for tdTomato show afferent fibers from SGNs projecting normally in MafbCKO cochlea. (L) SGN density was quantified in a masked area of the 32 kHz region of control and MafbCKO cochleae at P3 and P15. Data are presented as average SGN cell density per mask for each group. SGN cell number is similar between control and MafbCKO mice at P3 and P15. p=0.51 at P3 and 0.97 at P5. ns: not significant. In this and all subsequent figures, numbers in parentheses indicate the number of cochleae (one cochlea per mouse) used for quantification. (M and N) Representative light micrographs of osmium-stained plastic sections show similar cell densities of control and MafbCKO cochleae at P15. Images corresponding to the masked region are shown. Scale bar in D is 100 µm (A and B) or 400 µm (C and D); in H is 50 µm (G and H); in K is 20 µm (E, F, J, K); and in N is 20 µm (M and N).
Figure 3—figure supplement 1
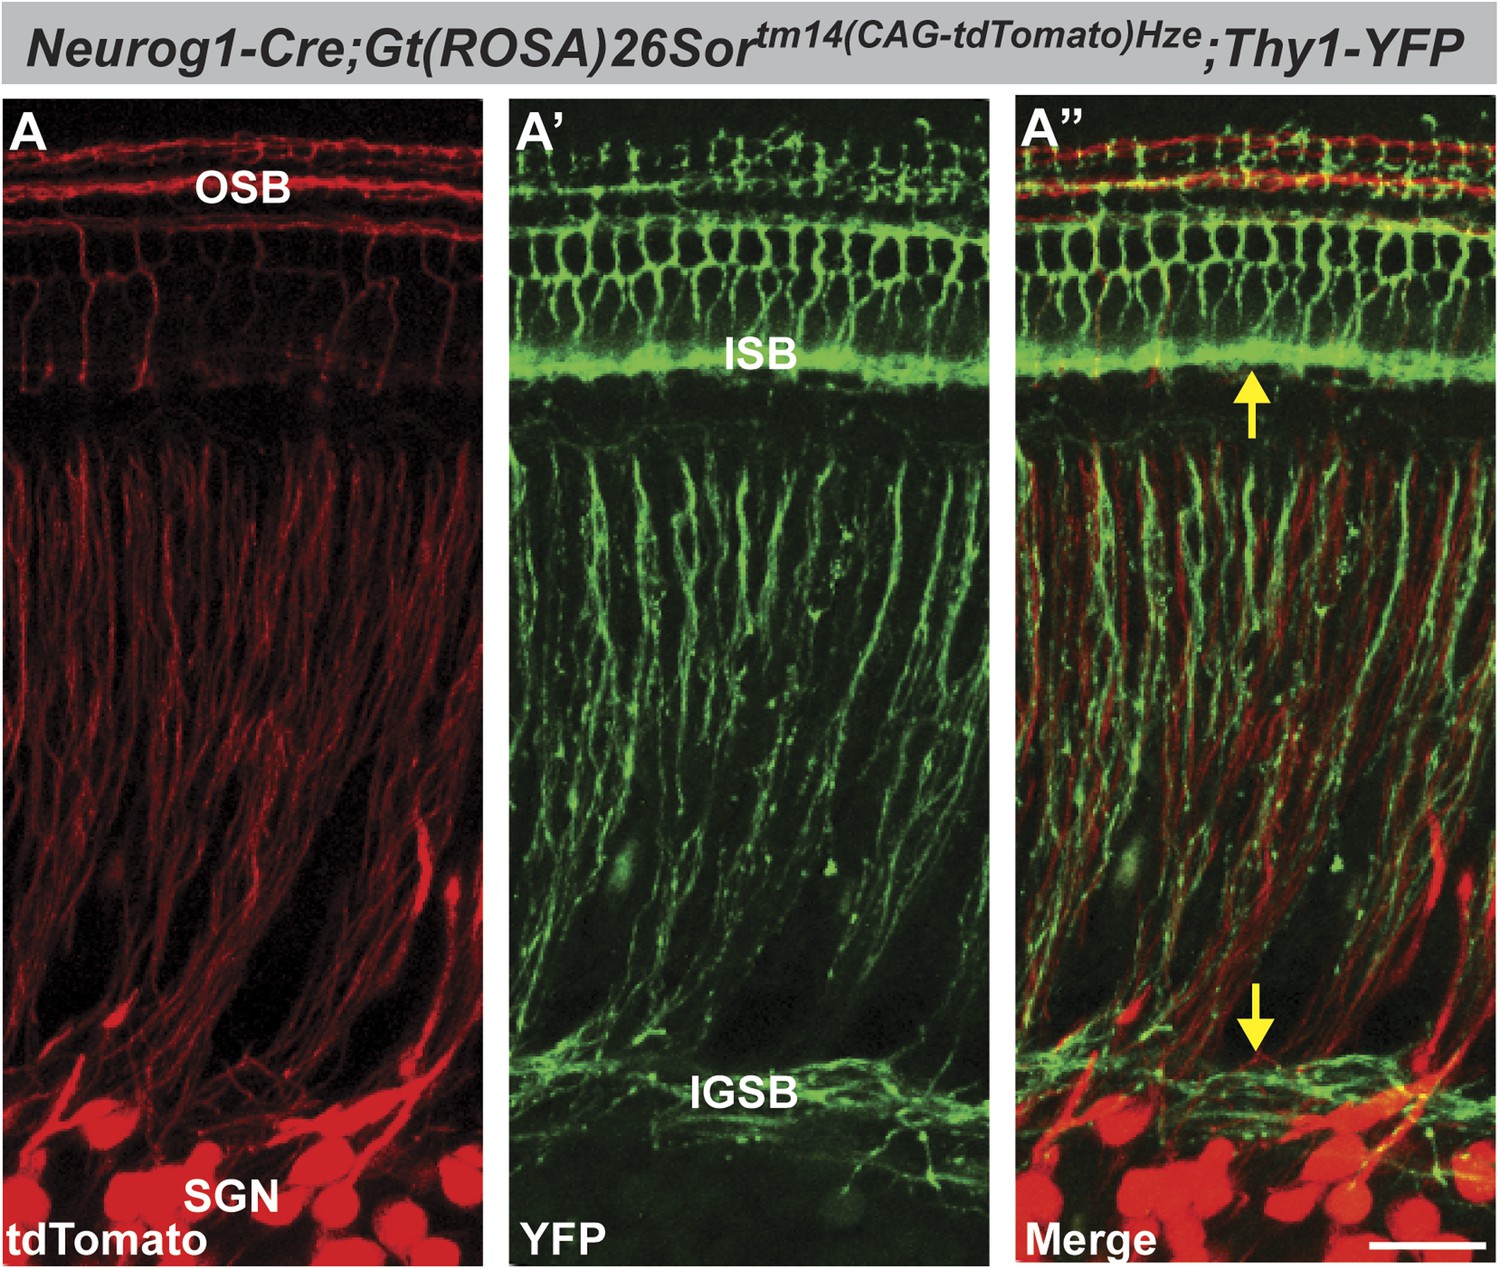
Neuorg1-Cre drives Cre-mediated recombination in SGNs but not in olivocochlear efferent neurons.
Projections of confocal stacks of the cochlea, from P6 Tg(Neurog1-Cre);ROSA26tm14(CAG-tdTomato)Hze;Tg(Thy1-YFP) triple transgenic mice imaged for tdTomato (Red; A and A′′) and YFP (green; A′ and A′′). This Thy1-YFP strain (YFP-12) has been demonstrated previously to show expression in the inner ear only in efferent processes (Fu et al., 2010). Hence, expression is absent from cell bodies in the spiral ganglion but prominent in the intraganglionic spiral bundle (IGSB) and the inner spiral bundle (ISB) (A′, arrows in A′′). In contrast, SGN cell bodies and processes are clearly labeled in Neurog1-Cre;ROSA26CAG-tdTomato cochleae, including processes in the outer spiral bundle (OSB) (A and A′′). tdTomato expression does not colocalize with YFP (A′′), indicating that Neurog1-Cre does not activate Cre-mediated recombination in the olivocochlear efferent system. Note the absence of expression in the ISB and IGSB, which are composed of Thy1-YFP positive efferent fibers. Scale bar is 30 µm.
Figure 4 with 3 supplements
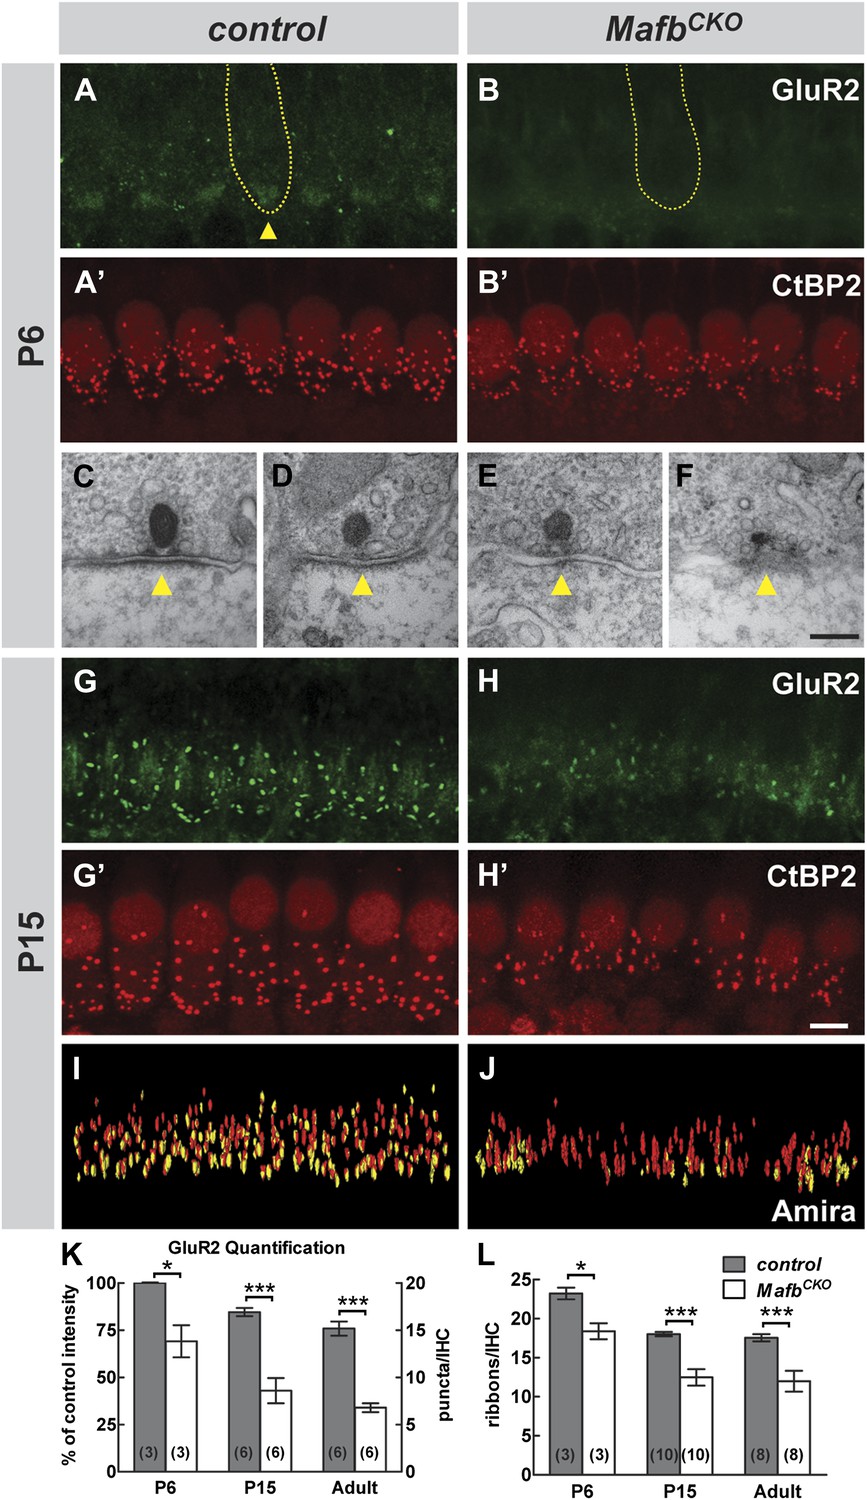
Loss of Mafb interferes with PSD development and reduces synapse number.
(A–B′) Confocal stacks from P6 control (A and A′) and MafbCKO (B and B′) cochlear whole-mounts double stained for GluR2 (green) and CtBP2 (red). IHC nuclei are also weakly immunopositive for CtBP2. Yellow dotted lines (A and B) outline IHCs, as determined by Myo7A staining in another channel (not shown). GluR2 immunofluorescence is present near the basal pole of control (arrowhead) but not MafbCKO IHCs. The intensity of CtBP2 immunofluorescence is decreased in MafbCKO IHCs at P6 when compared to controls. (C–F) Electron micrographs of IHC ribbon synapses in the middle turn of cochleae from P6 control (C and D) and MafbCKO (E and F) mice. MafbCKO mice lack a delineated PSD in their SGN afferent terminals (arrowheads). (G–H′) Confocal stacks from P15 control (G and G′) and MafbCKO (H and H′) cochlear whole-mounts double stained for GluR2 (green) and CtBP2 (red). The number of GluR2 and CtBP2 puncta is decreased in P15 MafbCKO mice. (I and J) 3D reconstructions of presynaptic ribbons (red) and postsynaptic aggregations of GluR2 (yellow) from P15 control (I) and MafbCKO (J) cochleae derived from confocal stacks using Amira image-processing software. Many MafbCKO ribbons lack corresponding GluR2 puncta (J). (K) Quantification of GluR2 immunofluorescence intensity at P6 (left axis) and GluR2 puncta number per IHC at P15 and adult (right axis) in control and MafbCKO cochleae. GluR2 immunofluorescence intensity of P6 MafbCKO cochleae is expressed as a percentage of control intensity. (L) Quantification of ribbon number per IHC in control and MafbCKO cochleae at P6, P15 and adult. Ribbon number and GluR2 intensity/number of MafbCKO cochleae are significantly decreased when compared to controls at all stages. *: p<0.05, ***: p≤0.001. Scale bar in H′ is 5 µm (A, A′, B, B′, G, G′, H, H′); in F is 200 nm (C–F).
Figure 4—figure supplement 1
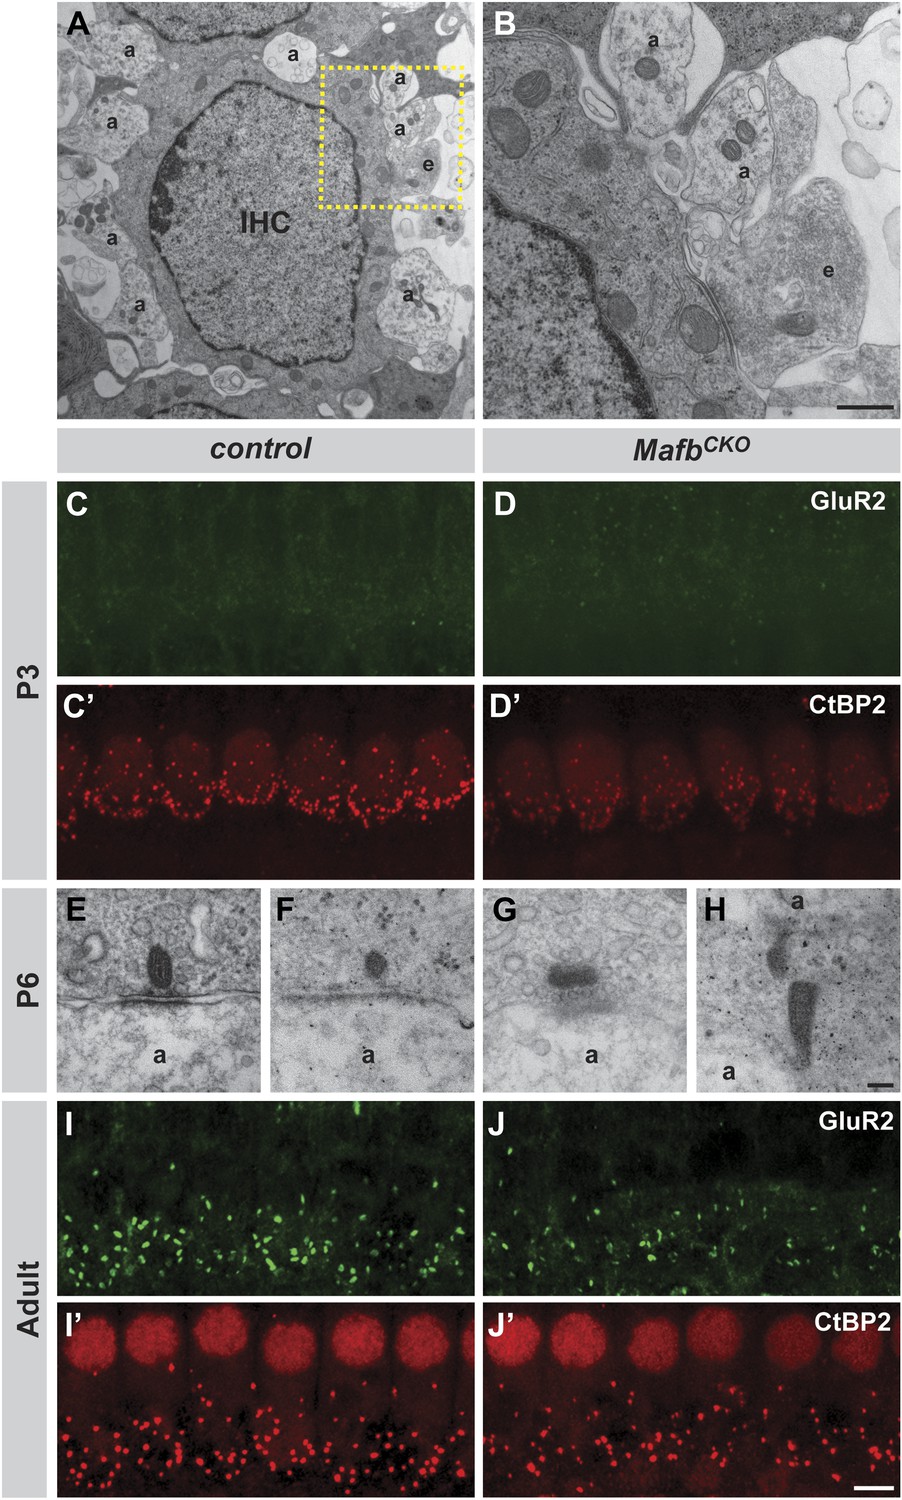
MafbCKO mutants show normal targeting of afferent terminals but impaired synapse development.
(A and B) Electron micrographs of an IHC and its associated afferent terminals (A) in the middle turn of cochleae from P6 MafbCKO mice. The box in (A) outlines the region magnified in (B). MafbCKO afferent fibers target normally to IHCs. Efferent fibers (E) still synapse with IHCs at this stage. a: afferent terminals; e: efferent terminals. (C–D′) Projections of confocal stacks from P3 control (C and C′) and MafbCKO (D and D′) cochlear whole-mounts double stained for GluR2 (green) and CtBP2 (red). IHC nuclei are also weakly immunopositive for CtBP2. The intensity of CtBP2 immunofluorescence is decreased in MafbCKO IHCs at P3 when compared to controls. (E–H) Electron micrographs of IHC ribbon synapses in the middle turn of cochleae from P6 control (E and F) and MafbCKO (G and H) mice. In MafbCKO synapses, the presynaptic ribbons are often abnormally shaped and are not paired with a clear postsynaptic density. a: afferent terminals. (I–J′) Projections of confocal stacks from adult control (I and I′) and MafbCKO (J and J′) cochlear whole-mounts double stained for GluR2 (green) and CtBP2 (red). The number of GluR2 and CtBP2 puncta is decreased in adult MafbCKO mice. Scale bar in B is 1.5 µm (A) or 500 nm (B); in H is 100 nm (E–H); in J′ is 5 µm (C, C′, D, D′, I, I′, J, J′).
Figure 4—figure supplement 2
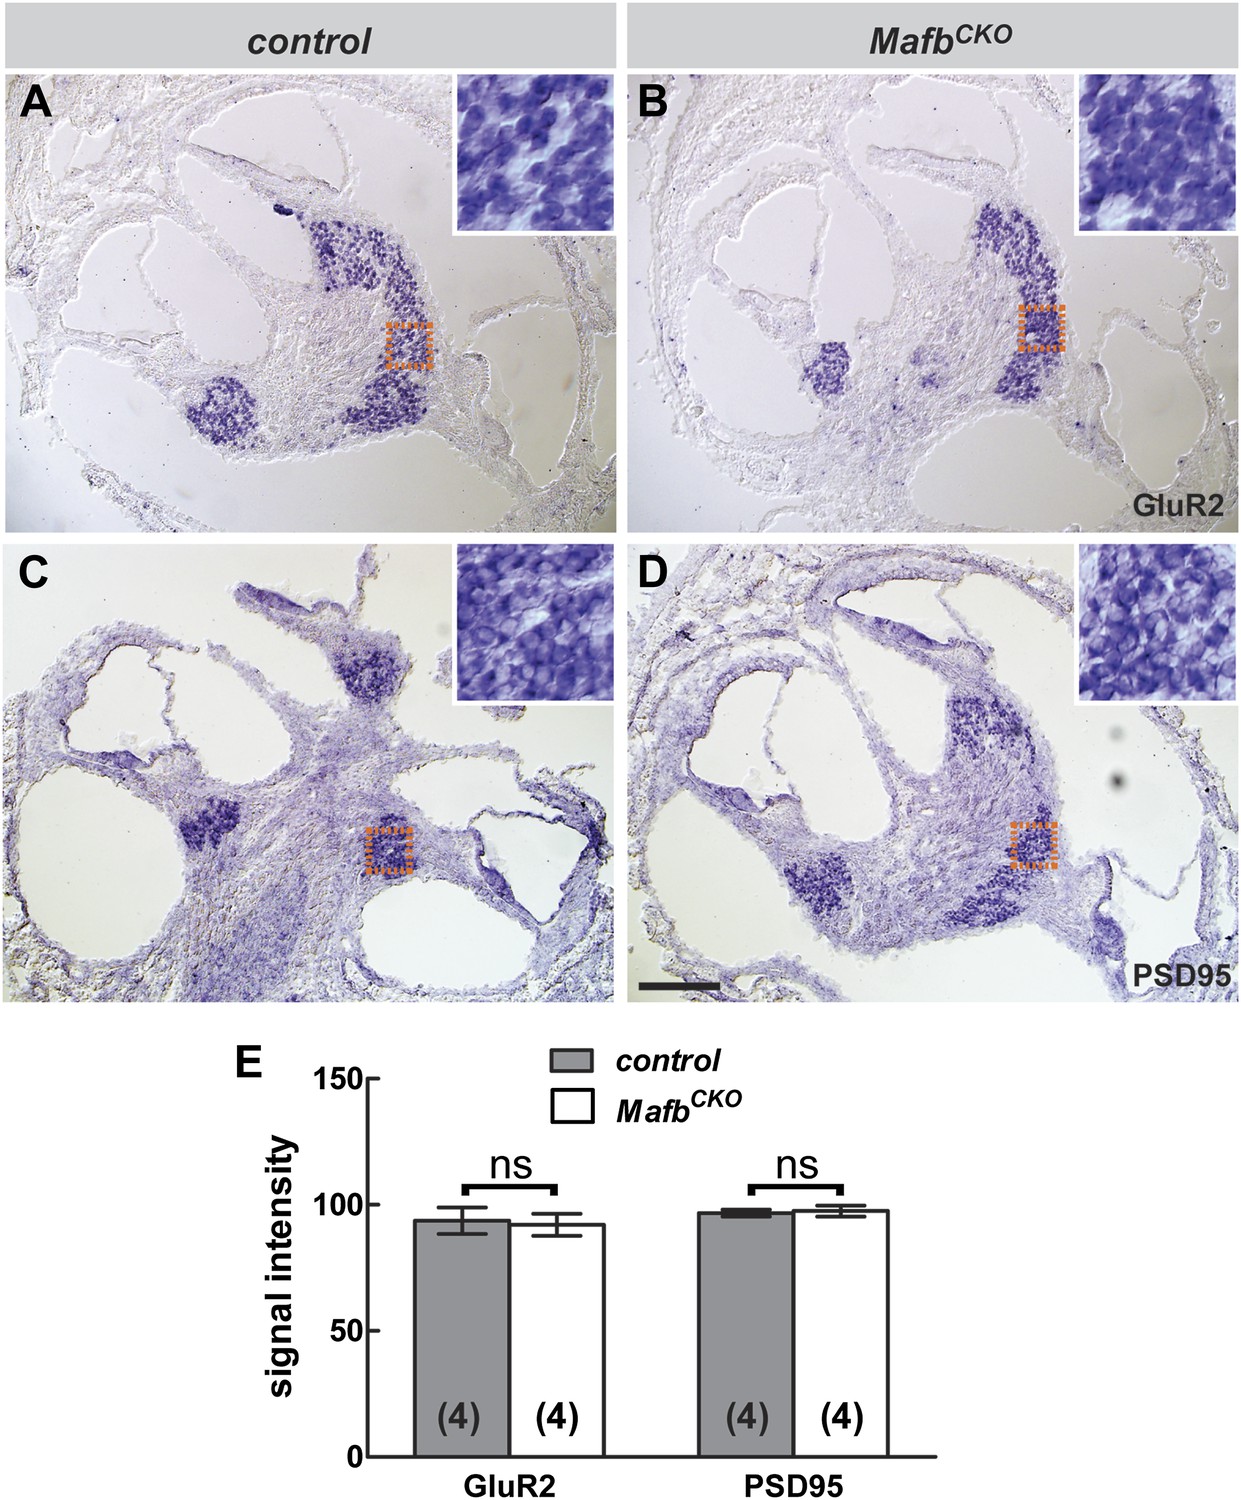
Transcription of GluR2 and PSD95 is not significantly changed in MafbCKO SGNs.
(A–D) In situ hybridization revealed no obvious difference in the expression of GluR2 (A and B) or PSD95 (C and D) in control (A and C) vs MafbCKO (B and D) SGNs at P6. Orange boxes indicate the region shown in figure insets, corresponding to the masked areas used for semi-quantitative analysis. (E) Semi-quantitative analysis of in situ hybridization was performed to compare the mean signal intensity in a masked area of SGNs in control and MafbCKO cochleae. Control and MafbCKO SGNs express similar levels of GluR2 and PSD95. p=0.85 for GluR2 and 0.77 for PSD95. ns: not significant. Scale bar in D is 100 µm (A–D) or 25 µm (insets).
Figure 4—figure supplement 3
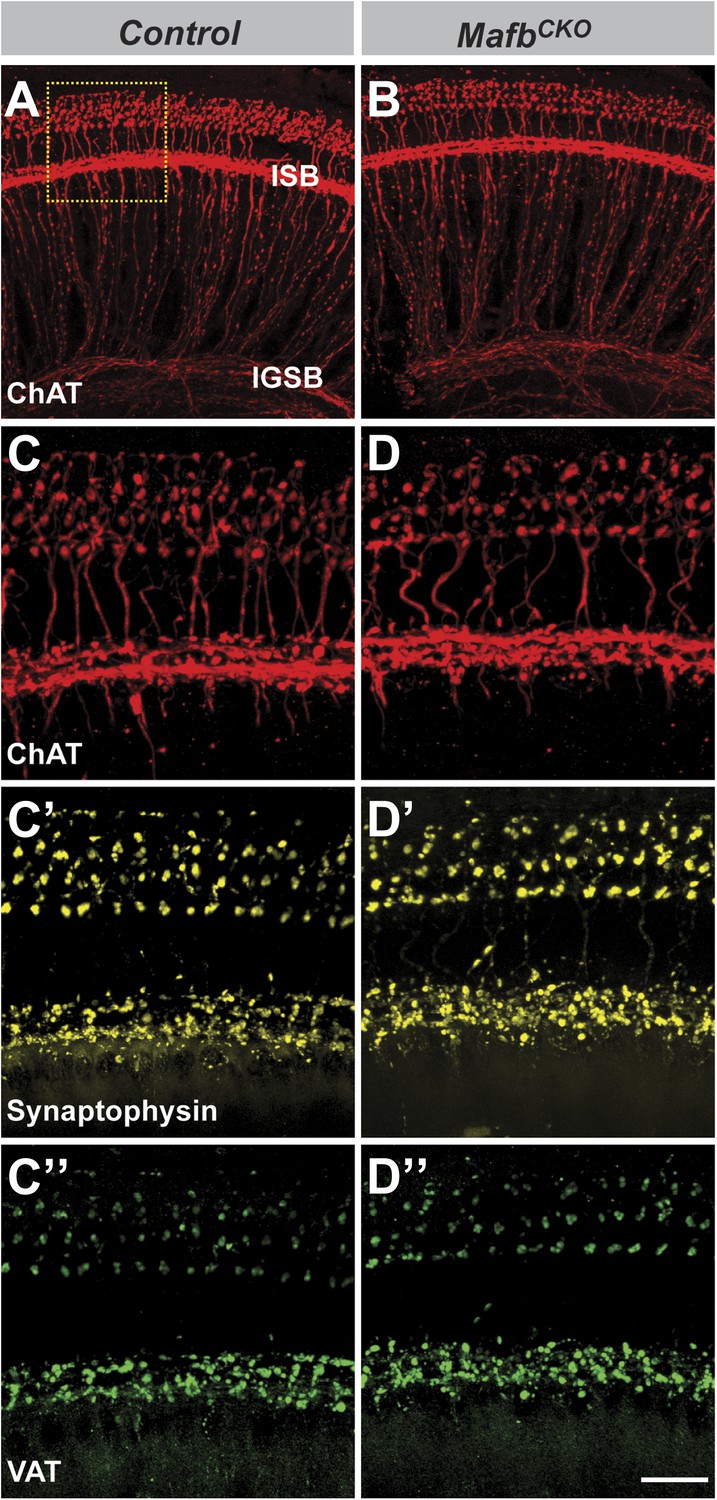
The olivocochlear efferent system is normal in MafbCKO mice.
(A–D′′) Projections of confocal stacks from P15 control (A and C–C′′) and MafbCKO (B and D–D′′) cochlear whole-mounts triple stained for choline acetyltransferase (ChAT, red), synaptophysin (yellow), and vesicular acetylcholine transporter (VAT, green) to label the efferent innervation in cochleae. The box in (A) indicates the region magnified in (C). Olivocochlear efferent innervation is normal in MafbCKO cochleae. Scale bar in D′′ is 60 µm (A and B) or 20 µm (C–D′′).
Figure 5 with 1 supplement
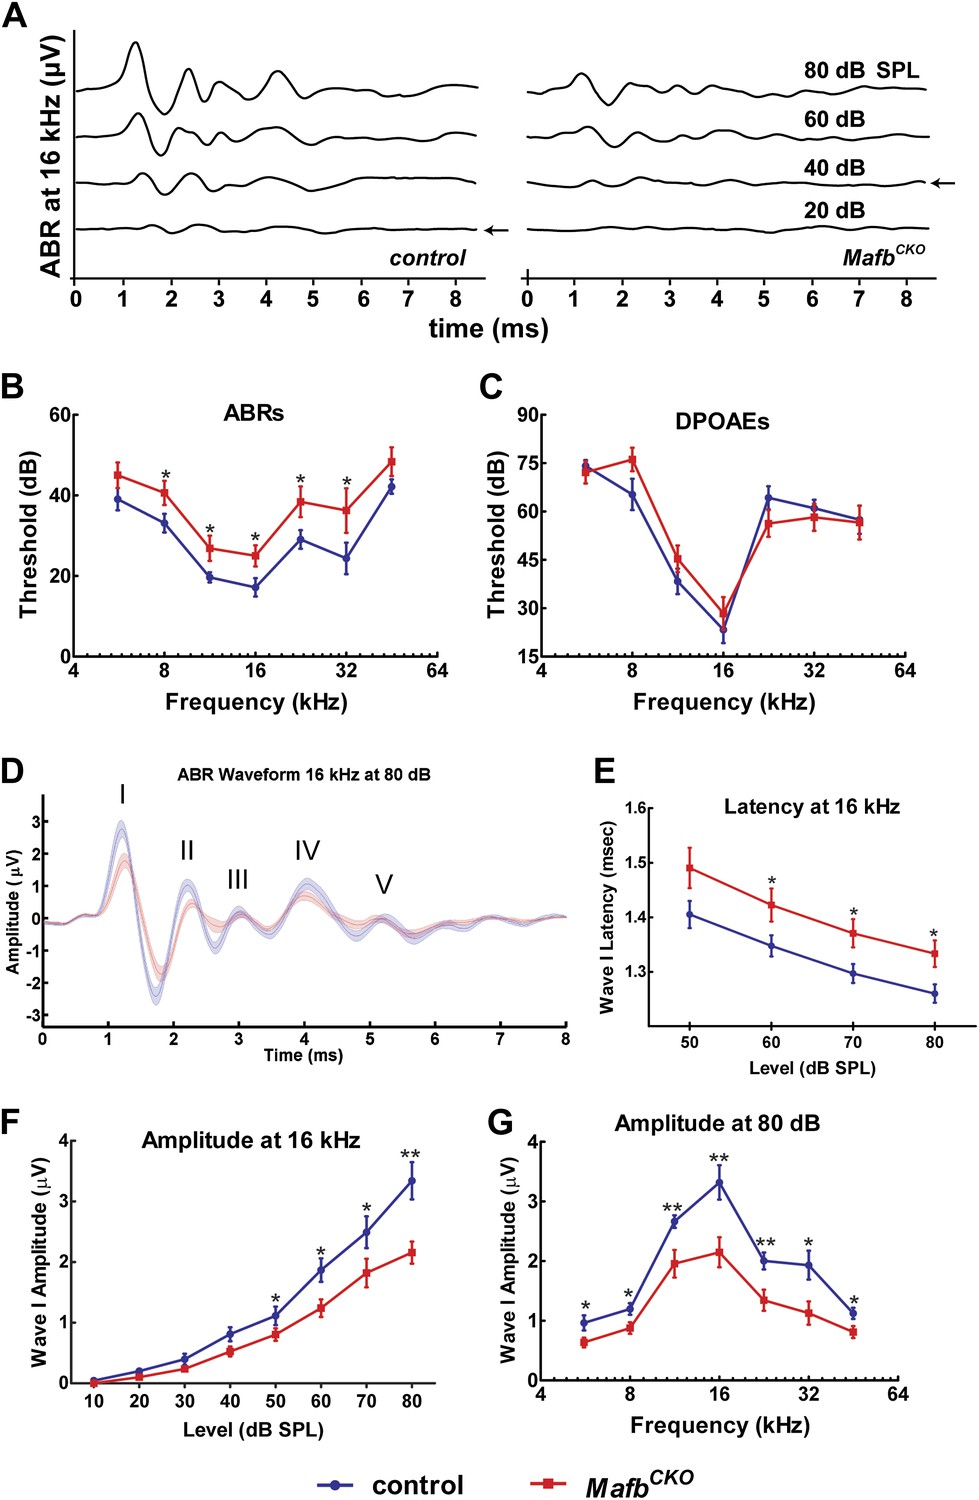
Mafb is required for normal auditory function.
(A) Representative ABR recordings from a P41 control and MafbCKO littermate exposed to a 16 kHz pure tone stimulus at intensities ranging from 20 to 80 dB. Arrows indicate the ABR threshold. The ABR response is diminished in the MafbCKO mutant compared to its littermate control. (B and C) Plots of threshold values from recordings of ABRs (B) and DPOAEs (C) performed on 5- to 7-week-old control (blue line) and MafbCKO (red line) mice. Auditory responses were assessed at 7 frequencies (5.6 kHz, 8 kHz, 11.3 kHz, 16 kHz, 22.6 kHz, 32 kHz, and 45.2 kHz), and across a range of sound pressure levels from 10 to 80 decibels. *: p<0.05. n = 16 mice for each group. MafbCKO mice show elevated ABR but normal DPOAE thresholds when compared to controls. (D) 16 kHz ABR waveforms of 16 control (blue line) and 16 MafbCKO (red line) mice were averaged and overlaid. Roman numerals mark the peaks of the ABR waves. Wave I is delayed and diminished in MafbCKO mutants. (E) Average Wave I latencies for control (blue, n = 16) and MafbCKO (red, n = 16) littermates in response to a 16 kHz pure tone stimulus. MafbCKO responses are significantly delayed at 80, 70, and 60 dB SPL. *: p<0.05. (F) Average Wave I amplitudes for control (blue, n = 16) and MafbCKO (red, n = 16) littermates in response to a 16 kHz stimulus. The MafbCKO responses are significantly decreased at 80, 70, 60, and 50 dB SPL. **: p<0.005 and *: p<0.05. (G) Average Wave I amplitudes for control (blue, n = 16) and MafbCKO (red, n = 16) littermates at all 7 frequencies of the stimulus. Stimuli were presented at a sound pressure level of 80 dB. MafbCKO responses are significantly decreased at all frequencies. **: p<0.01 and *: p<0.05.
Figure 5—figure supplement 1
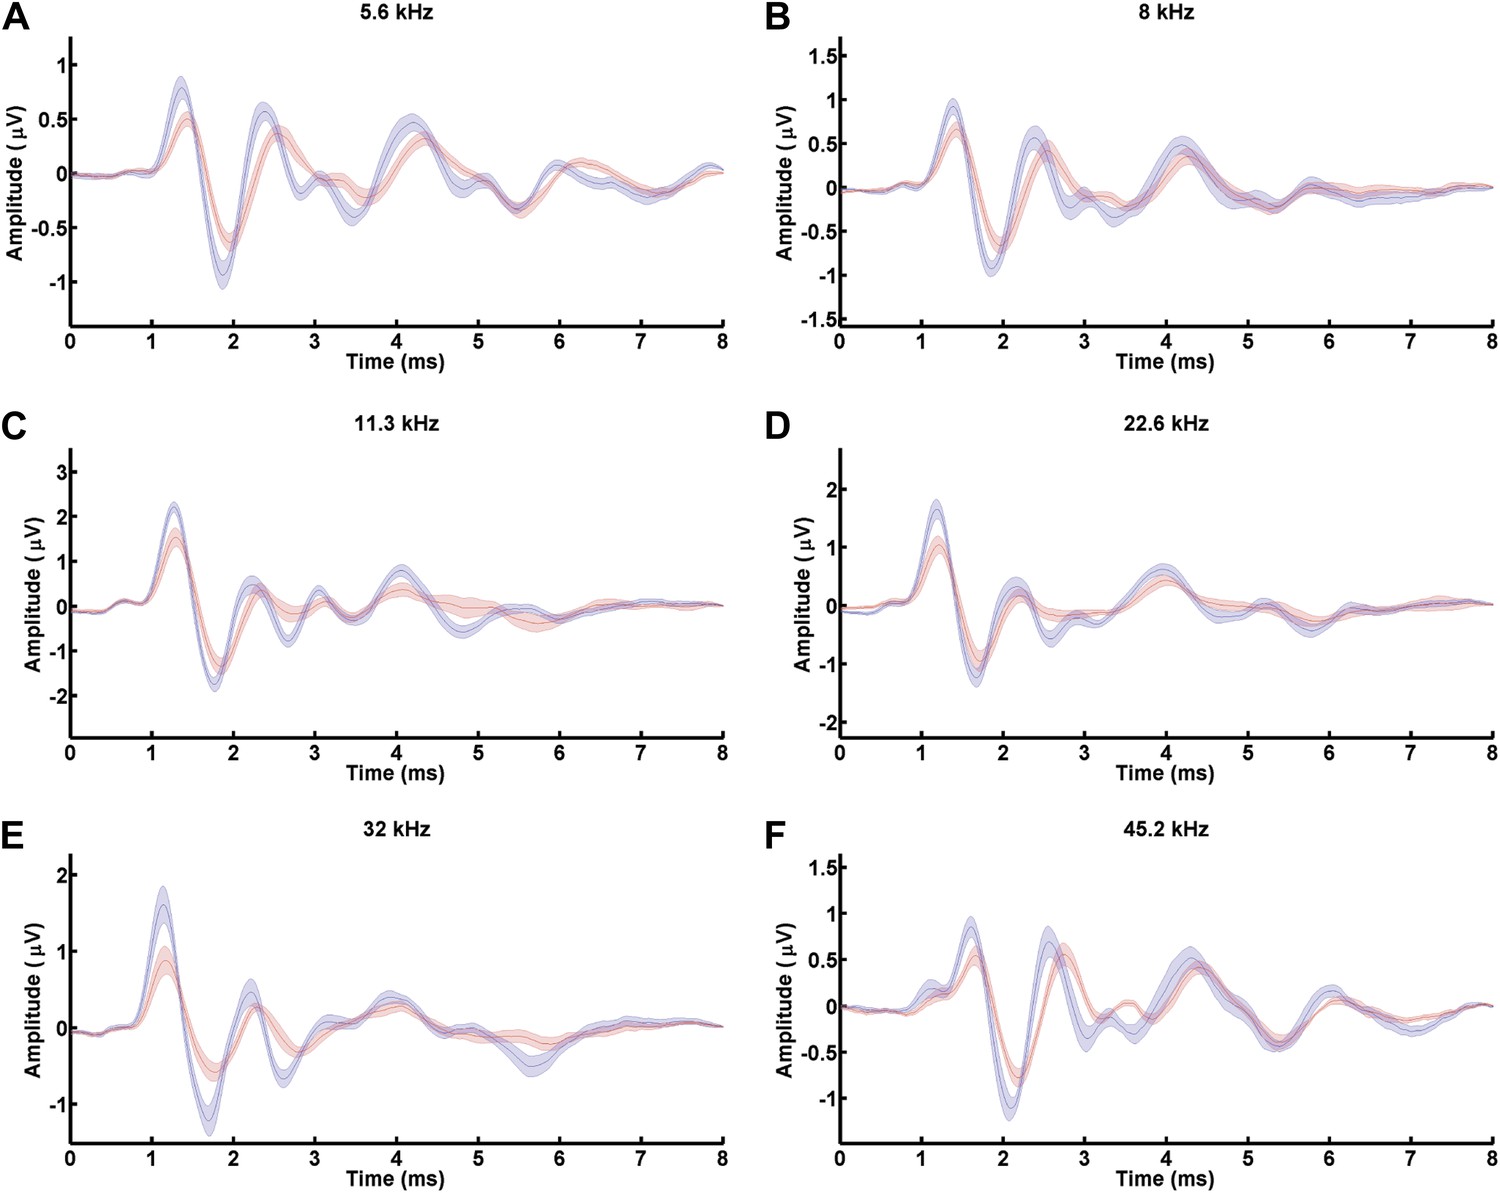
MafbCKO mutants show diminished Wave I of ABRs in response to all frequencies.
(A–F) ABR waveforms of 5.6 kHz (A), 8 kHz (B), 11.3 kHz (C), 22.6 kHz (D), 32 kHz (E), and 45.2 kHz (F) from 16 control (blue line) and 16 MafbCKO (red line) mice were averaged and overlaid. Wave I is delayed and reduced in MafbCKO mutants in response to a wide range of sound frequencies.
Figure 6
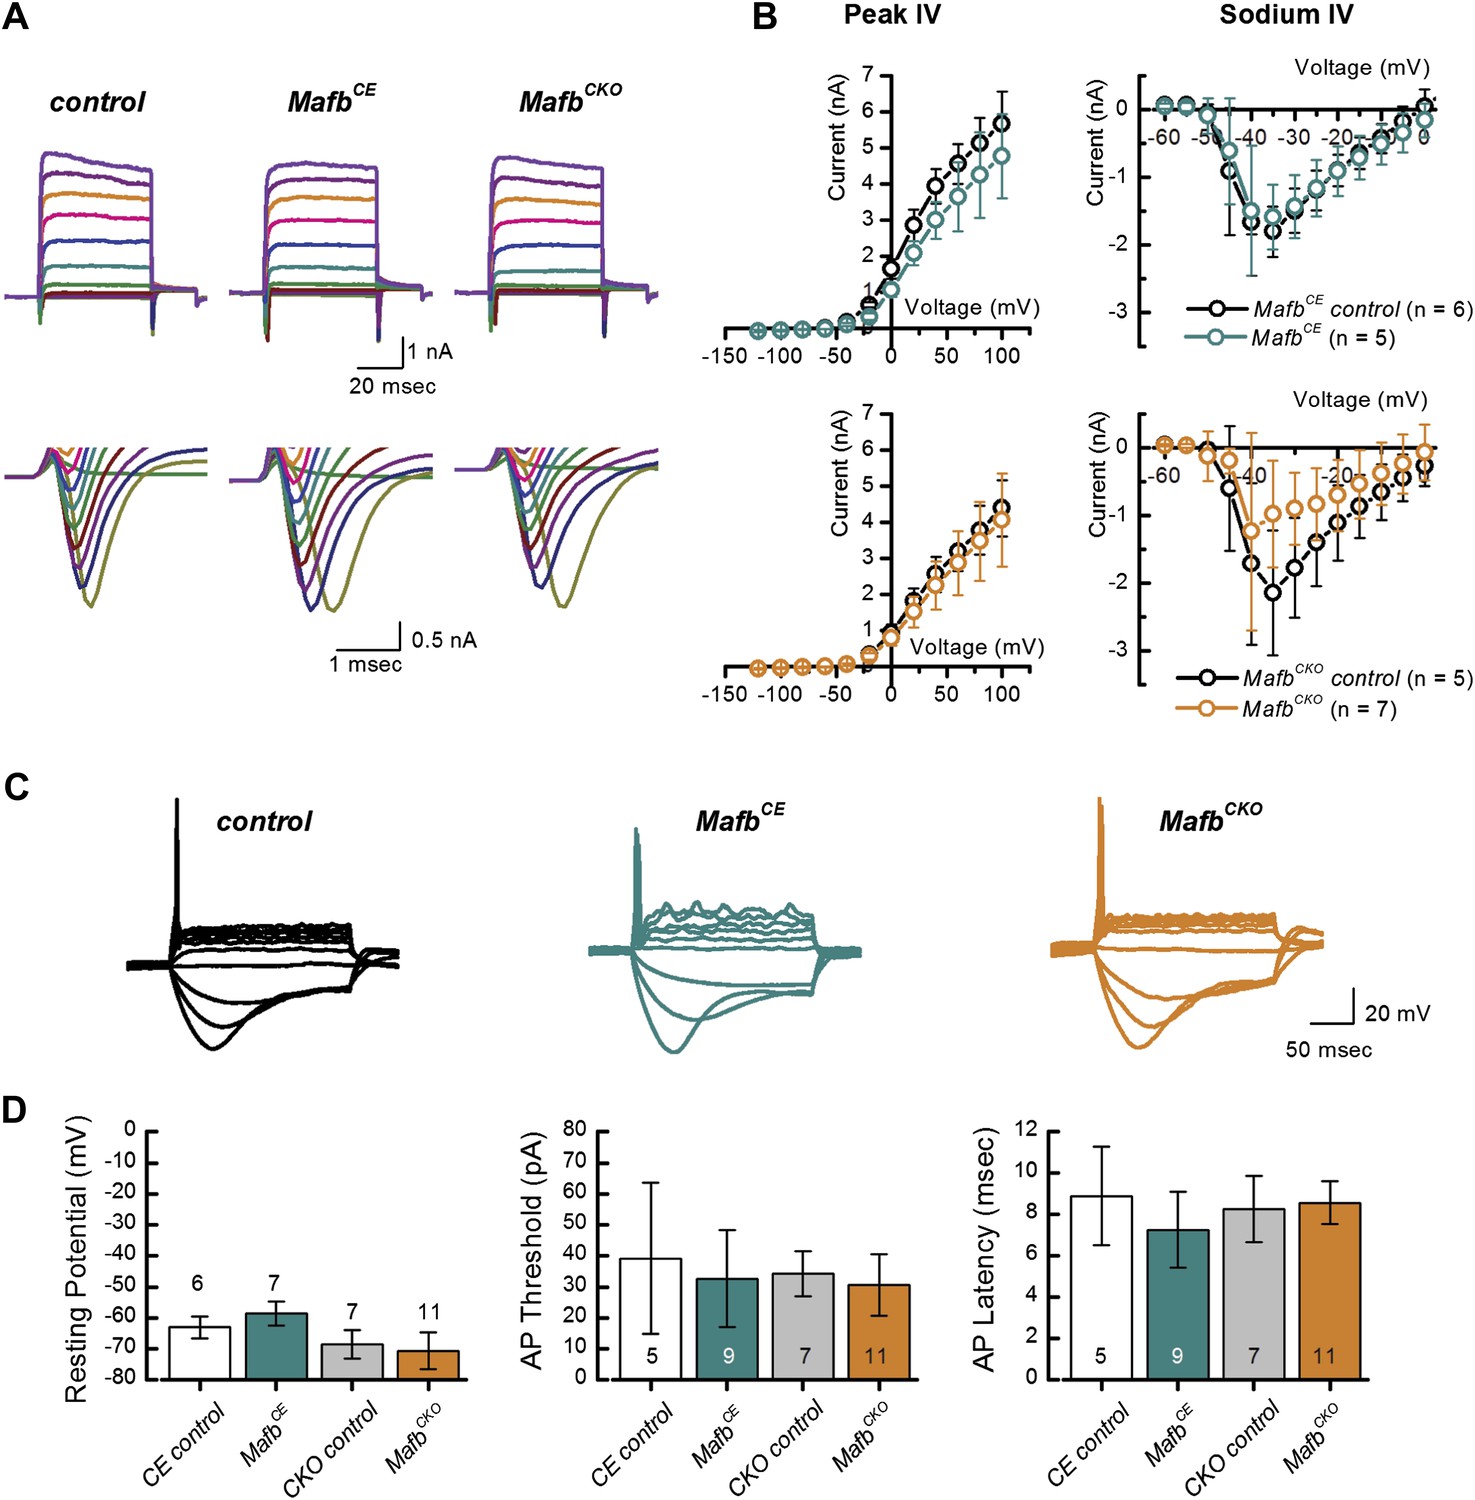
Mafb is not required for development of SGN firing properties.
(A) Representative families of voltage-dependent outward K+ currents (top) and Na+ currents (bottom) recorded from SGNs in organotypic explants harvested from control, MafbCE, and MafbCKO animals at P3. K+ currents were evoked by voltage steps from −124 mV to 104 mV in 10 mV increments from a holding potential of −84 mV. Na+ currents were evoked by 100 ms prepulse to −104 mV from a holding potential of −84 mV, followed by voltage steps from −64 mV to 24 mV in 10 mV increments. Some current traces were removed for clarity. (B) Mean (±1 SD) potassium current–voltage (I–V) (left) and mean (±1 SD) sodium I–V relations (right). Number of SGNs for each genotype is indicated in the legend. (C) Representative current-clamp data recorded from P3 control, MafbCE, and MafbCKO SGNs in response to 200-ms current injections in 10 pA increments from rest. Depolarizing current injections elicit action potentials in littermate control, MafbCE, and MafbCKO SGNs and all exhibit prominent voltage sag in response to hyperpolarizing current injections. (D) Summary graphs of resting membrane potential (left), action potential (AP) threshold (middle), and AP latency (right) measured from MafbCE (dark cyan bar) MafbCKO (orange bar) and their littermate controls, denoted as CE control (white bar) and CKO control (gray bar) in the graphs, respectively. Resting membrane potential was measured as membrane voltage at I = 0 (no current injection). AP threshold was measured as the minimum current required to evoke an AP. AP latency was quantified as the time from the current step to the AP peak for a 50-pA current step.
Figure 7 with 1 supplement
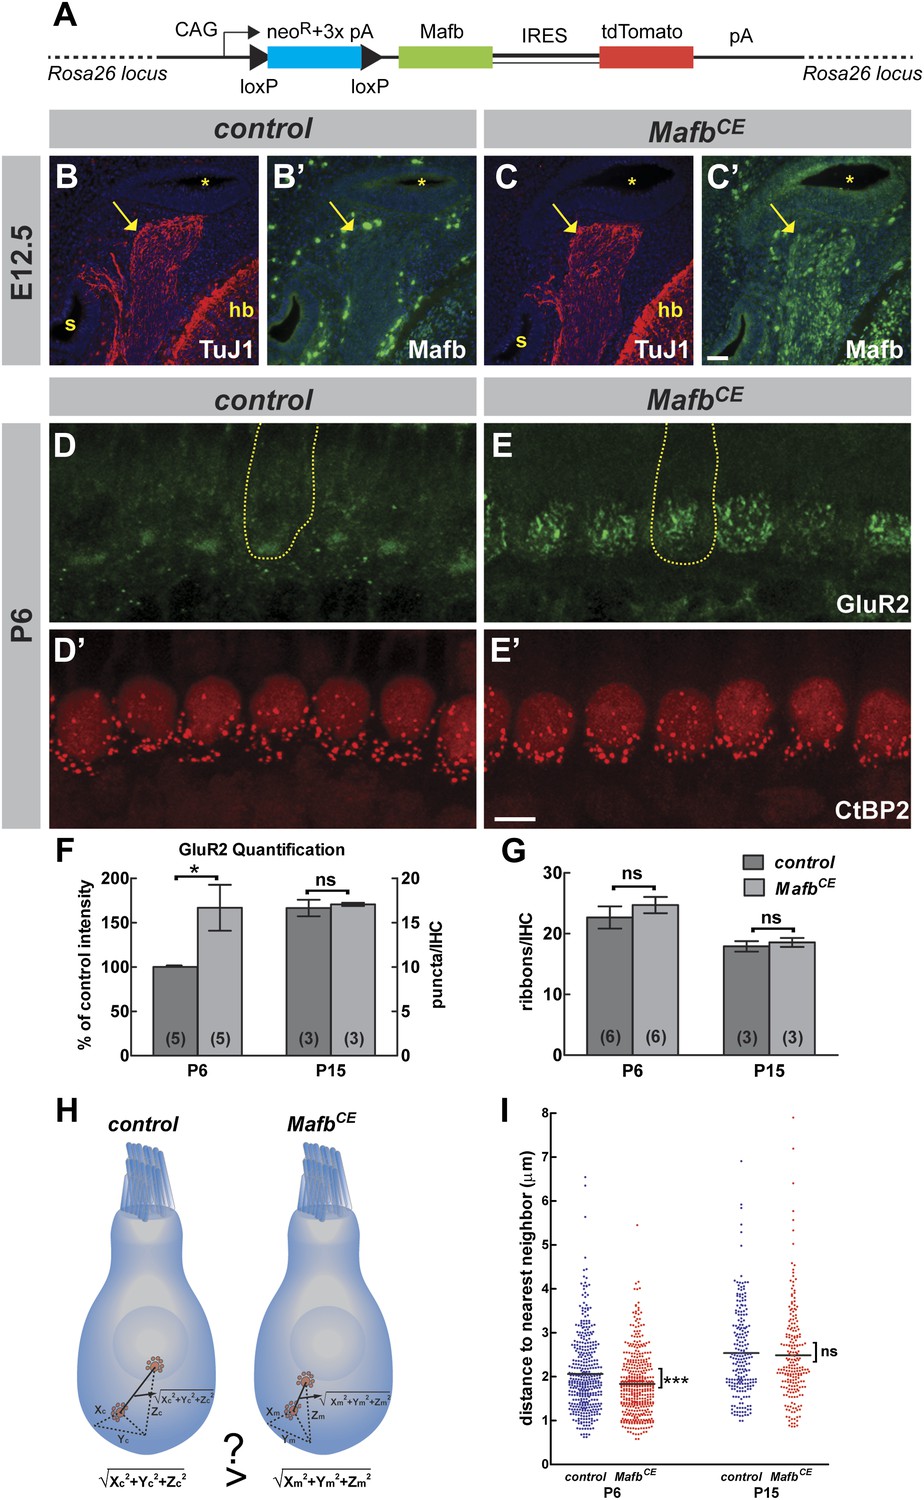
Overexpression of Mafb accelerates synapse development.
(A) MafbCE mice have a Cre-dependent CAG promoter-driven Mafb-ires-tdTomato-pA cassette inserted into the Rosa26 locus. (B–C′) Mafb (green) and TuJ1 (red, to mark spiral ganglia indicated by arrows) immunostaining on transverse sections of E12.5 control (B and B′) and MafbCE (C and C′) heads. The cochlear duct (asterisks), hindbrain (hb) and saccule (s) are visualized with DAPI counterstain (blue). Mafb is present in E12.5 MafbCE SGNs but not control SGNs. (D–E′) P6 control (D and D′) and MafbCE (E and E′) cochleae double stained for GluR2 (green) and CtBP2 (red). Yellow dotted lines (D and E) outline IHCs, as determined by Myo7A staining in another channel (not shown). GluR2 immunostaining shows multiple intense fluorescence patches in the basal region of MafbCE IHCs compared to a single patch in controls. (F) Quantification of P6 GluR2 immunofluorescence intensity (left axis) and P15 GluR2 puncta number per IHC (right axis) in control and MafbCE cochleae. GluR2 immunofluorescence intensity of P6 MafbCE cochleae is expressed as a percentage of control intensity. GluR2 intensity of P6 MafbCE cochleae is significantly increased compared to controls. P15 GluR2 puncta number is similar between control and MafbCE mice. (G) Quantification shows similar ribbon number per IHC in control and MafbCE cochlea at P6 and P15. *: p<0.05. ns: not significant. (H) Illustration of how the 3D distance between two ribbons was measured. (I) Scatter plot of the distance to nearest neighbor of P6 and P15 control (blue) and MafbCE (red) ribbons. Middle bar represents mean. ***: p<0.001. ns: not significant. n=407 control and 428 MafbCE ribbons in 18 IHCs from 6 mice at P6, 217 control and 215 MafbCE ribbons in 12 IHCs from three mice at P15. P6 MafbCE ribbons are significantly closer to their nearest neighbors compared to controls, reflecting an overall increased confinement of ribbons to the basal pole of the IHC. Scale bar in C′ is 50 µm (B–C′); in E′ is 5 µm (D–E′).
Figure 7—figure supplement 1
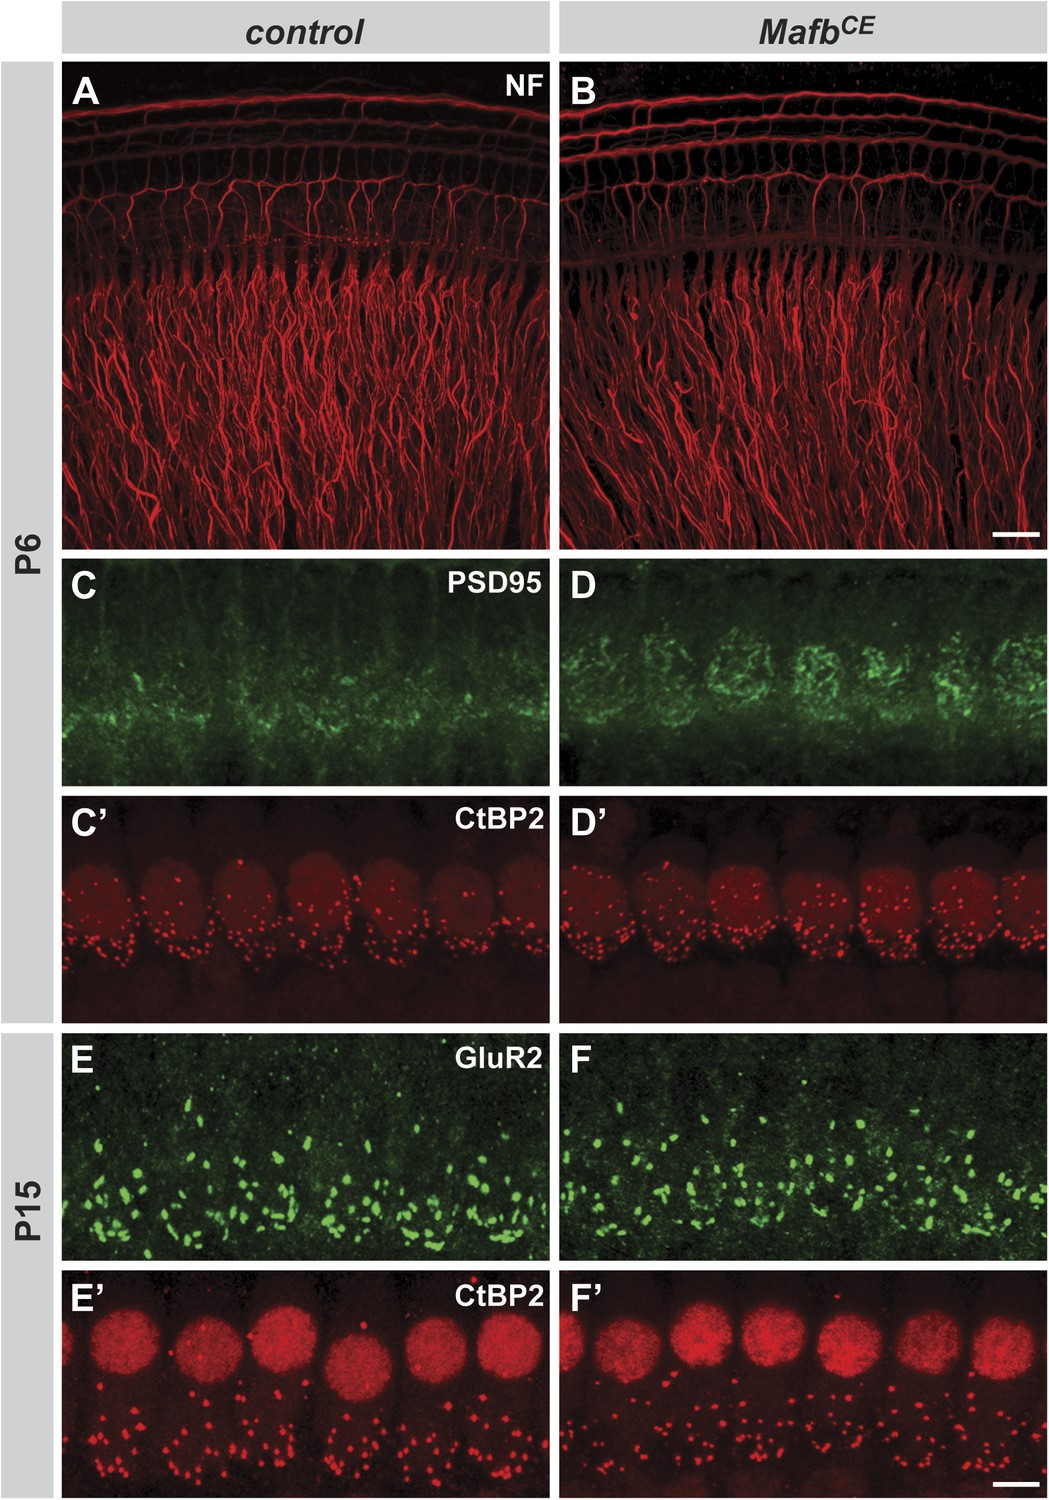
MafbCE mice show precocious development of IHC ribbon synapses.
(A and B) Projections of confocal stacks from P6 control (A) and MafbCE (B) cochlear whole-mounts stained for Neurofilament (NF) to label neuronal processes. MafbCE cochleae show no gross abnormalities in neurite organization. (C–D′) Projections of confocal stacks from P6 control (C and C′) and MafbCE (D and D′) cochlear whole-mounts double stained for PSD-95 (green) and CtBP2 (red). MafbCE afferent terminals show more PSD95 immunofluorescence at the basal region of IHCs when compared to control littermates. (E–F′) Projections of confocal stacks from P15 control (E and E′) and MafbCE (F and F′) cochlear whole-mounts double stained for GluR2 (green) and CtBP2 (red). The number of GluR2 and CtBP2 puncta is similar in control and MafbCE cochleae at P15. Scale bar in B is 20 µm (A and B); in F′ is 5 µm (C–F′).
Figure 8 with 1 supplement
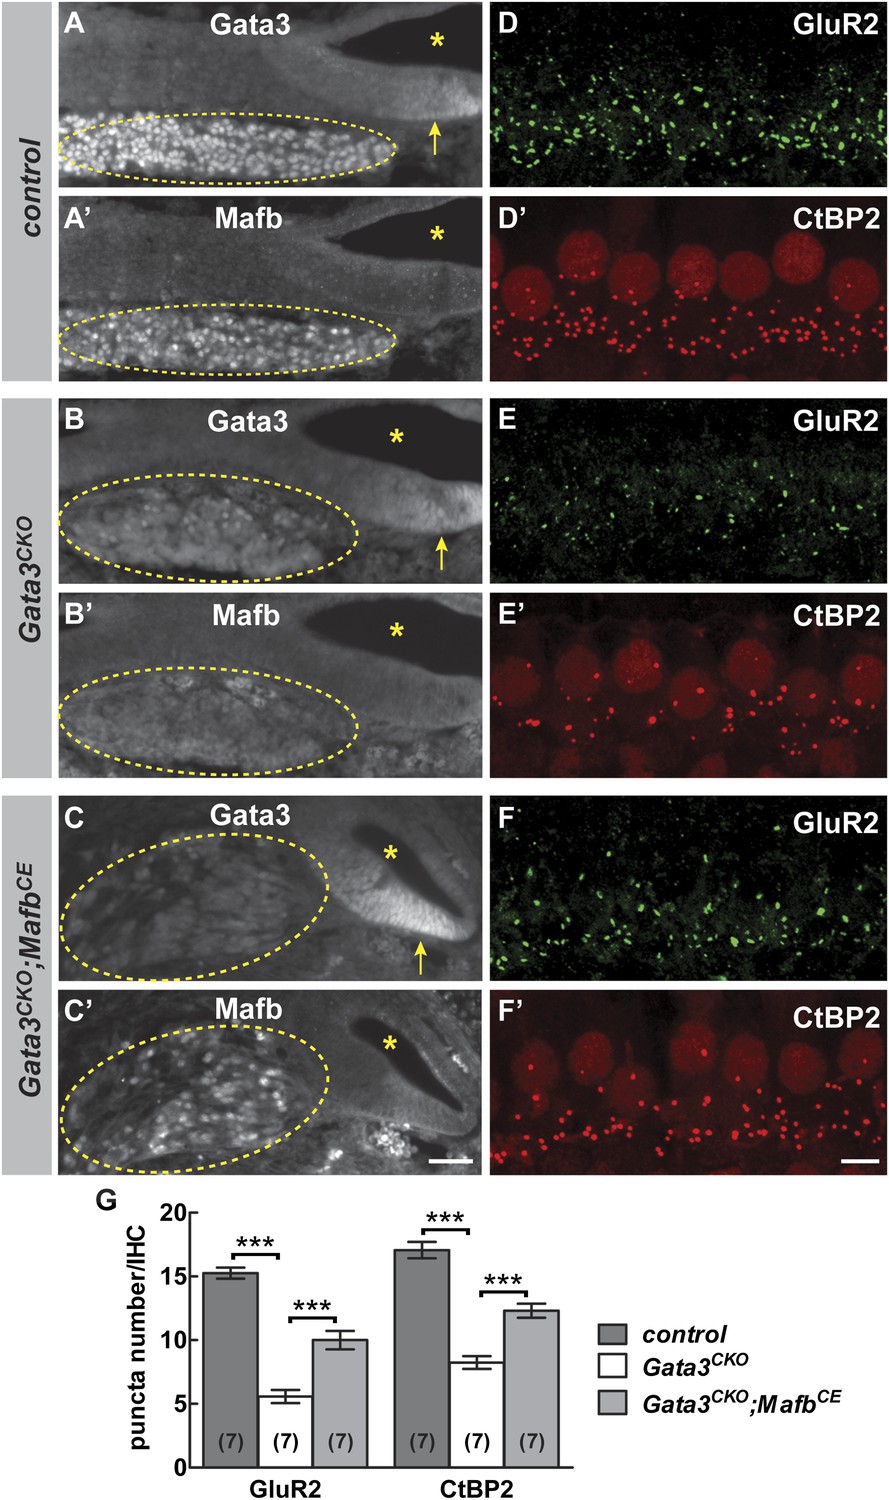
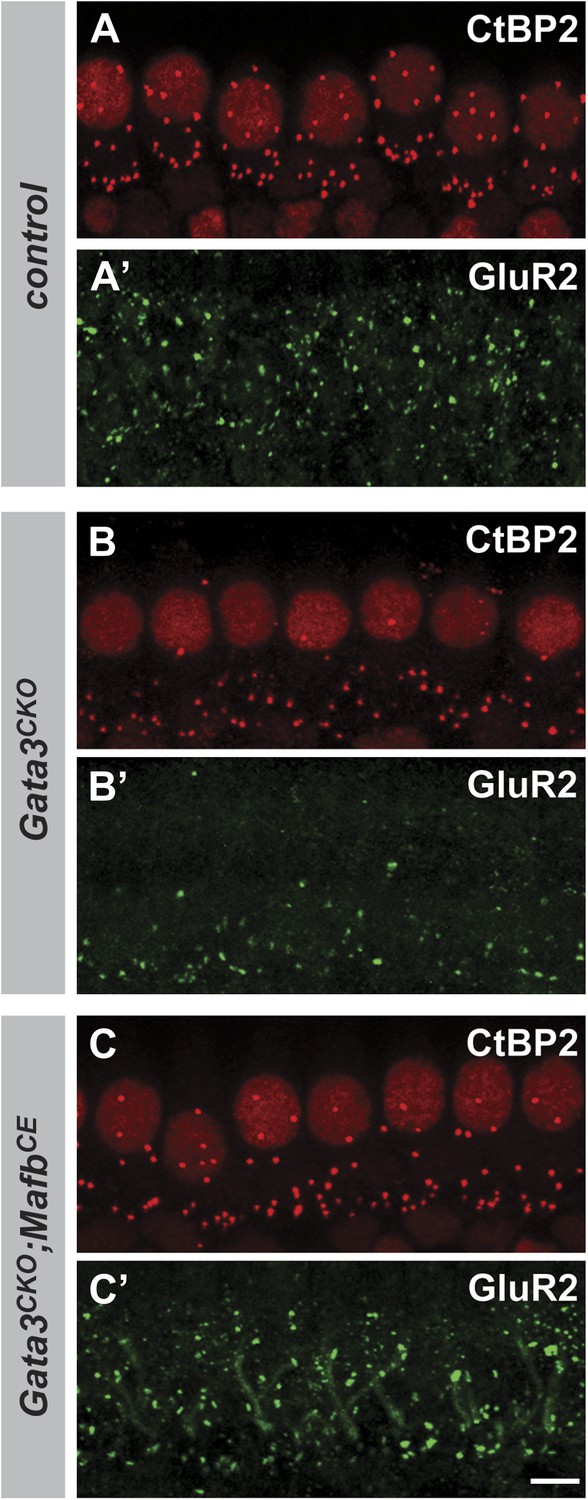
Mafb acts downstream of Gata3 to control synapse development.
(A-C’) Transverse sections of E16.5 control (A and A′), Gata3CKO (B and B′) and Gata3CKO;MafbCE (C and C′) cochleae double immunostained with antibodies against Gata3 (A, B, C) and Mafb (A′, B′, C′). Asterisks indicate the cochlear duct. Gata3 and Mafb are normally co-expressed in SGNs at E16.5 (A and A′). In Gata3CKO mutants (B and B′), Gata3 protein is severely reduced in SGNs (B, circled) but is maintained in the cochlear duct (B, arrow). Mafb expression is also diminished (B′). In contrast, Mafb expression is restored in Gata3CKO;MafbCE SGNs (C′), despite the loss of Gata3 (C). (D-F’) Confocal stacks from P15 control (D and D′), Gata3CKO (E and E′) and Gata3CKO;MafbCE (F and F′) cochlear whole-mounts double stained for GluR2 (green) and CtBP2 (red). The number of GluR2 and CtBP2 puncta is decreased in Gata3CKO mice (E and E’) compared to controls (D and D′). Pre- and post-synaptic puncta are partially recovered in Gata3CKO;MafbCE mice (F and F′). (G) Quantification of GluR2 puncta and ribbon number per IHC in control, Gata3CKO and Gata3CKO;MafbCE cochleae at P15. The number of GluR2 and CtBP2 puncta is decreased in Gata3CKO cochleae but partially restored in Gata3CKO;MafbCE cochleae when compared to controls. ***: p<0.0005. Scale bar in C′ is 50 µm (A–C′); in F′ is 5 µm (D–F′).
Figure 8—figure supplement 1
Restoring Mafb expression in Neurog1-Cre;Gata3CKO SGNs partially rescues the number of IHC ribbon synapses.
(A–C′) Projections of confocal stacks from P15 littermate control (Gata3flox/tauLacZ) (A and A′), Neurog1-Cre;Gata3CKO (Neurog1-Cre; Gata3flox/tauLacZ) (B and B′) and Neurog1-Cre;Gata3CKO;MafbCE [Neurog1-Cre;Gata3flox/tauLacZ;Gt(ROSA)26SorCAG-lsl-Mafb] (C and C′) cochlear whole-mounts double stained for GluR2 (green) and CtBP2 (red). The number of GluR2 and CtBP2 puncta is decreased in Gata3CKO mice (B and B′) but partially restored in Gata3CKO;MafbCE mice (C and C′). Scale bar is 5 µm.
Tables
Table 1
Quantitative analysis of IHC ribbon synapses
| GluR2 puncta number per IHC (mouse number) | p-value | CtBP2 puncta number per IHC (mouse number) | p-value | ||
|---|---|---|---|---|---|
| P6 | CE control | n/a | n/a | 23.0 ± 0.6 (6) | 0.0750 (ns) |
| MafbCE | n/a | 24.5 ± 0.4 (6) | |||
| CKO control | n/a | n/a | 23.2 ± 0.7 (3) | 0.0187 | |
| MafbCKO | n/a | 18.4 ± 1.0 (3) | |||
| P15 | CE control | 16.6 ± 0.9 (3) | 0.6916 (ns) | 17.9 ± 0.5 (3) | 0.3757 (ns) |
| MafbCE | 17.1 ± 0.2 (3) | 18.6 ± 0.4 (3) | |||
| CKO control | 16.9 ± 0.3 (6) | 0.0001 | 18.0 ± 0.3 (10) | 7.6 × 10⁻⁵ | |
| MafbCKO | 8.6 ± 1.0 (6) | 12.5 ± 1.0 (10) | |||
| Gata3CKO control | 15.3 ± 0.4 (7) | 6.4 × 10⁻⁹ | 17.1 ± 0.6 (7) | 1.4 × 10⁻⁷ | |
| Gata3CKO | 5.6 ± 0.5 (7) | 0.0003 | 8.2 ± 0.5 (7) | 0.0001 | |
| Gata3CKO;MafbCE | 10.0 ± 0.7 (7) | 12.3 ± 0.6 (7) | |||
| Adult | CKO control | 15.2 ± 0.7 (6) | 2.7 × 10⁻⁶ | 17.6 ± 0.5 (8) | 0.0014 |
| MafbCKO | 6.8 ± 0.4 (6) | 12.0 ± 1.3 (8) |
-
Means ± SEMs are shown. p-values were obtained by Student’s t-test. Quantification and statistical results of GluR2 and CtBP2 puncta from all mouse strains used in this study.
Download links
A two-part list of links to download the article, or parts of the article, in various formats.
Downloads (link to download the article as PDF)
Open citations (links to open the citations from this article in various online reference manager services)
Cite this article (links to download the citations from this article in formats compatible with various reference manager tools)
A Gata3–Mafb transcriptional network directs post-synaptic differentiation in synapses specialized for hearing
eLife 2:e01341.
https://doi.org/10.7554/eLife.01341


