The genomic landscape of meiotic crossovers and gene conversions in Arabidopsis thaliana
- Wageningen University, Netherlands
- IBMP–CNRS, Université de Strasbourg, France
- Max Planck Institute for Plant Breeding Research, Germany
- Max Planck Institute for Developmental Biology, Germany
- Rijk Zwaan, Netherlands
- Center for Genomic Regulation (CRG) and Universitat Pompeu Fabra (UPF), Spain
Figures
Figure 1 with 2 supplements
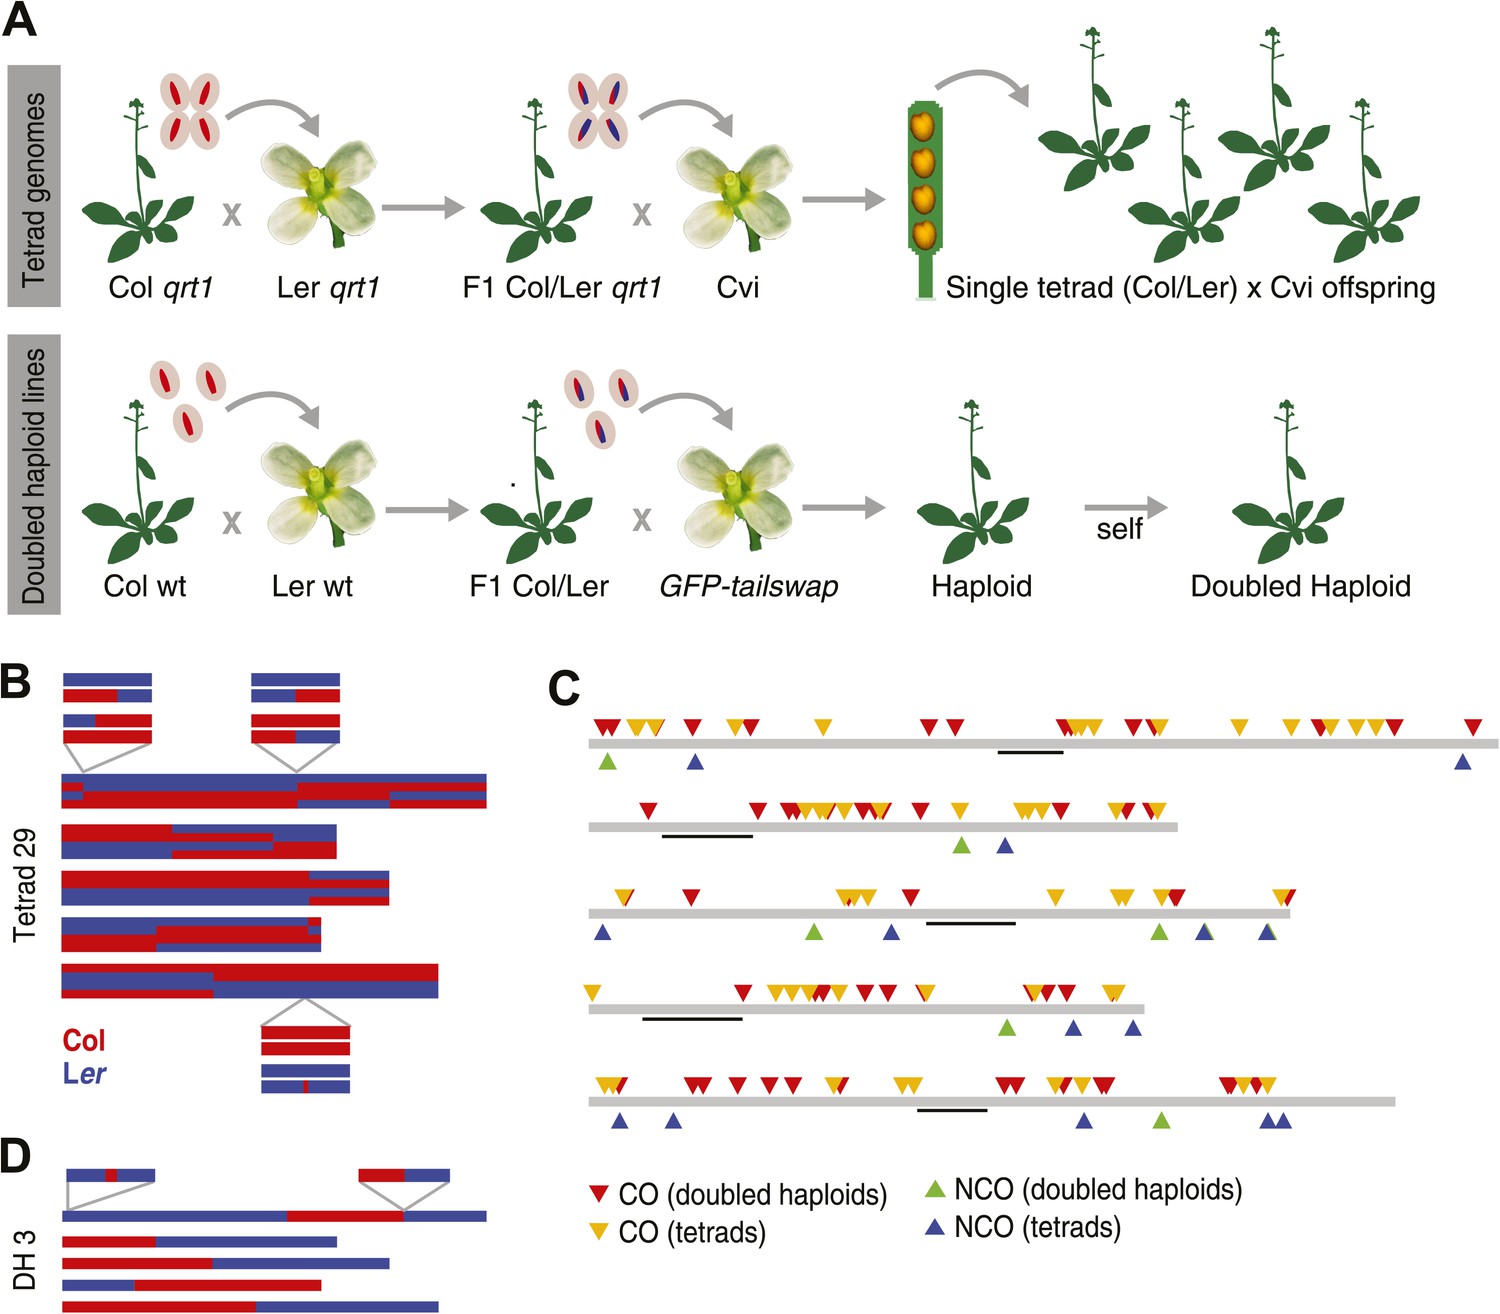
Experimental design and summary of recombination events within 62 recombinants.
(A) 13 complete tetrads were generated by crossing qrt1 in a Col background to qrt1 in a Ler background, and then using single pollen tetrads from the F1 hybrids to fertilize a Cvi male sterile pollen receptor. Tetrad offspring are heterozygous, with one recombinant Col-Ler genome and one Cvi genome. 10 DH lines were generated by crossing wildtype Col-Ler F1 hybrids to the GFP-tailswap haploid inducer. One round of selfing generated doubled haploids. (B) Example of graphical genotypes of all five Col-Ler recombinant chromosomes of all four offspring of a complete tetrad. Col regions are shown in red, Ler regions in blue. The homologous chromosome, which is inherited from Cvi, is not shown. The three enlarged regions show a CO–GC, a CO without GC and a NCO–GC (clockwise, starting at the upper left corner). (C) All recombination events identified in this study. Different recombination types are labeled with different colors. Centromere positions are indicted with black lines. (D) Example of the graphical genotypes of the five chromosomes of one DH line (Col regions are shown in red, Ler regions in blue). The two enlarged regions show a NCO–GC (left) and a CO without GC (right).
Figure 1—figure supplement 1
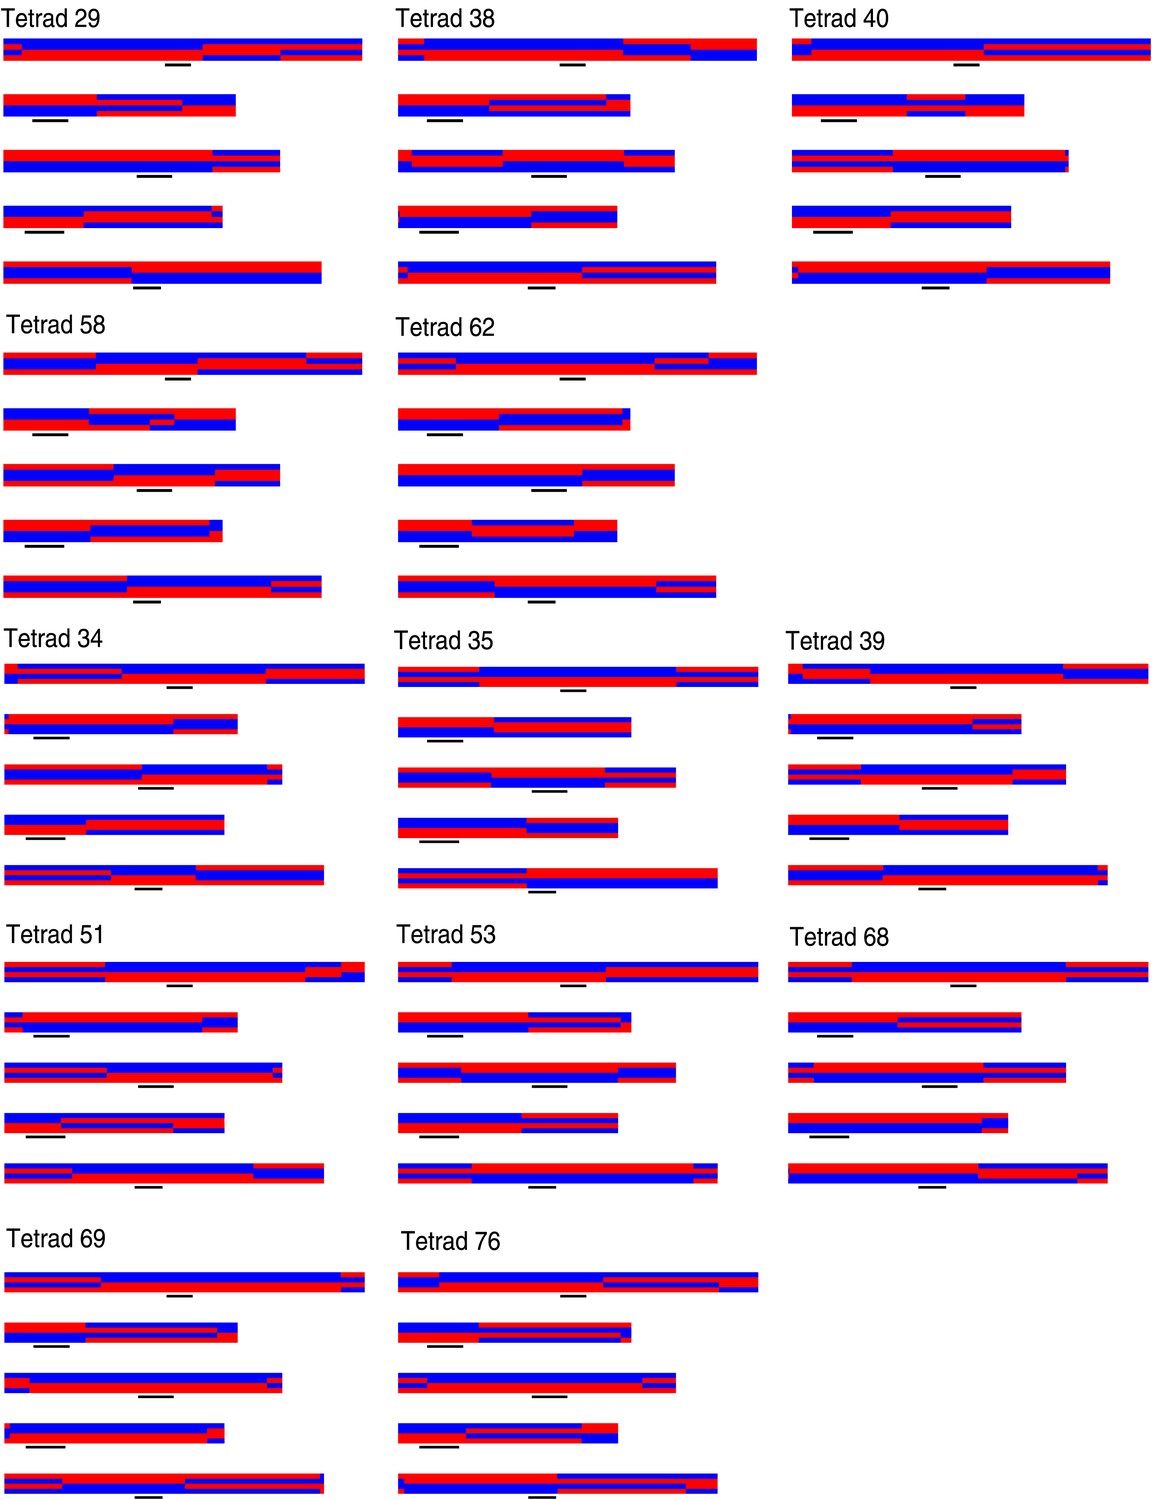
Graphical genotypes of all 13 complete tetrads.
For each tetrad, all five chromosomes of all four offspring are shown (chromosome one to five, top to bottom). The four offspring genomes of one tetrad are plotted one above the other. Black lines depict peri-centromeric regions. The upper five tetrads (29, 38, 40, 58, and 62) are the deeply sequenced tetrads and were used for the detection of NCO–GCs.
Figure 1—figure supplement 2
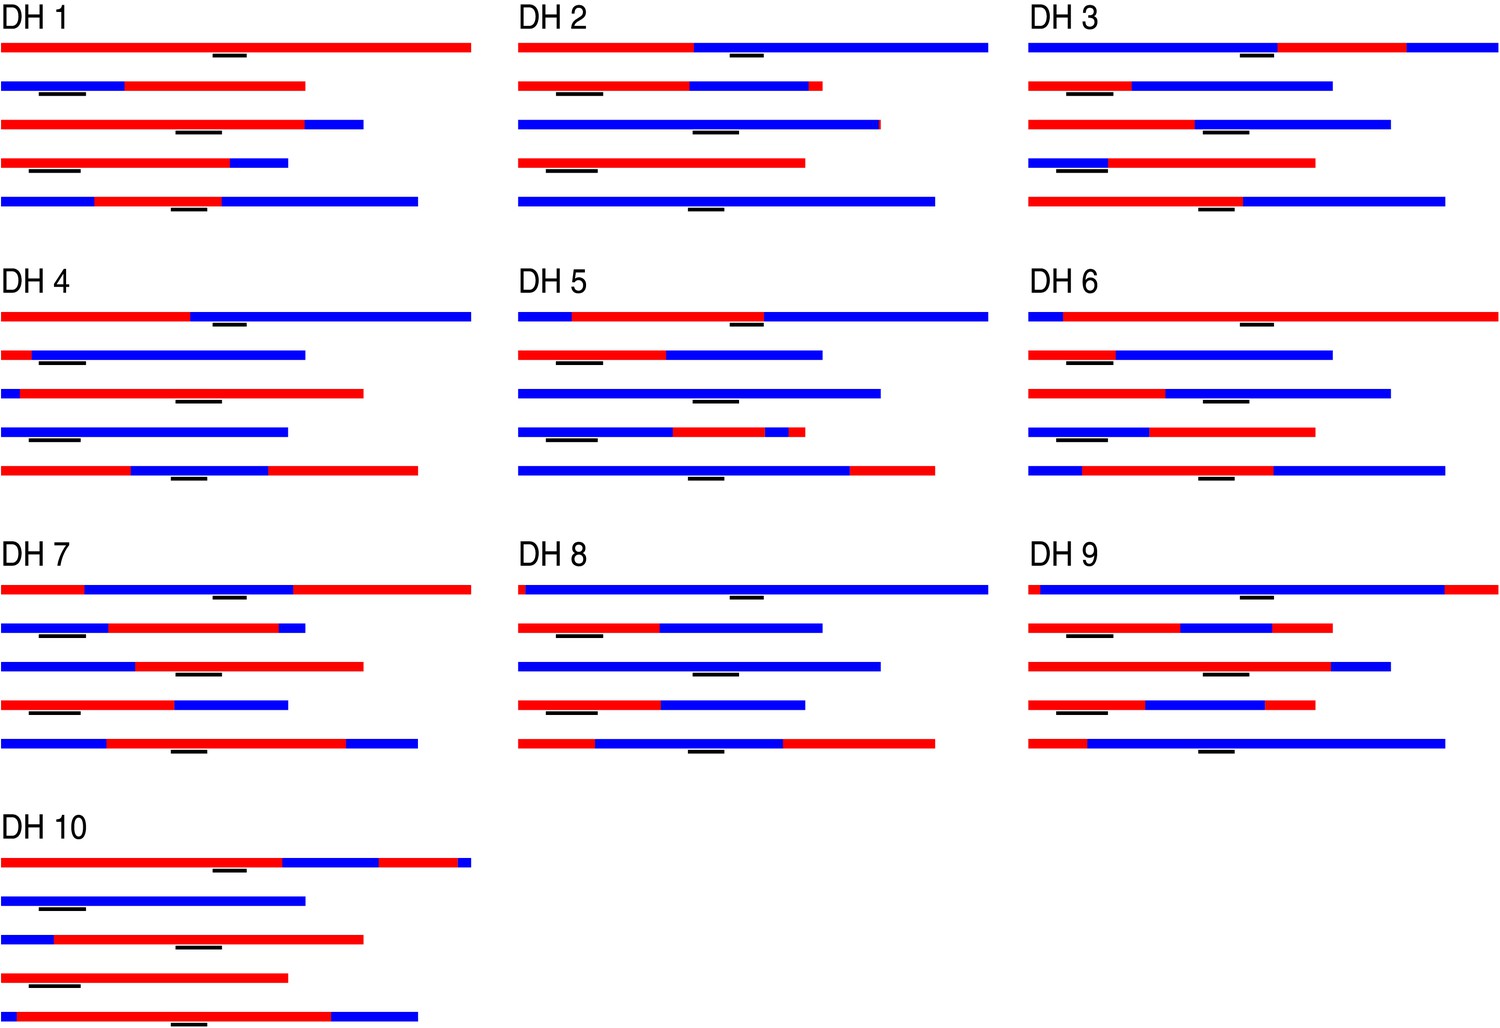
Graphical genotypes of 10 DH lines.
For each DH line, all five chromosomes are shown, chromosome one to five (top to bottom). Black lines depict peri-centromeric regions.
Figure 2 with 6 supplements
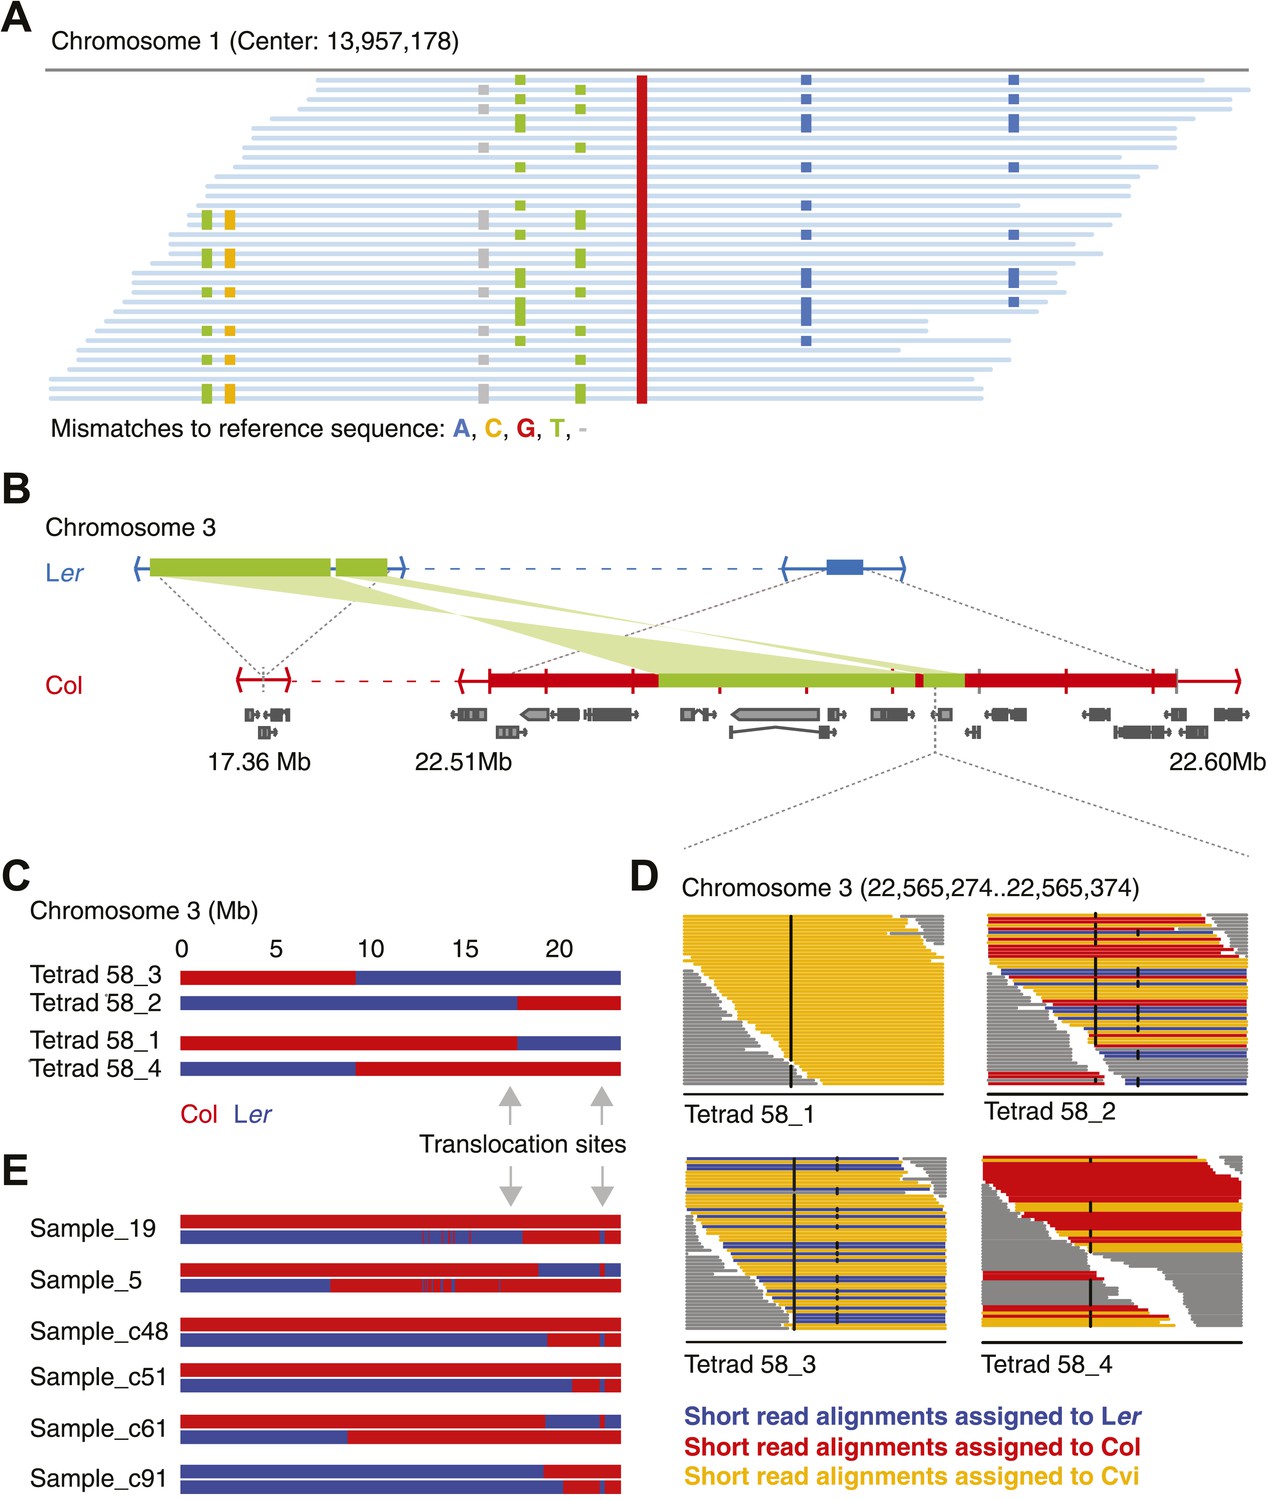
Identification of gene conversions is complex because of unknown duplications and transpositions in the A. thaliana genome.
(A) Short read alignments of Ler against the reference sequence at position 13,957,178 on chromosome 1. Individual reads are shown as blue lines, while mismatches between reference sequence and short reads are colored according to mismatch types. Three distinct Ler haplotypes align to this region, indicating that this sequence is present in triplicate in the Ler genome. As Ler is homozygous, at least two haplotypes were not aligned to their respective origin. (B) The genomic landscape of the two insertion sites of an ∼80 kb transposition between Ler and Col. Blue and red boxes mark sequences that are unique to Ler and Col respectively. Green boxes highlight the transposed (and inverted) DNA. Genes annotated in Col are shown in grey. (C) Graphical genotypes of chromosome 3 of the four genomes of tetrad 58 (Col-derived genomic regions are shown in red, Ler regions in blue). Cvi sequences are not shown. Grey arrows indicate the insertion sites of the transposition illustrated in B. Tetrad 58_1 and tetrad 58_2 formed a crossover between these insertion sites. As a result, tetrad 58_1 lost all transposed sequences, whereas in tetrad 58_2 the transposed DNA is duplicated. (D) Short read alignments of all four genomes of tetrad 58 to chromosome 3 at positions 22,565,274 to 22,565,374, which overlap the transposed DNA. This region includes two closely linked SNPs that can distinguish all three parental alleles (black dots indicate mismatches to the reference sequence). The reads that can be assigned to one of the three parents are shown by different colors. Tetrad 58_1, which lost the transposed DNA, shows the absence of Col and Ler derived reads, whereas tetrad 58_2, which inherited both transposed regions, shows the presence of both Col and Ler alleles in this region. (E) Redrawing of the graphical genotypes of six Col-Ler F2 offspring, as presented in the appendix of Yang et al. (2012). These offspring experienced a putative double CO, co-localizing with the Col insertion site of above-mentioned transposition. Note that in all six F2 offspring, at least one of the recombinant chromosomes features a CO between the transposition sites. This suggests that the annotated double recombinations are not real, but that the observed patterns originate from copy number variation due to transposed DNA.
Figure 2—figure supplement 1
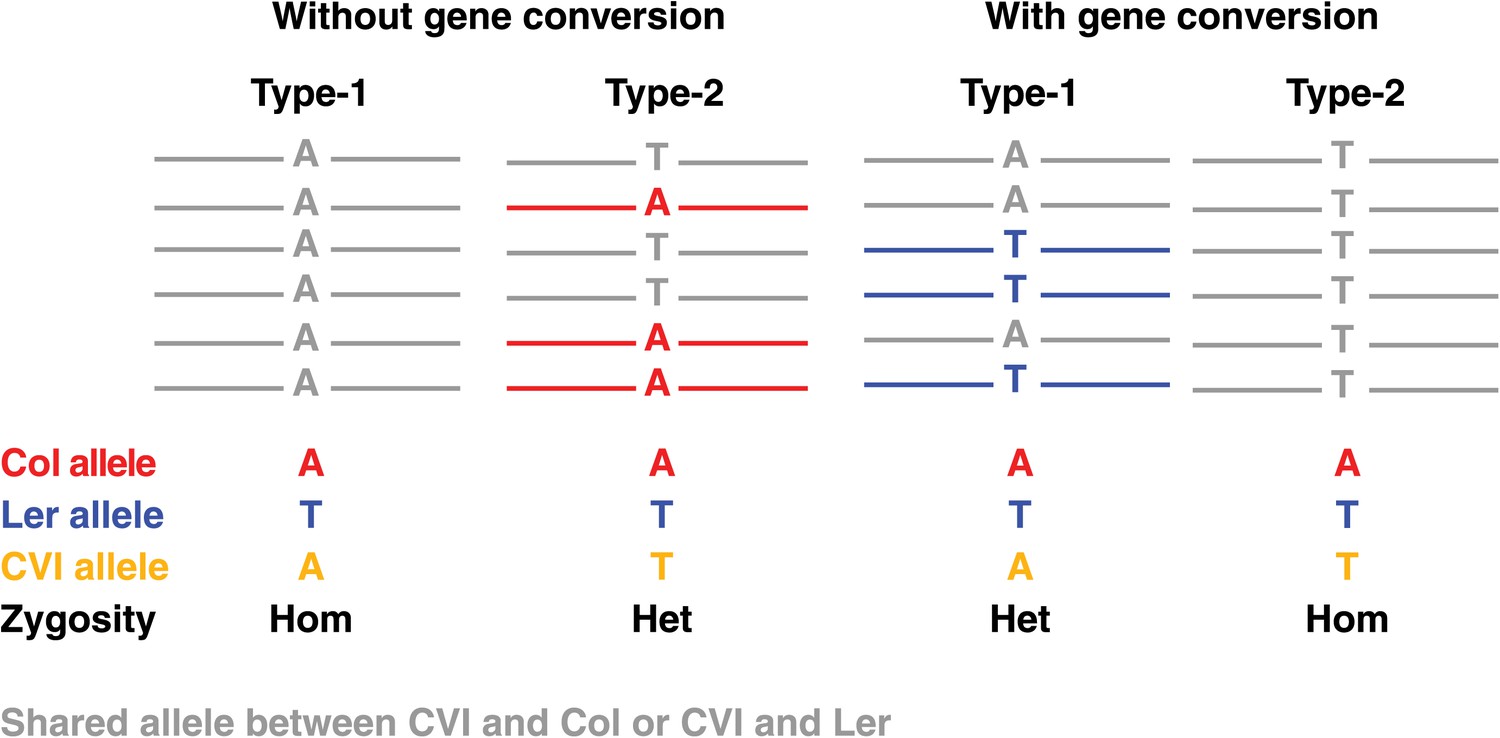
Graphical illustration of short read alignments at type-1 and type-2 markers revealing no NCO–GCs (two loci at the left) and the same loci revealing type-1 and type-2 NCO-GCs (right).
Short read alignments are shown in colors according to the respective genome, if they cannot be uniquely assigned to one unique parent they are shown in grey. At type-1 markers, the expected allele of the recombinant Col or Ler chromosome is similar to the Cvi allele. This leads to a homozygous genotype (left). At type-2 markers, Cvi is different from the expected allele and a heterozygous marker is observed (second from left). In contrast, in the case of GCs, type-1 markers will reveal an additional allele, whereas type-2 markers will feature the absence of an expected allele (two loci on the right).
Figure 2—figure supplement 2
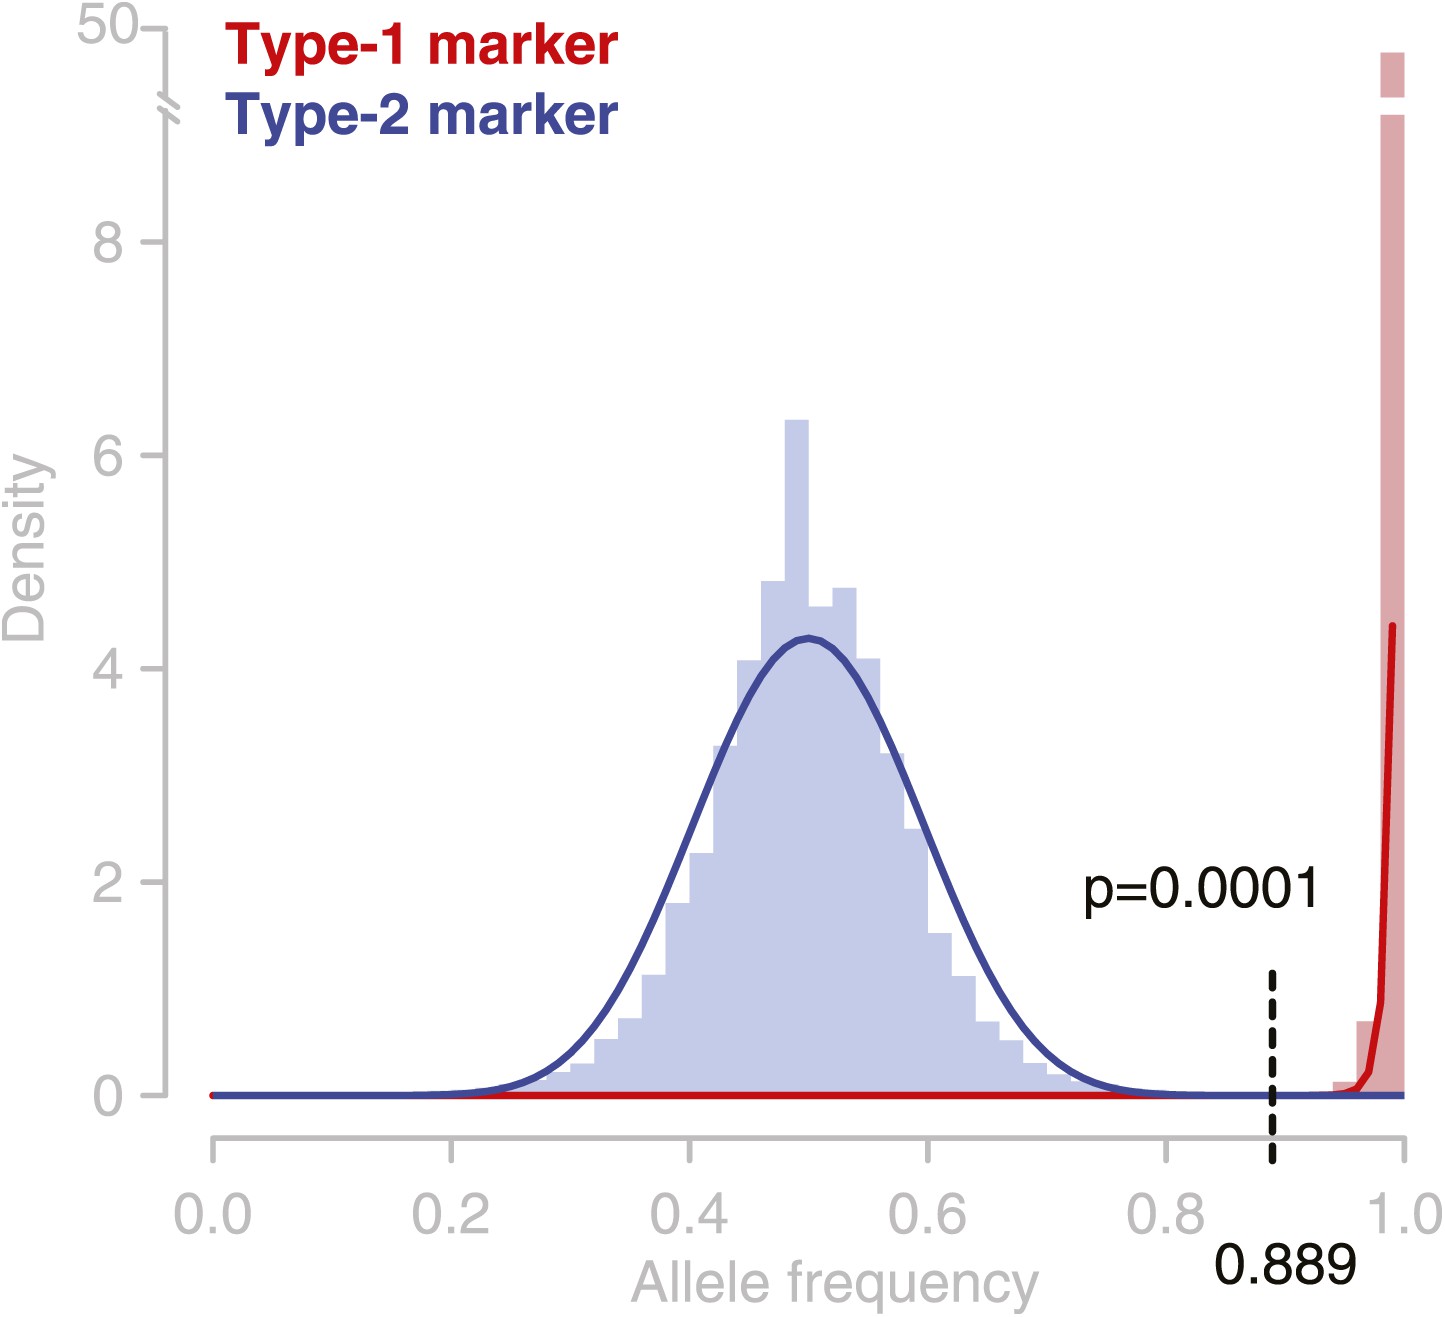
Observed allele distribution throughout all deeply sequenced tetrad genomes.
Observed allele frequencies (AFs) were derived from allele counts (based on short read alignments) at the respective marker loci. AFs at type-1 markers (homozygous alleles) are shown in red, AFs at type-2 markers in blue (heterozygous alleles). Blue and red lines are beta distributions fitted to the observed AF distributions. These were used as probability functions for short read-based AFs. At an allele frequency of 0.889 the percentiles of the two probability functions were almost similar. Hence, assigning heterozygous and homozygous alleles based on this frequency cutoff has an almost similar accuracy for type-1 and type-2 markers, and the error rate of GC assignment at type-1 and type-2 markers is expected to be equal.
Figure 2—figure supplement 3
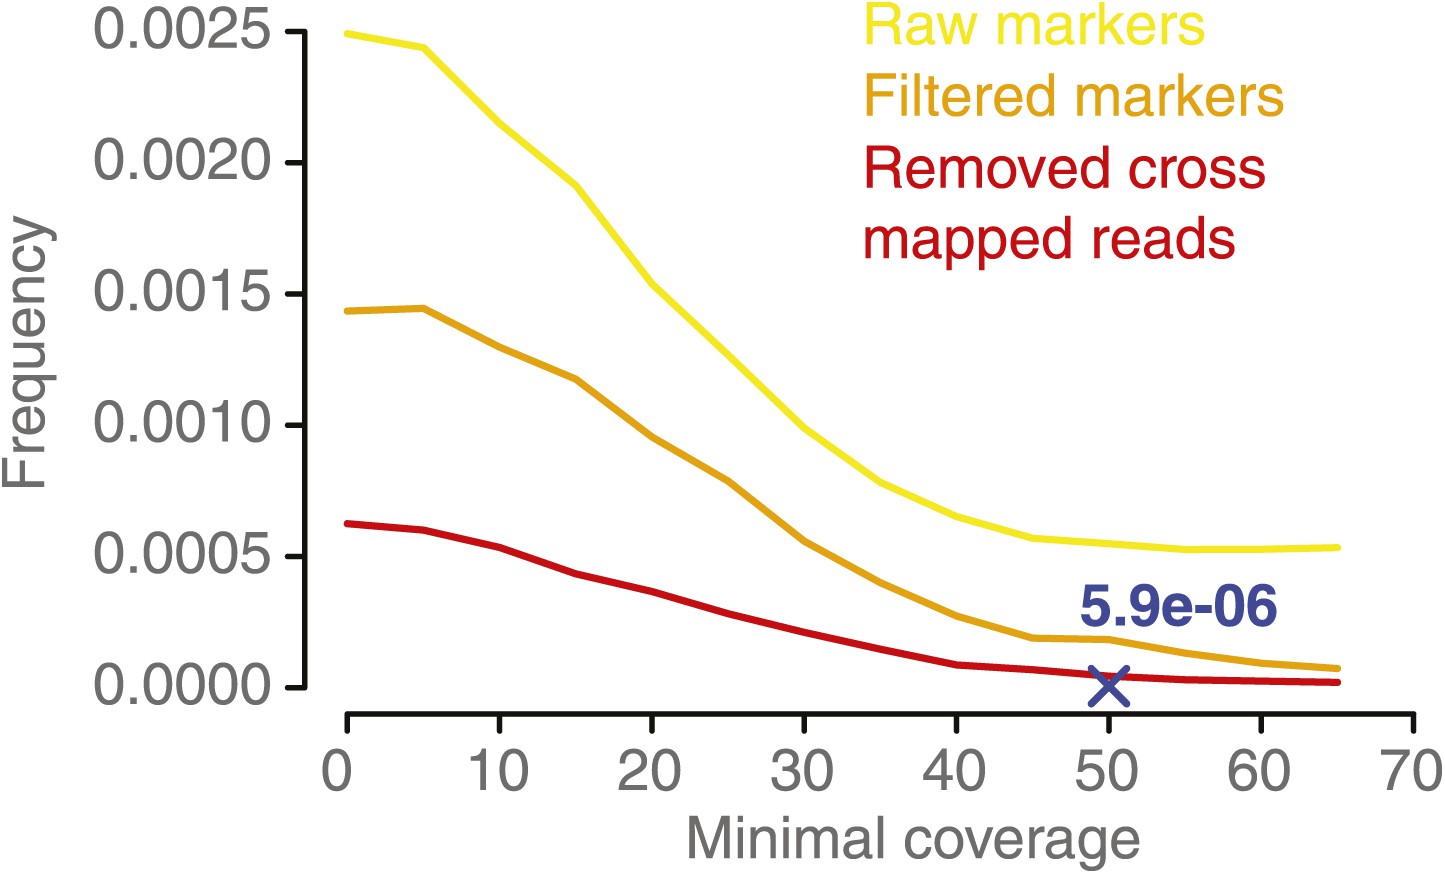
NCO–GC frequency per marker per meiosis measured in the five deeply sequenced tetrads, using a range of minimal coverage thresholds and three different marker sets.
NCO–GC frequency was assessed using different marker sets. Marker sets with more stringent filtering showed a lower frequency of putative NCO–GCs, which indicates that filtering reduces the incidence of false positives. For all sets we observed that too low minimal coverage thresholds (for assigning either a NCO–GC or no NCO–GC) led to increased putative NCO–GC frequencies. NCO–GC frequency leveled off beyond a coverage requirement of 50x for all marker sets. The blue cross indicates the estimated NCO–GC frequency, based on all PCR-validated NCO–GCs.
Figure 2—figure supplement 4

The number of putative type-1 and type-2 NCO–GCs in all 20 deeply sequenced tetrad offspring using different marker sets.
Bar charts show the number of NCO–GC detected per offspring plant using different marker set generated with different filter stringencies in each subsequent step (top to bottom). Quality score filtered marker sets revealed an overrepresentation of type-1 NCO–GC (top panel). Even after filtering for markers in close vicinity to putatively duplicated regions, some samples still showed a relative high incidence of type-1 markers (2nd panel). After removing markers with falsely aligned reads (using regions where all three parental alleles could be distinguished) and regions of high sequence divergence, the overall number of NCO–GCs was drastically reduced, however the ratio of type-1 and type-2 markers is close to equal, as theoretically expected (3rd panel).
Figure 2—figure supplement 5
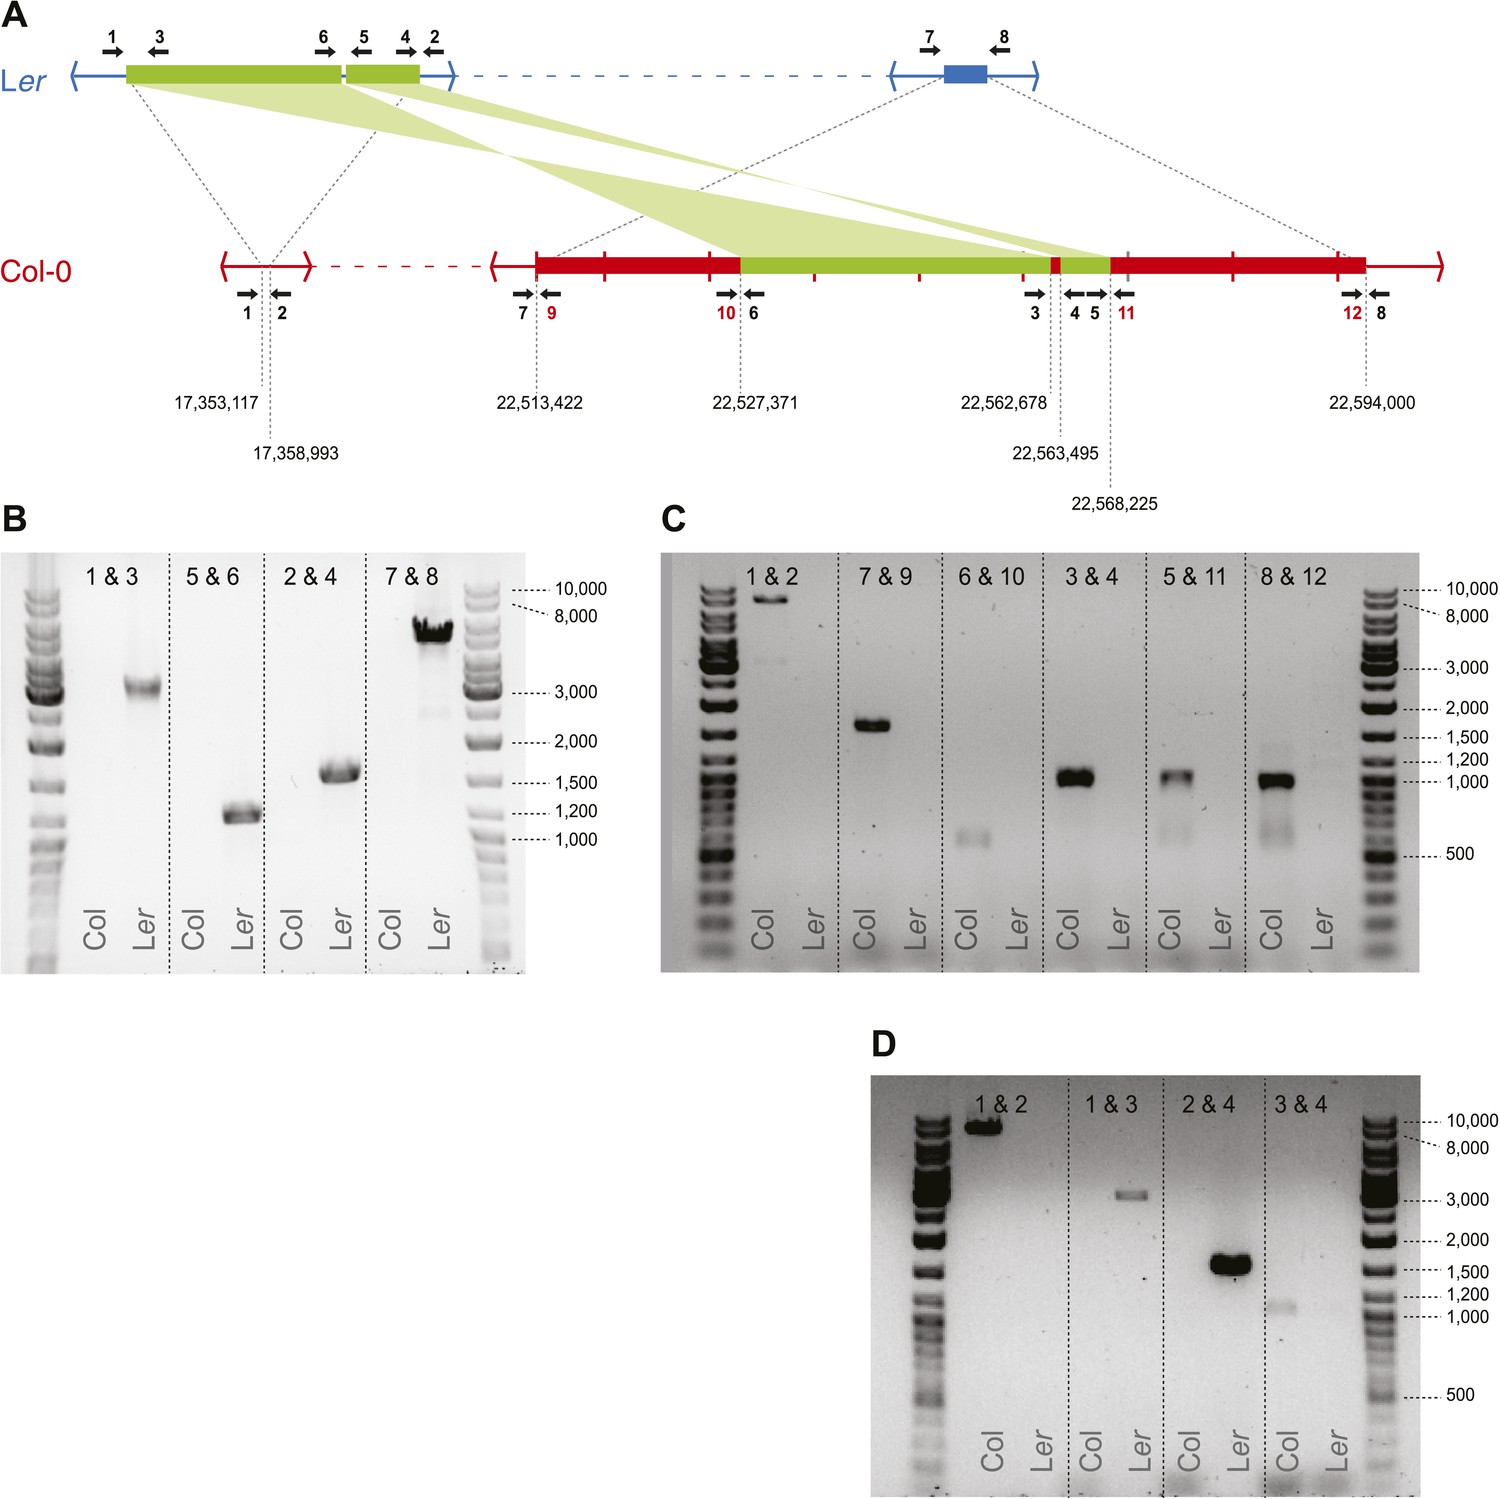
Transposed sequences on A. thaliana chromosome 3.
(A) Upper panel shows, analogous to Figure 2B, the location of transposed DNA between the two parental lines Ler and Col. Thin blue and red lines indicate co-linear sequences. Green thick lines show shared, albeit transposed and inverted sequences. Thick blue and red lines show sequences unique to Ler or Col respectively. Numbered arrows indicate primer positions used for verification of transposed sequences. Primer positions with black numbers refer to primers present in both Col and Ler, whereas red numbers indicate Col-specific primers. Tick marks in Col describe 10 kb distances and numbers below the Col sequence refer to the approximate transposition breakpoints in the Col reference genome. (B) Primer pairs that give a product in Ler but not in Col. (C) Primer pairs that give a product in Col but not in Ler. The fragment generated by primers 1 and 2 measures ∼9 kb on gel, while based on the Col reference we expected 7,9 Kb. We therefore designed a second (independent) set of primers for positions 1, 2, 3, and 4 and repeated the PCRs for these primer combinations (D). All fragments were of similar size as the fragments shown in B and C, corroborating the slightly longer than expected length for the product by primers 1 and 2.
Figure 2—figure supplement 6

NCO–GC frequency per marker per meiosis measured in 10 recombinant DH lines at increasing minimal coverage thresholds.
From a minimal coverage threshold of 10 onwards, the observed frequency of putative NCO–GC does not majorly change. This is in contrast to the minimal coverage requirement for the tetrad sample analysis. The reasons for this lie in the homozygous nature of the DH samples, that makes identification of NCO–GCs much easier in comparison to the tetrad samples. The blue cross indicates the estimated NCO–GC frequency after PCR validating all predicted NCO–GCs.
Figure 3
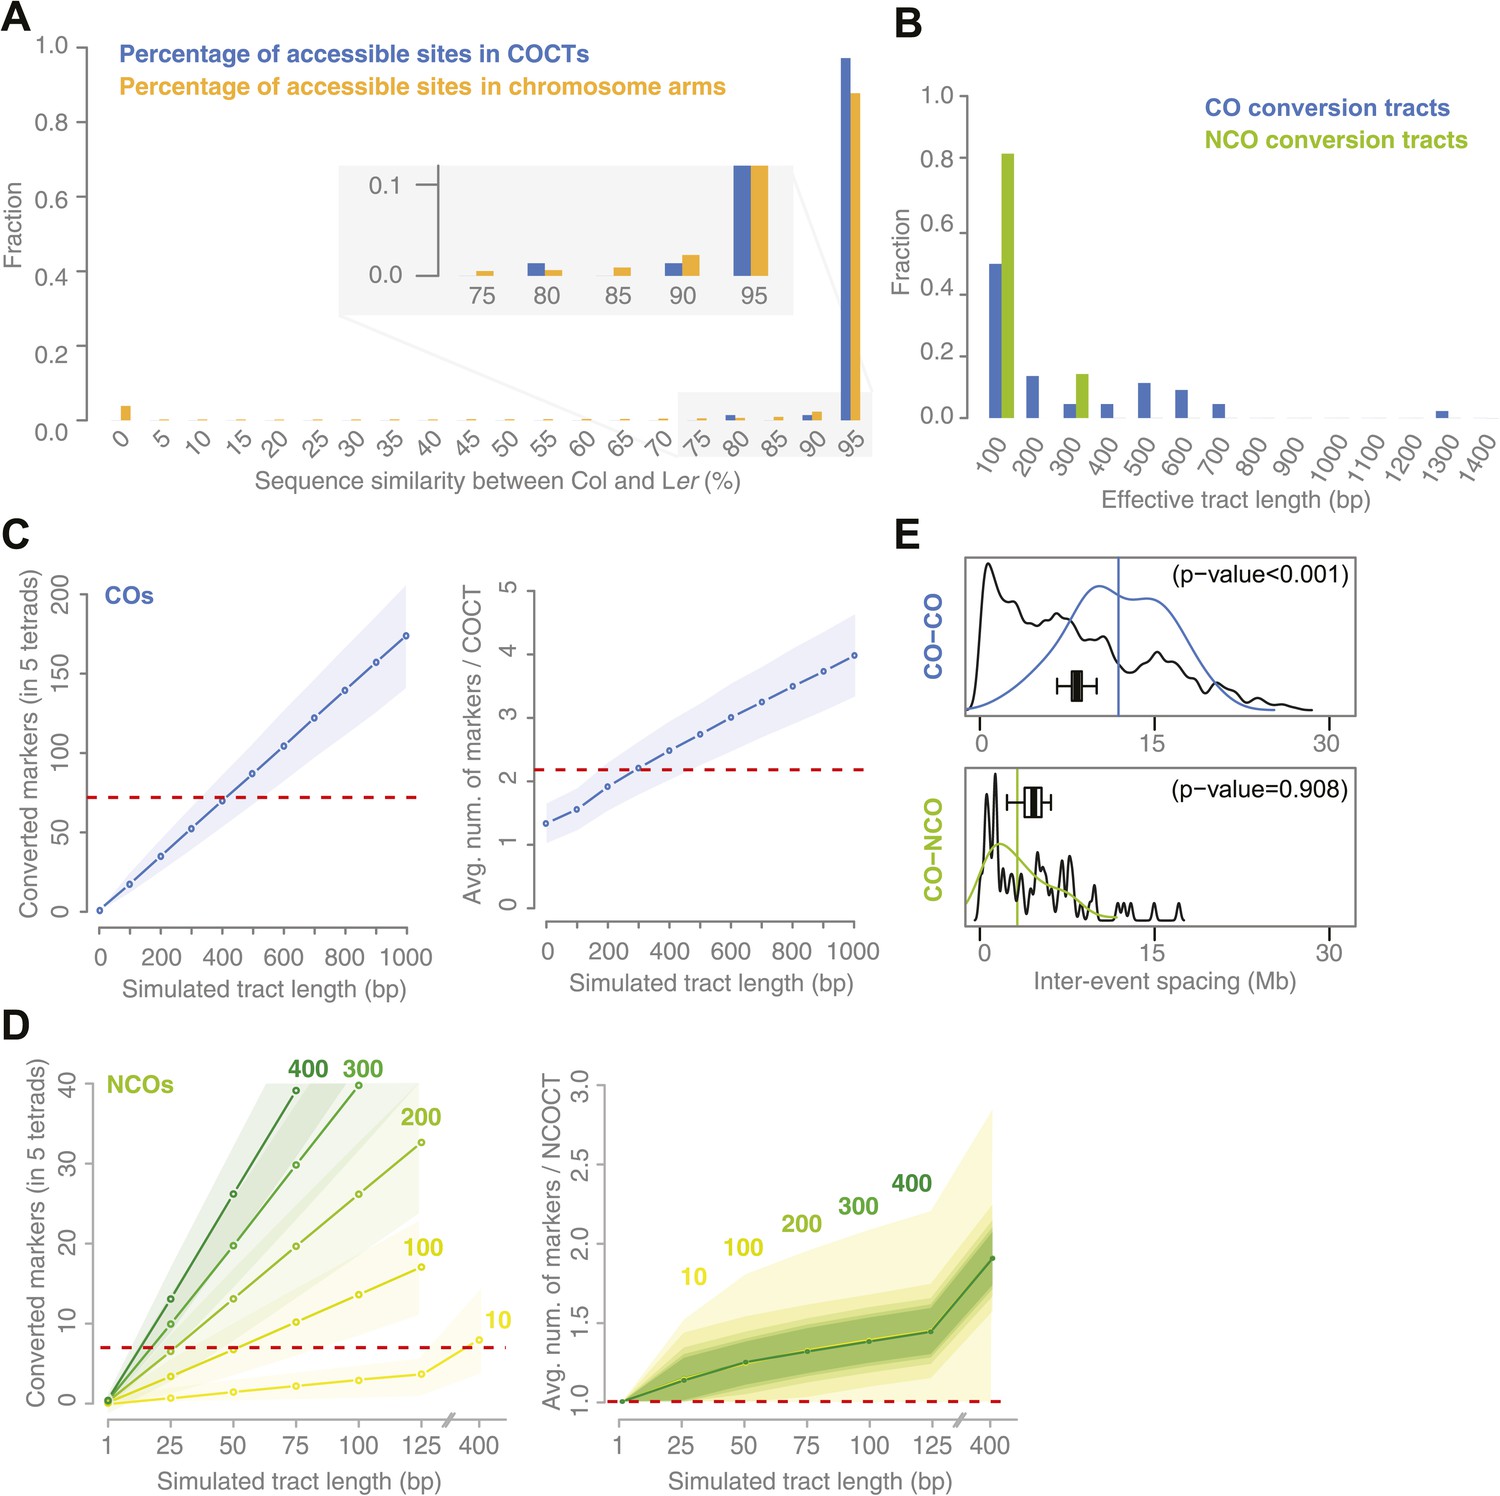
Sequence similarity at recombination sites, length differences between COCTs and NCOCTs and crossover interference.
(A) The percentage of confidently aligned positions within the resequencing of Ler was used as proxy for local sequence similarity. The percentages at COs were compared to a background distribution based on random sampling in non-peri-centromeric regions. (B) Comparison of COCT and NCOCT lengths. COCTs are significantly longer. (C) Repeatedly simulating (n = 10,000) sets of 52 COs randomly placed in the non-peri-centromeric regions predicted the average number of converted markers throughout all COCTs (left) as well as the average number of co-converted markers within a single COCT (right) given a fixed, simulated tract length (blue lines show the average values, shaded regions indicate standard deviations). The dashed red lines indicate the observed values for the real number of converted markers and average number of markers that co-converted. The intersections of observed and simulated numbers suggest an average COCT length of ∼300–400 bp. (D) Estimation of NCOCT length, as shown for COCTs in C. As the absolute number of NCOs is not obvious, we simulated a range of different NCO numbers (green to yellow colors indicate different numbers of DSBs per meiosis, of which half are simulated not to restore the original allele). Assuming a NCOCTs length of ∼400 bp (as we estimated for COCT length), only five NCOs would be formed per meiosis (left), however in this scenario the average number of co-converted markers would deviate drastically from the observed value (right). (E) The density distribution of distances between neighboring CO and between neighboring CO and NCO events reveals differences in inter-event spacing. The observed distances between recombination events (colored), with the average inter-event distance shown as a vertical line, are compared to randomized inter-event distances (black lines) measured after randomizing the labels of the existing tetrads. The boxplots show the distribution of the means of each randomization. The CO–CO distances are significantly longer than random distances due to crossover interference. Interference between COs and NCOs could not be detected.
Figure 4
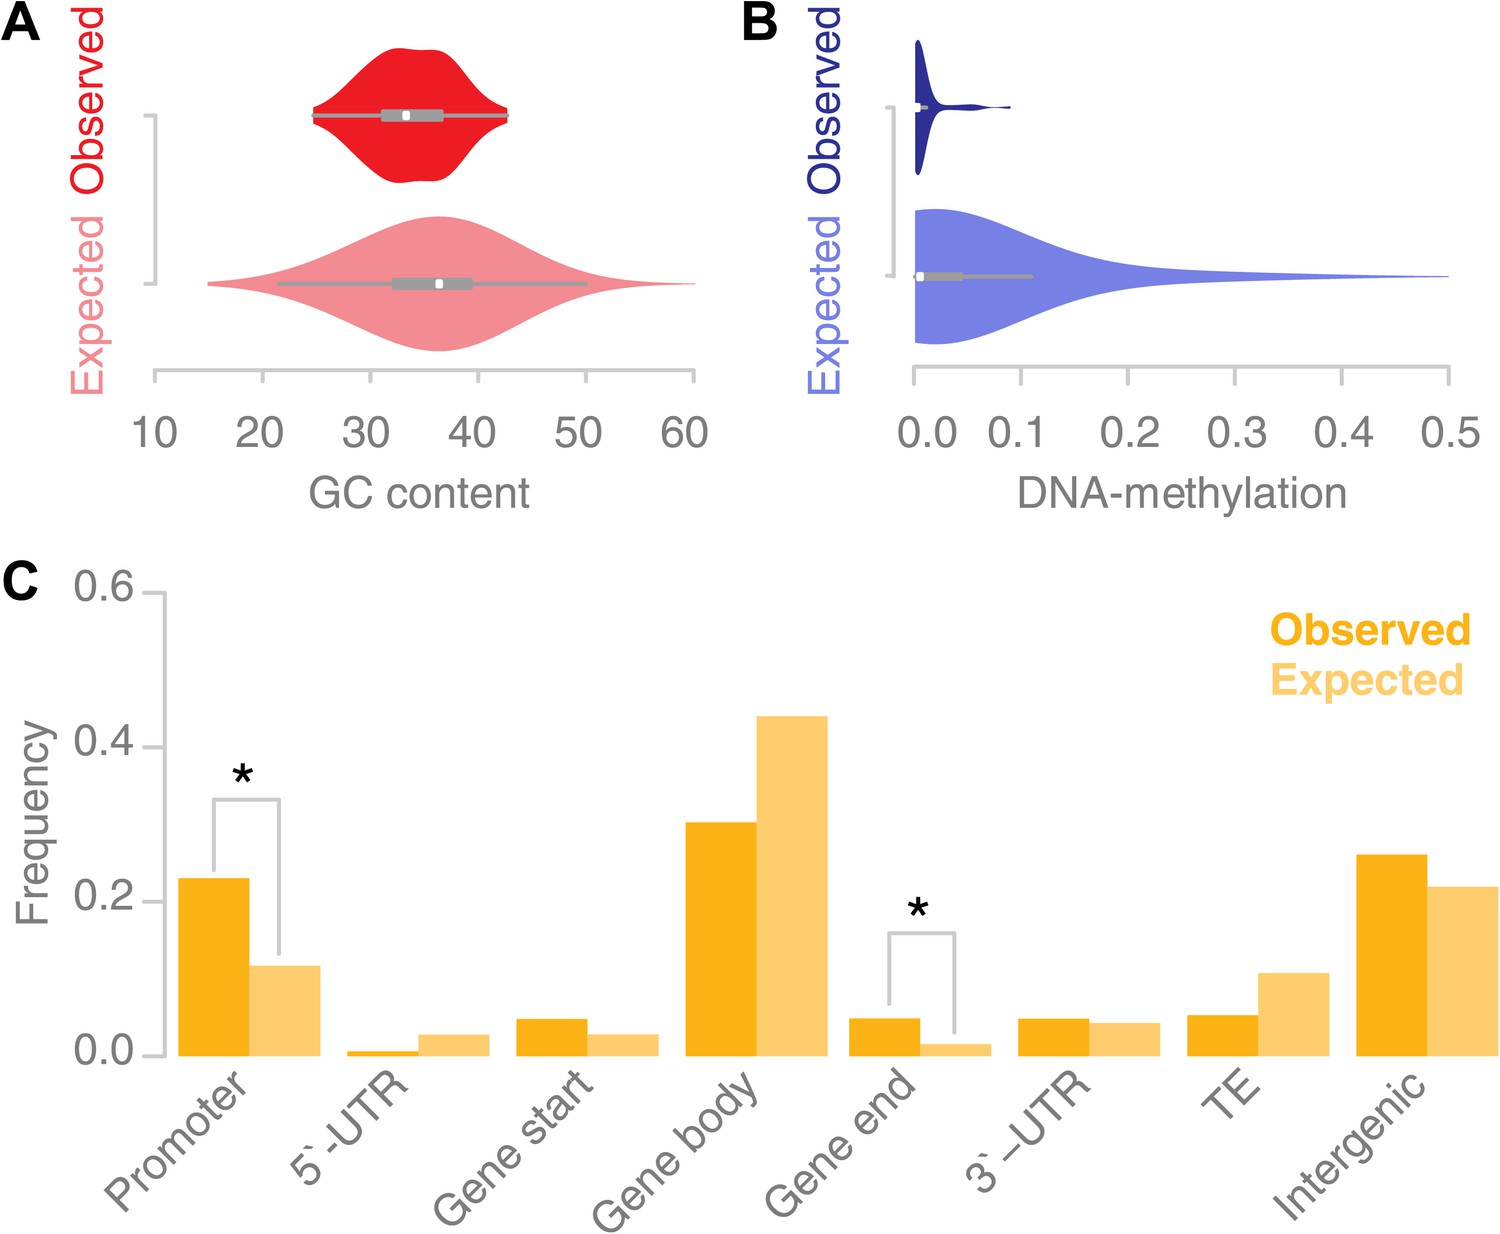
Recombination sites are enriched for un-methylated, AT rich promoter regions.
(A) The GC content was calculated for 67 conversion tracts (including 500 bp of flanking sequence, top) and compared to a background distribution of 5,000 equally sized random locations sampled from non-peri-centromeric regions (bottom). Mean and variance are significantly different (mean: p value 2.4 × 10⁻⁵ [t test]; variance: p value 0.02 [Levene’s test]). (B) The level of DNA methylation at recombination sites (top) was estimated based on bisulfite-treated DNA sequencing of mature rosette leaves (Stroud et al., 2012). DNA methylation at recombination sites (top) is significantly lower as compared to 5,000 equally sized random regions selected from chromosome arms (bottom) (p value 2.2 × 10⁻¹⁶ [t test]). (C) Associating recombination sites and gene annotations reveals a significant enrichment of recombination sites in promoters and gene ends. Promoters were defined as 500-bp regions upstream of transcription start sites, gene ends as the last 200 bp of a gene. The background distributions were estimated by randomly sampling from non-peri-centromeric regions.
Figure 5
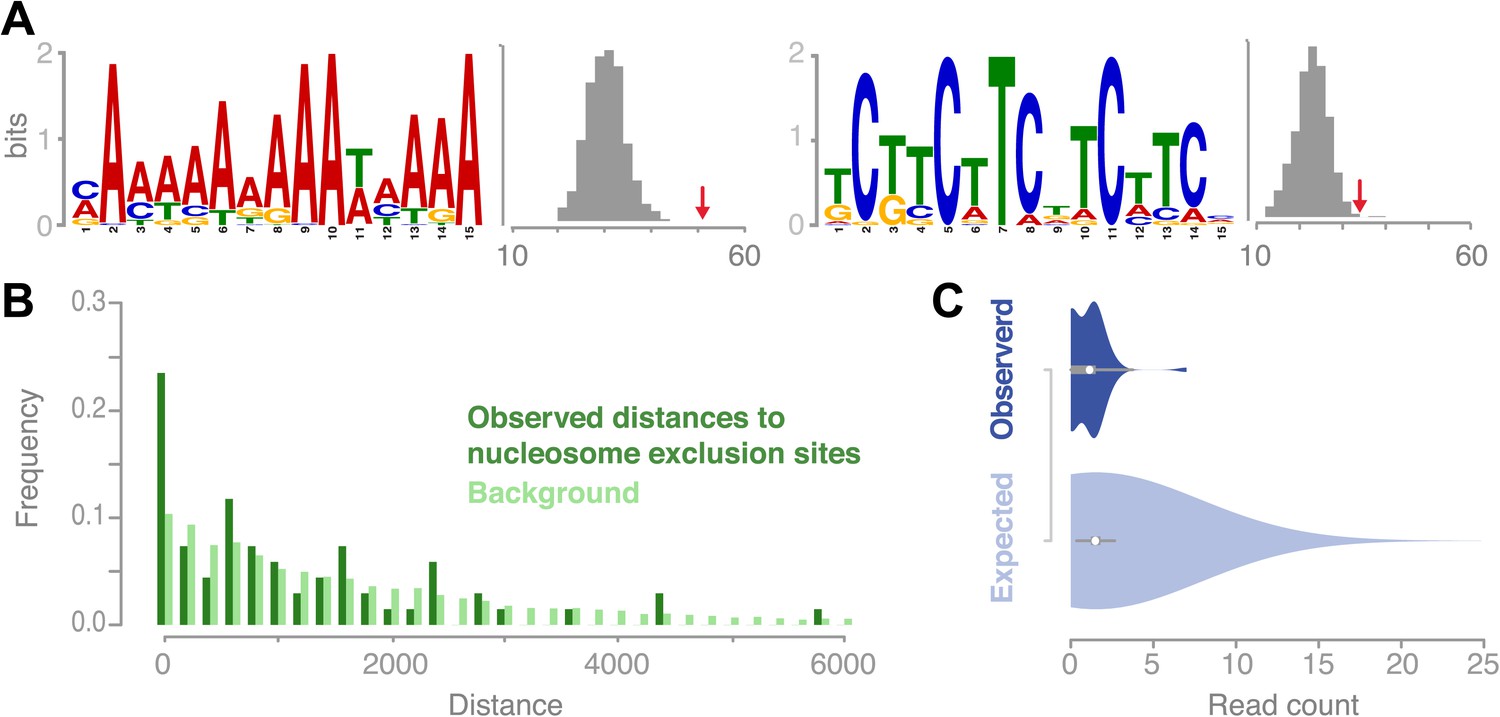
Recombination sites are significantly associated with two sequence motifs and nucleosome-free regions.
(A) Two sequence motifs (poly-A and CTT/GAA) were found significantly enriched at recombination sites after searching for over-enriched motifs using MEME. We established background frequency distributions by randomly sampling regions of the same sizes from non-peri-centromeric regions, followed by a targeted search for the respective motif (shown as histograms). The observed number of motifs at recombination sites is shown by red arrows (poly-A: p value 3.8 × 10⁻⁶; CTT: p value 0.002 [permutation test]). (B) The distances between recombination sites and DNA sequences that cannot be bound by nucleosomes are significantly enriched for short distances (p value 2.0e-16 [generalized linear model fitting]). Nucleosome exclusion sites are defined as (A)10 and ((GC)3NN)3 (Wang et al. (1996)) (Suter et al., 2000). (C) Comparison of recombination sites and nucleosome occupancy. The nucleosome occupancy was estimated through DNA sequencing performed after digesting with MNase of somatic tissue (Chodavarapu et al., 2010). The nucleosome-bound genomic regions are preferentially sequenced and establish a quantitative readout of nucleosome occupancy. The read count distributions at recombination sites (top) and at 5,000 random background regions (bottom) are significantly different (p value 1.9e-4 [t test]).
Additional files
-
Supplementary file 1
(A) Read number. (B) Number of crossovers per tetrad and DH line and chromosome. (C) CO location. (D) NCO location and extent within the tetrad samples. (E) CO location in DH lines. (F) Exact loci of CO and extent of associated GC in tetrad samples. (G) Converted markers within COCTs in tetrad samples. (H) Converted markers within NCOCTs in DH lines.
- https://doi.org/10.7554/eLife.01426.016
-
Supplementary file 2
(A) Initial marker list used for an initial genotyping of the tetrad samples. (B) Filtered marker list used to genotype tetrad samples. (C) High quality marker list used to genotype DH samples. (D) Primer pairs used for verification of NCOs in tetrad offspring. (E) Primer pairs used for verification of NCOs in DH lines. (F) Primers used for the verification of transposed DNA on chromosome 3.
- https://doi.org/10.7554/eLife.01426.017
-
Supplementary file 3
Includes a visualization of the exact makeup of 71 COs identified in the tetrad samples, for which sufficient sequencing information was available. The colored areas indicate the number of short read alignments for each of the positions as indicated on the x-axis. Red and blue areas refer to regions that descended from Col-0 and Ler, respectively. Grey areas cannot be assigned to either of them. Vertical lines indicate sequence differences between the parental genotypes and have the respective genotype indicated next to them. Within the CO sites (between the outer borders of both grey areas) the polymorphism data are based on hand curated short read alignments and local assemblies. Outside the flanking markers the polymorphisms encompass the marker used for reconstructing the recombinant chromosomes only. Note each tetrad sample contains one recombinant chromosome and one that is derived from the Cvi parent. The Cvi alleles are not indicated in these plots.
- https://doi.org/10.7554/eLife.01426.018
Download links
A two-part list of links to download the article, or parts of the article, in various formats.
Downloads (link to download the article as PDF)
Open citations (links to open the citations from this article in various online reference manager services)
Cite this article (links to download the citations from this article in formats compatible with various reference manager tools)
The genomic landscape of meiotic crossovers and gene conversions in Arabidopsis thaliana
eLife 2:e01426.
https://doi.org/10.7554/eLife.01426


