Single-molecule analysis reveals self assembly and nanoscale segregation of two distinct cavin subcomplexes on caveolae
- The University of Queensland, Australia
- University of New South Wales, Australia
- The University of Texas Medical School at Houston, United States
Figures
Figure 1

Principles of single-molecule detection and analysis of cavin1.
(A) Sample preparation for single-molecule analysis of fluorescently tagged proteins expressed in mammalian cells. Cells transfected with GFP and Cherry fusions of the cavin1 are mechanically lysed and centrifuged to remove cellular debris and the supernatant is placed in a chamber for single-molecule detection. (B) Schematic representation of single-molecule fluorescence experiment in which the proteins freely diffuse in and out of the focal volume created by two lasers simultaneously exciting the GFP and Cherry fluorophores. (C) An example of a single-molecule trace obtained for lysates of the cells co-expressing cavin1-GFP and cavin1-Cherry. The numbers of photons detected in green and red channels are plotted as a function of time. The trace shows simultaneous bursts in both GFP and Cherry channels that reflect formation of complexes containing both fluorophores. (D) Detailed analysis of a fluorescence burst from (C). Each fluorescent burst is analysed for three parameters: (1) the coincidence between the GFP and Cherry fluorescence that reflects co-diffusion of at least two proteins with different tags; (2) the total brightness of the burst, indicating the number of proteins present in the oligomer; (3) the burst profile that is determined by the rate of diffusion and reflects the apparent size of the complex. (E) Histogram of the number of photons measured per burst for GFP expressed in MCF-7 cells. The distribution of bursts is consistent with the behaviour of a monomeric GFP. The data was used to calibrate the brightness profile and estimate the number of cavins-GFP molecules. (F) GFP residence time in the confocal volume plotted against the number of observations; (G) a histogram of data shown in (F) that reveals a very tight distribution of residence times in the focal volume (or diffusion times) around 110 μs. This value is used to convert the observed residence time into apparent size in the subsequent experiments. (H) A plot of burst size distribution of cavin1-GFP expressed in MCF-7 cells. The high quantum yield of the observed particles suggests that cavin1 forms oligomers approximately 50 times brighter than a single GFP molecule. (I) as in (F) but for cavin1-GFP. The duration of the burst for cavin1-GFP is also much higher than that of GFP indicating that the apparent size of the diffusing objects is at least 10-fold larger (J) as in (G) but X-axes represents size as calculated using residence time of GFP as a reference. The distribution of cavin1 sizes is broad and is centered on 60 nm.
Figure 2 with 4 supplements
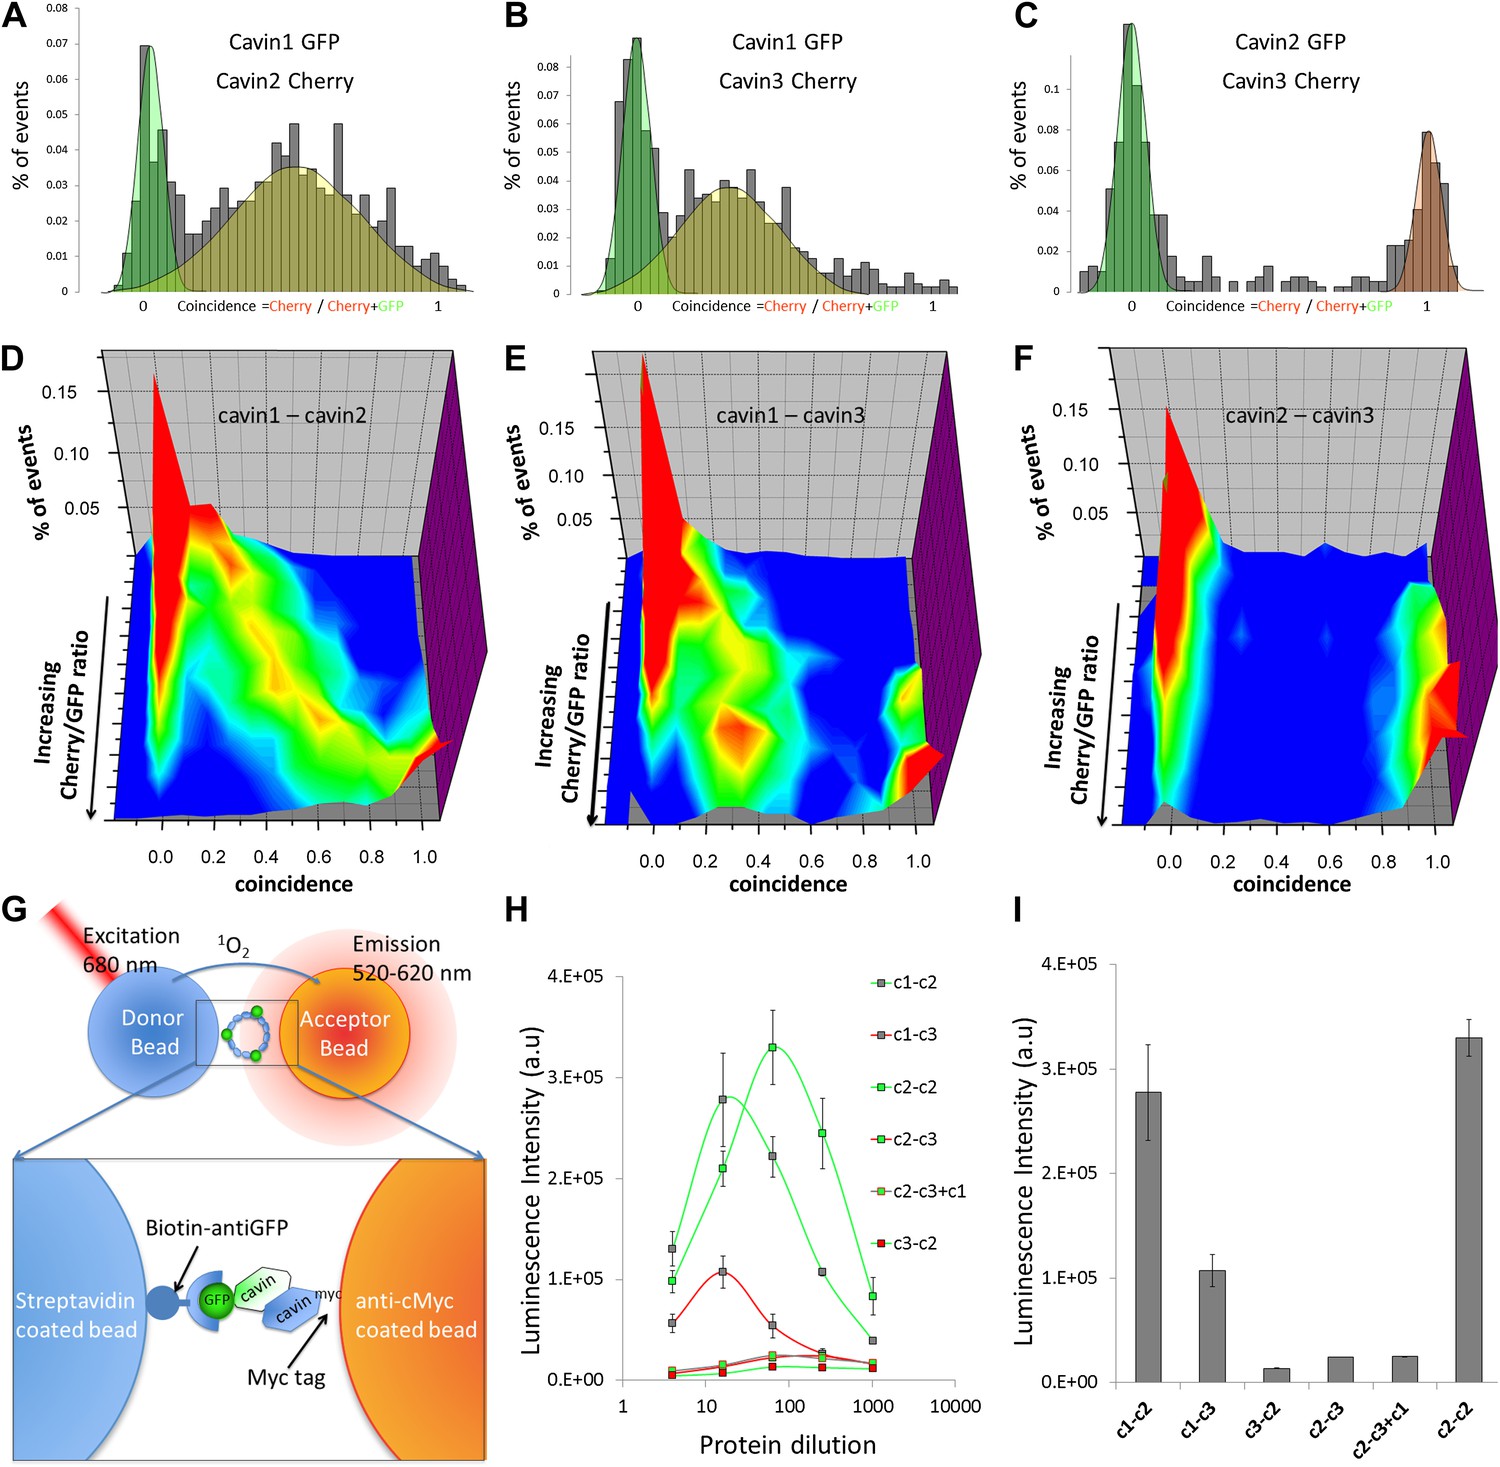
Single-molecule coincidence and ALPHAScreen mapping of interactions among cavin1, 2 and 3.
(A) Histogram of single-molecule coincidence between cavin1-GFP and cavin2-Cherry co-transfected in MCF-7 cells. The coincidence is calculated as the ratio of intensity in the Cherry channel divided by the sum of the signals in the GFP and Cherry channels. GFP-only bursts show a coincidence at 0 and Cherry-only oligomers are located at coincidence = 1. For the oligomers containing both fluorophores, the coincidence ratio is a measure of the stoichiometry of the assembly. (B) Same as (A), coincidence between cavin1-GFP and cavin3-Cherry. (C) Same as (A), coincidence between cavin2-GFP and cavin3-Cherry. (D–F): using cell-free protein expression, three-dimensional histograms of single-molecule coincidence between GFP and Cherry cavin proteins at expression ratios spaning from 100% GFP to 100% Cherry. For each DNA ratio of cavin-GFP and cavin-Cherry, we collected >1000 bursts and plotted the corresponding histograms of coincidence. We varied the ratio of cavins and created a stack of 10 histograms representing the various stoichiometries. The histograms for individual pairs were then aggregated into 3D plots. (D) Evolution of mixed oligomers of cavin1-GFP and cavin2-Cherry revealing formation of oligomers with a full range of stoichiometries. (E) The cavin1 and cavin3 plot shows formation of cavin1-cavin3 oligomers with predominantly 3/1 composition. (F) The cavin2 and cavin3 plot shows that these proteins do not form mixed oligomers. (G) Schematic representation of ALPHAScreen principle. This bead–bead assay relies on transfer of singlet oxygen from a donor bead to a luminescent acceptor bead when protein–protein interactions bring the beads within 200 nm (see ‘Materials and methods’ and SI for details). (H) A plot of ALPHAScreen signal across the concentrations of cavin proteins attached to donor and acceptor beads. The interactions for cavin2 and cavin3 in the presence or absence of cavin1 display amplitudes close to the background signal. (I) Values obtained for cavin1-GFP and cavin2-myc, cavin1-GFP and cavin3-myc, cavin2-GFP and cavin2-myc reveal robust interactions. However the curves obtained for cavin3-GFP and cavin2-myc, cavin2-GFP and cavin3-myc demonstrate that cavin2 and cavin3 cannot bind to each other. The triple co-expression of cavin2-GFP, cavin3-myc and untagged cavin1 results in no change in binding, suggesting that cavin1 cannot act as a bridge between cavin2 and cavin3.
Figure 2—figure supplement 1
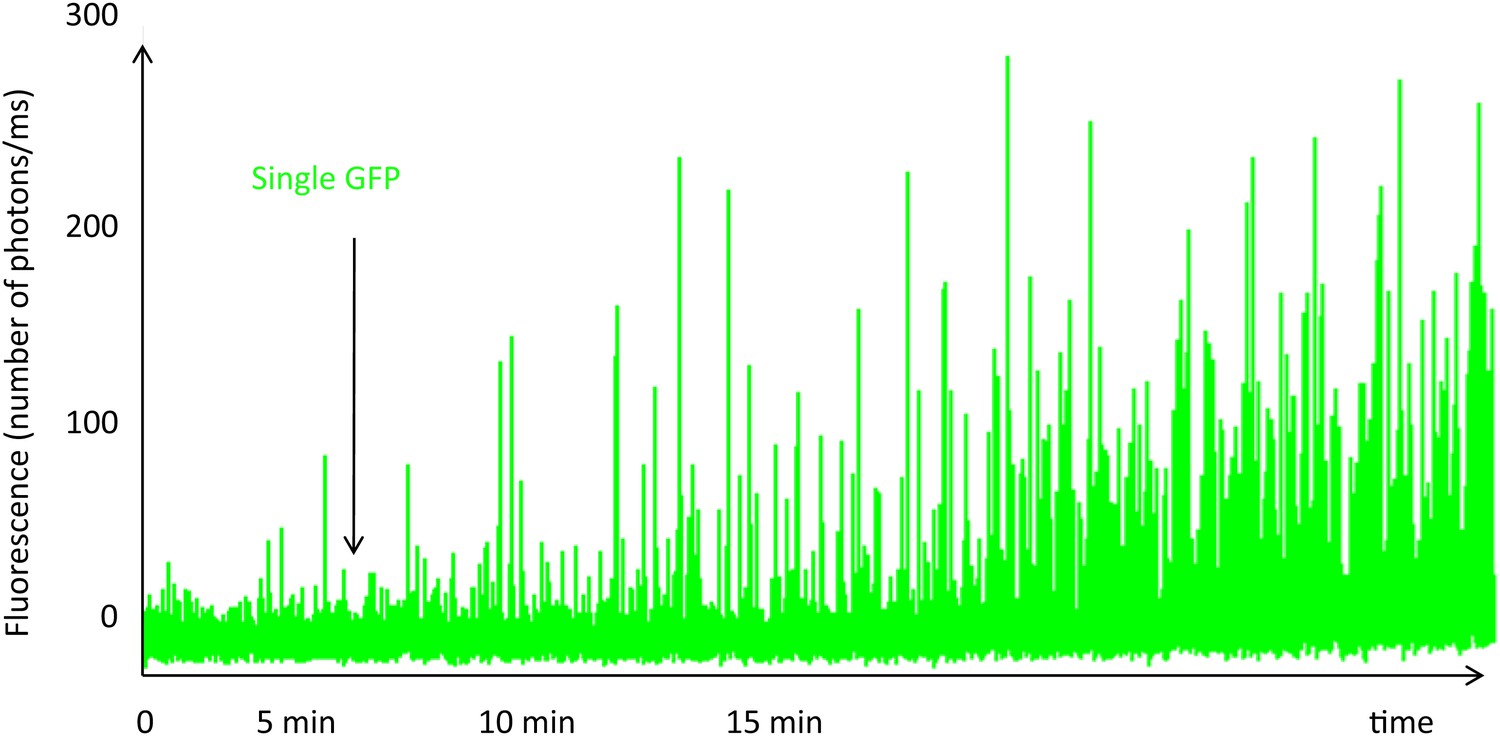
Single-molecule fluorescence trace of cavin1-GFP during expression in the cell-free system.
The fluorescence trace shows the real-time oligomerization of cavin1, occurring within 15 min. While all the GFP fluorophores are not yet folded and fluorescent, we can already detect bursts of large amplitude suggesting the formation of oligomers at very low concentration. We estimate that at 15 min, the concentration in the cell-free expression system has not reached 10 nM. We stopped translation after 15 min by diluting the sample and performed single-molecule analysis; the residence times and brightness obtained correspond to a population of oligomerized cavin1.
Figure 2—figure supplement 2
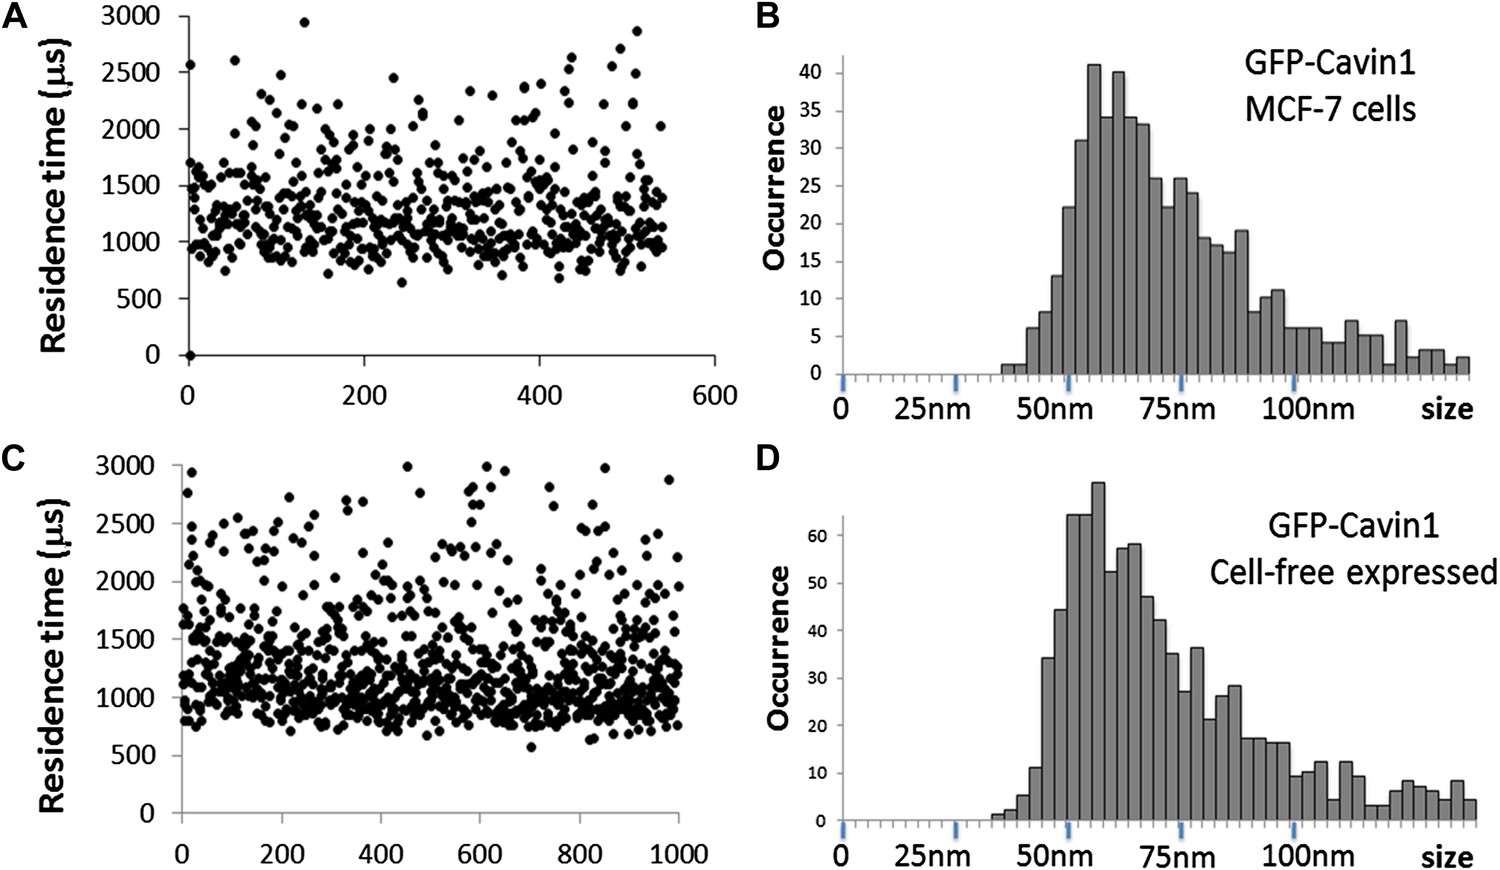
Comparison of cavin1 oligomers observed in MCF-7 cells and expressed in the cell-free system.
(A) Plot of the residence times as a function of number of experiments for cavin1-GFP in MCF-7 cells. (B) Histogram of sizes measured by single-molecule diffusion and calibrated by the diffusion of GFP, as shown in Figure 1 of the main text. (C) Plot of the residence times as a function of number of experiments for cavin1-GFP expressed in the cell-free system. (D) Histogram of apparent sizes of cavin1-GFP expressed in cell-free system. The distributions of residence times and apparent sizes obtained from cell extract and in the cell-free expression system match closely, suggesting that cavin1 has an intrinsic propensity to form oligomers.
Figure 2—figure supplement 3
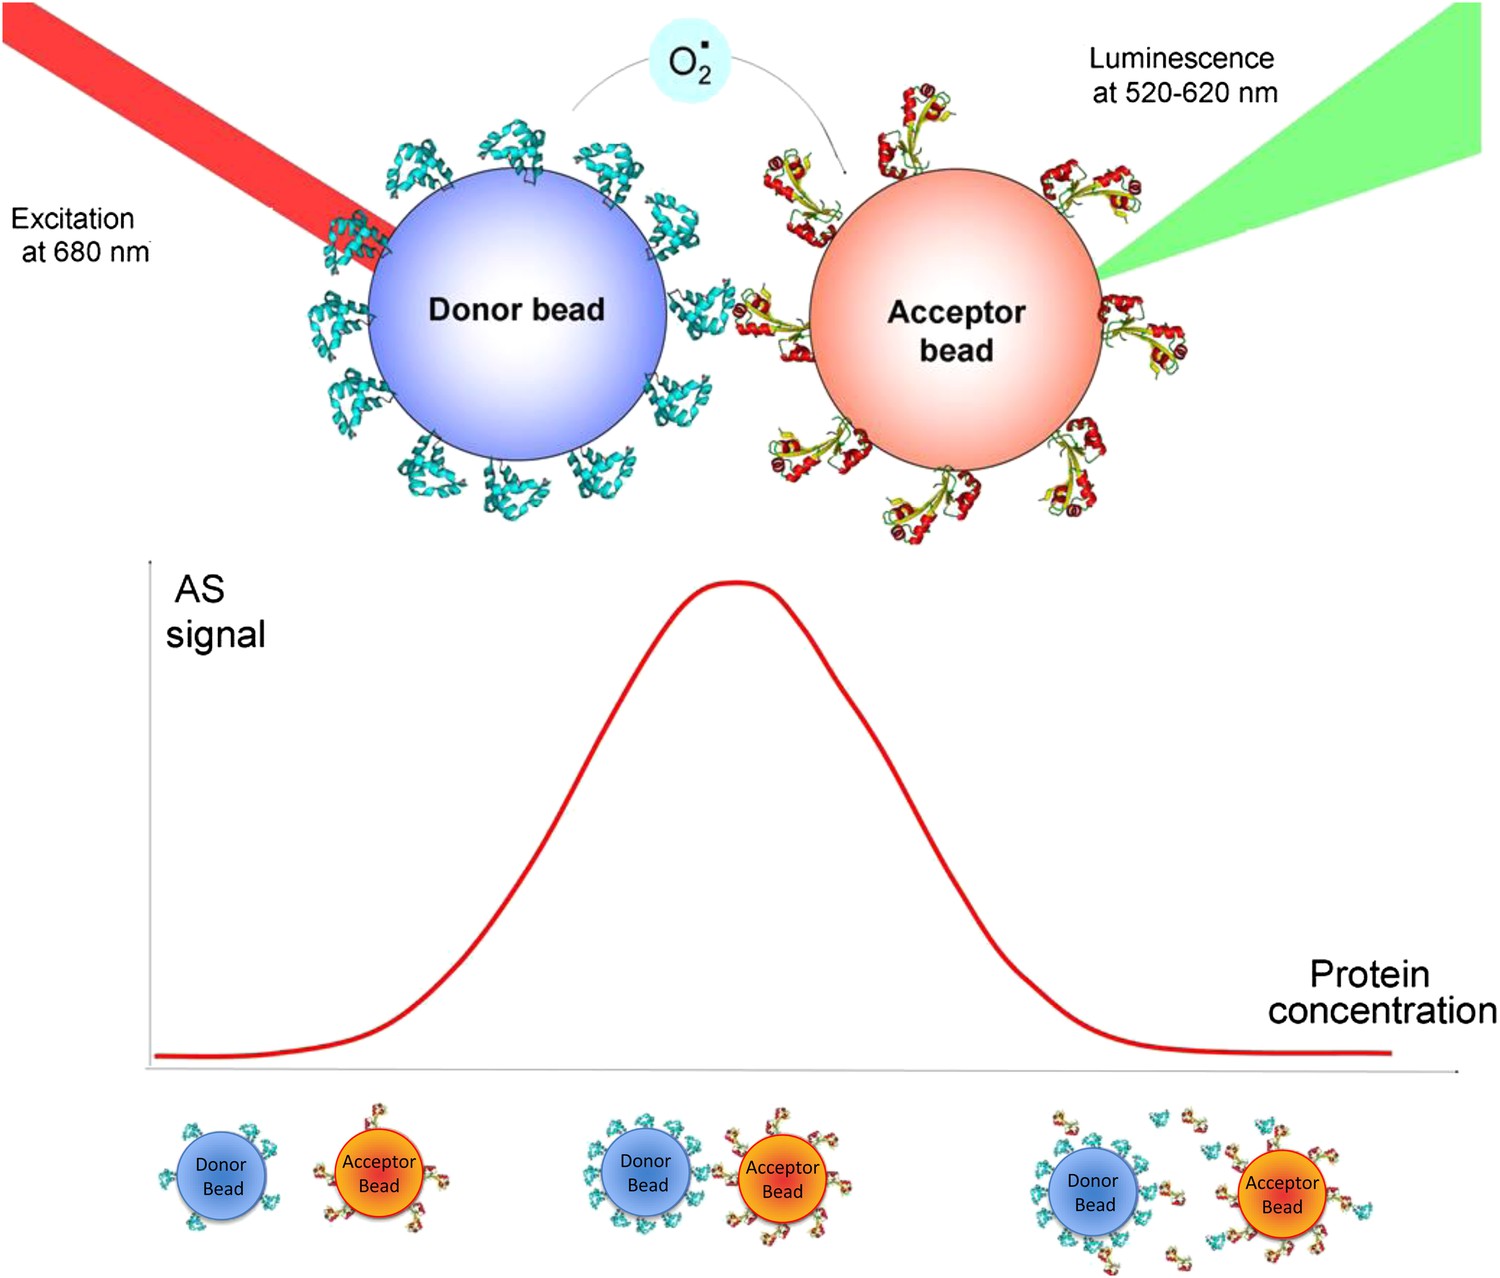
Principle of the ALPHA screen.
(top panel) The donor bead is coated with protein A. A laser pulse at 680 nm triggers the release of singlet oxygen from the donor bead. The singlet oxygen has a half-life of 4 μs and can diffuse over 200 nm. If an interaction occurs between protein A and protein B, the acceptor bead is brought into proximity of the donor bead. The singlet oxygen will react with thioxene derivatives encapsulated in the acceptor bead, resulting in luminescence, emitted between 520 and 620 nm. (bottom panel) The ‘hook’ effect is a signature of the Screen signal. This effect appears due to loading effects on the beads. If the concentration of interacting proteins is too low, the beads do not bind strongly and the luminescence signal is low. At optimal protein concentration, bead–bead contacts are maximized as all the beads are covered with proteins. When the system is overloaded with proteins, unbound proteins are competing with bead-immobilized proteins, diminishing the number of bead–bead interactions and lowering the AlphaScreen signal.
Figure 2—figure supplement 4
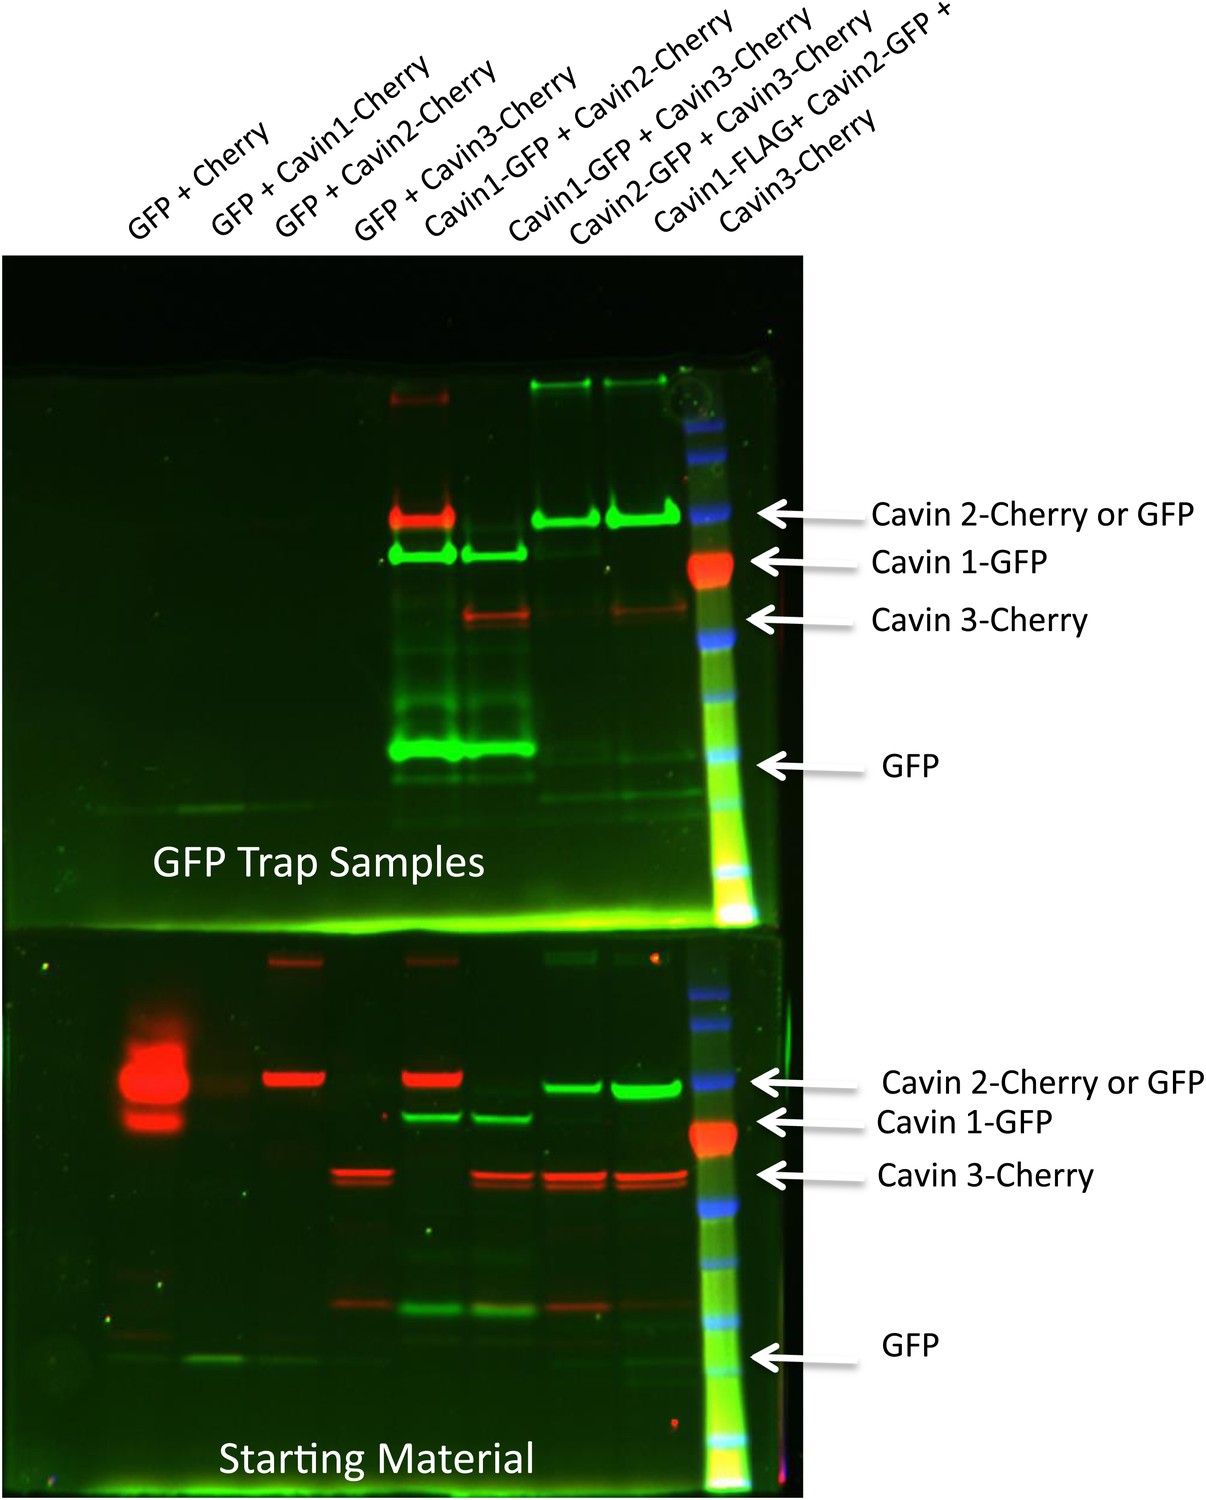
Pull-down analysis of the cavin complex formation in MCF-7 cells.
MCF-7 cells were transfected with equal amounts of GFP and Cherry alone, GFP alone + Cavin 1-Cherry, GFP + Cavin 2-Cherry, GFP + Cavin 3-Cherry, Cavin 1-GFP and Cavin 2-Cherry, Cavin 1-GFP and Cavin 3-Cherry, Cavin 2-GFP and Cavin 3-Cherry and Cavin 1-Flag with Cavin 3-GFP and Cavin 2-Cherry. Post-nuclear supernatant (soluble cytoplasmic fraction) were prepared by extensive washing of cells in PBS. Cells were then scraped into PBS containing protease and phosphatase inhibitors followed by mechanic disruption by syringe lysis. Cells were then pelleted at 2000 rpm, 10 min at 4°C. 120th of the supernatant was retained as the starting material (B). The remaining supernatant was mixed with 20 μl of prewashed GFP Trap beads for 30 min at 4°C on a rotating wheel. The beads were pelleted and washed three times in PBS supplemented with protease and phosphatase inhibitors and were boiled in 4X Sample buffer for 75°C for 2.5 min to preserve the fluorescence. Sample were separated by SDS-PAGE and the fluorescence corresponding to each of the overexpressed GFP or Cherry tagged Cavin construct was detected and quantification in the gel using the BioRad ChemiDoc MP Imaging System.
Figure 3 with 3 supplements
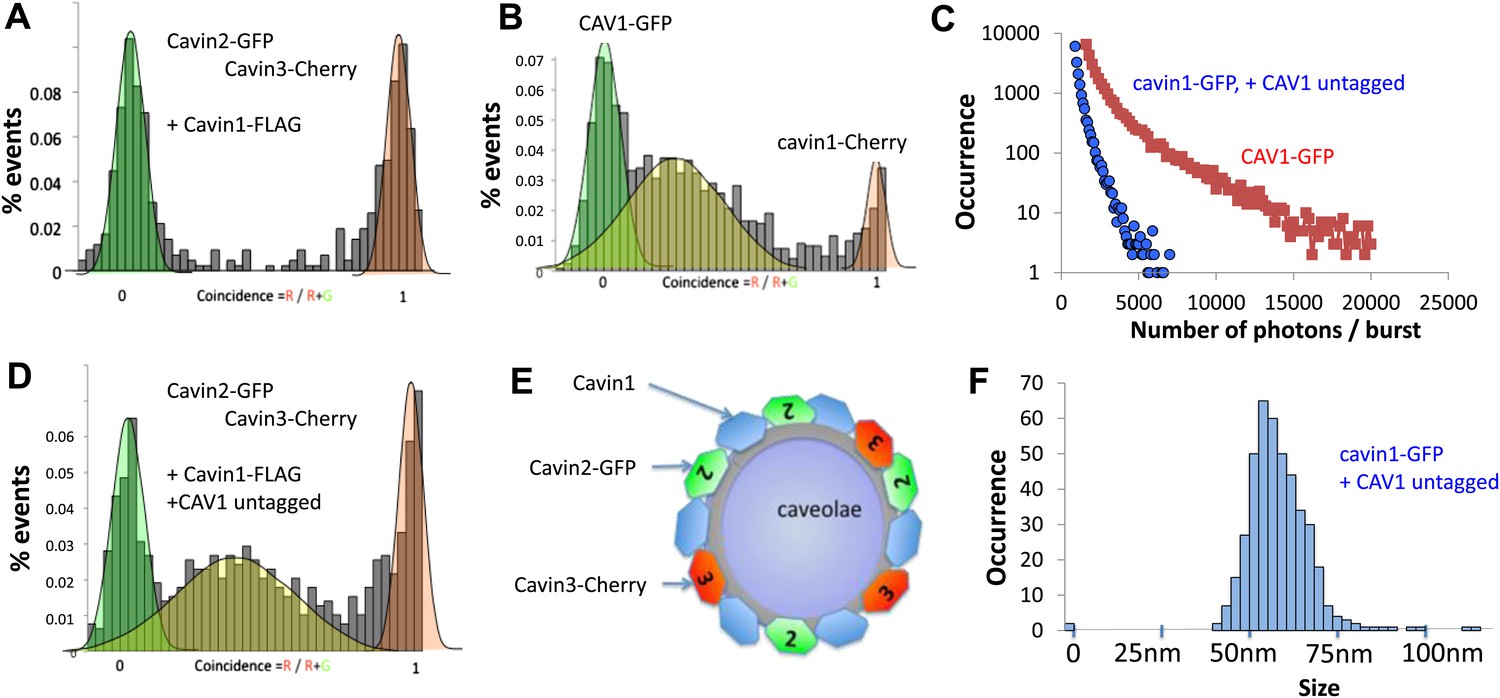
Single-molecule counting and coincidence analysis of cavin oligomerization in MCF-7 cells in the presence of CAV1.
(A) Histogram of single-molecule coincidence between cavin2-GFP and cavin3-Cherry in MCF-7 cells co-expressing cavin1. The lack of coincidence (0.25<coincidence<0.75) demonstrates that cavin2 and cavin3 do not interact even in the presence of cavin1. (B) Histogram of single-molecule coincidence between CAV1-GFP and Cavin1-Cherry. The distribution shows a large peak of coincidence centered around C = 0.25, indicating that cavin1 localizes on caveolae with approx. three CAV1 molecules for one molecule of cavin1. (C) Distribution of burst brightness from MCF-7 cells transfected with CAV1-GFP (shown in red) or cavin1-GFP and CAV1 untagged (in blue). The brightness of CAV1-GFP is typically 3.5 higher than the brightness of cavin1-GFP. (D) Histogram of single-molecule coincidence between cavin2-GFP and cavin3-Cherry in MCF-7 cells when both cavin1 and CAV1 are co-expressed. (E) Schematic representation of the co-localization of cavin2 and cavin3 when cavin1 and CAV1 are co-expressed, indicating that the two subcomplexes are assembled on the caveolae. (F) Histogram of apparent single-molecule sizes of cavin1-GFP co-expressed with CAV1 (untagged). The size distribution is centered around the size of caveolae, suggesting that the cavin1 complex wraps around caveolae without significantly increasing its apparent size.
Figure 3—figure supplement 1
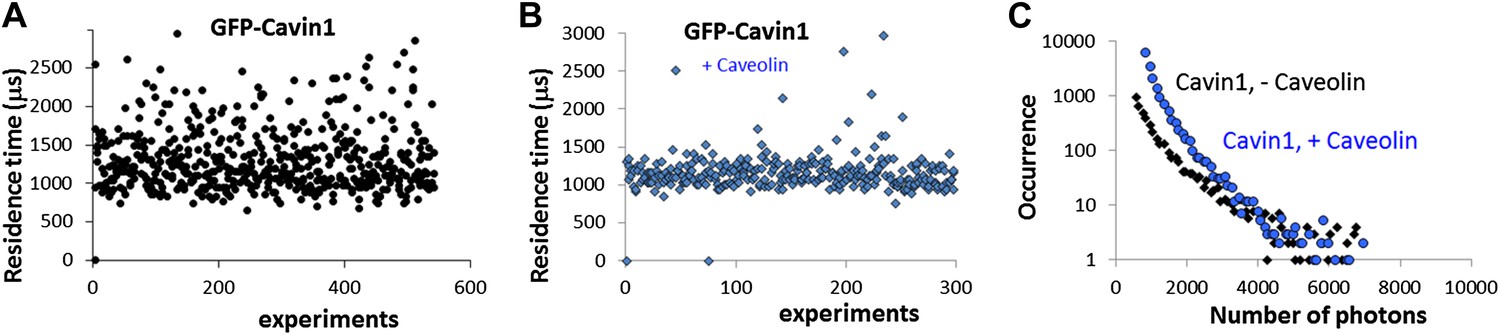
Effect of co-transfection of CAV1 in MCF-7 cells on the size and brightness of cavin1-GFP oligomers.
(A) Plot of residence times obtained as a function of experiments for cavin1-GFP in MCF-7 cells that do not express CAV1. (B) Plot of residence times observed for acvin1-GFP when the MCF-7 cells were co-transfected with untagged CAV1. The residence times observed are centered on the same value but the values are more dispersed in the absence of CAV1. This suggest that the scaffolding protein CAV1 limits the growth and structure of cavin1-GFP oligomers. (C) Distribution of burst sizes observed for cavin1-GFP in MCF-7 cells, with and without co-transfection of CAV1-untagged. The number of cavin1 involved in the cavin oligomer does not seem to change with the presence of CAV1 and caveolae, suggesting that the cavin1 oligomer intrinsically forms in a shape that resembles its caveolae-bound state.
Figure 3—figure supplement 2
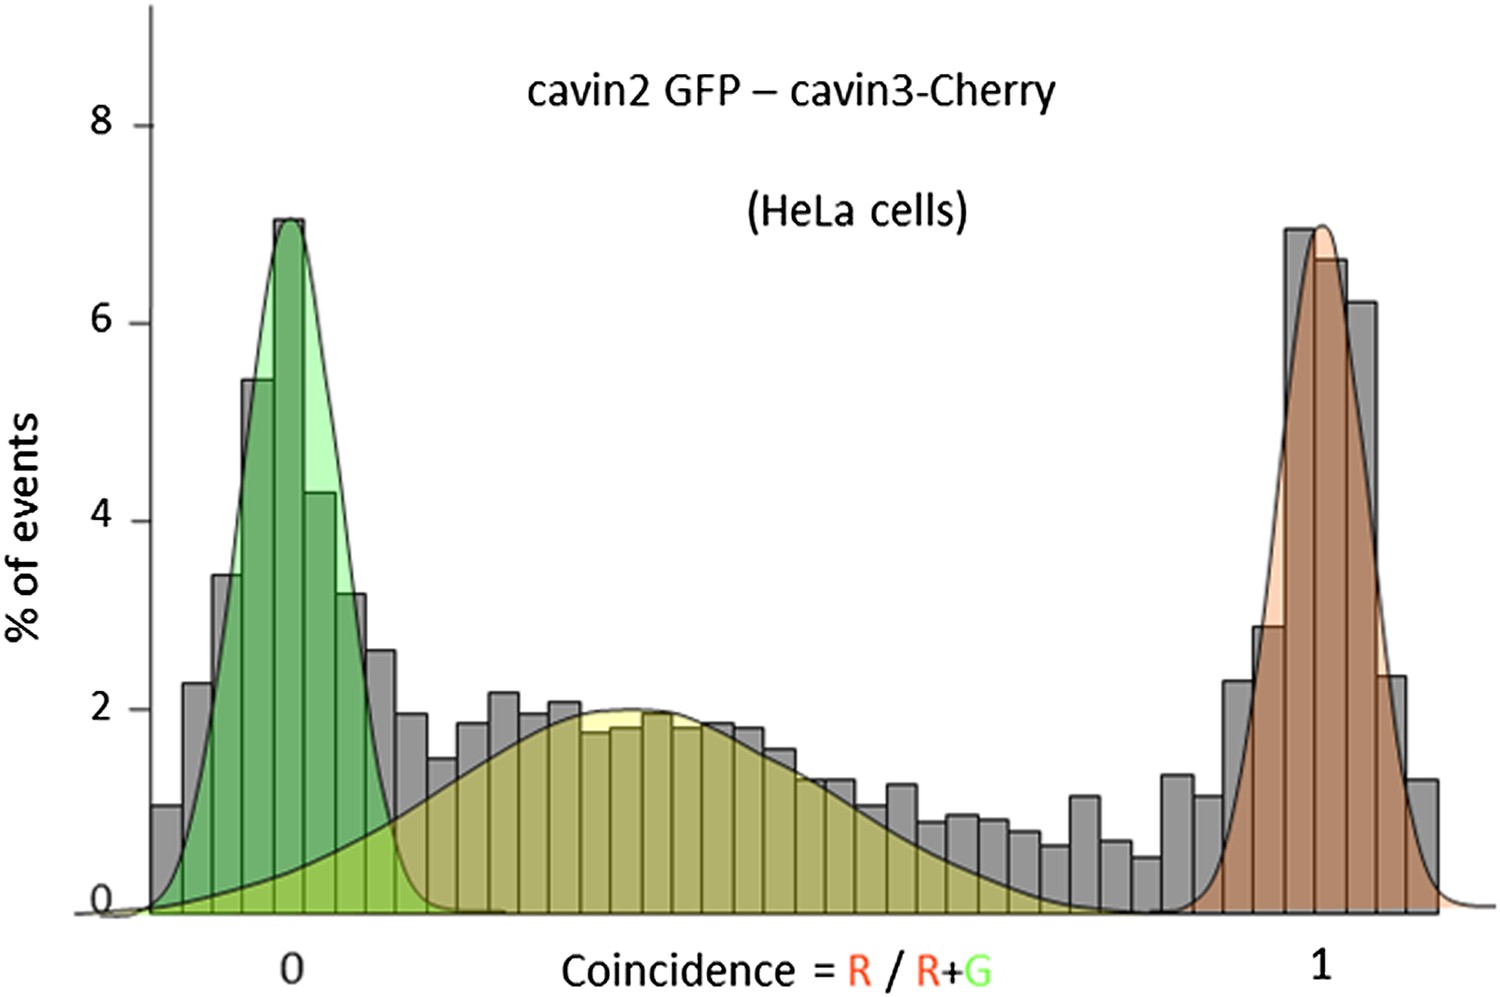
Single-molecule coincidence analysis of cavin interactions in HeLa cells.
Histogram of single-molecule coincidence between cavin2-GFP and cavin3-Cherry in HeLa cells; HeLa cells express endogenous levels of cavin1 and CAV1.
Figure 3—figure supplement 3
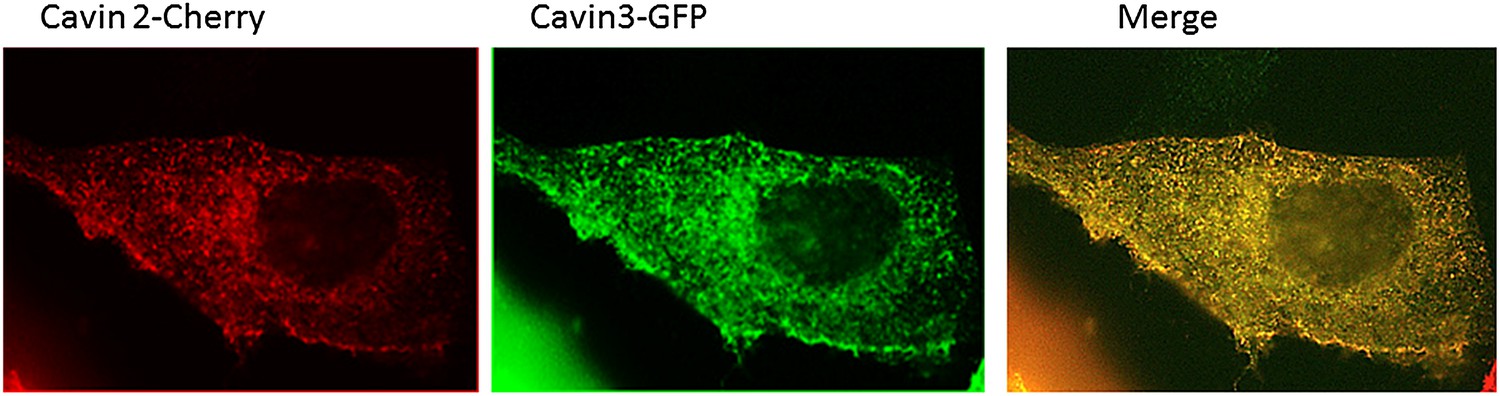
Localization of Cavin 2-Cherry and Cavin 3-GFP in MDCK cells.
MDCK cells were transiently transfected with Cavin2-Cherry and Cavin3-GFP. Cells were fixed in 4% PFA in PBS and were processed for immunofluorescence to localize Cavin2 and Cavin3. A representative image of the localization of Cavin 2 and Cavin 3 in cavin and caveolin-1 expressing MDCK cells is shown.
Figure 4 with 1 supplement
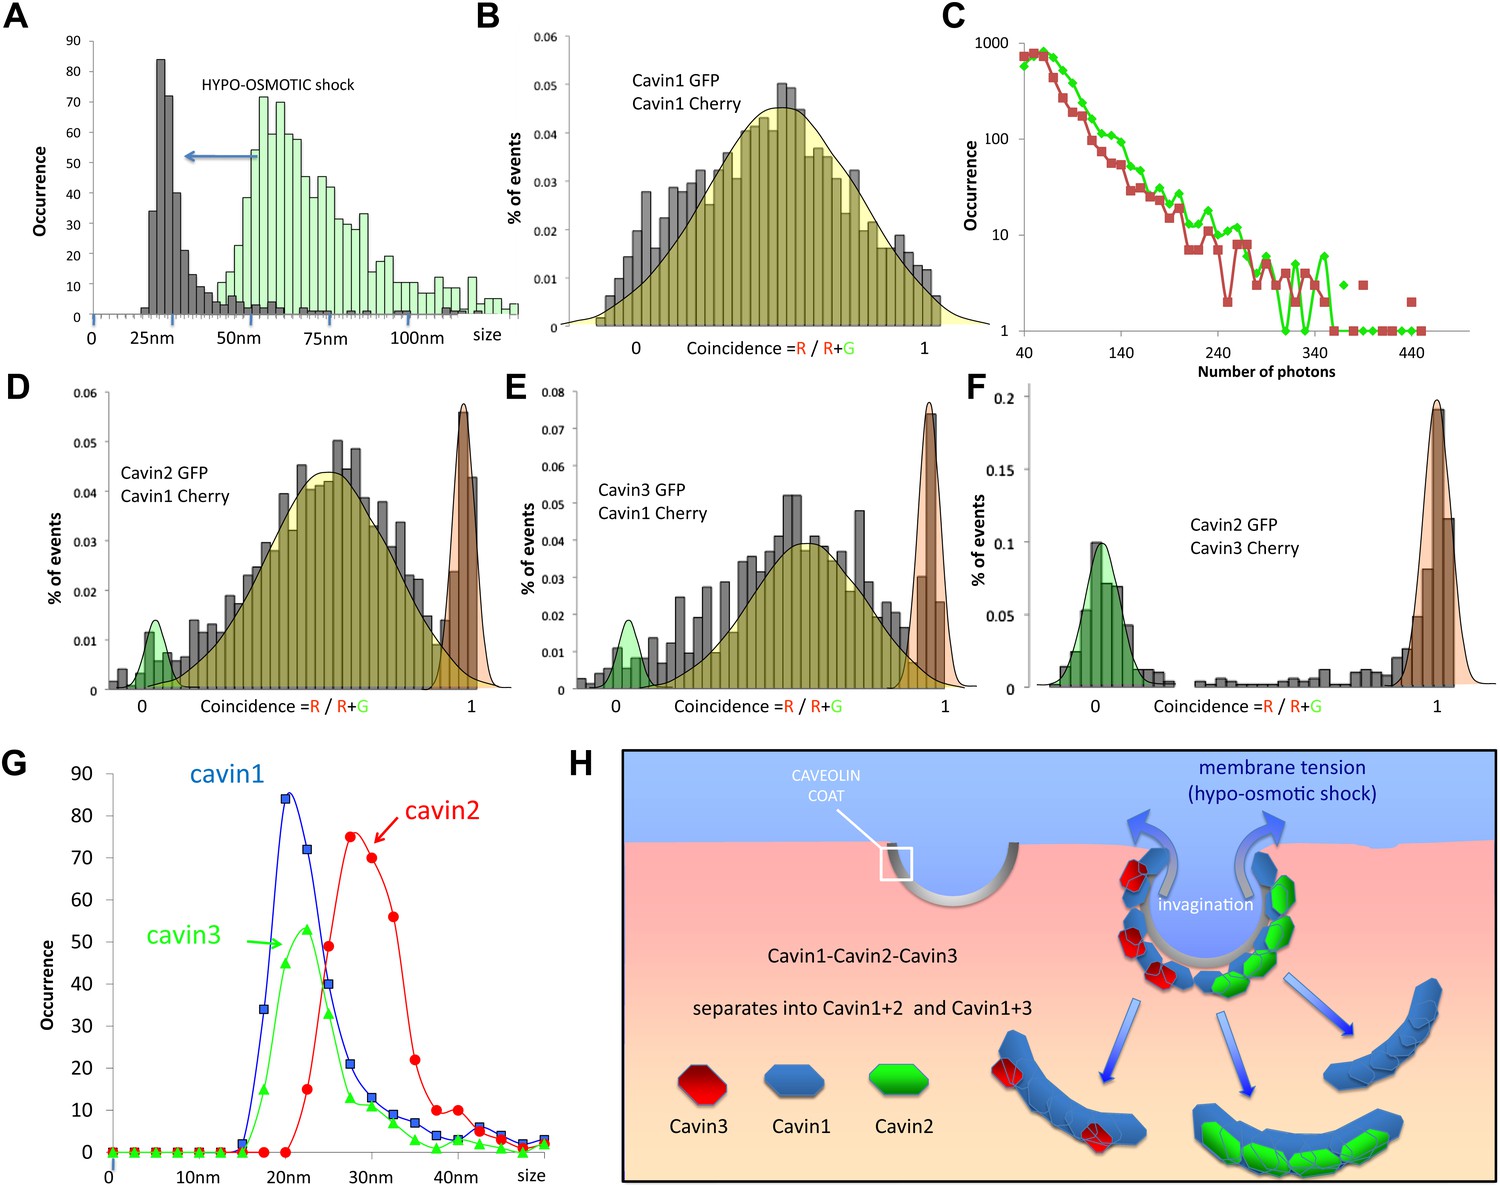
Dissociation of the cavin coat upon cell swelling induced by hypo-osmotic treatment.
(A) Histogram of apparent single-molecule sizes for cavin1-GFP before (green) and after (grey) membrane stretching induced by hypo-osmotic treatment. The size of observed cavin1 oligomers decreases from 60 nm to 20 nm. (B) Histogram of single-molecule coincidence for cavin1-GFP and cavin1-Cherry after hypo-osmotic treatment. We observe that solubilized cavin1 remains oligomeric as all bursts contain both GFP and Cherry fluorophores. (C) Burst brightness distribution for cavin1-GFP (green) and cavin1-Cherry (red) in oligomers released from the membrane upon hypo-osmotic treatment. Oligomers contain GFP and Cherry in equal amounts; the total fluorescence indicates that the sub-oligomers are typically made of 8–10 cavin1 proteins and hence significantly reduced in size compared to the isotonic conditions (Figure 1). (D) Histogram of single-molecule coincidence between cavin2 and cavin1 after hypotonic treatment. Data show that all cavin2 are bound to cavin1 but approximately 15% of the oligomers contain cavin1 only. (E) Histogram of single-molecule coincidence between cavin3 and cavin1 after membrane stretching. Data show that all cavin3 are bound to cavin1 and approx. 20% of cavin1-only oligomers are observed. (F) Histogram of single-molecule coincidence between cavin2 and cavin3 after membrane stretching. The absence of coincidence suggests that while cavin2 and cavin3 can localize to the same caveolae, their release from the membrane during stretch causes them to separate into two different subcomplexes. (G) Histogram of apparent single-molecule sizes obtained after hypo-osmotic treatment for cavin1-GFP, cavin2-GFP and cavin3-GFP, in the presence of co-expressed cavin1-Cherry. The measurements indicate that the cavin1-cavin1 and cavin1-cavin3 subcomplexes are very similar in size (average of 20 nm), but the apparent size of the cavin1-cavin2 subcomplex is higher with an average of 30 nm. (H) Model of cavin1-cavin1, cavin1-cavin2 and cavin1-cavin3 subcomplexes dissociation from CAV1 domains upon membrane stretching mediated by cell swelling.
Figure 4—figure supplement 1
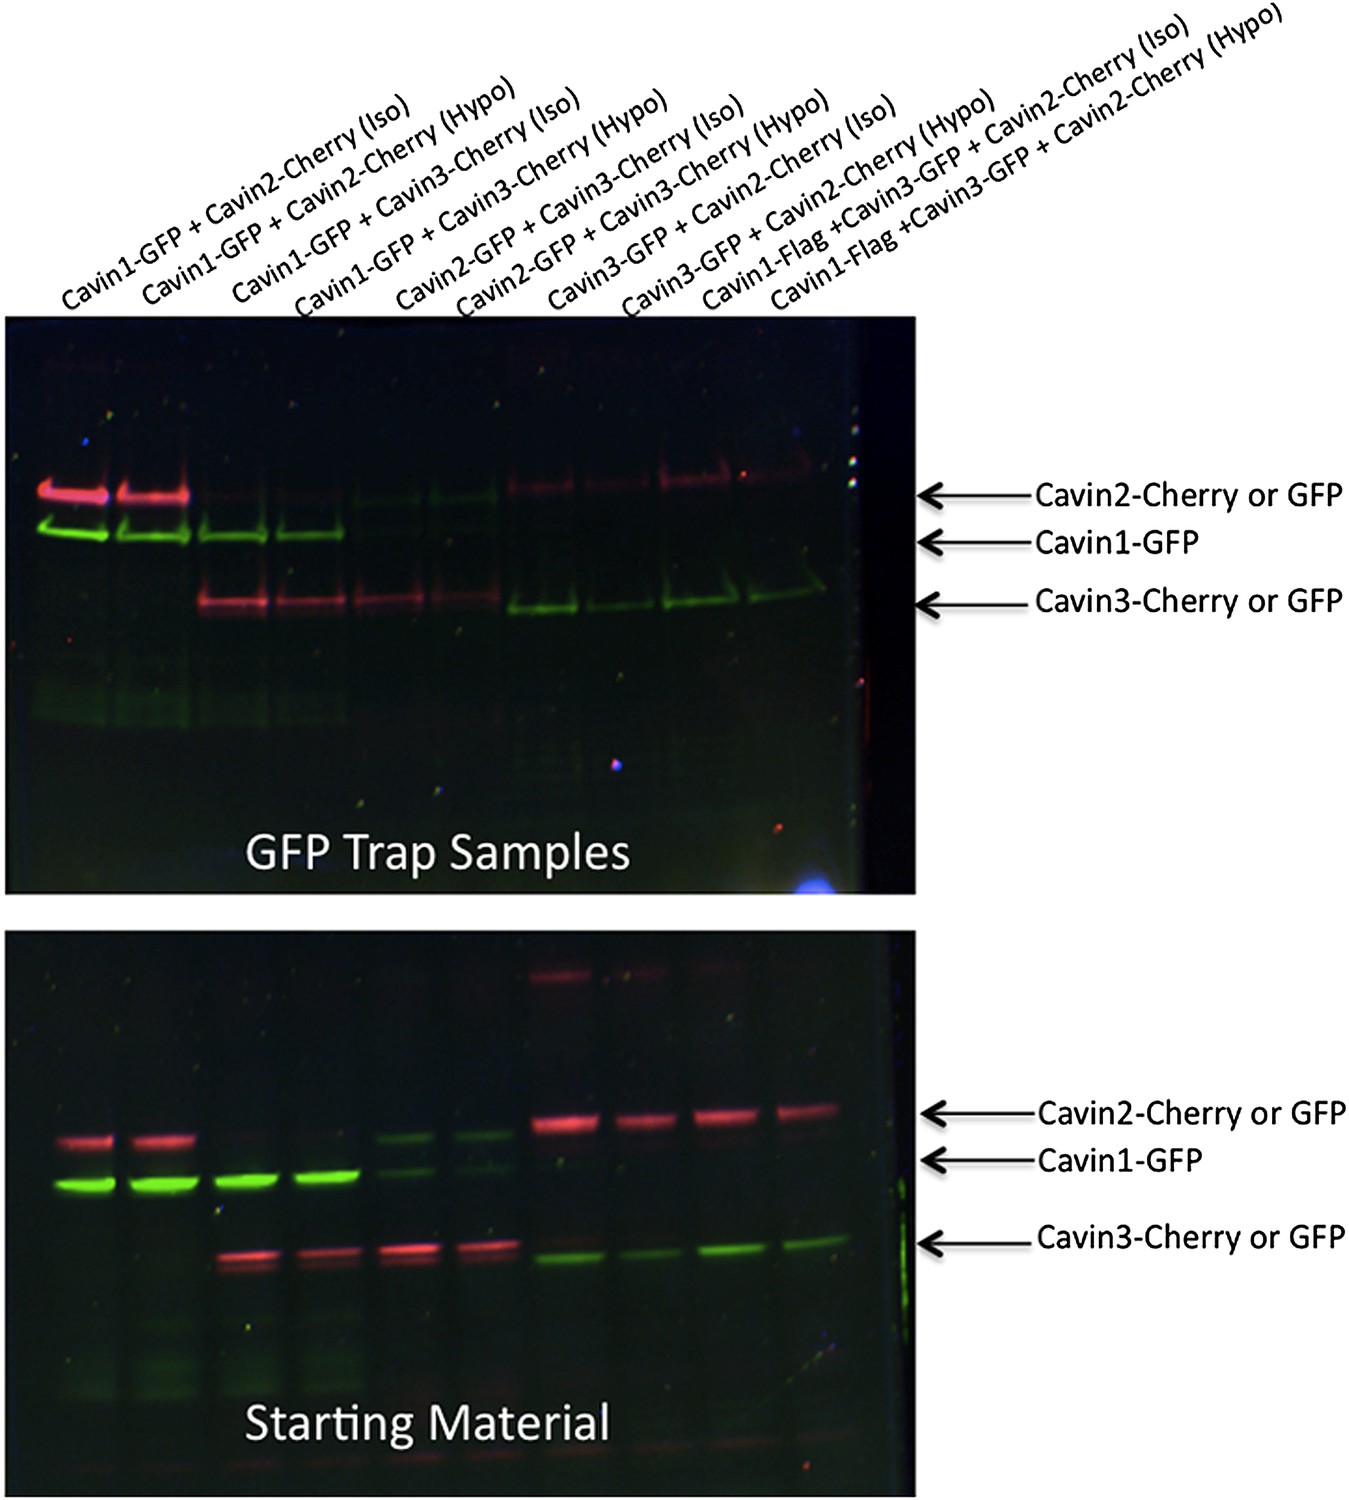
Pull-down analysis of the effect of membrane stretching on the association between cavin members.
Experiments are performed in MDCK cells, which have endogenous levels of cavin1 and CAV1. MDCK cells were transfected with equal amounts of Cavin 1-GFP (C1-GFP) and Cavin2-Cherry (C2-C), C1-GFP and Cavin 3-Cherry (C3-C), C2-GFP and C3-C, Cavin 3-GFP (C3-GFP) and C2-C and Cavin1-Flag with C3-GFP and C2-C. Cells were then treated with 100% DMEM (Iso-osmotic; Iso) or with DMEM diluted in 90% sterile water (Hypo-osmotic; Hypo) for 20 min at 37°C. Post nuclear supernatant (soluble cytoplasmic fraction) were prepared by extensive washing of cells in PBS. Cells were then scraped into PBS containing protease and phosphatase inhibitors followed by mechanic disruption by syringe lysis. Cells were then pelleted at 2000 rpm, 10 min at 4°C. 120th of the supernatant was retained as the starting material (B). The remaining supernatant was mixed with 20 μl of prewashed GFP Trap beads for 30 min at 4°C on a rotating wheel. The beads were pelleted and washed three times in PBS supplemented with protease and phosphatase inhibitors and were boiled in 4× Sample buffer for 75°C for 2.5 min to preserve the fluorescence. Sample were separated by SDS-PAGE and the fluorescence corresponding to each of the overexpressed GFP or Cherry tagged Cavin construct was detected and quantification in the gel using the BioRad ChemiDoc MP Imaging System.
Figure 5
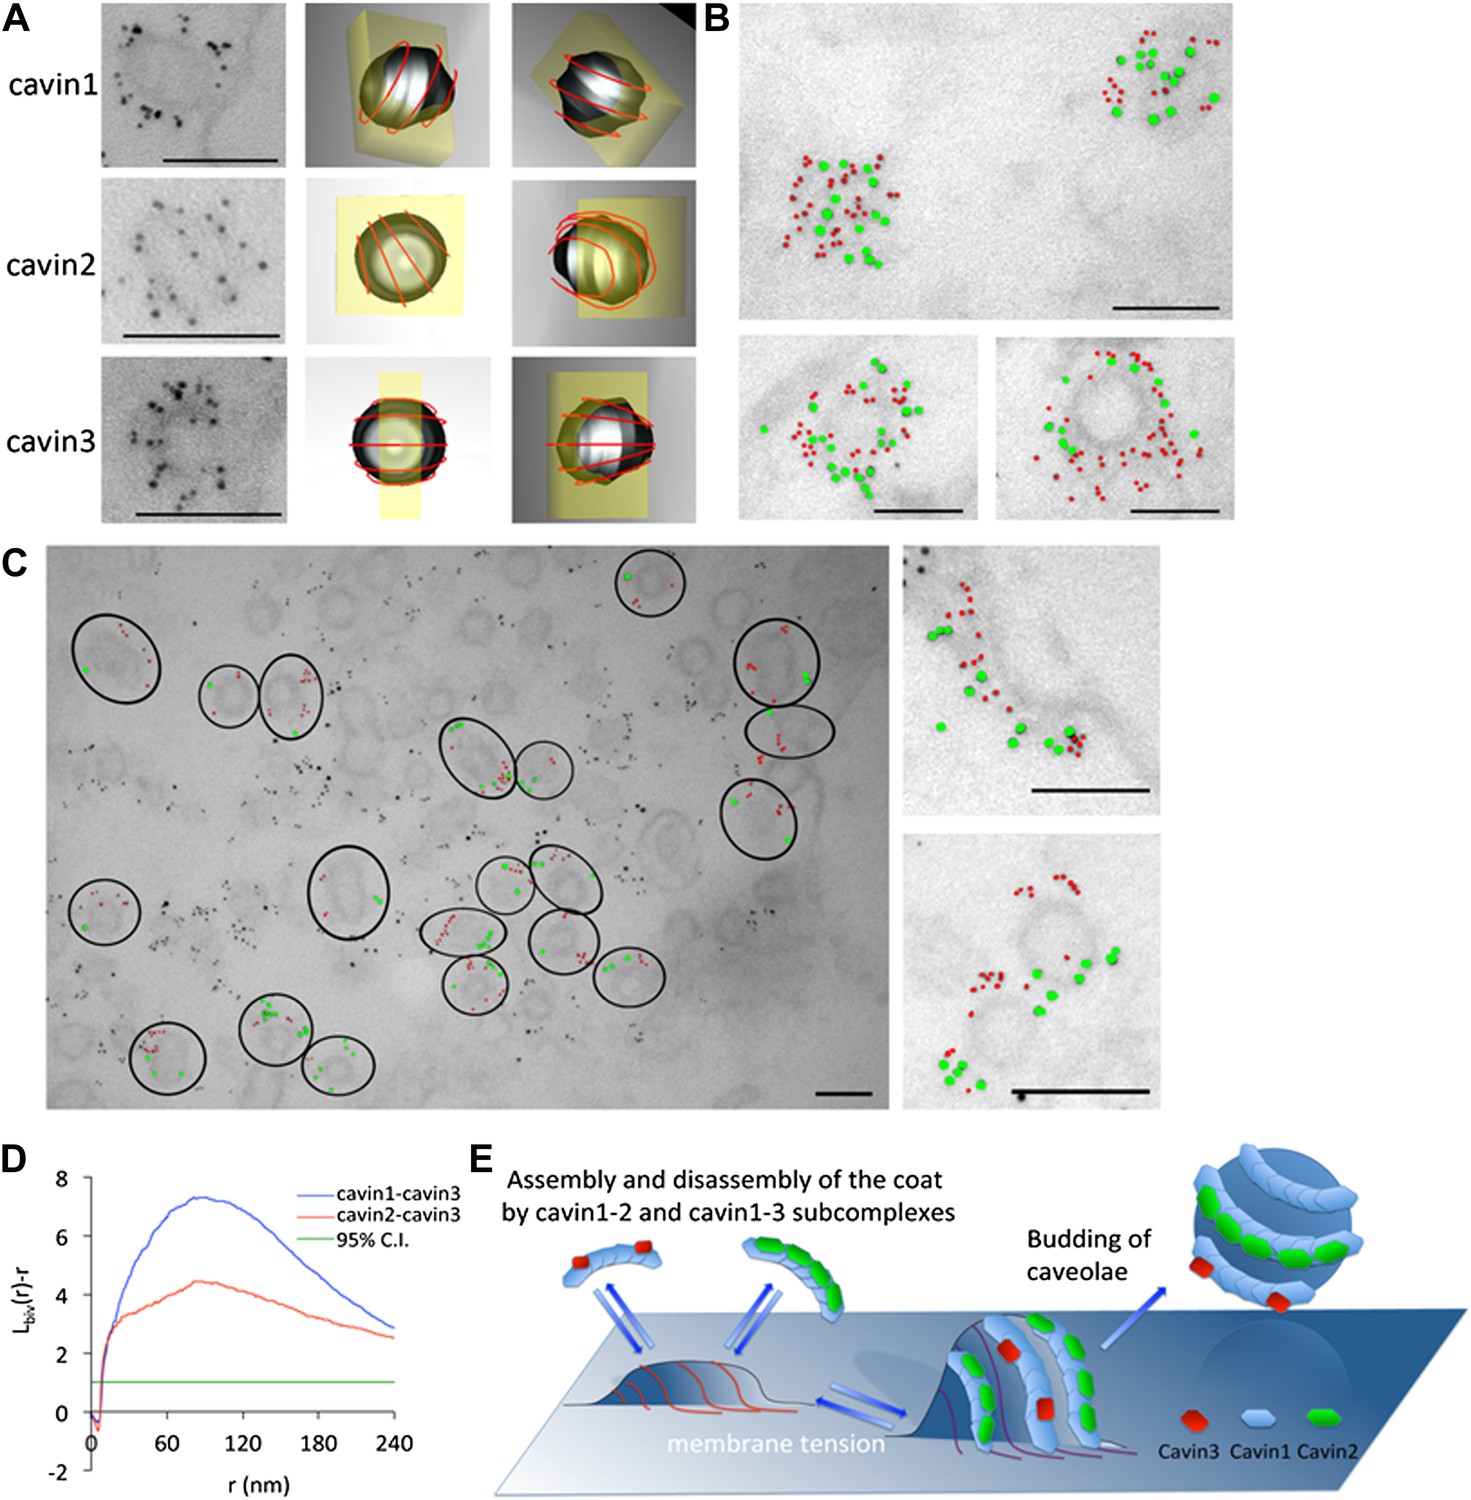
The cavins form part of the striated caveola coat and cavin2 and cavin3 localize to the same caveola while remaining spatially distinct.
(A) High magnification images of immuno-EM labeled 3T3-L1 fibroblasts expressing cavin1 (top row), cavin2 (middle row) and cavin3 (lower row) and their predicted three-dimensional orientation (right hand columns, red line = predicted orientation based on a model of cytoplasmic caveolar striations, yellow box = field of view from electron micrograph of 60 nm section). Scale bars, 100 nm. (B) High magnification images of cavin1-Cherry (3 nm gold–colored red) and cavin3-GFP (7 nm gold–colored green) label the same caveolae and have significant overlap. Scale bars, 100 nm. (C) Cavin-2-GFP (7 nm gold) and cavin-3-Cherry (3 nm gold) demonstrates the spatial separation between both proteins within individual caveolae, consistent with the formation of separate striations. Black circles in the low magnification image denote the spatial limit of the individual caveola and its associated coat of caveolae that are positive for both cavin2 and cavin3. Scale bars, 100 nm. (D) Bivariate clustering analysis of different plasma membrane lawns expressing various combinations of cavin proteins. Significantly higher co-clustering of cavin1-cavin3 was observed when compared to cavin2-cavin3 (CI = confidence interval). Scale bars, 100 nm. (E) Model of association and disassociation of the cavin1-cavin2 and cavin1-cavin3 subcomplexes.
Download links
A two-part list of links to download the article, or parts of the article, in various formats.
Downloads (link to download the article as PDF)
Open citations (links to open the citations from this article in various online reference manager services)
Cite this article (links to download the citations from this article in formats compatible with various reference manager tools)
Single-molecule analysis reveals self assembly and nanoscale segregation of two distinct cavin subcomplexes on caveolae
eLife 3:e01434.
https://doi.org/10.7554/eLife.01434


