The Ca2+-activated K+ current of human sperm is mediated by Slo3
- Center of Advanced European Studies and Research, Germany
- Washington University School of Medicine, United States
- Ruhr-Universität Bochum, Germany
Figures
Figure 1 with 1 supplement
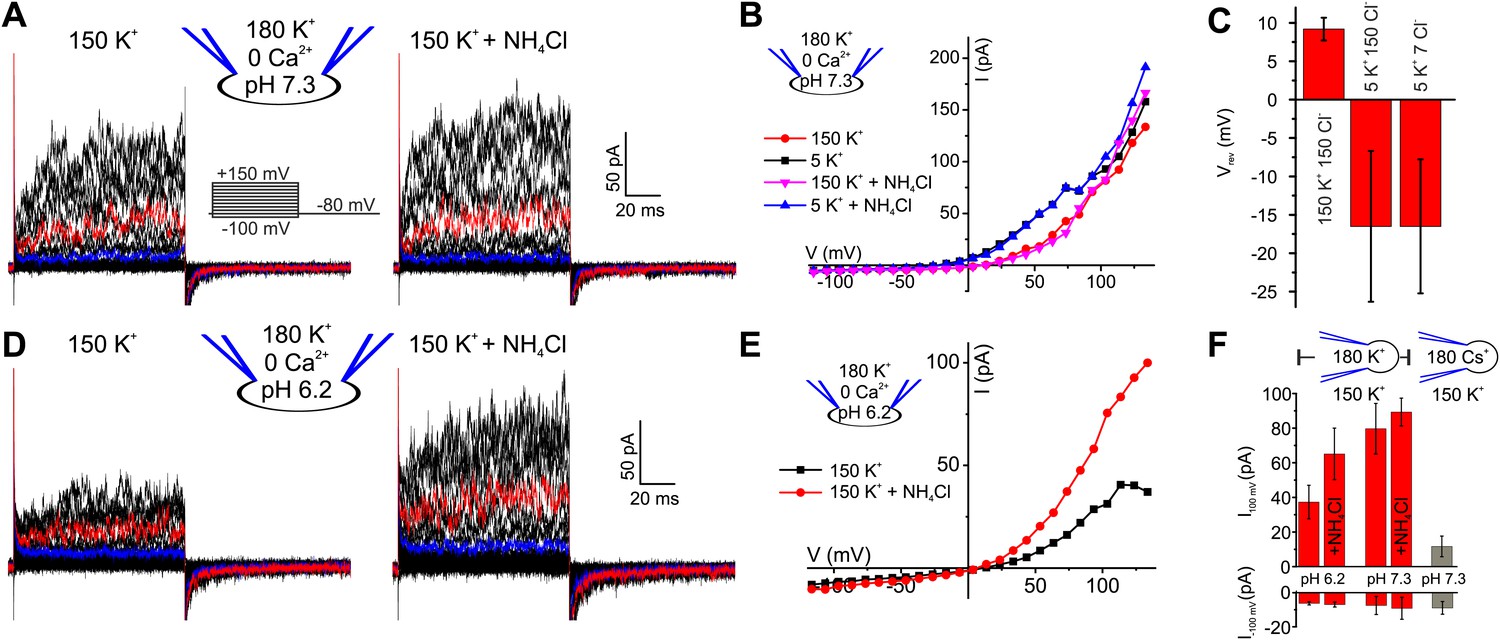
Voltage- and alkaline-activated K+ currents in human sperm.
(A) Whole-cell currents before and after application of 10 mM NH4Cl. Traces at 35 mV and 85 mV are depicted in blue and red, respectively. (B) Current-voltage relation of recordings from (A) and currents recorded in 5 mM [K+]o. (C) Mean Vrev of currents at pHi 7.3 in different extracellular solutions (n = 3–5). (D) Currents recorded at pHi 6.2. (E) Current-voltage relation of recordings from (D). (F) Mean currents before and after application of NH4Cl (10 mM) and with Cs+-based intracellular solution (180 mM Cs+) (n = 3–6).
Figure 1—figure supplement 1
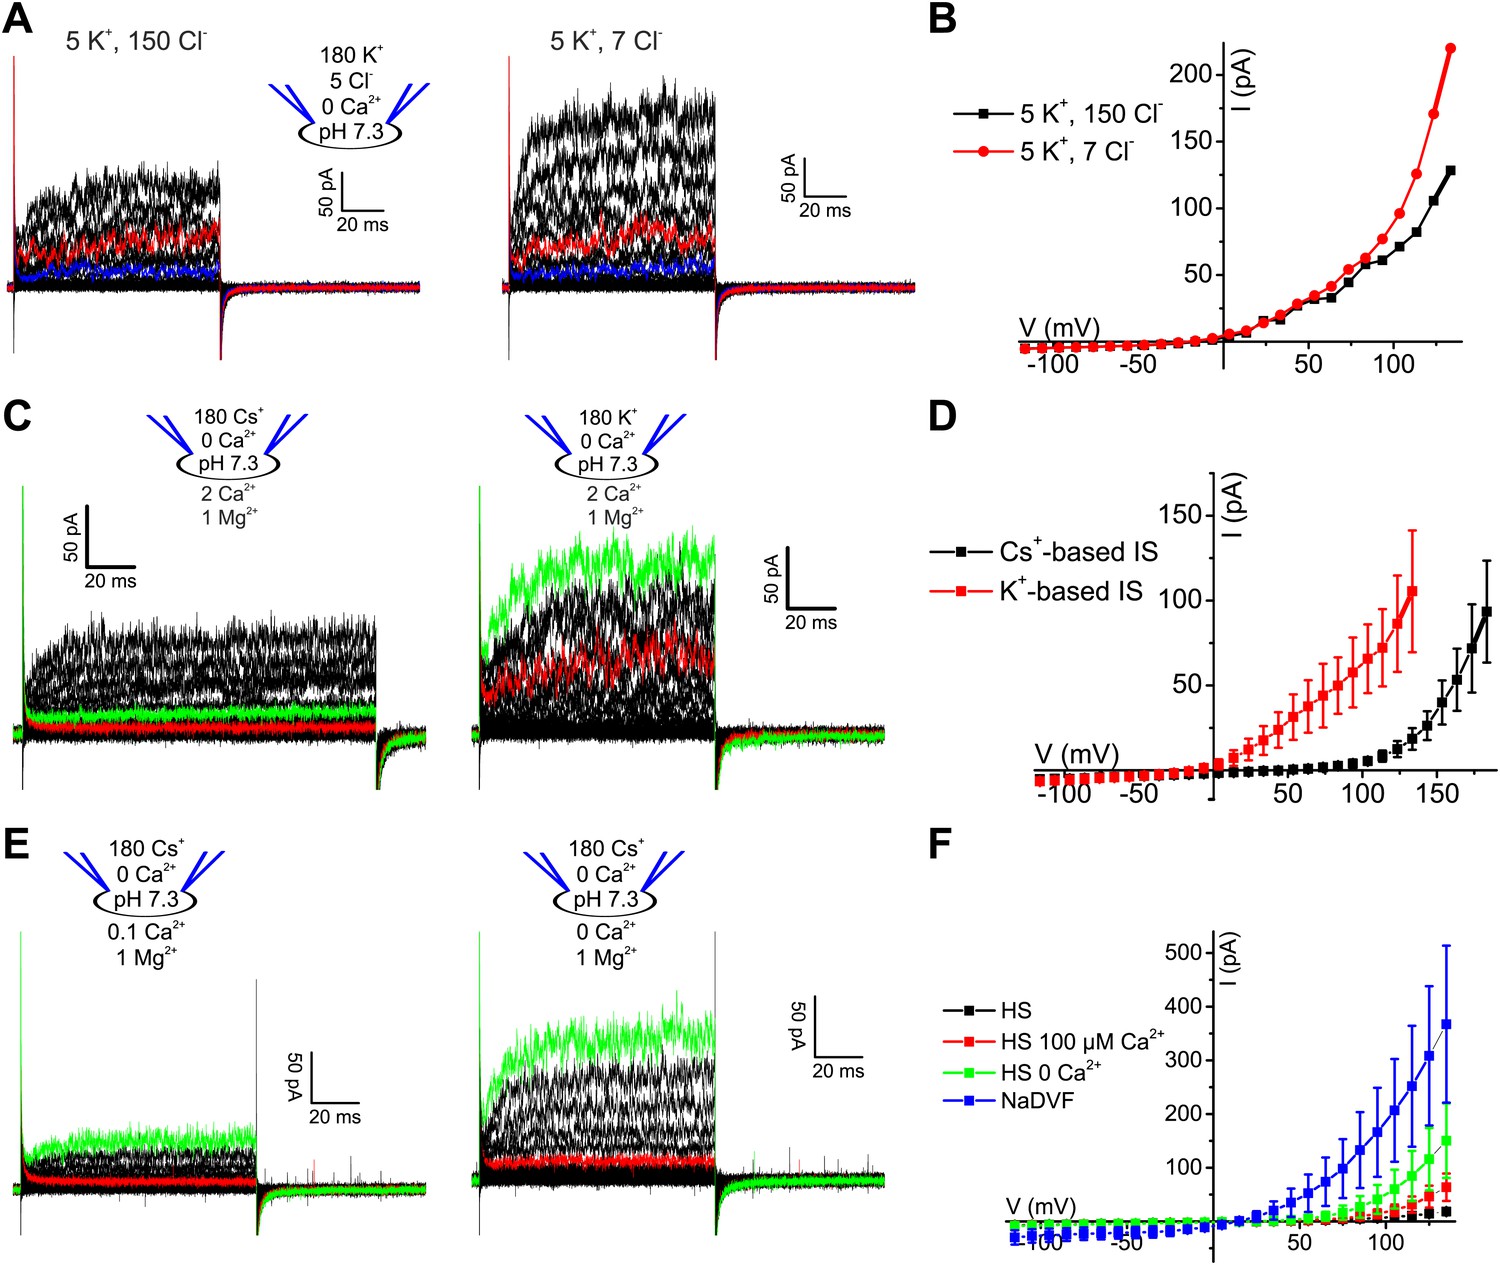
Voltage-gated currents in human sperm are carried by K+ channels.
(A) Whole-cell currents from human sperm recorded in K+-based intracellular solution at pHi 7.3 and in extracellular solutions containing (in mM): 5 K+/150 Cl− or 5 K+/7 Cl−. Current traces at +35 mV and +85 mV are depicted in blue and red, respectively. (B) Current-voltage relation of recordings from part (A). (C) Whole-cell currents recorded from human sperm in Cs+-based (left) and K+-based (right) intracellular solutions at pHi 7.3 in 5 mM extracellular K+. Current traces at 85 mV and 135 mV are depicted in red and green, respectively. (D) Mean current–voltage relation of recordings as in panel C. (E) Whole-cell currents recorded from human sperm in Cs+-based intracellular solutions at pHi 7.3 in 5 mM extracellular K+ and Ca2+ as indicated. Current traces at +85 mV and +135 mV are depicted in red and green, respectively. (F) Mean current–voltage relation recorded from human sperm in Cs+-based intracellular solutions at pHi 7.3 in HS (2 mM Ca2+, 2 mM Mg2+), HS 100 µM Ca2+ (2 mM Mg2+), HS 0 Ca2+ (2 mM Mg2+), and NaDVF (0 Ca2+, 0 Mg2+).
Figure 2

Vm of human sperm is controlled by [Ca2+]i rather than pHi.
(A) Current-clamp recording from human sperm (pHi 6.2) in extracellular solutions containing different [K+] and [Cl−] (in mM). Intracellular alkalization was evoked by superfusion with 10 mM NH4Cl. (B) Current-clamp recording at pHi 7.3. (C) Left panel: mean Vm under conditions as described in panel A and B; right panel: mean Vm at indicated [Ca2+]i, and at 1 mM [Ca2+]i under conditions described in panel D (n = 3–4). (D) Current-clamp recording at pHi 7.3 and 1 mM [Ca2+]i.
Figure 3 with 1 supplement
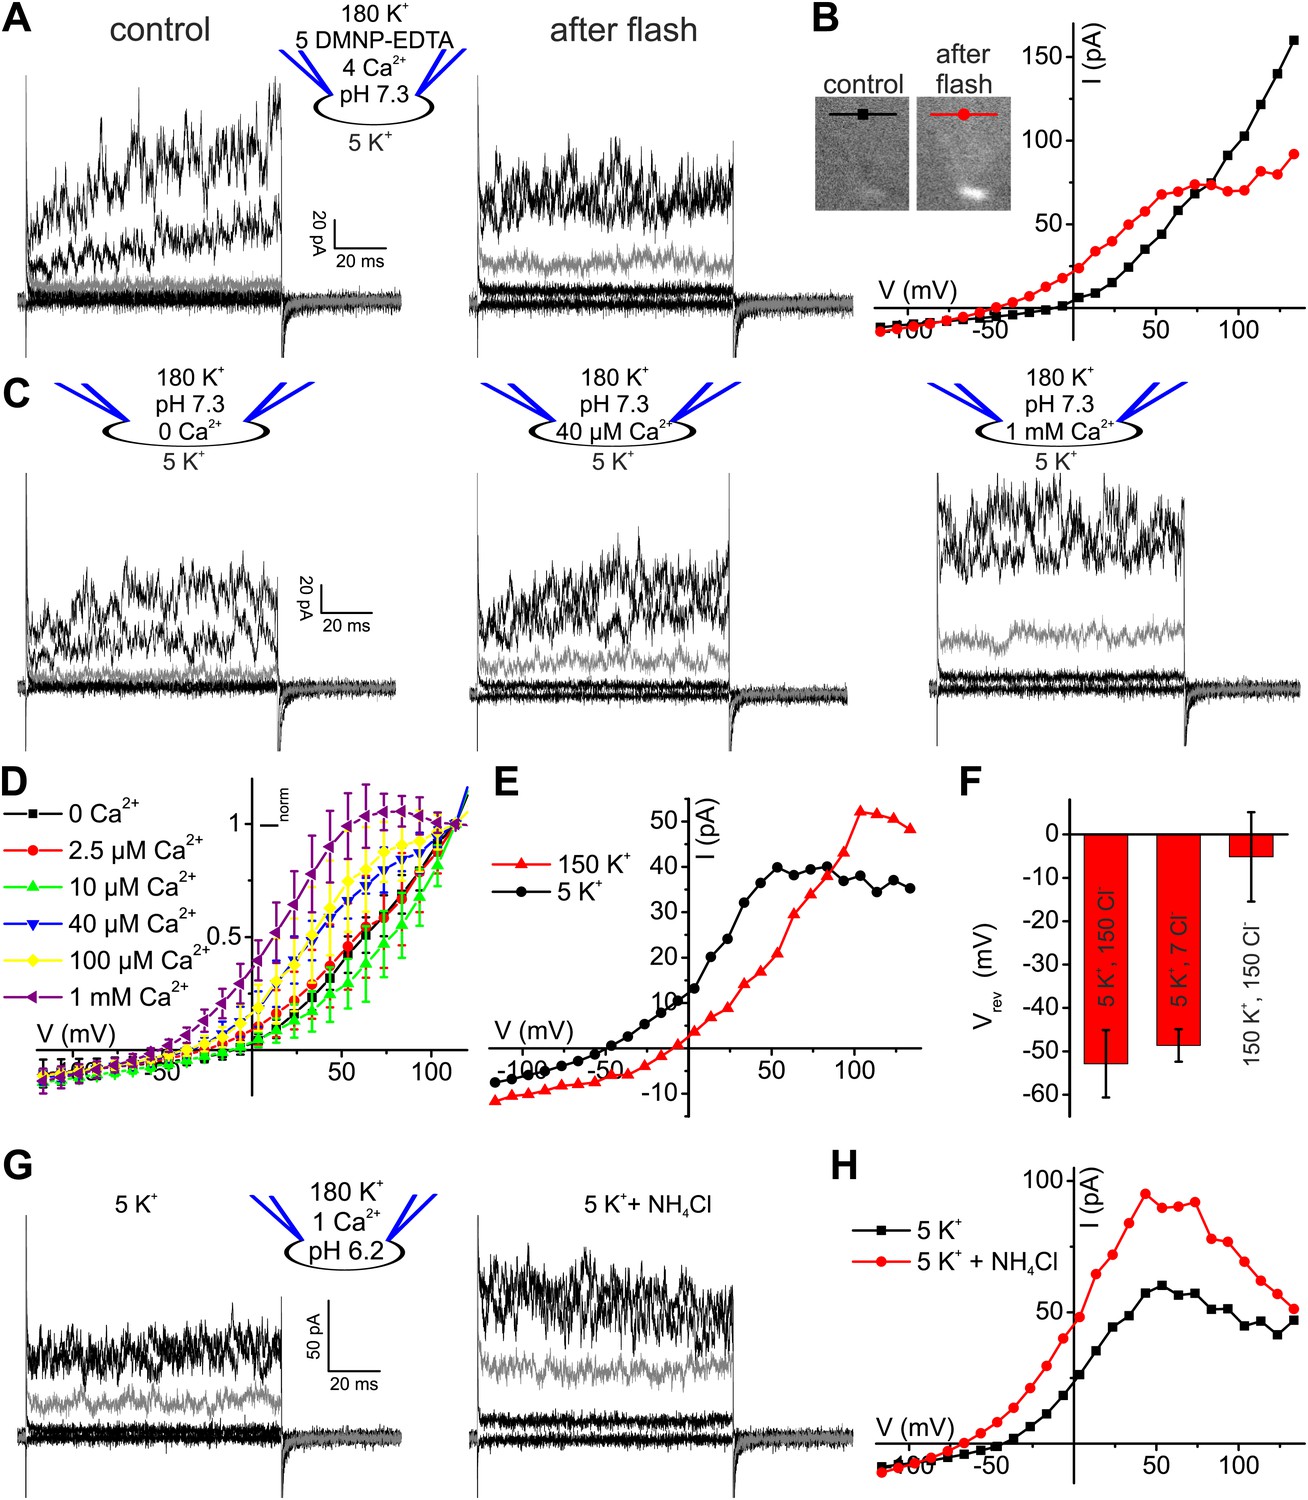
Ca2+ enhances K+ currents in human sperm.
(A) Whole-cell currents recorded at pHi 7.3 with 5 mM DMNP-EDTA, 4 mM Ca2+, and 10 µM Fluo-4 in 5 mM extracellular K+ solution before (control) and after photorelease of Ca2+; for simplification, only currents evoked by −105, −55, −5 (grey), 45, and 95 mV are depicted. (B) Current-voltage relation of recordings from A. (C) Whole-cell-currents at pHi 7.3 at 0 (left), 40 µM (middle) and 1 mM [Ca2+]i (right) in extracellular solutions containing 5 mM K+; for simplification, only currents evoked by −105, −55, −5 (grey), 45, and 95 mV are depicted. (D) Current-voltage relations of currents recorded at 2.5–1000 µM [Ca2+]i; I–V curves were normalized to the amplitude at 115 mV. (E) Current-voltage relation of currents recorded at pHi 7.3 and 1 mM [Ca2+]i; extracellular solutions contained 150 mM K+ or 5 mM K+. (F) Mean Vrev of currents at pHi 7.3, 1 mM [Ca2+]i, and different [K+]o and [Cl−]o (in mM) (n = 3–4). (G) Whole-cell currents recorded at pHi 6.2, 1 mM [Ca2+]i, and 5 mM [K+]o, before and after superfusion with 10 mM NH4Cl. (H) Current-voltage relation of recordings from (G).
Figure 3—figure supplement 1
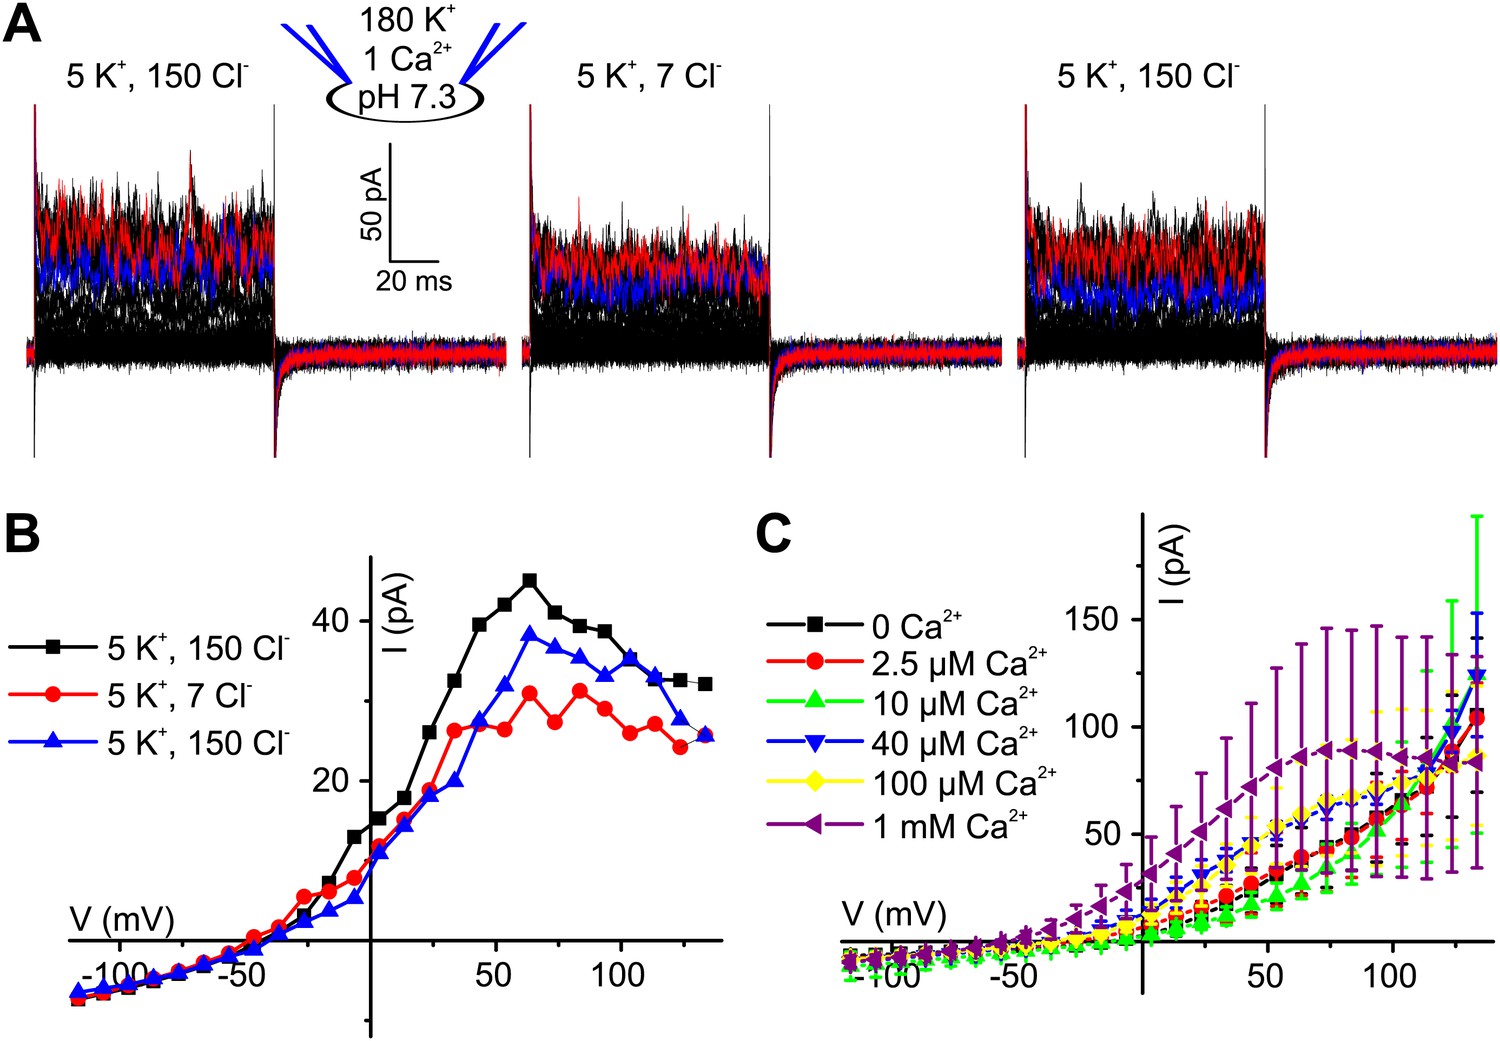
Ca2+-activated currents in human sperm are carried by K+ channels.
(A) Whole-cell currents from human sperm recorded in K+-based intracellular solution at pHi 7.3 and 1 mM [Ca2+]i in extracellular solutions containing (in mM): 5 K+/150 Cl− or 5 K+/7 Cl−. (B) Current-voltage relation of recordings from panel (A). (C) Mean currents from human sperm recorded in K+-based intracellular solution at pHi 7.3 and different [Ca2+]i in 5 mM extracellular K+ (n = 3–9).
Figure 4
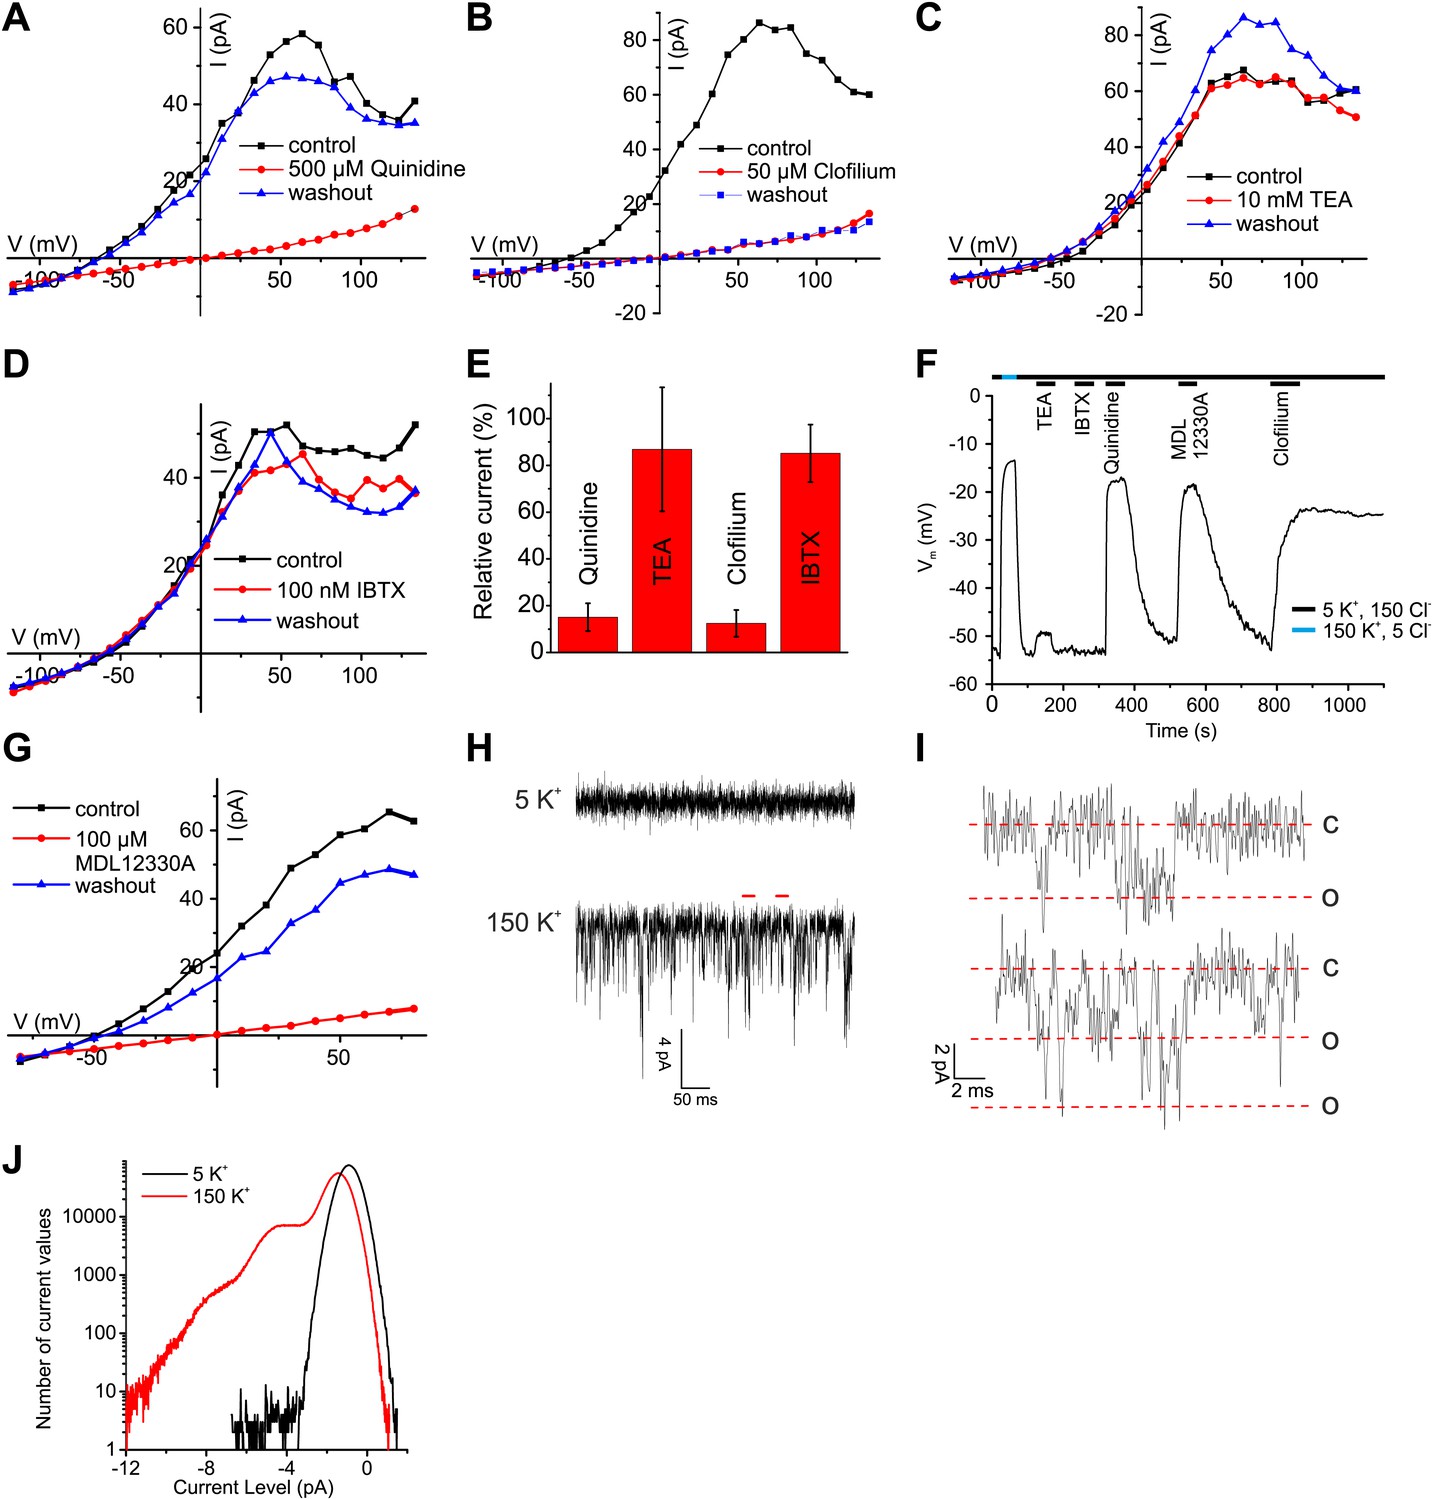
Ca2+-activated K+ currents in human sperm exhibit hallmarks of Slo3 channels.
(A–D, G) Current-voltage relation of whole-cell currents from human sperm recorded in K+-based intracellular solution at pHi 7.3 and 1 mM [Ca2+]i in 5 mM extracellular K+ before, during, and after application of inhibitors. (E) Mean outward currents at 65 mV in the presence of 500 µM quinidine, 10 mM TEA, 50 µM clofilium, or 100 nM IBTX. (F) Current-clamp recording from human sperm in intracellular solution (pHi 7.3) containing 180 mM K+ and 1 mM Ca2+. Sperm were bathed in extracellular solution containing 5 mM K+ and 150 mM Cl−. Concentrations of drugs were as in (A–E, G). (H) Current trace recorded at pHi 7.3 and 70 µM [Ca2+]i at −60 mV in HS (top) and K-based HS (bottom) Filter: 2 kHz. (I) Segments indicated by the red bars in panel (H) shown on an extended time scale (5 kHz), revealing opening events of one (top) and two K+ channels (bottom). Red lines correspond to conductance levels of 0 (c), 65 (o), and 130 pS (o). (J) Histogram of current amplitudes recorded in 5 mM K+ and 150 mM K+, at the conditions described in (H).
Figure 5 with 1 supplement
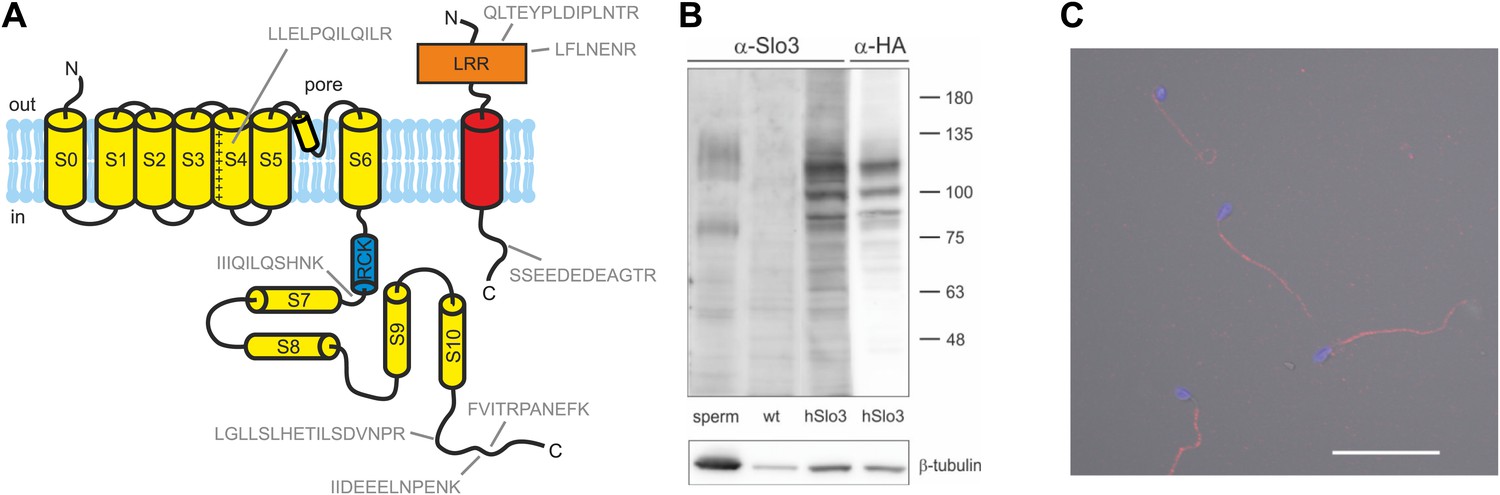
Human sperm express Slo3 and its auxiliary subunit LRRC52.
(A) Predicted membrane topology of hSlo3 (yellow) and hLRRC52 (red) polypeptides. Proteotypic peptides identified in human sperm by targeted protein mass-spectrometry are indicated in grey. (B) Western blot of total proteins of human sperm, CHO cells (wt), and CHO cells transfected with HA-tagged hSlo3 (hSlo3). The Western blot was probed with an anti-hSlo3 and anti-HA antibody. The molecular masses (kDa) of the protein standard are indicated on the right. (C) Human sperm stained with an antibody directed against hSlo3 (red). The DNA in the head was stained with DAPI (blue). Scale bar: 30 µM.
Figure 5—figure supplement 1
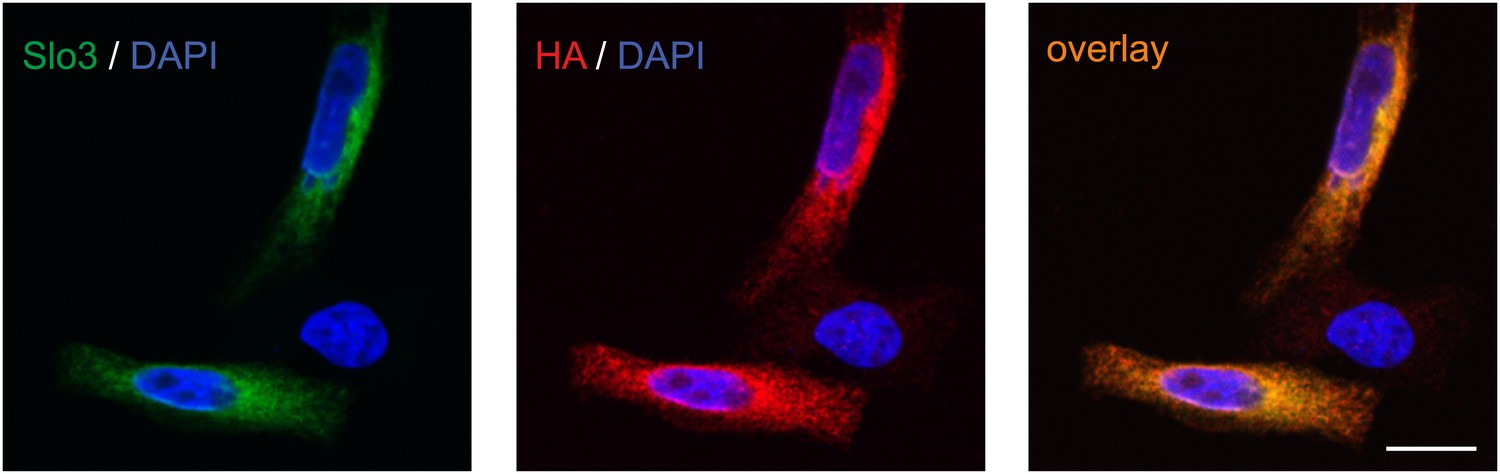
Specificity of anti-hSlo3 antibody.
CHO cells heterologously expressing human Slo3 that was modified with a C-terminal hemagglutinin (HA) tag were stained with an anti-hSlo3 antibody (green) and an antibody directed against the HA-tag (red). DAPI (blue) was used to label the nucleus. Scale bar: 10 µM.
Figure 6 with 2 supplements
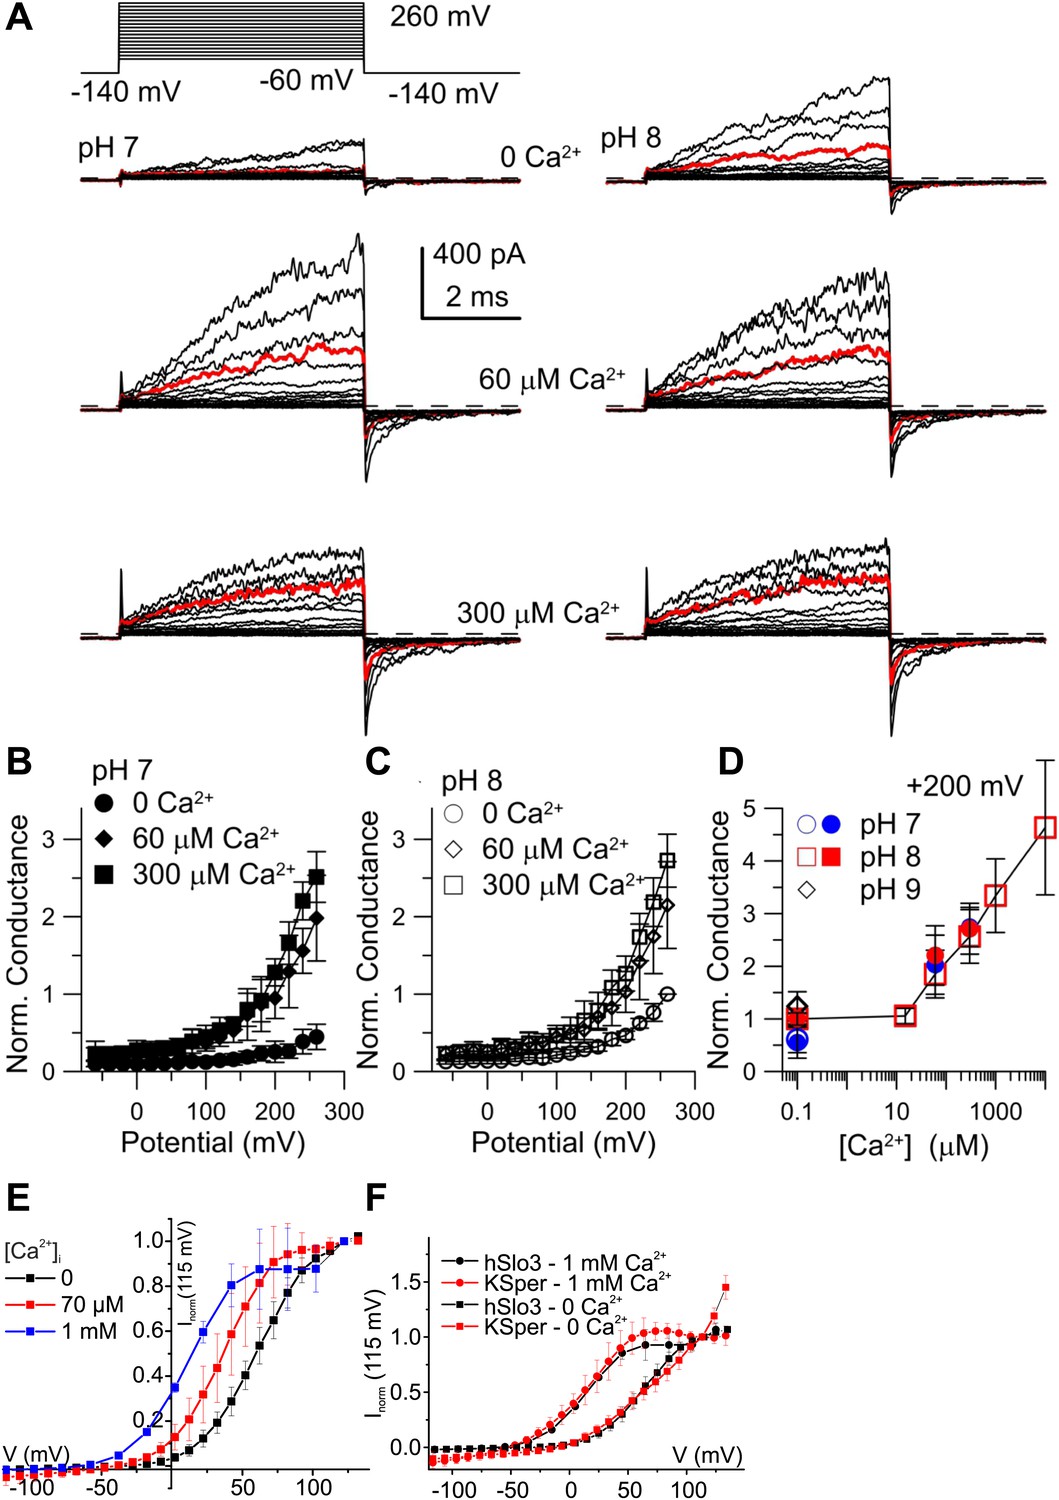
Activation of heterologous hSlo3 by intracellular Ca2+.
(A) Families of hSlo3 + hLRRC52 currents in oocytes at pH 7 and 8 with indicated [Ca2+]i. Current trace at +200 mV is depicted in red. (B and C) Current-voltage relations of tail currents determined at −140 mV; amplitudes were normalized to the amplitude evoked by step to 200 mV, 0 [Ca2+]i, and pH 8. (D) Tail current amplitudes (activated by 200 mV) as function of [Ca2+]i for pH 7 and pH 8. Normalization as in (B). (E) Current-voltage relation of steady-state hSlo3 + hLRRC52 currents in CHO cells at pHi 7.3 and 0, 70 µM, and 1 mM [Ca2+]i. Currents were normalized to the amplitude evoked at 115 mV. (F) Current-voltage relation of hSlo3 + hLRRC52 currents in CHO cells and IKSper recorded from human sperm at 0 and 1 mM [Ca2+]i (pHi 7.2). Normalization as in panel (D).
Figure 6—figure supplement 1
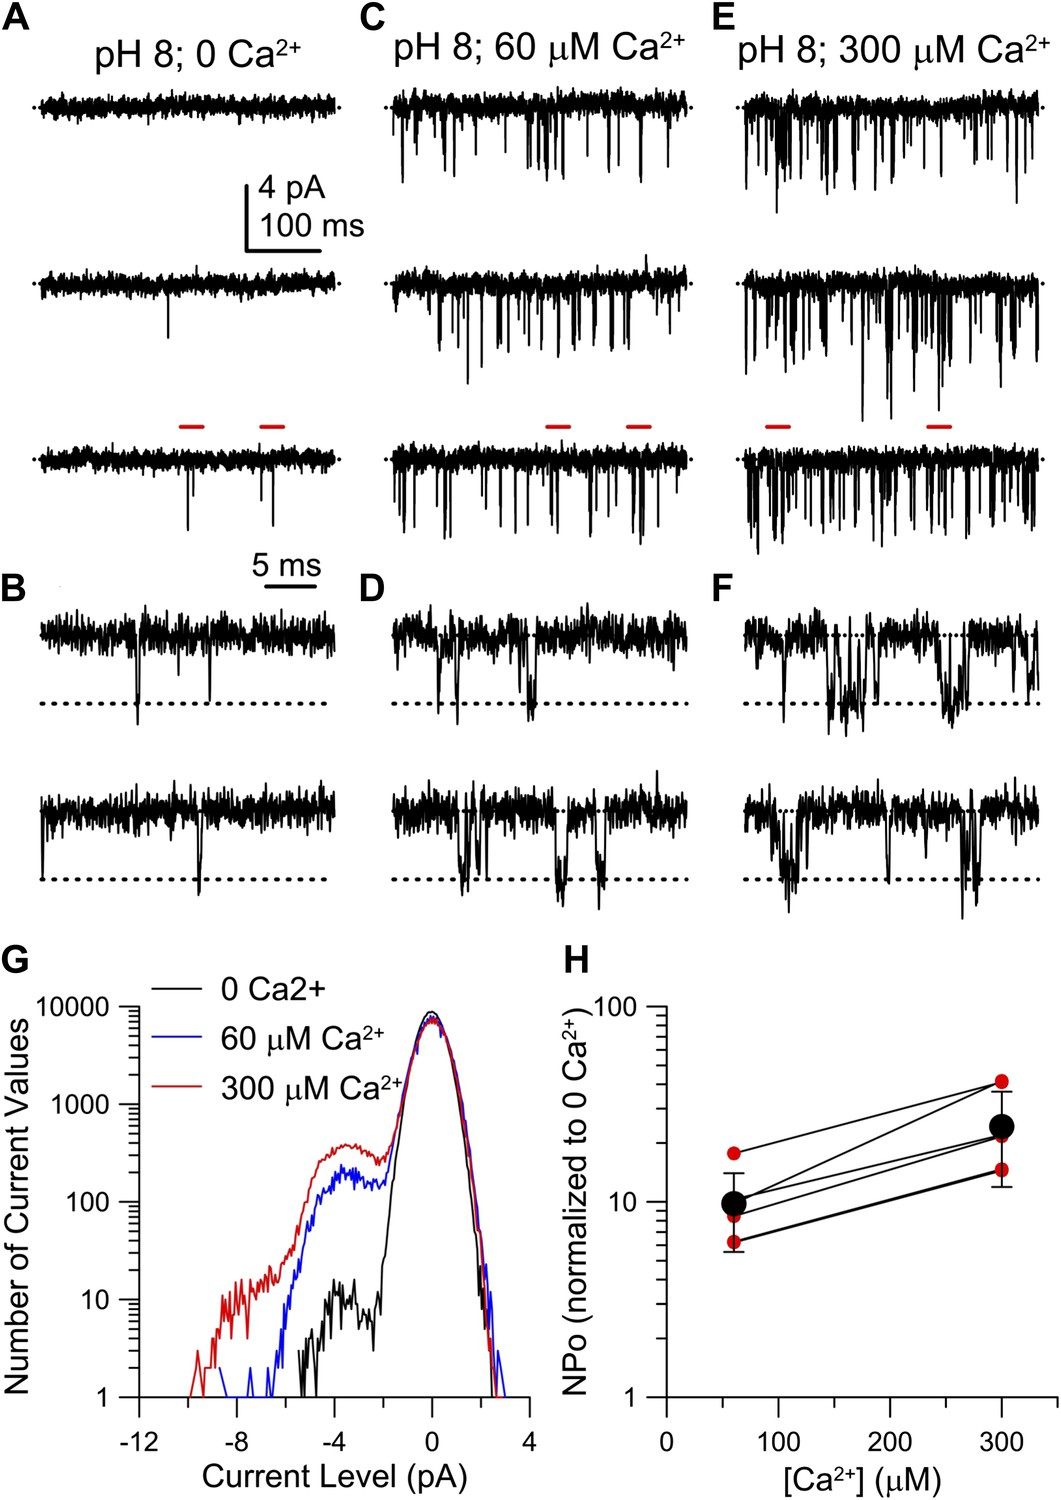
Ca2+ increases hSlo3 single-channel openings at −60 mV.
(A, C, E) hSlo3 + hLRRC52 openings at −60 mV. Filter: 2 kHz. (B, D, F) Segments highlighted with red bars in panel (A, C, E) at faster time base (5 kHz filtering). (G) Total amplitude histogram of a set of current records as in (B, D, F). (H) NPo at 60 and 300 µM Ca2+ normalized to NPo at 0 Ca2+ (n = 7). Red symbols: individual estimates. Black symbols: mean and SD.
Figure 6—figure supplement 2
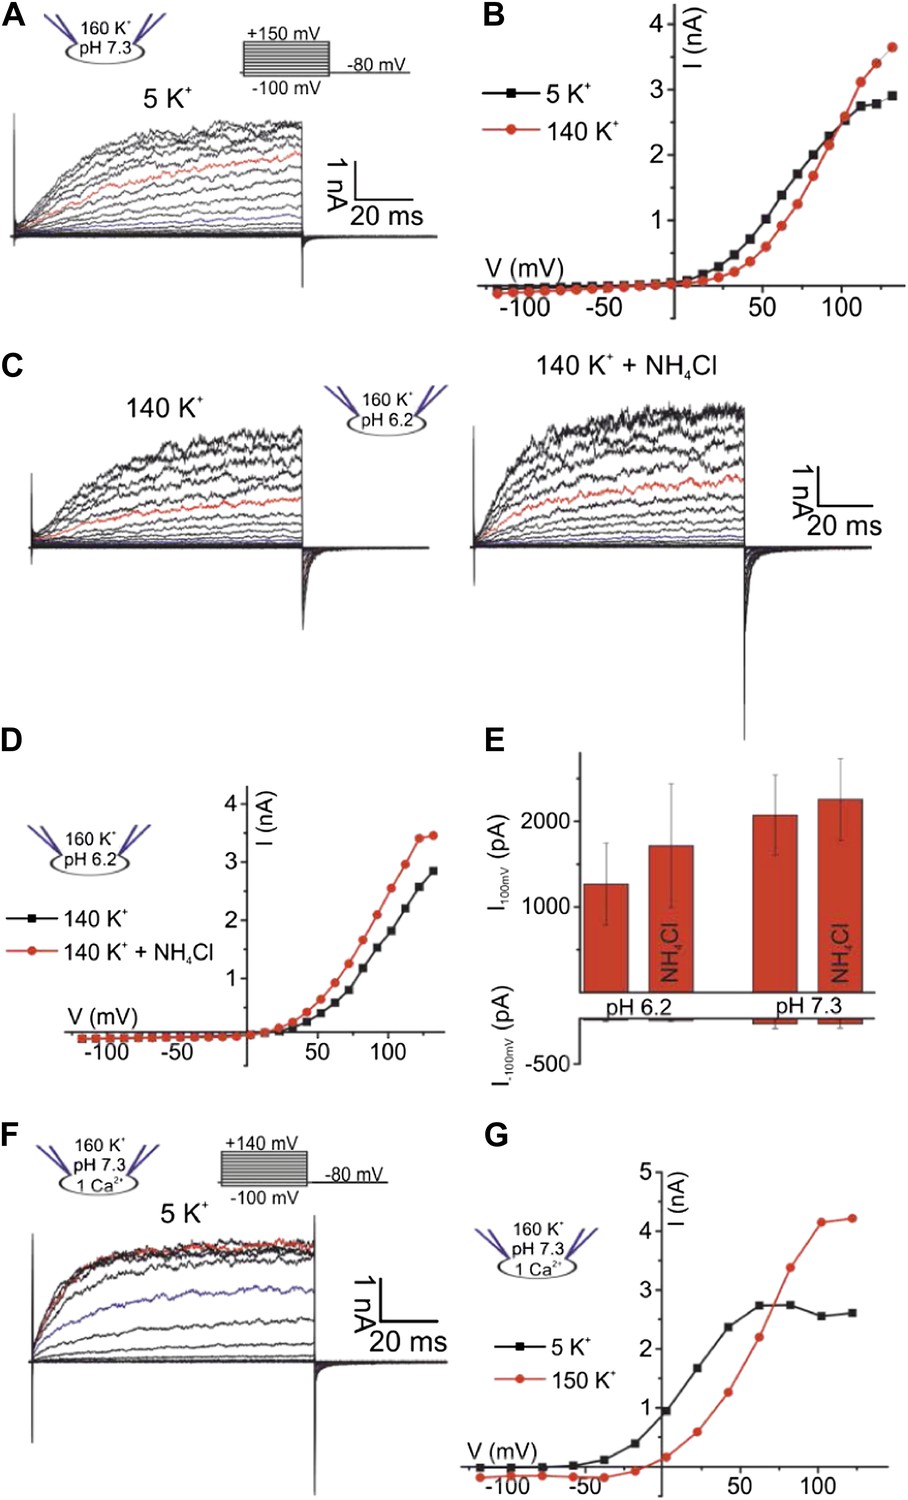
Currents carried by hSlo3 co-expressed with hLRRC52 in CHO cells.
(A) Whole-cell hSlo3 + hLRRC52 currents at pHi 7.3. Traces at +35 mV and +85 mV are depicted in blue and red, respectively. (B) Current-voltage relation of hSlo3 + hLRRC52 currents recorded in 140 mM and 5 mM [K+]o. (C) Currents recorded at pHi 6.2, before and after intracellular alkalization by NH4Cl (10 mM). (D) Current-voltage relation of recordings from panel C. (E) Mean current amplitudes at pHi 6.2 and pHi 7.3 before and after application of NH4Cl (10 mM) (n = 3). (F) Currents recorded at 1 mM [Ca2+]i and 5 mM [K+]o. (G) Current-voltage relation of recordings at 1 mM [Ca2+]i in 140 mM and 5 mM [K+]o.
Figure 7 with 2 supplements
Co-expression of mLRRC52 does not confer Ca2+ sensitivity on mSlo3.
(A) Currents were activated with 0 [Ca2+]i pH 7, 0 [Ca2+]i pH 8, 60 µM [Ca2+]i pH 8, and 300 µM [Ca2+]i pH 8. Red trace corresponds to step to 60 mV. (B) Larger gain display of tail currents from (A). (C) Normalized current–voltage relations of tail currents determined at −140 mV; currents were normalized to tail current amplitude following the step to 200 mV. (D) Normalized tail-current amplitude as a function of [Ca2+]i. Tail currents were normalized to 0 [Ca2+]i at pH 8.
Figure 7—figure supplement 1
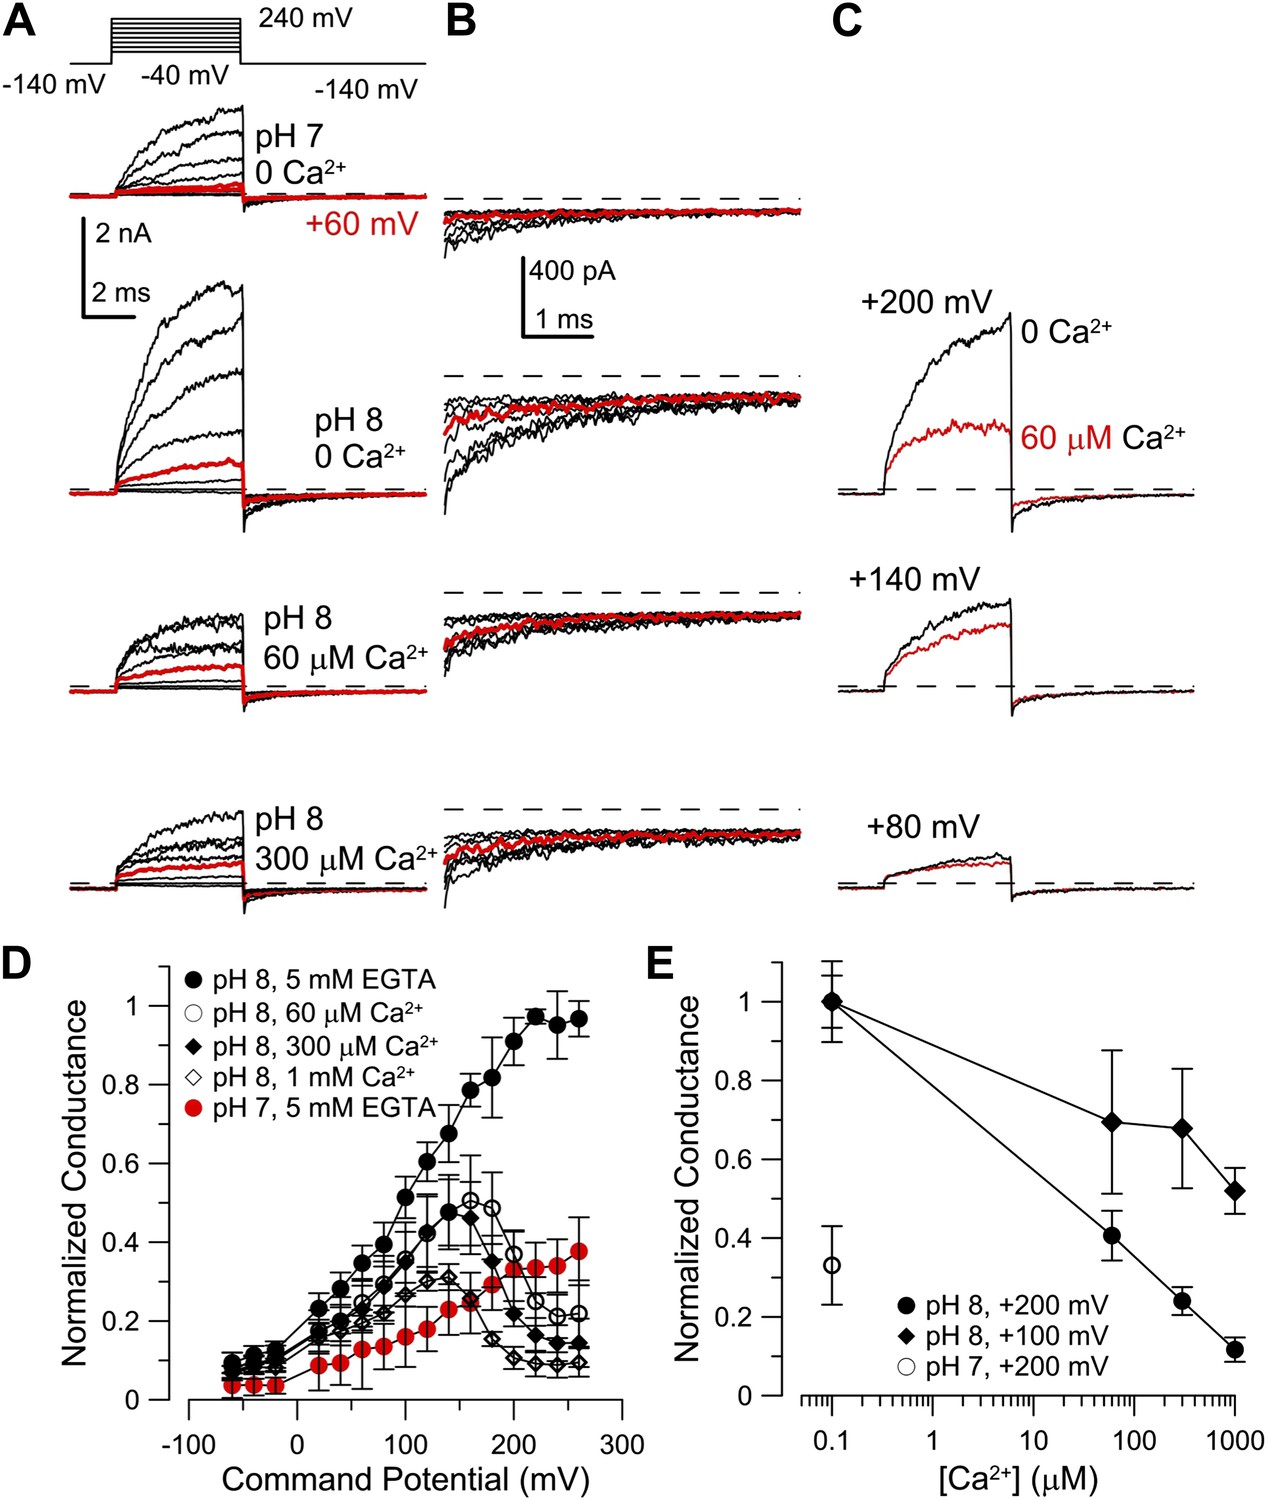
Co-expression of hLRRC52 with mSlo3 does not confer Ca2+ sensitivity on mSlo3.
(A) Currents were activated by the indicated voltage-protocol with 0 Ca2+ pH 7, 0 Ca2+ pH 8, 60 µM Ca2+ pH 8, and 300 µM Ca2+ pH 8, from top to bottom. Red trace corresponds to step to +60 mV. (B) Larger gain display of tail currents from panel (A). (C) Comparison of currents activated at the indicated voltages at pH 8 with either 0 Ca2+ (black) or 60 µM Ca2+ (red). (D) Normalized conductances determined from tail currents following each activation voltage for mSlo3 + hLRRC52 channels for the indicated conditions. (E) Normalized conductance as a function of Ca2+ determined from tail currents following activation at either +100 or +200 mV at pH 8.
Figure 7—figure supplement 2
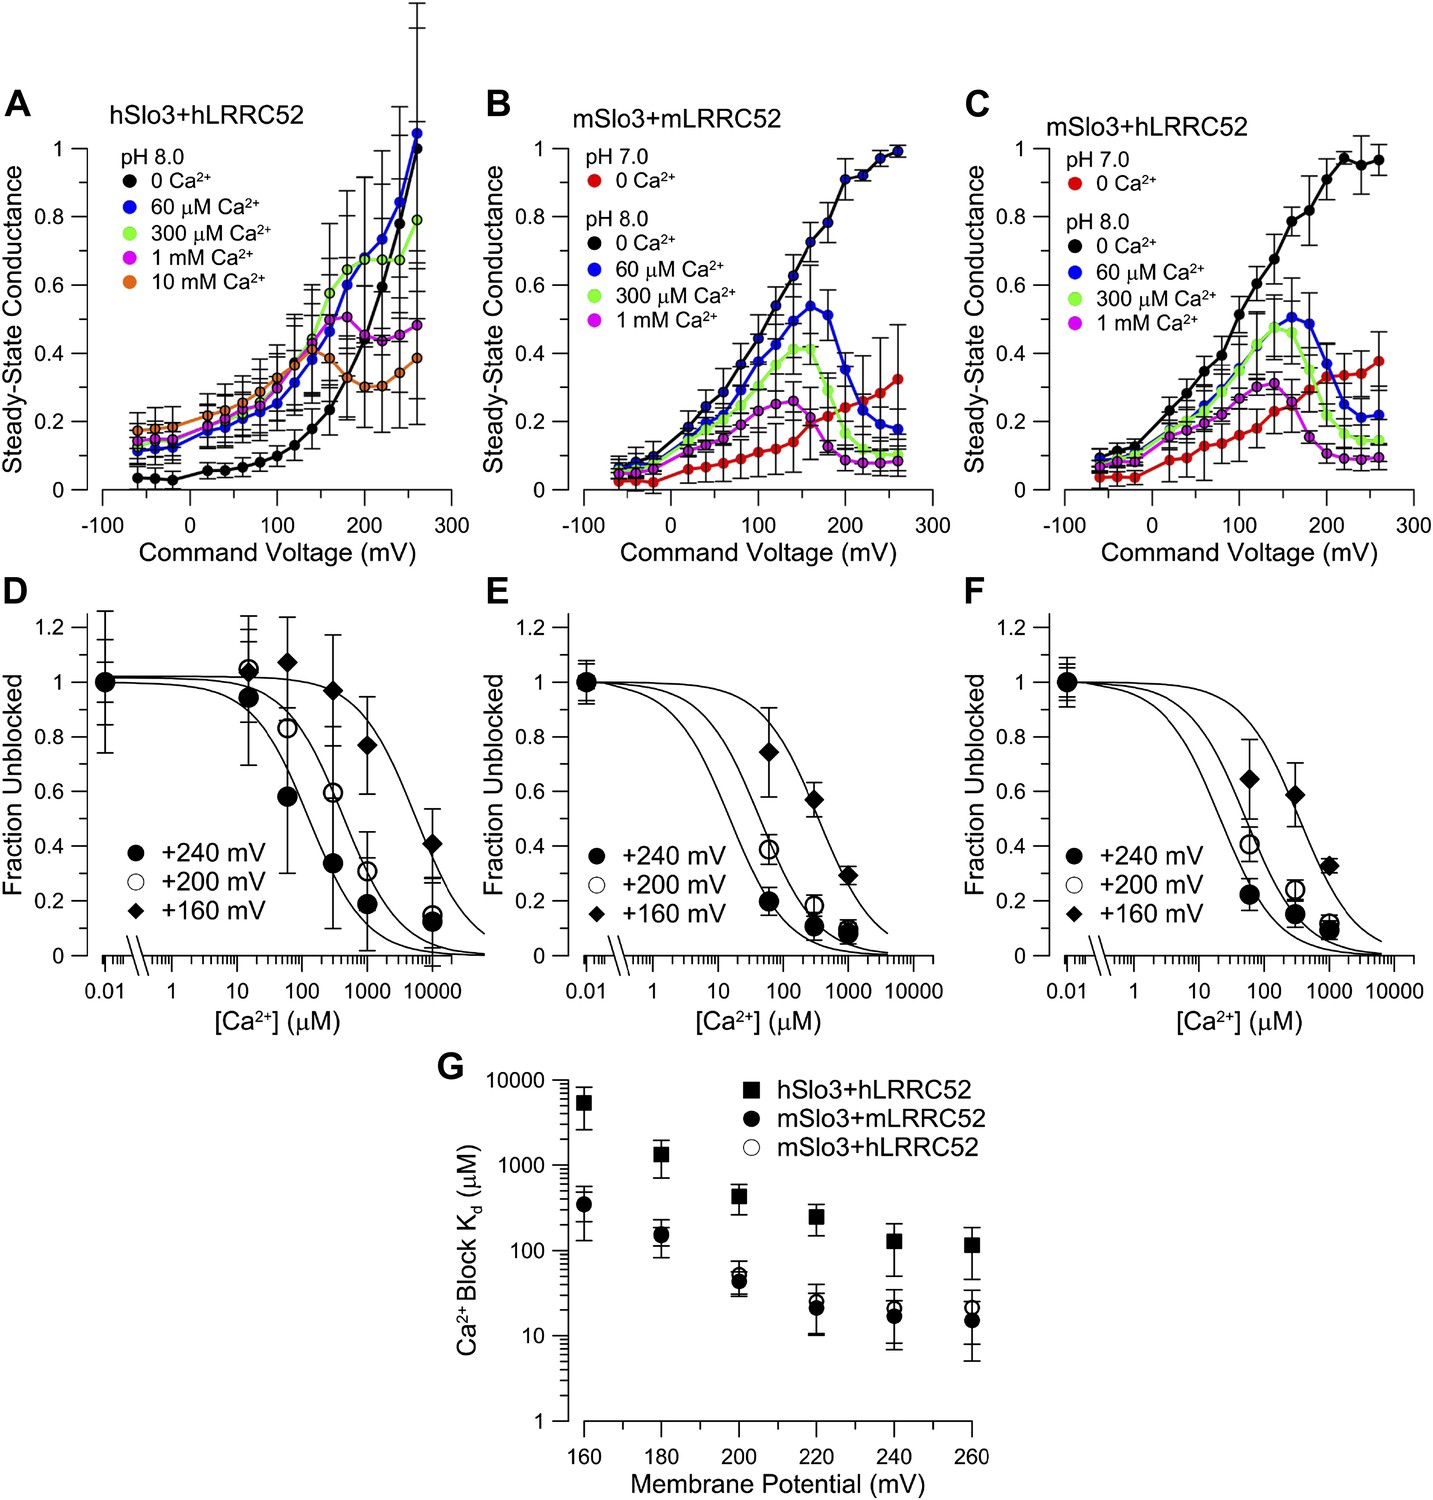
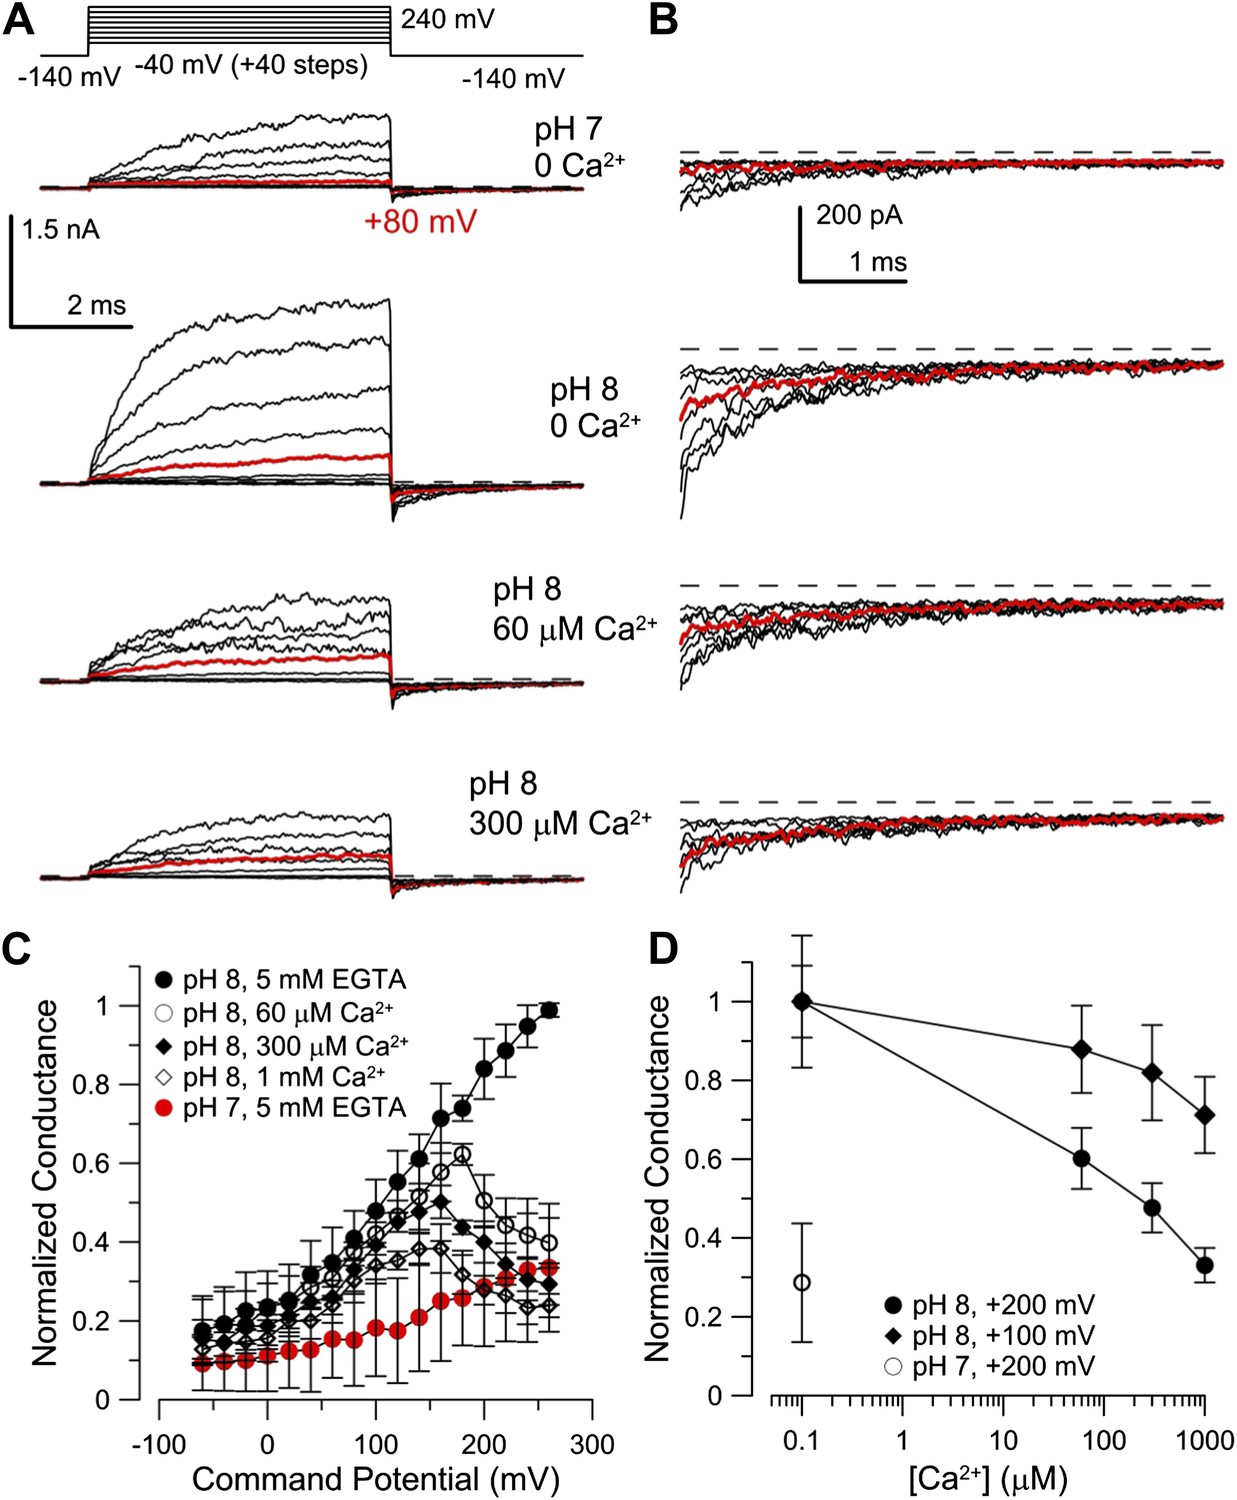
mSlo3 is more sensitive to voltage-dependent block by Ca2+ than hSlo3.
(A) Steady-state conductance-voltage (G-V) relationships for hSlo3 + hLRRC52 at different [Ca2+]i. (B) Steady-state G-V relationships for mSlo3 + mLRRC52 at different [Ca2+]i and pHi. (C) Steady-state G-V relationships for mSlo3 + hLRRC52 at different [Ca2+]i and pHi. (D) Fractional inhibition of conductance at three voltages is plotted as a function of [Ca2+]i; lines indicate the fit of I(Ca2+) = 1/(1+[Ca2+]/KD). For each [Ca2+]i, steady-state conductance reflects both the increase in conductance from Ca2+-dependent inactivation and voltage-dependent block. Values of steady-state conductance from a panel were, therefore, corrected to reflect the measured Ca2+-dependent increase of conductance determined from tail currents. KD values were 128.0 ± 77.6 µM, 428.3 ± 165.1 µM, and 5.4 ± 2.8 mM for +240, +200 and +160 mV, respectively. (E) Fractional inhibition of mSlo3 + mLRRC52 as a function of Ca2+ is plotted along with the best fit curves. KD values were 16.9 ± 8.2, 43.7 ± 12.9, and 350.2 ± 132.6 µM, for +240, +200, and +160 mV, respectively. (F) Fractional inhibition of mSlo3 + hLRRC52 as a function of Ca2+. KD values were 20.8 ?13.9, 52.2 ?23.0, and 345.8 ± 215.3 µM for +240, +200, and +160 mV, respectively. (G) Voltage-dependence of the KD for Ca2+ inhibition is plotted for mSlo3 + mLRRC52 along with the values for hSlo3 + hLRRC52 and mSlo3 + hLRRC52.
Figure 8

Progesterone-evoked Ca2+ responses in human sperm.
(A) Ca2+ signal evoked by progesterone (2 µM) and ionomycin (2 µM) in sperm loaded with different Ca2+ indicators. (B) Relative amplitude of the progesterone- vs ionomycin-induced Ca2+ signal in sperm loaded with indicators of various Ca2+ sensitivity. (C) Dynamic range of Ca2+ sensitivity for different indicators assuming 1:1 binding of Ca2+.
Figure 9 with 1 supplement
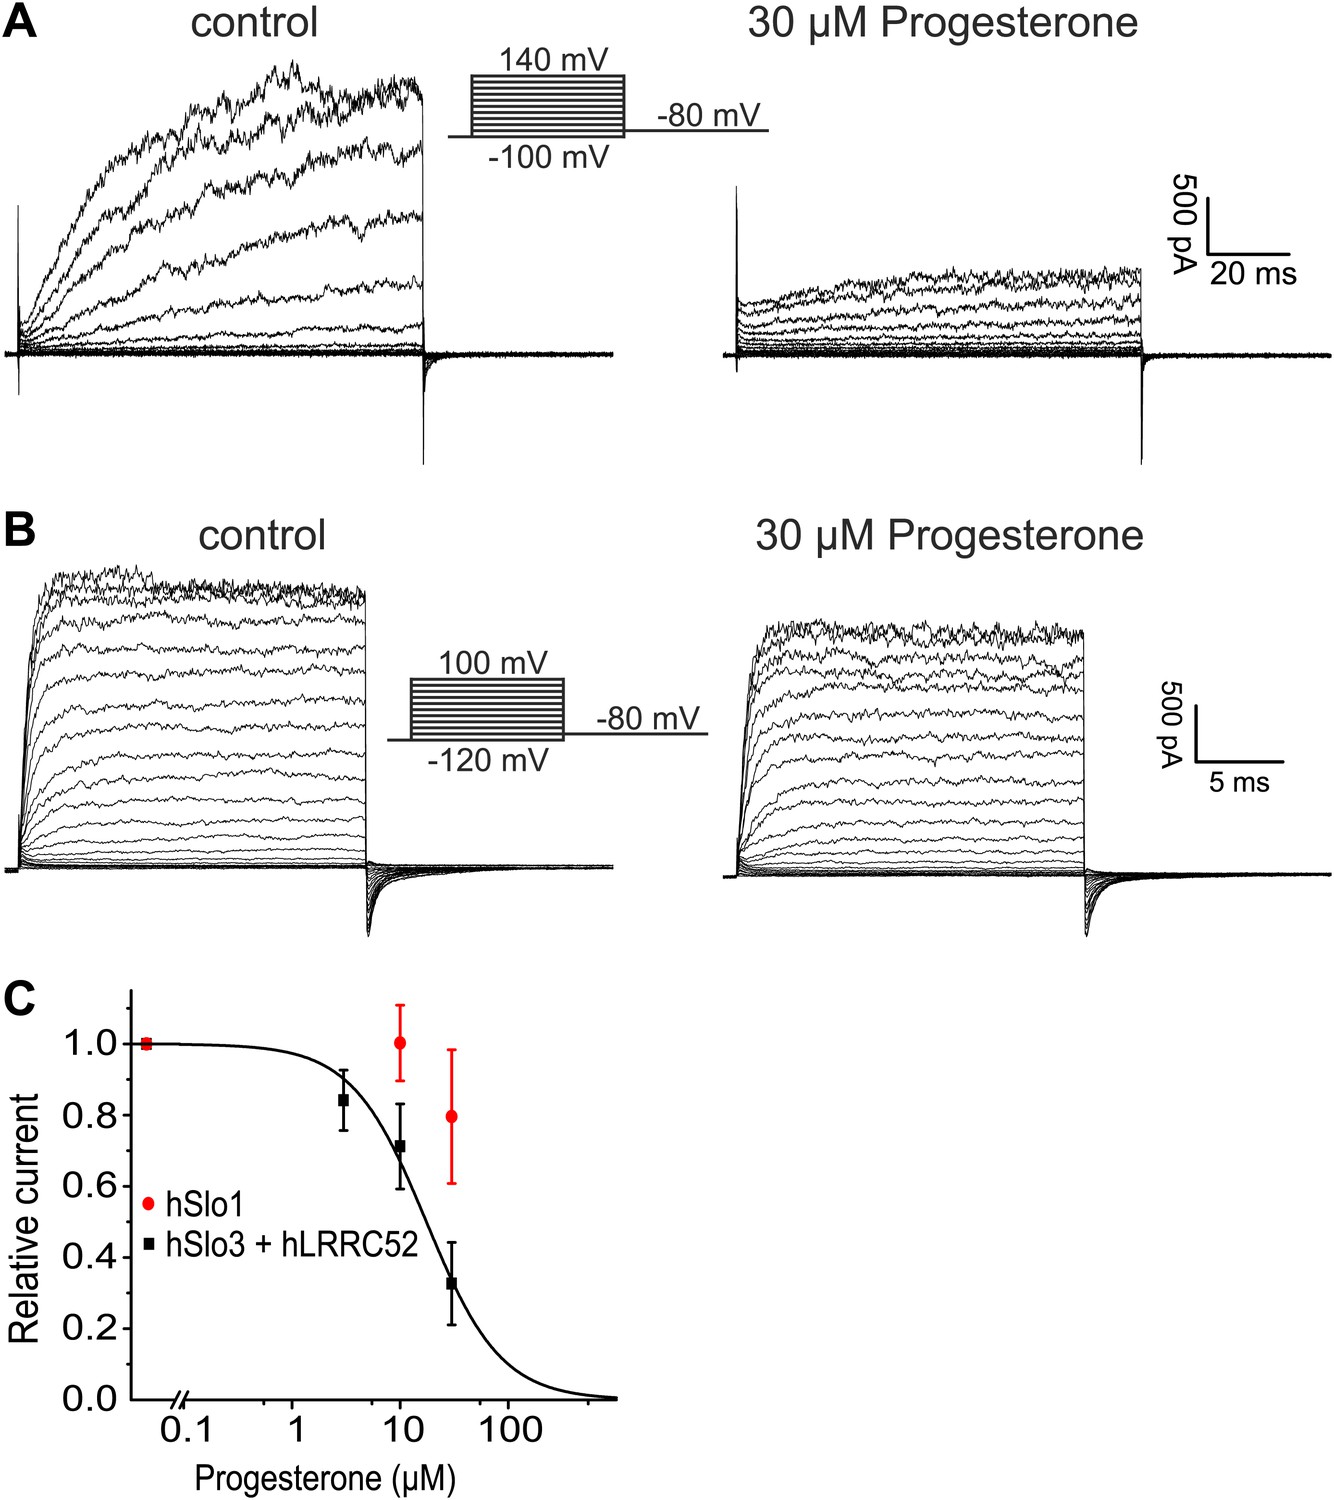
Progesterone inhibits hSlo3 but not hSlo1.
(A) Whole-cell hSlo3 + hLRRC52 currents recorded in CHO cells at pHi 7.3 before and after perfusion with 30 µM progesterone. (B) hSlo1 currents recorded in outside-out patches excised from CHO cells at pHi 7.3 and 70 µM [Ca2+]i before and after perfusion with 30 µM progesterone. (C) Relative amplitude of hSlo1 and hSlo3 + hLRRC52 currents at 80 mV in CHO cells in the presence of progesterone.
Figure 9—figure supplement 1
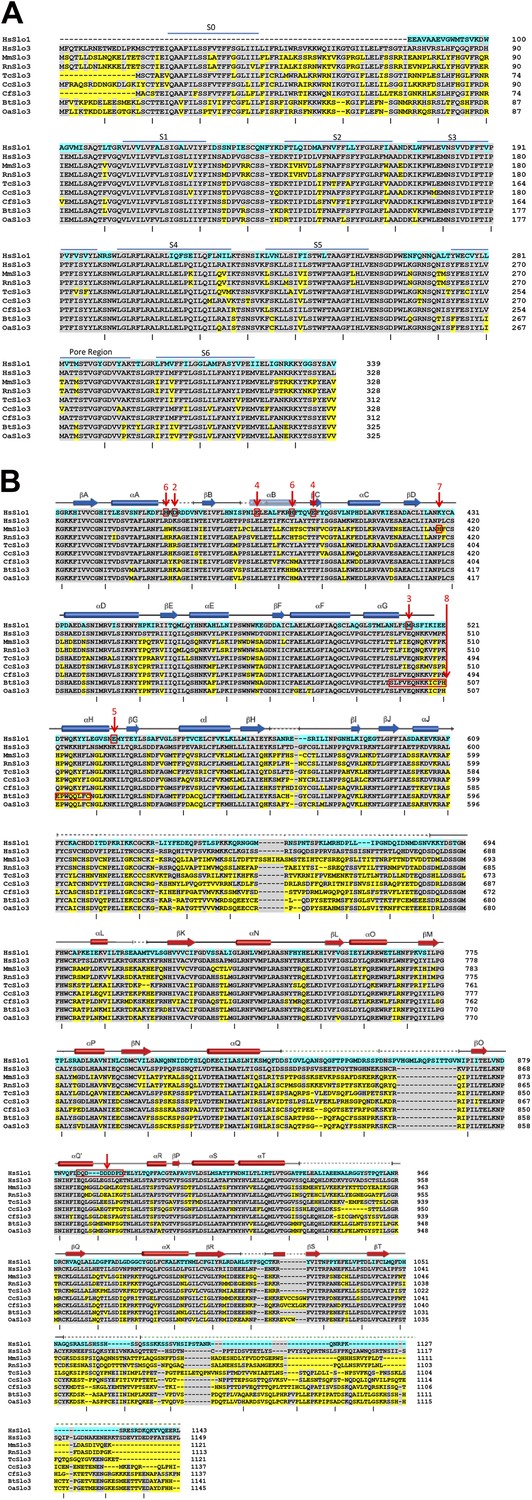
Lack of homology among Slo3 sequences in the ligand-sensing cytosolic domain.
(A) Alignments of human Slo1 and Slo3 from various species are shown for the membrane-associated, pore-forming part of the channels, indicating the relatively high extent of conservation through this part of the Slo3 protein. The Slo1 N-terminus is omitted to minimize effects of S0–S1 linker gaps on the alignment. Slo1 numbering starts from amino acids MDAL. Tick marks below each segment of residues counts every 10 residues in human Slo3. (B) Alignments of human Slo1 and Slo3 from various species are shown for the cytosolic gating ring domain beginning with the conserved sequence at the beginning of the first RCK domain. Blue highlights residue differences between human Slo1 and human Slo3. Yellow highlights differences of Slo3 of various species to human Slo3. Alignments were generated by Clustal 1.2.0 and minor adjustments were made based on structural considerations (Leonetti et al., 2012). Above the residues, the correspondence of particular amino acid segments to structurally defined α-helical and β-strand segments is shown based on Leonetti et al. (2012). In red, residues or segments identified in Slo1 or Slo3 isoforms which are implicated in ligand-sensing or species-specific functional differences are highlighted. Although extensive information is available regarding loci important in ligand-sensing in Slo1, such information for Slo3 remains lacking. Numbers identify the following: 1, the sequence of residues termed the Ca2+ bowl (Schreiber and Salkoff, 1997), for which there is good correspondence of mutations affecting Ca2+-dependent function (Bao et al., 2004) and coordination of density in a crystal structure (Yuan et al., 2012); 2, the D367 residue implicated in the role of the RCK1 domain in Ca2+-dependent activation (Xia et al., 2002) which is clearly distinct from Ca2+-bowl dependent activation (Zeng et al., 2005); 3, the M513 residue, which also affects Ca2+−dependent activation involving the RCK1 domain (Bao et al., 2002), but probably is not involved in ligand coordination; 4, residues E374 and E399 which have been implicated in low affinity effects of divalent cations, specifically Mg2+ (Shi et al., 2002; Xia et al., 2002; Yang et al., 2006); 5, residue E535 which may also be involved in Ca2+ coordination in RCK1 (Zhang et al., 2010); 6, residues H365 and H394, which have been implicated in proton-dependent activation of Slo1 and also influence Ca2+-dependent activation when protonated (Hou et al., 2008); 7, H417 and segment 368–475, which influence pH-sensing in mouse Slo3 (Zhang et al., 2006); 8, segment 495–515 in bovine Slo3 which accounts for part of the different in functional properties between mouse Slo3 and bovine Slo3 (Santi et al., 2009). Illustrated sequences and accession numbers include: HsSlo1 (Homo sapiens), NP_001154824, Gene ID 3778; HsSlo3 (Homo sapiens), NP_001027006, Gene ID 157855; MmSlo3 (Mus musculus), NP_032458, Gene ID 16532; RnSlo3 (Rattus norvegicus), XP_006253398, Gene ID 680912; TcSlo3 (Tupaia chinensis, Chinese tree shrew), XP_006171561, Gene ID 102493286; CcSlo3 (Condylura cristata, star-nosed mole), XP_004682520, Gene ID 101620543; CfSlo3 (Canis lupus familiaris), XP_539971, Gene ID 482856; BtSlo3 (Bos taurus), NP_001156721, Gene ID 524144; OaSlo3 (Ovis aries, sheep), XP_004021821, Gene ID 10110209.
Author response image 1
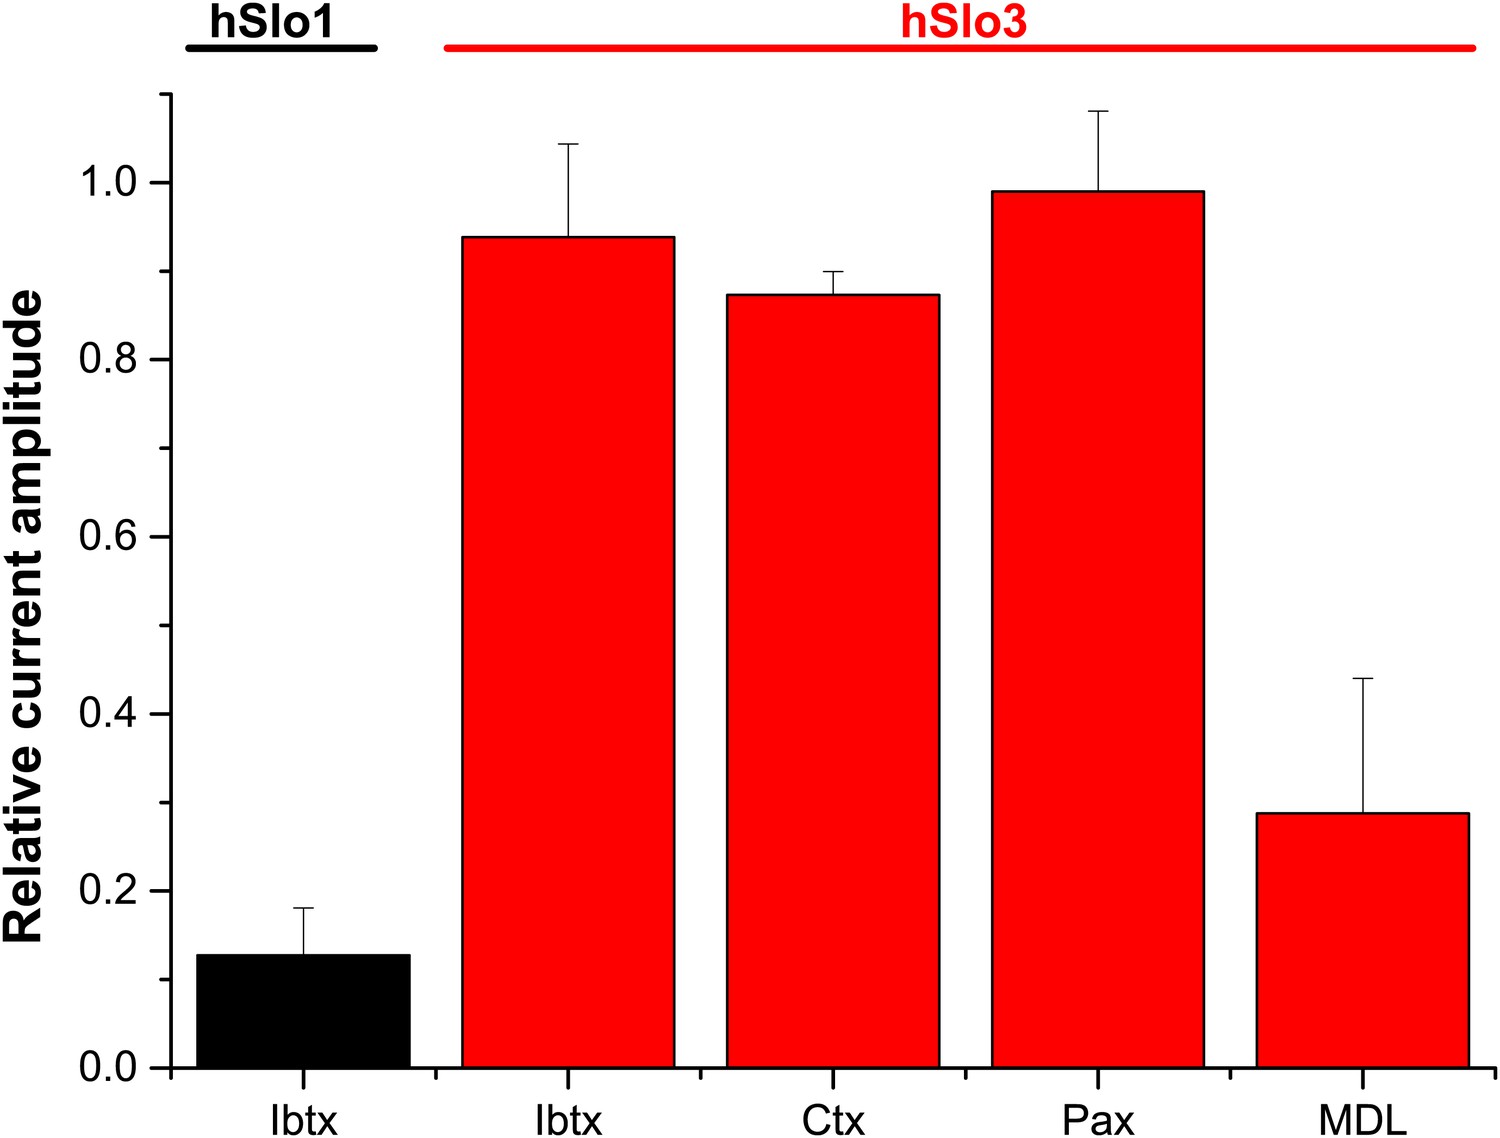
Relative amplitude of hSlo1 (at 80 mV) before and after superfusion with IBTX (100 nM). Relative amplitude of hSlo3 + hLRRC52 currents (at 80 mV) before and after superfusion with IBTX (100 nM), CTX (1 μM), or Paxilline (100 nM). hSlo1 and hSlo3 + hLRRC52 were expressed in CHO cells.
Additional files
-
Supplementary file 1
Indicators of merit for the mass spectrometric results.
- https://doi.org/10.7554/eLife.01438.020
Download links
A two-part list of links to download the article, or parts of the article, in various formats.
Downloads (link to download the article as PDF)
Open citations (links to open the citations from this article in various online reference manager services)
Cite this article (links to download the citations from this article in formats compatible with various reference manager tools)
The Ca2+-activated K+ current of human sperm is mediated by Slo3
eLife 3:e01438.
https://doi.org/10.7554/eLife.01438


