Modes of flagellar assembly in Chlamydomonas reinhardtii and Trypanosoma brucei
- University of Oxford, United Kingdom
- University of Colorado Boulder, United States
Figures
Figure 1 with 1 supplement
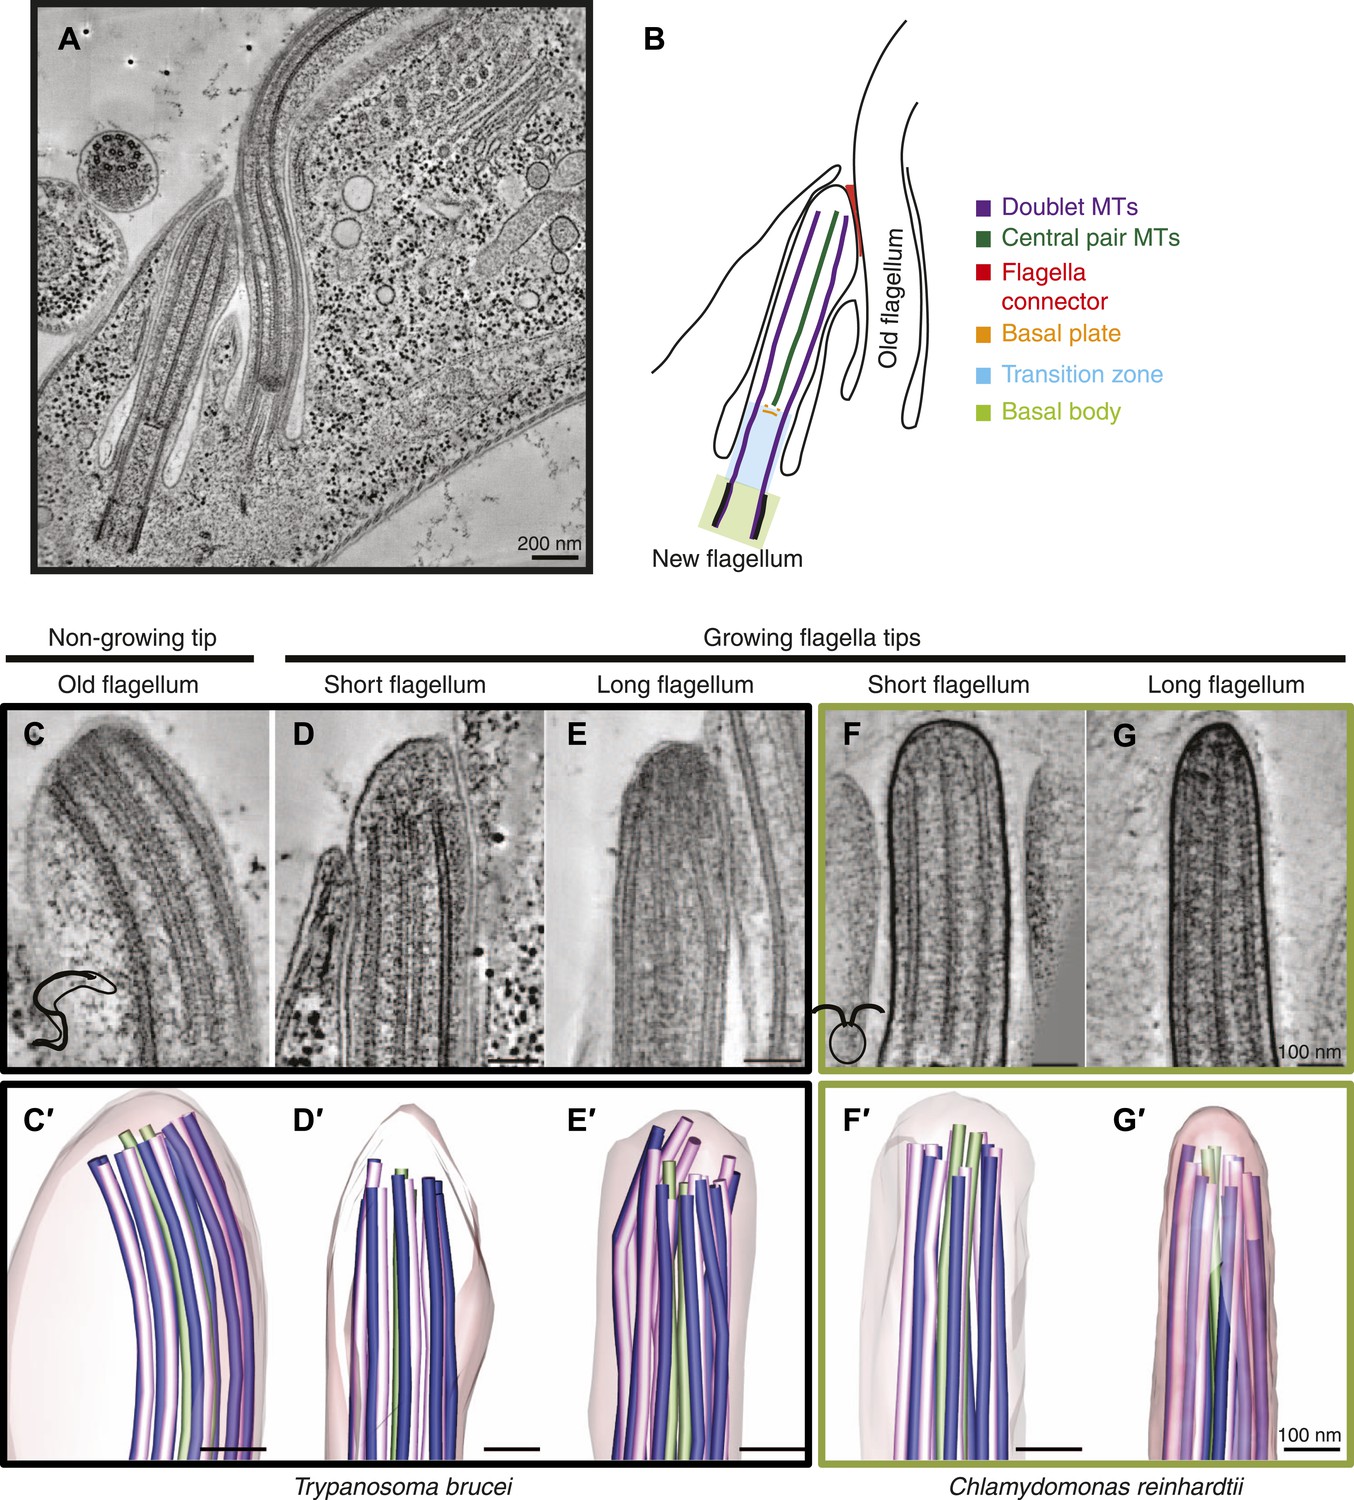
Microtubule organization at the distal tip of the flagellum varies in different cell cycle stages and species.
(A) A 20 nm tomographic slice showing a new T. brucei flagellum attached to the old flagellum. (B) A schematic of the picture in A describing the relevant regions of the flagellum. (C–G) Tomographic slices (20 nm thick) showing distal tips of flagella in different stages of the cell cycle. (C) T. brucei old flagellum, (D) T. brucei short flagellum, (E) T. brucei long flagellum, (F) C. reinhardtii short flagellum, and (G) C. reinhardtii long flagellum. (C′–G′) 3D models of flagella in the same cell cycle stage as in C–G, showing the axoneme with A-tubules in pink, B-tubules in dark blue and central pair in green. Flagellar membrane is shown in transparent pink.
Figure 1—figure supplement 1
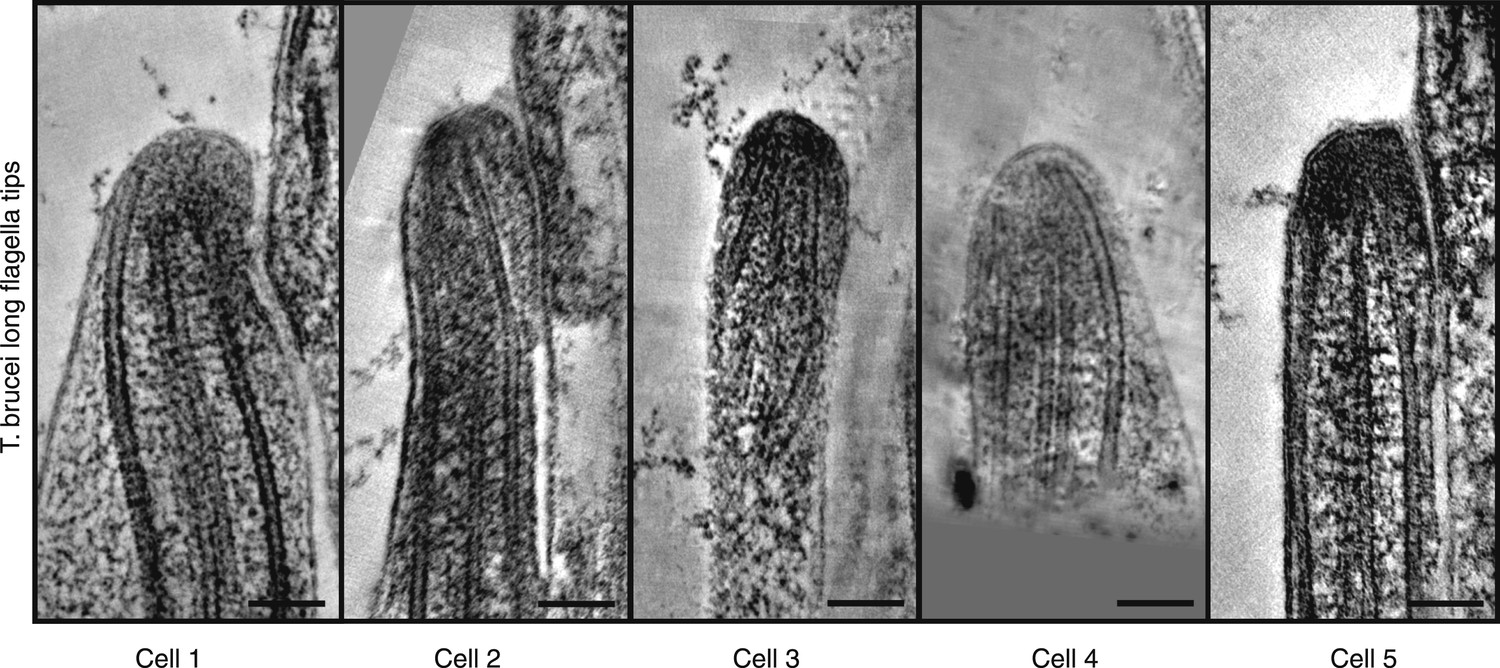
Gallery of long growing T. brucei tips, all showing disordered axonemes (20 nm thick tomography slices).
https://doi.org/10.7554/eLife.01479.004
Figure 2
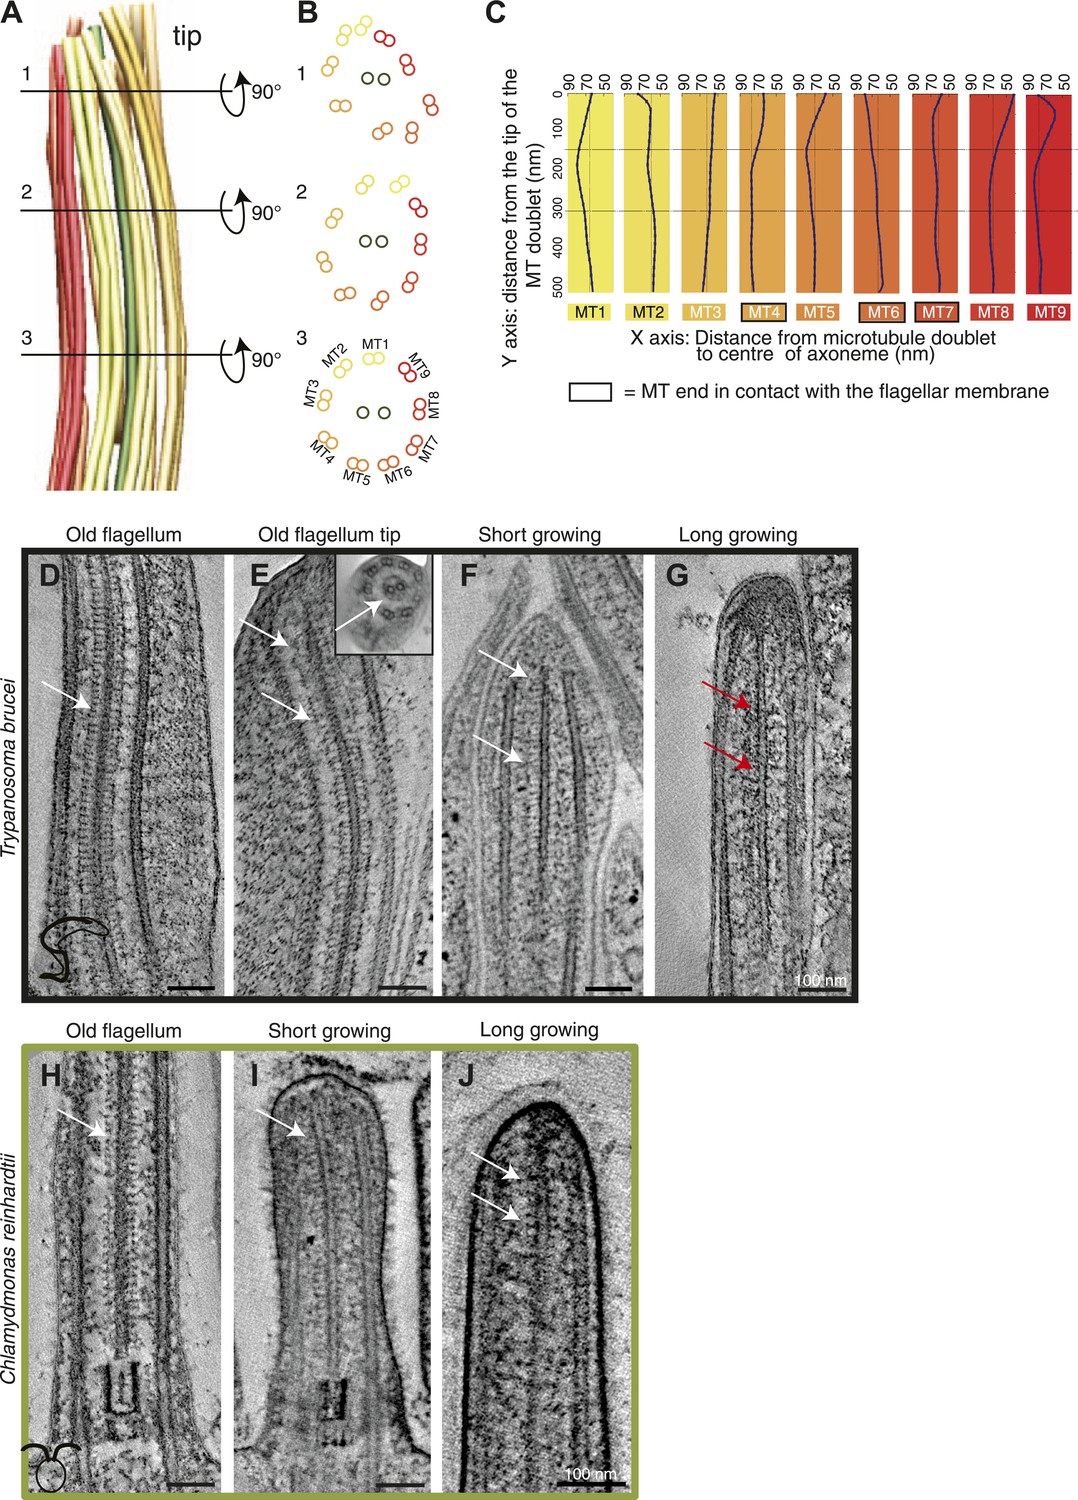
Structural disorganization in the growing tips of long T. brucei flagella.
(A) 3D model of a tomographic reconstruction of a growing, long T. brucei axoneme. The doublets are color coded in a gradient from yellow (dMT1) to red (dMT9). (B) A cut through of the 3D model shows that (1) at the end of the flagellum, the circular arrangement of the MTs is completely lost, (2) <0.5 μm before the flagella tip, the MTs start losing their circular organization, and (3) >0.5 μm from its tip the axoneme is well organized. (C) Individual traces of the nine dMTs in A reveals them bending both toward and away from the CP. dMTs not touching the membrane also showed this random bending (e.g., dMTs 2 and 5) (D) CP projections are arranged as an electron-dense ladder (arrows) extending from the central pair. (E) In the tip of the T. brucei old flagellum the associated structural proteins are visible all the way to the tip. In the longitudinal view, we see the distal end that then curves and the final 200 nm is shown in cross-sectional view (insert). (F) Central pair projections are clearly seen all the way to the end of the central pair in the short growing T. brucei flagellum. (G) In the T. brucei long growing flagellum such associated proteins are not visible (red arrows). (H) The structural proteins are clearly visible along the length of a mature C. reinhardtii flagellum. (I and J) In the growing short C. reinhardtii flagellum, these proteins were also present at the axoneme’s tip, indicating that microtubules and associated structures are simultaneously assembled.
Figure 3 with 1 supplement

No singlet zone in any of the samples examined.
(A) The distance between the dMTs/CP MT plus ends and the closest flagellar tip membrane was measured in flagella of each cell cycle stage/species. These properties are represented here as box plots in which the mean value is identified by a dotted horizontal line, the median value by a line, the 25–75% percentile by the height of the box, and the horizontal bars outside the box include the 5th and the 95th percentile. Only in T. brucei long new flagellum (LNF) were the microtubules touching the membrane, but in all samples all MT ends were closer than 230 nm to the membrane. (number above box = n) (B) To determine if dMTs or CP microtubules extended the furthest within the axoneme, all microtubule plus end’s distance to the longest microtubule in the axoneme was measured. (*) In T. brucei LNF, the CPs was lagging behind the dMT extension, and in C. reinhardtii CPs extended further than the dMTs. (C) The extension of the A- or B-tubule within the doublet was measured. The A-tubule did not always extend the furthest. (D) The difference of extension between the A- and B-tubule in a dMT is merely 10–20 nm in both species.
Figure 3—figure supplement 1
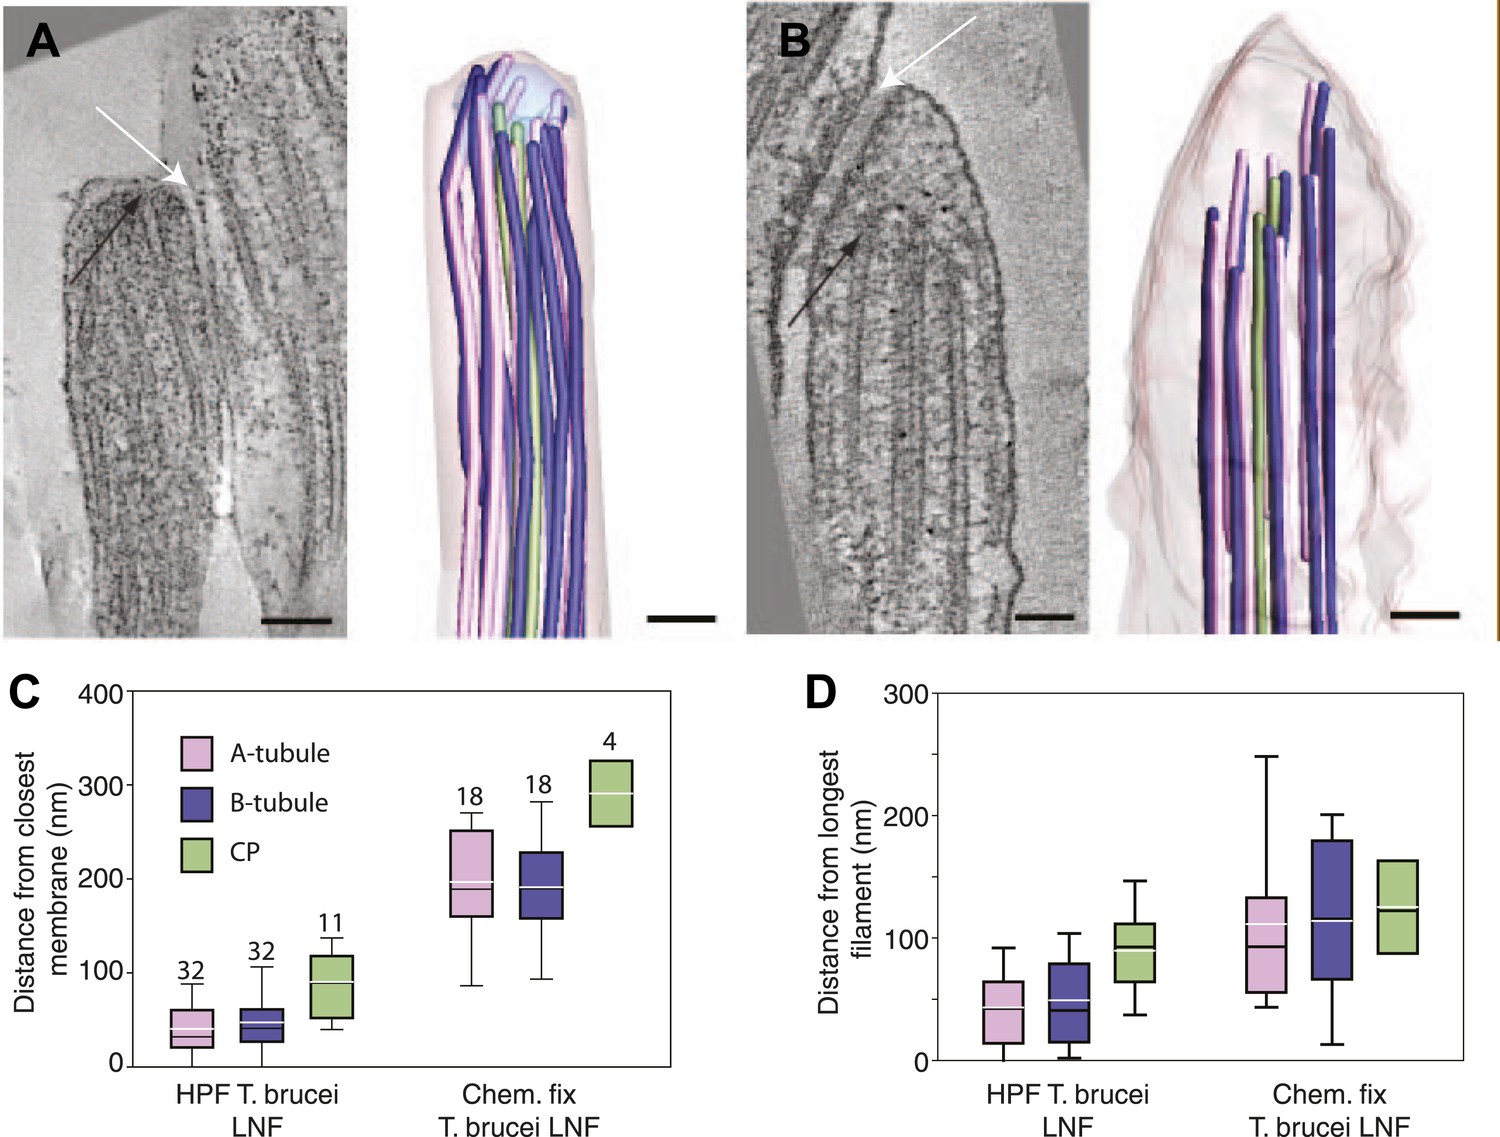
Chemical fixation increased the distance between the flagellar tip membrane and the microtubule plus ends.
(A) A tomographic slice and the belonging 3D model of a high pressure frozen and freeze substituted long new flagellum tip in T. brucei. (B) A tomographic slice and the corresponding 3D model of a chemically fixed long new flagellum tip in T. brucei. Note that the membrane is in a similar place in comparison to the flagellar connector as seen in A (white arrows). Black arrows show the distal microtubule ends. The stable position of the flagellum tip membrane in relation to the FC in both sample preparations indicates that the distance increase between the axoneme and the membrane is due to microtubule depolymerization. (C) Quantification of distances between CPs and dMTs to the tip membrane. Numbers over the boxes are the amount of MTs measured. (D) The distribution of microtubule plus-ends within the axoneme show a much wider range in chemically fixed samples. This explains why the T. brucei new flagellum tip has been shown to lack some dMTs in previous studies e.g., Briggs (2004).
Figure 4
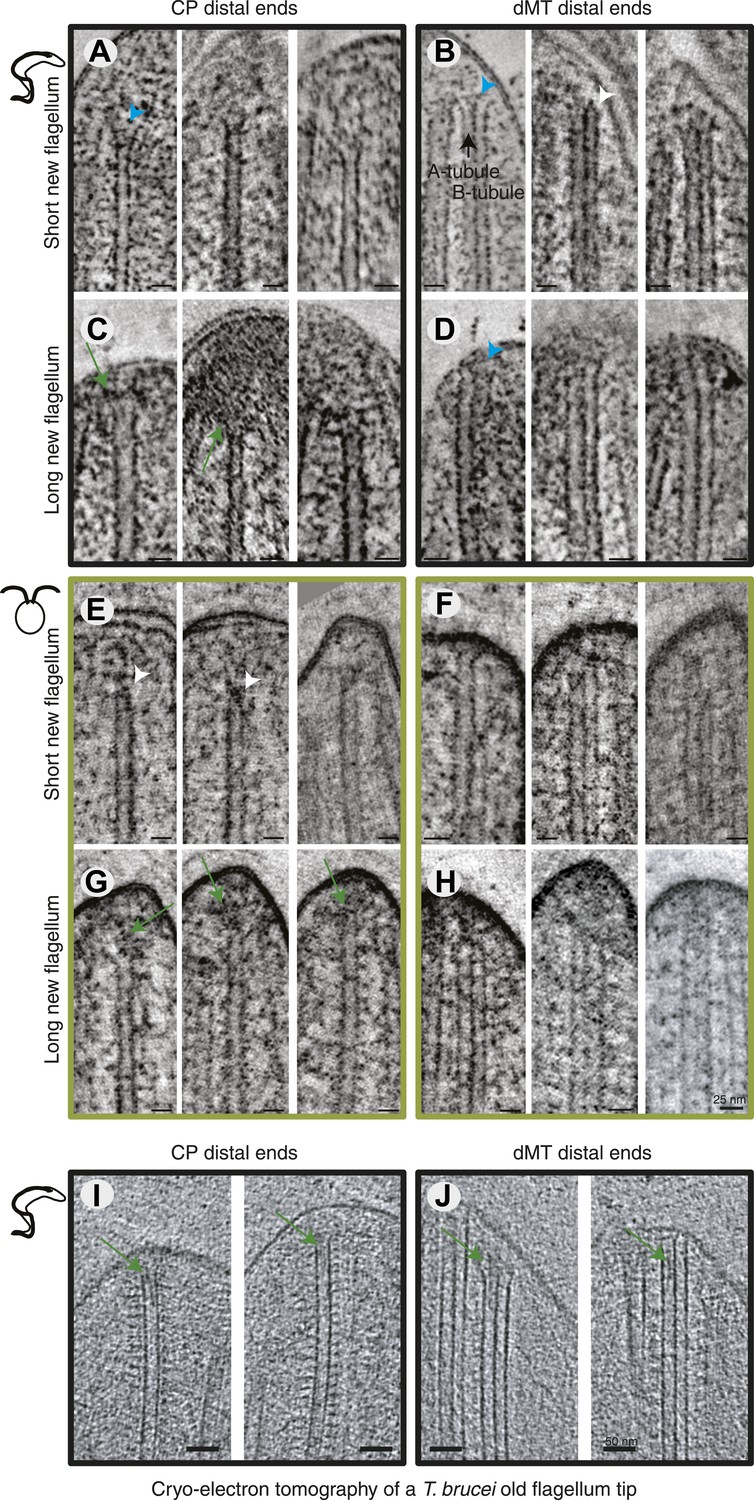
All axoneme microtubule plus ends are found close to the tip membrane.
4-nm thick slices of tomograms from (A and B) T. brucei short new flagellum, (C and D) T. brucei long new flagellum, (E and F) C. reinhardtii short new flagellum, and (G and H) C. reinhardtii long new flagellum. In the left column CP distal ends are shown and the right column, dMT plus ends. dMTs are always displayed with the A-tubule to the left. Examples of flared ends are marked with turquoise arrowhead and capped ends with white arrowheads. Electron-dense structures associated with the C. reinhardtii and T. brucei CPs in long new flagella are marked by green arrows. (I and J) 15-nm thick cryo-electron tomography sections of (I) CP and (J) dMTs at the old T. brucei flagellum tip. Note the electron density extending into the lumen of both CP MTs and into the A-tubule lumen in the dMTs.
Figure 5 with 1 supplement
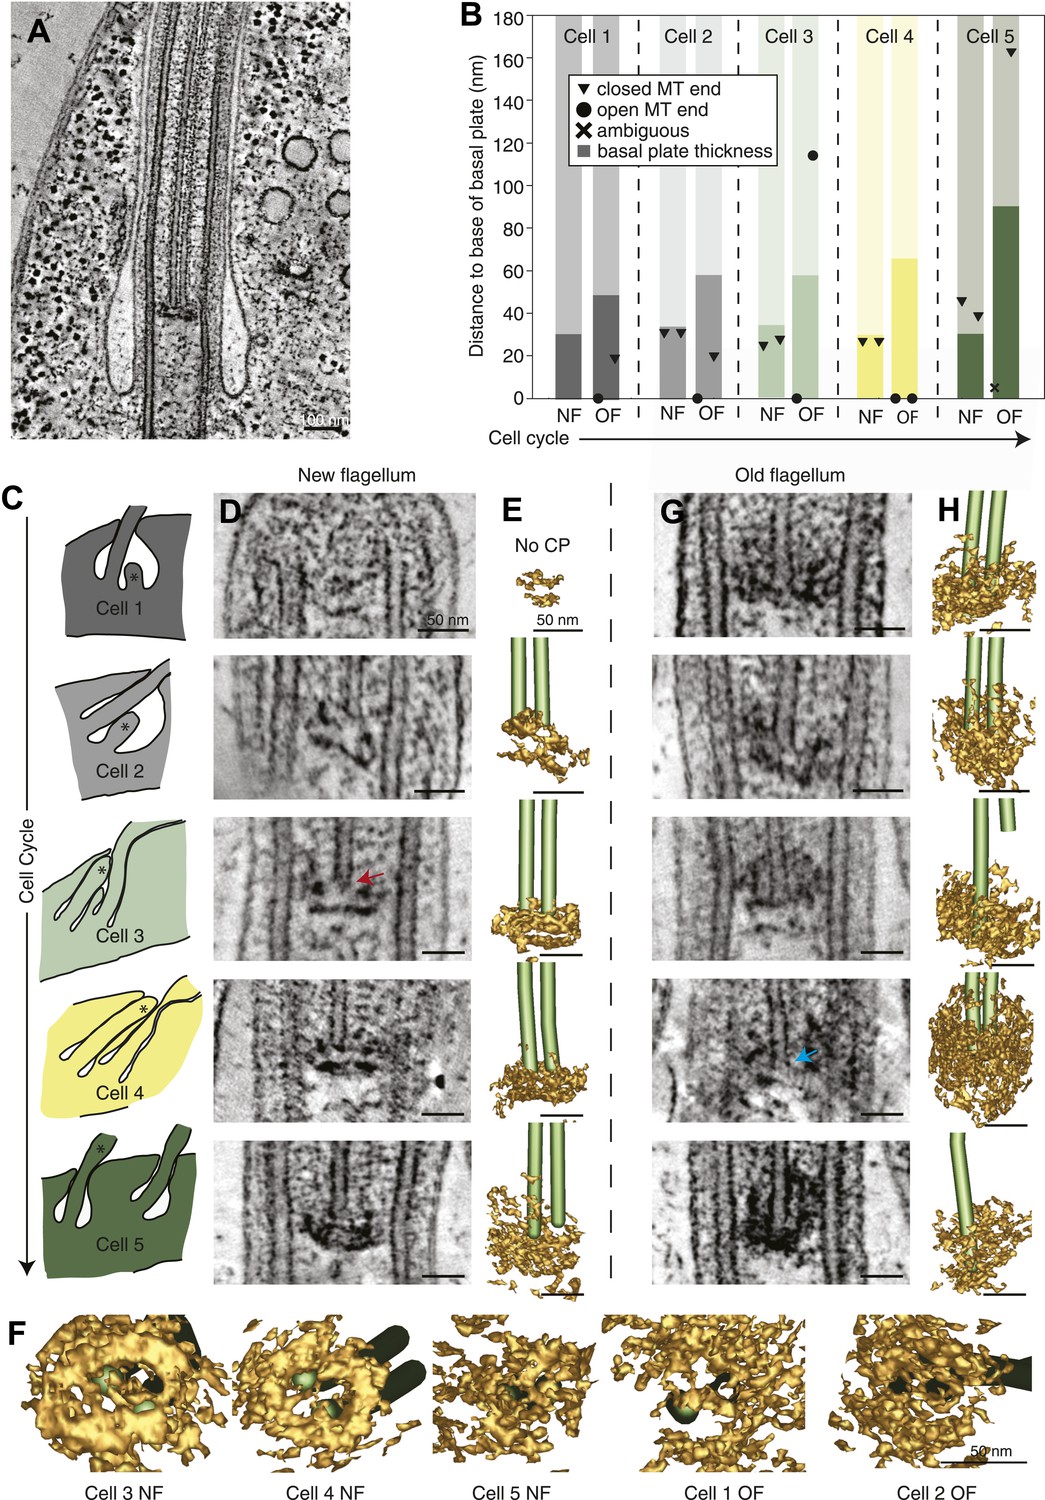
The T. brucei basal plate matures and alters its association with the CP minus ends during the cell cycle.
(A) A 20 nm thick tomographic slice showing the new flagellum (NF) basal plate region. (B) The exact thickness of the basal plates and the locations and structure of the CP minus ends within/around them. The new flagellum in Cell1 is so short that no CP microtubules have started to grow yet. (C) The length of the new flagellum (marked with *) reveals the cell’s position in the cell cycle; The cell earliest in the cell cycle displaying a short new flagellum (top of Figure) and the most mature cell with two flagella in individual flagellar pockets at the bottom. The cartoons to the left show outlines of the flagellar pocket region in the cells studied, the cartoons are oriented so that the anterior end of the cell points to the right. (D) 10-nm thick tomographic slices of the new flagella showing the bilayered electron-dense material forming the basal plates, with the capped minus end (e.g., turquoise arrow) of one of the CP MTs nucleated on the proximal surface. Cell 1 has such a short flagellum that no CPs has grown yet, but an early basal plate is evident. (E) The CP MTs were modeled and the basal plates visualized using electron density thresholding. The bi-layered structure of the basal plate is clearly visible until cell 4, where the two flagella have separated into two separate flagellar pockets in preparation for cell division. (F) A selection of the models displayed in D and F show how the basal plate is formed of two stacked rings early in the cell cycle, which is then lost as the flagellum matures. (G) The tomographic slices of basal plates in the old flagella (OF) of the same cell as the new flagellum shown to the left. The bilayered structure is mostly lost, the basal plate is longer and the CP microtubule now has an open end (e.g., red arrow) i.e. inserted further into the basal plate. (H) The 3D models of the basal plate region in the old flagella reveal amorphous structures that sometimes only anchor one CP MT (cell 3 and 5).
Figure 5—figure supplement 1
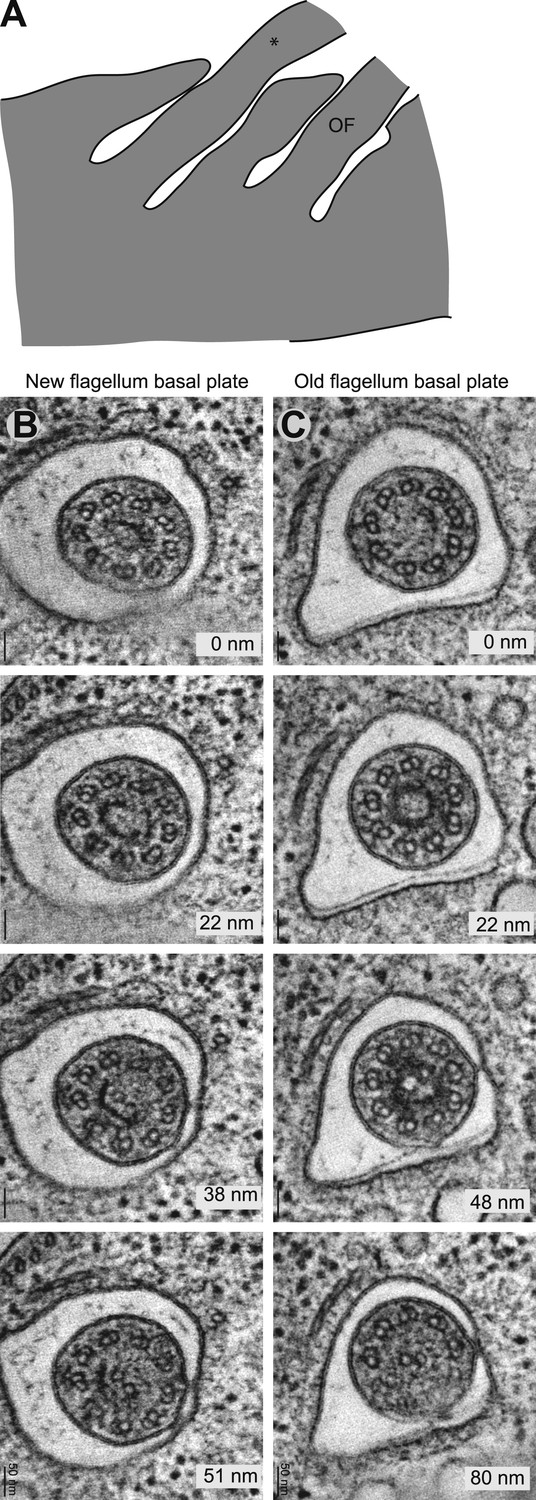
The ring structure of the new flagellum basal plate in T. brucei.
(A) A cartoon of the cell that is imaged in B. It has two flagella in separated pockets, meaning that the new flagellum (marked with an *) already is long. (B) Cross-sectional views (slices from tomograms) of the basal plate region in both the old and the new flagellum. The number in the bottom right corner is the distance from the first image.
Figure 6
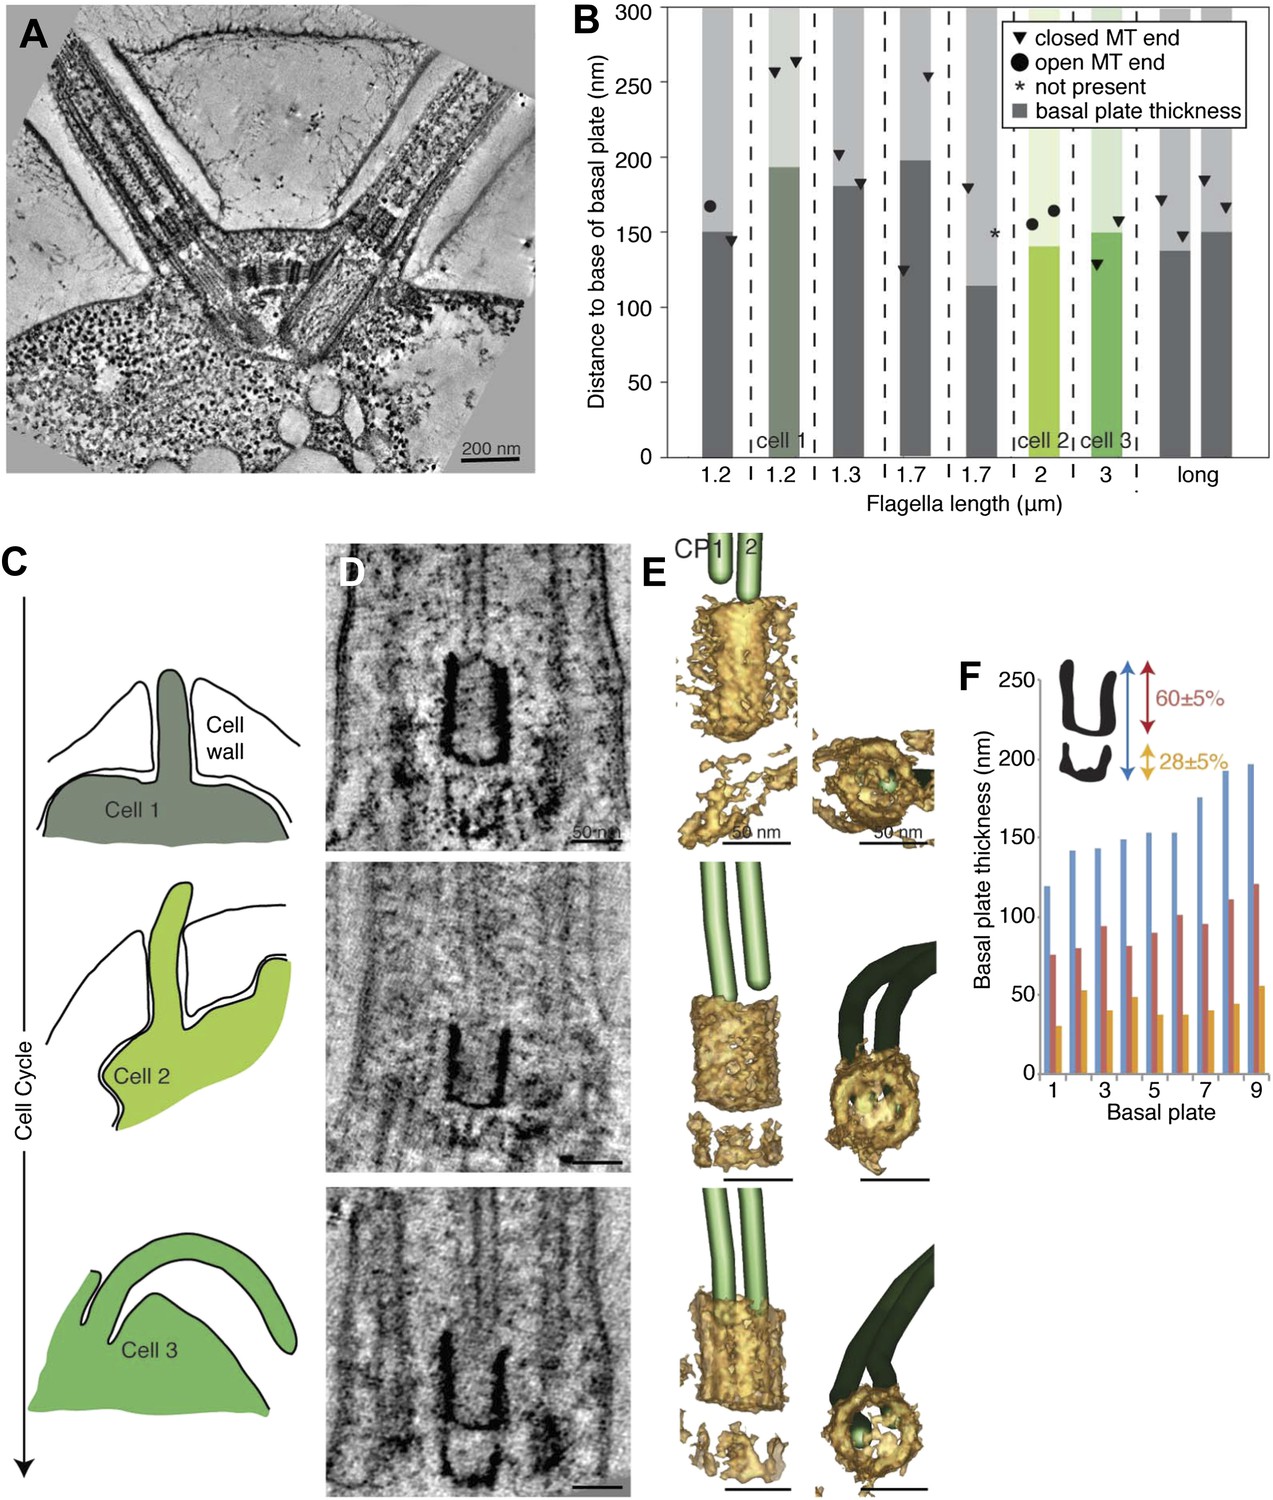
The transition zone in C. reinhardtii is structurally uniform during the cell cycle.
(A) A 20-nm thick tomographic slice showing the two flagella extending from the C. reinhardtii cell. (B) The exact thickness of the transition zone central tube structure and the locations and structure of the CP minus ends within/around them. Note that the thickness of the central tube does not correlate with the flagellar length. This graph includes both flagella that we know are growing, and flagella of unknown dynamic state. The three colored columns represent the measurements of central tubes found in cell 1, 2 and 3 in C–E. (C) The cartoons to the left show outlines of the cells visualized in 10-nm thick tomographic slices of transition zone (D) and (E) where their 3D models show that the central tube structure consists of two baskets. The top basket is almost complete and the bottom one is partial. (F) The nine central tubes are here arranged by size, and the contribution of the upper and lower basket to the thickness of the structure is displayed. Note that the proportions within the structure remain similar through out, with the upper basket contributing 60 ± 5%, and the lower basket 28 ± 5% of the total central tube thickness.
Figure 7
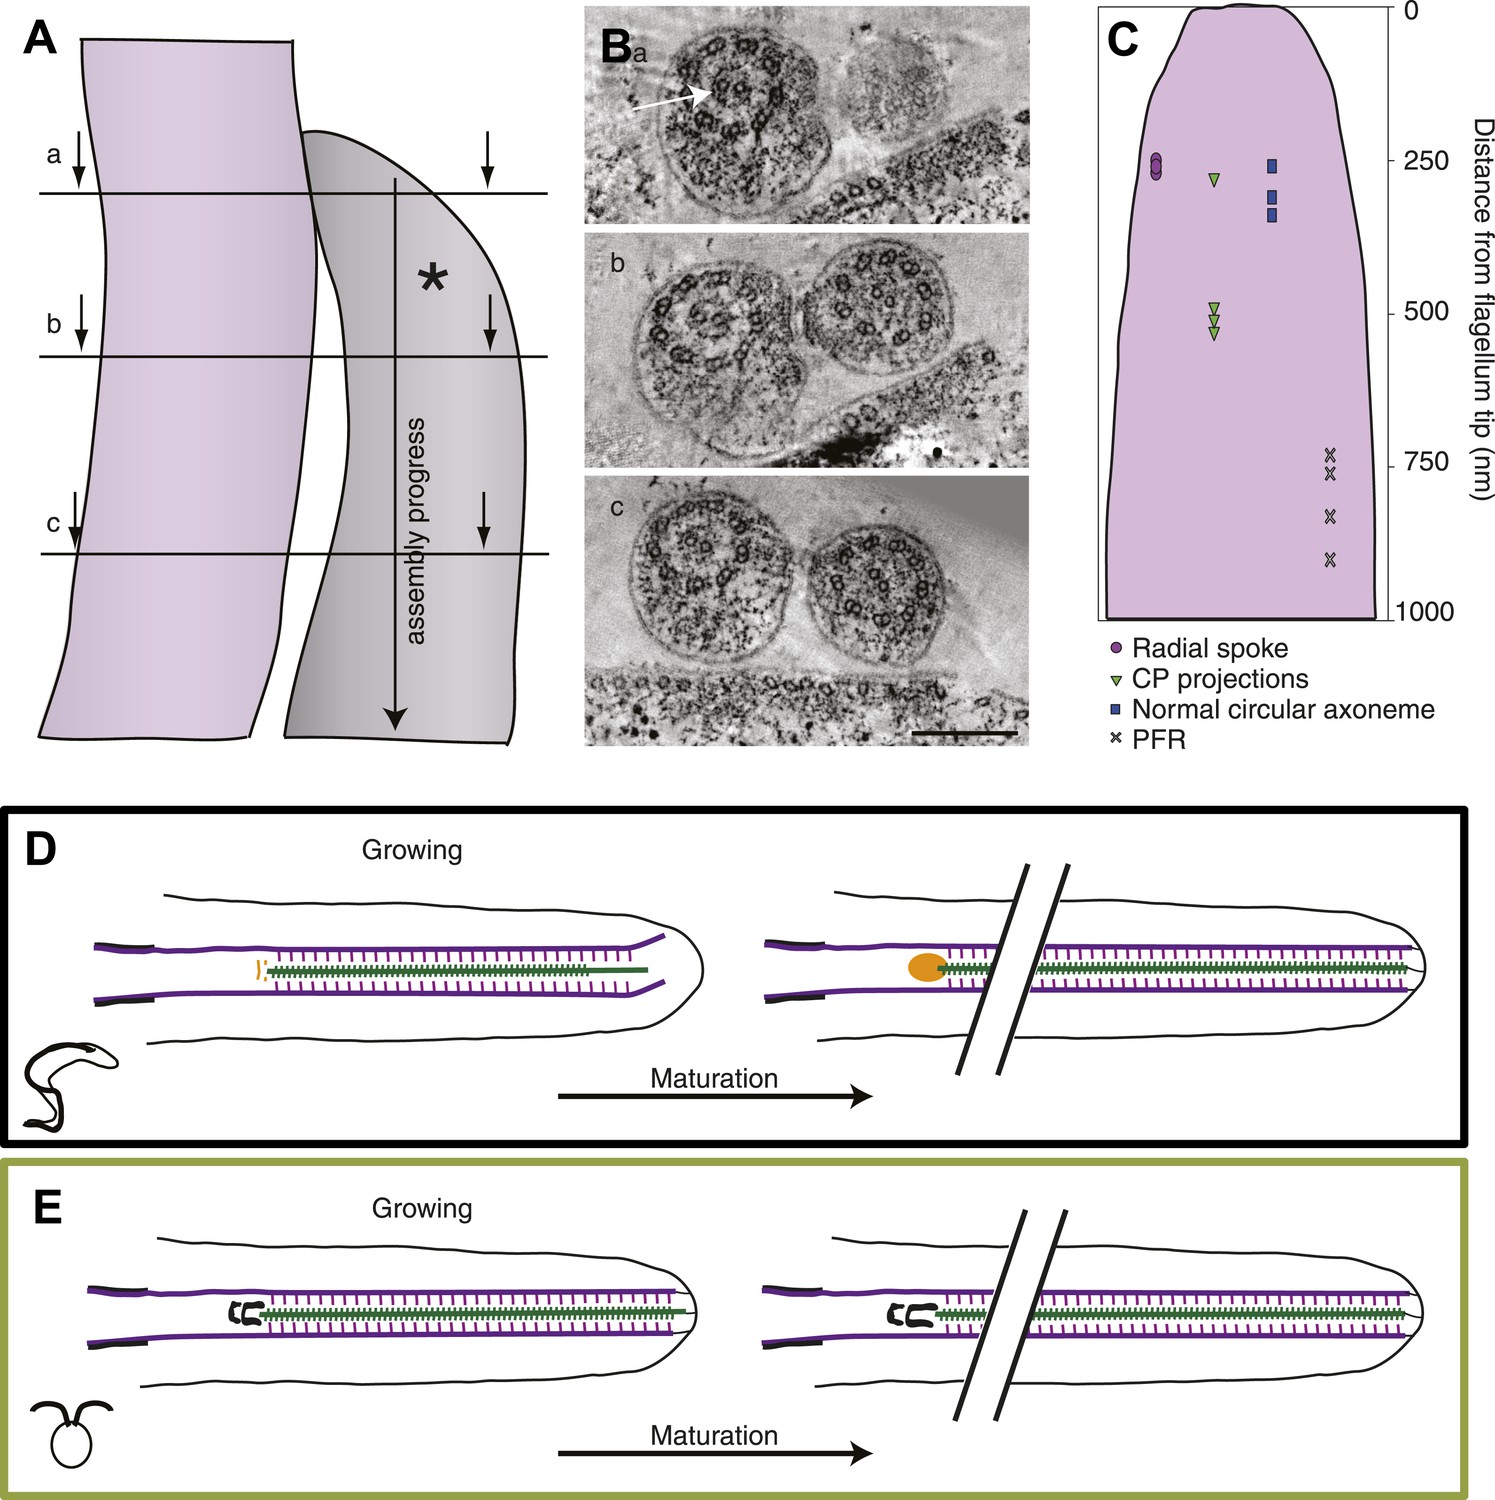
The axoneme is a timeline of flagellar assembly.
(A) Because the new flagellum (*) grows at its distal tip, the axoneme is older closer to the basal body. This spatial assembly progress is used to reveal the order of structural additions to the growing axoneme. (B) Cross-sectional views from a tomogram of T. brucei flagella (old flagellum to the left and the growing new flagellum to the right). In (A) the slice is taken close to the tip of the growing flagellum. Only a few doublet microtubules have extended to here. (B) 100 nm in to the flagellum, dMTs and CPs are present but arranged in abnormal angles to each other. (C) The axoneme starts appearing normal ∼250 nm into the axoneme. However, note the almost complete ring around the CPs in the old flagellum (arrow), most likely formed by central pair projections and/or heads of radial spokes. This ring is still not to be found in this most proximal tomographic slice taken. (C) Measurements of axonemal component incooperation was done in a multitude of cross-sectional and longitudinal flagella tip tomography reconstructions. (D) T. brucei flagellum grows in a disorganized manner probably due to a lack of associated axonemal proteins in the distal tip, this model is made to approximate where the components are added in comparison to the distal tip. As the flagellum matures (right), the axoneme is organized all the way to the tip and the basal plate has altered structure from the two rings to an electron-dense cloud. Electron-dense structures are visible from the lumen of the CP and A-tubule extending towards the membrane. (E) In C. reinhardtii, growth is organized with the CP protruding slightly at the tip of the axoneme. As the flagellum matures, the transition zone central tube extends but no morphological changes were seen.
Videos
Video 1
Old T. brucei flagellum tip (related to Figure 1).
1-nm thick sections of a tomogram reconstruction containing the distal tip. Scale bar = 50 nm.
Video 2
Growing short T. brucei flagellum tip (related to Figure 1).
1-nm thick sections of a tomogram reconstruction containing the distal tip. Please also note the just formed basal plate. Scale bar = 50 nm.
Video 3
Disordered long growing T. brucei flagellum tip (related to Figure 1).
1-nm thick sections of a tomogram reconstruction containing the distal tip. Note the bent doublet microtubules and the absence of electron-dense structures associated with the central pair. Scale bar = 50 nm.
Video 4
Short growing Chlamydomonas reinhardtii flagellum tip (related to Figure 1).
Scale bar = 50 nm.
Video 5
Long growing Chlamydomonas reinhardtii flagellum tip (related to Figure 1).
Scale bar = 50 nm.
Video 6
3D model of the microtubules found in an old T. brucei flagellum tip (related to Figure 1).
Model was made by drawing lines in the microtubules and around membranes as seen in a tomogram reconstruction of the old T. brucei flagellum tip (Video 1). The lines were then provided with a skin through a meshing process. Scale bar = 50 nm.
Video 7
3D model of the microtubules found in a short growing T. brucei flagellum tip (related to Figure 1).
Model is a segmentation from the tomogram, Video 2. The tomogram reconstruction contained the most of the flagellum tip, but cropped off some the axoneme shortly proximal to it and one dMT was not found within the reconstruction (missing in the model). Scale bar = 50 nm.
Video 8
3D model of the disordered microtubules found in a growing T. brucei flagellum tip (related to Figure 1).
Note that some doublet microtubules are in contact with the flagella membrane. Scale bar = 50 nm.
Video 9
3D model of a short growing C. reinhardtii flagellum (related to Figure 1).
Scale bar = 50 nm.
Video 10
3D model of a long growing C. reinhardtii flagellum (related to Figure 1).
Scale bar = 50 nm.
Video 11
The basal plate in a new T. brucei flagellum (related to Figure 5).
The basal plate has been modeled by density thresholding and is displayed in brown. The CP is modeled as all MTs but also show their capped minus ends. Scale bar = 50 nm.
Video 12
The basal plate of an old T. brucei flagellum (related to Figure 5).
The basal plate has been modeled by density thresholding and is displayed in brown. The CP is modeled and show one capped and one open minus end. Scale bar = 50 nm.
Video 13
The central cylinder in the C. reinhardtii transition zone (related to Figure 6).
Central cylinder is modeled in brown, the CP in green. Both minus ends are capped. Scale bar = 50 nm.
Tables
Table 1
Sample size of each species/cell cycle stage
| Flagellum type | N (flagella tips reconstructed) | |
|---|---|---|
| T. brucei | Old | 6 |
| Short | 5 | |
| Long HPF | 10 | |
| Long chemical fixed | 2 | |
| C. reinhardtii | Short | 4 |
| Long | 4 |
Table 2
Distances between the axonemal microtubules and the flagellar membrane
| Flagellum type | N (A/B-tubule and CPs) | Average MT-membrane distance (nm) | Range: MT-membrane distance (nm) | |
|---|---|---|---|---|
| T. brucei | Old | 48 | 26 ± 9 | 9–54 |
| Short | 54 | 94 ± 27 | 35–160 | |
| Long | 47 | 50 ± 37 | 0–157 | |
| C. reinhardtii | Short | 60 | 77 ± 32 | 33–214 |
| Long | 60 | 97 ± 47 | 42–230 |
Table 3
Statistics on the microtubule extension within the axoneme
| Flagellum type | dMT/Cp extension difference | Paired t test | n (axonemes) | A-B tubule extension Difference | Paired t test | N (MTs) | |
|---|---|---|---|---|---|---|---|
| T. brucei | Old | No | 0.24 | 2 | No | 0.63 | 23 |
| Short | No | 0.81 | 3 | No | 0.73 | 24 | |
| Long | Yes | 0.01 | 6 | No | 0.12 | 36 | |
| C. reinhardtii | Short | No | 0.28 | 3 | No | 0.14 | 28 |
| Long | Yes | 0.01 | 4 | No | 0.51 | 36 |
Download links
A two-part list of links to download the article, or parts of the article, in various formats.
Downloads (link to download the article as PDF)
Open citations (links to open the citations from this article in various online reference manager services)
Cite this article (links to download the citations from this article in formats compatible with various reference manager tools)
Modes of flagellar assembly in Chlamydomonas reinhardtii and Trypanosoma brucei
eLife 3:e01479.
https://doi.org/10.7554/eLife.01479


