Hdac6 regulates Tip60-p400 function in stem cells
- University of Massachusetts Medical School, United States
- University of New Hampshire, United States
Figures
Figure 1 with 5 supplements
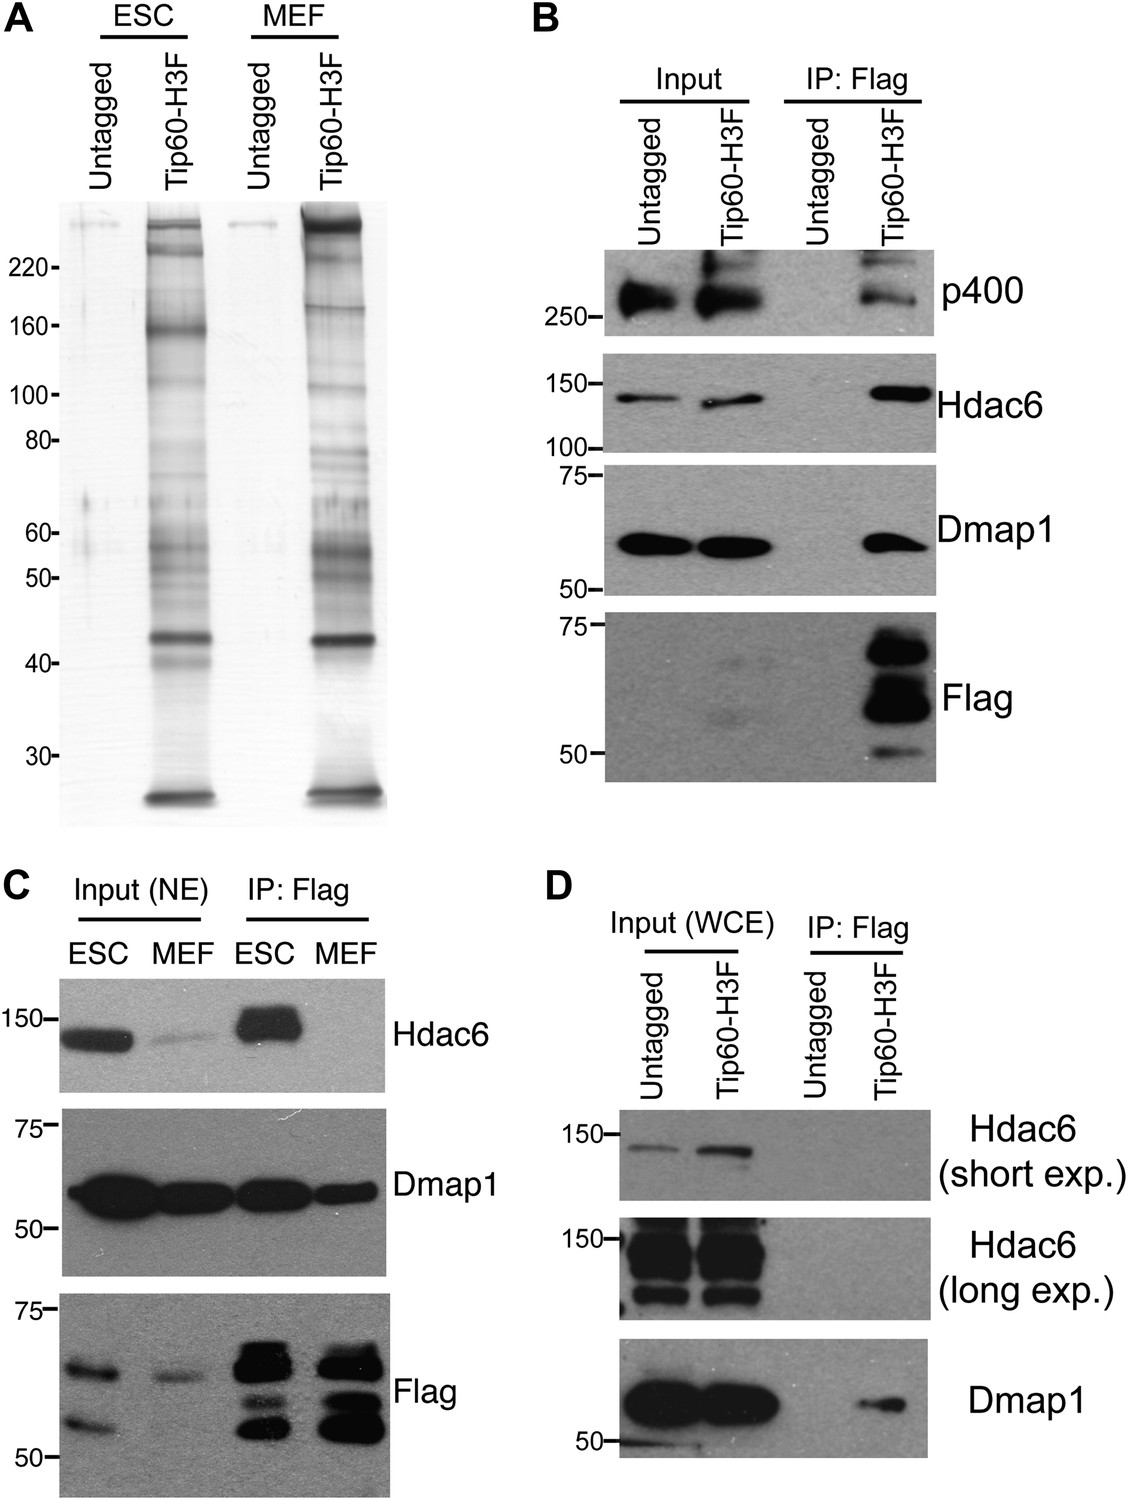
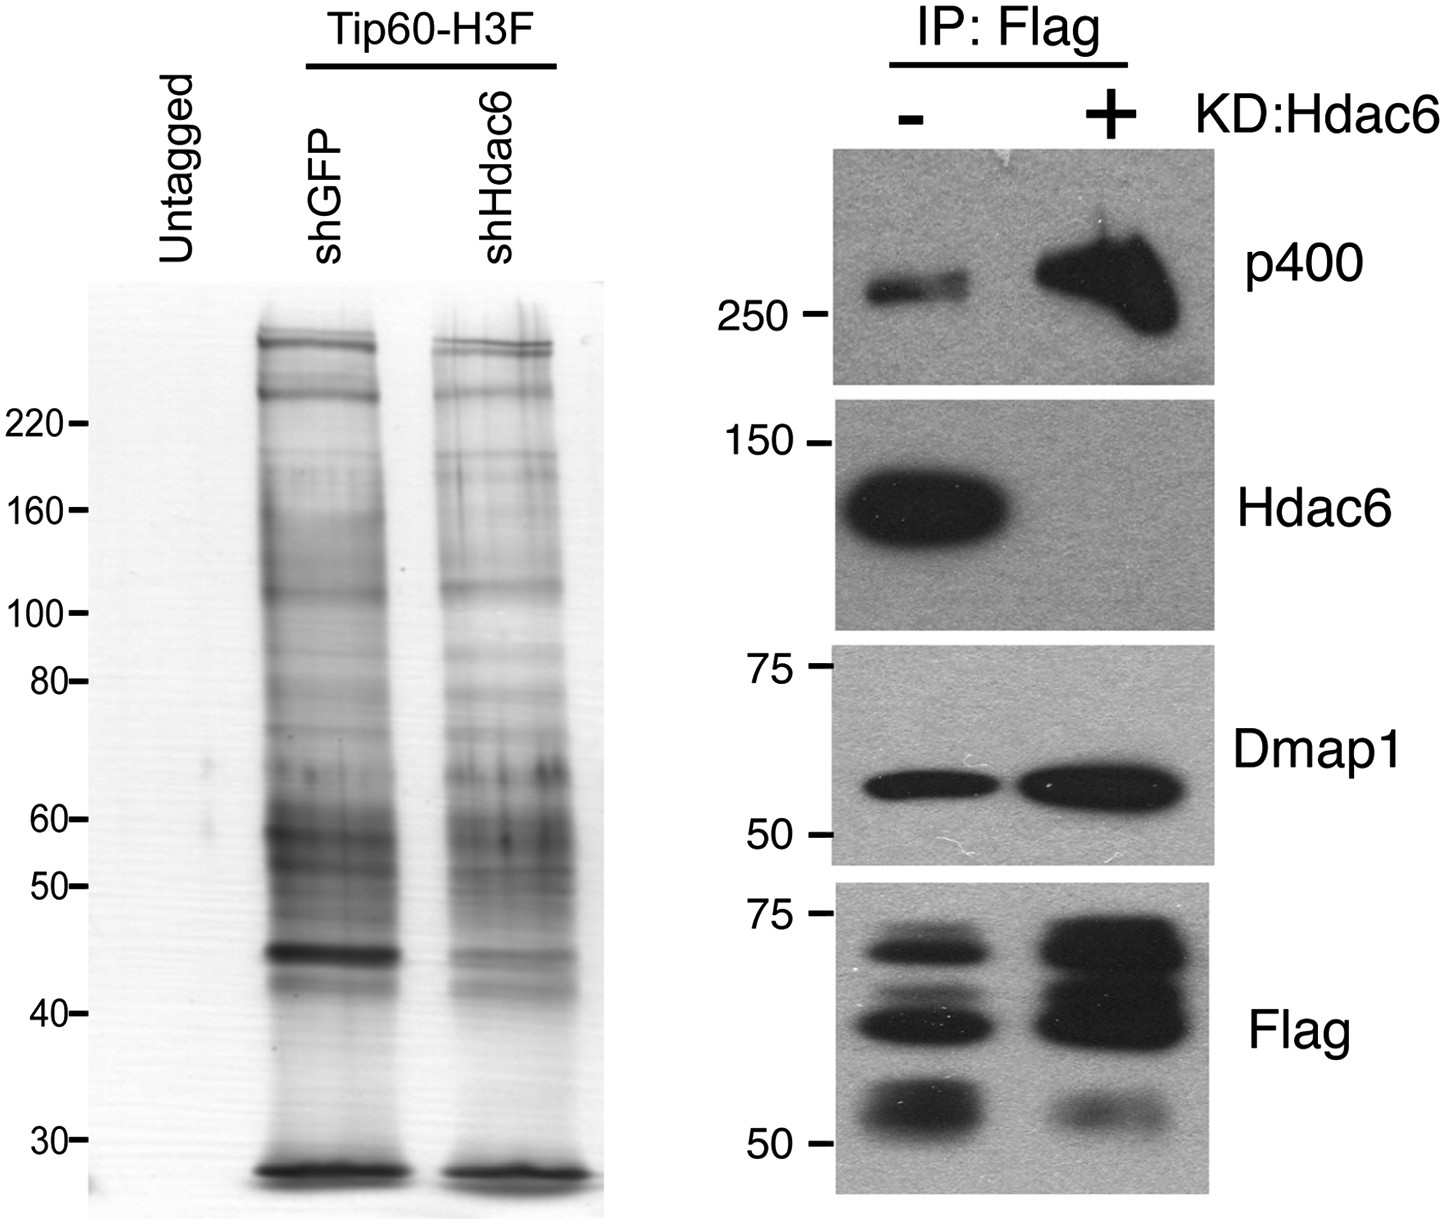
Identification of Tip60-p400-interacting proteins in ESCs.
(A) Silver stained gel of purified Tip60 complex from Tip60-H3F ESCs and MEFs, along with untagged control cells. (B) Validation of Hdac6 interaction. Western blots for Hdac6, p400, and Dmap1 following immunoprecipitation with anti-FLAG antibody from nuclear extracts derived from the indicated ESC lines. (C) Tip60 complexes purified from Tip60-H3F ESC and MEF nuclear extracts were subjected to Western blotting for Hdac6, Dmap1, and FLAG. (D) Tip60-H3F was immunoprecipitated from MEF whole cell extracts as above and blotted for the indicated proteins.
Figure 1—figure supplement 1

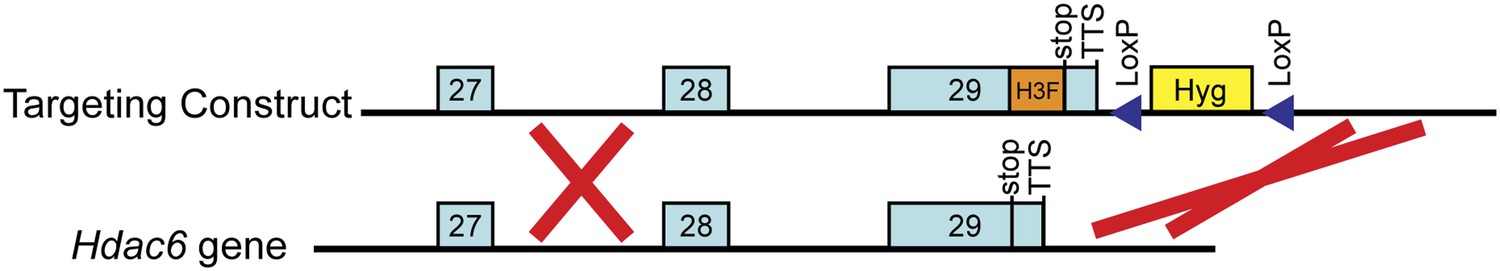
Targeting of H3F tag to C-terminus of endogenous Tip60 gene.
Shown are the 3' end of the Tip60 gene plus downstream sequence (below) and the targeting construct for introducing the C-terminal tandem 6-His-3-FLAG (H3F) tag (above). The counter-selection cassette within the targeting construct is omitted for brevity. See ‘Materials and methods’ for details of ESC targeting.
Figure 1—figure supplement 2

Reciprocal co-immunoprecipitation of Tip60 and Hdac6.
(Above) Immunoprecipitations from untagged or Hdac6-H3F ESCs with or without stable expression of Tip60-GFP (as indicated) were subjected to Western blotting for Tip60-GFP or Hdac6. (Below) Mild overexpression of Tip60 in Tip60-GFP cells. RT-qPCR of Tip60 or Hdac6 in untagged and Hdac6-H3F cells stably expressing Tip60-GFP.
Figure 1—figure supplement 3
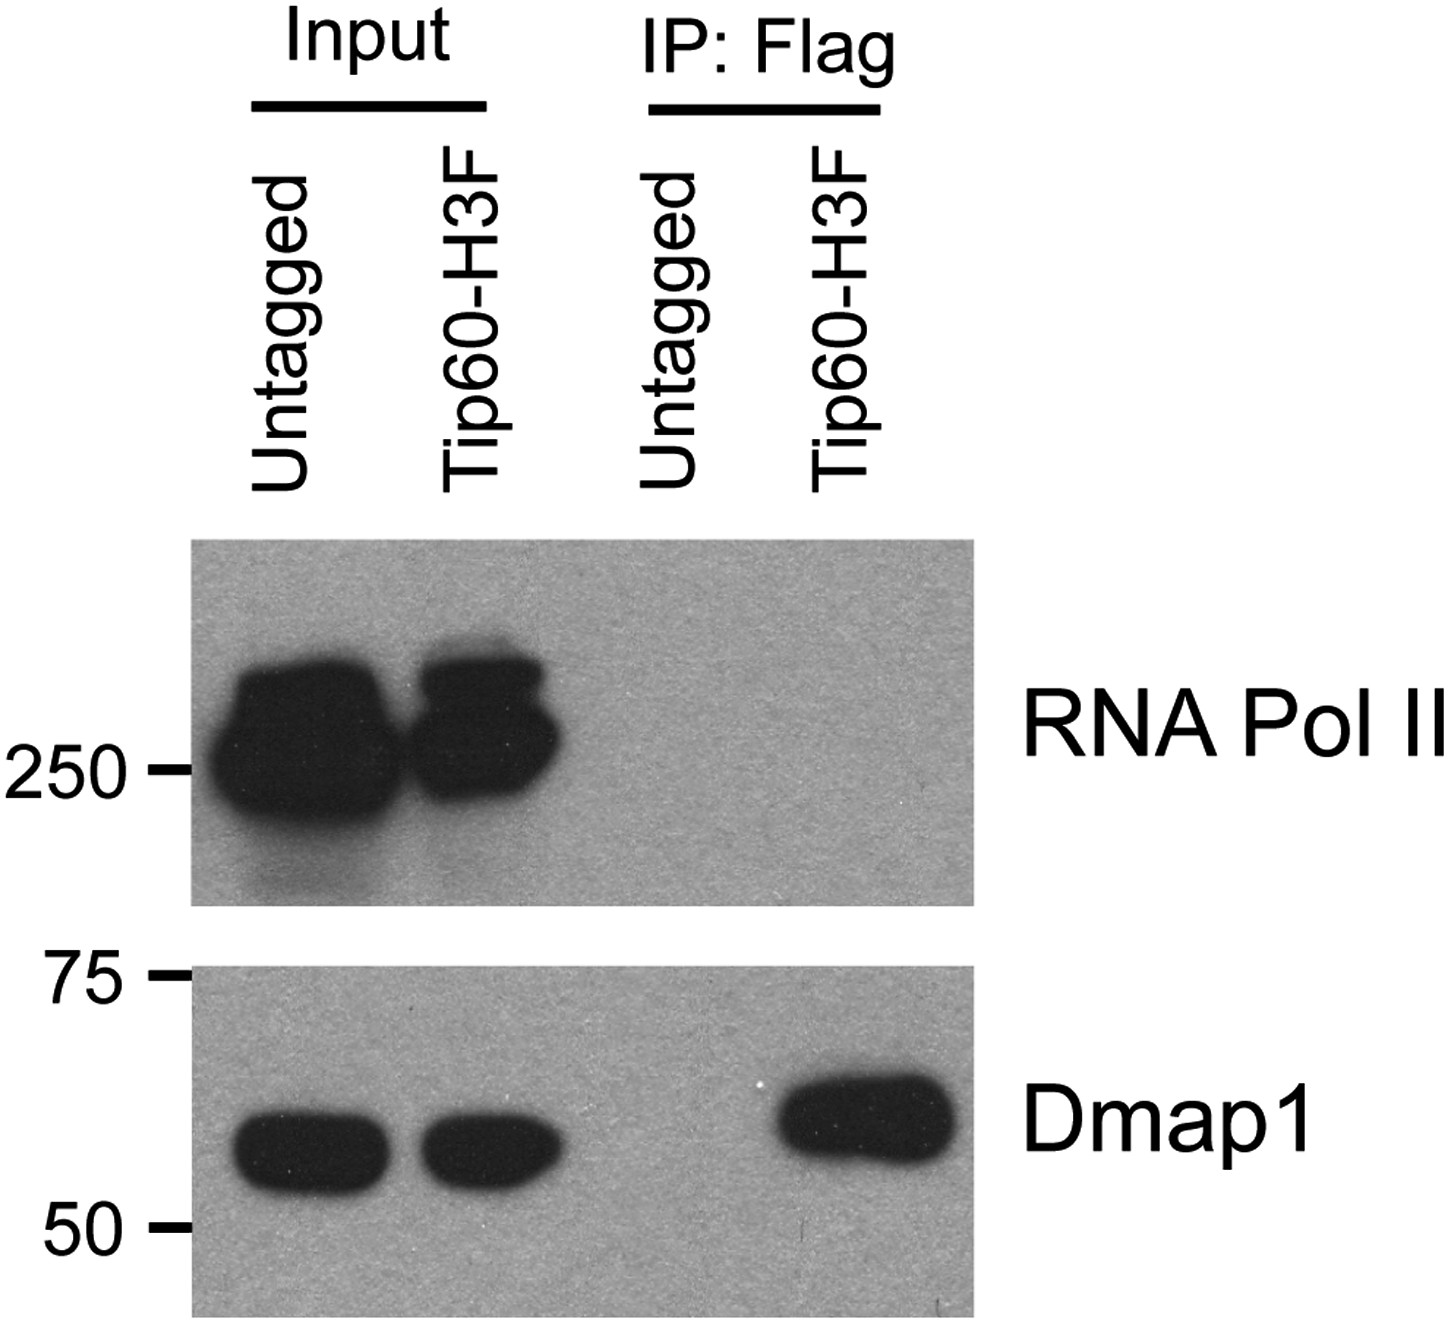
Hdac6 does not interact with RNA Polymerase II in ESCs.
Western blot of purified Tip60 complex from ESCs for RNA polymerase II (RNA Pol II) and Dmap1. (Tip60-p400 subunit Dmap1 is shown to confirm the presence of subunits of Tip60-p400 complex after purification.)
Figure 1—figure supplement 4
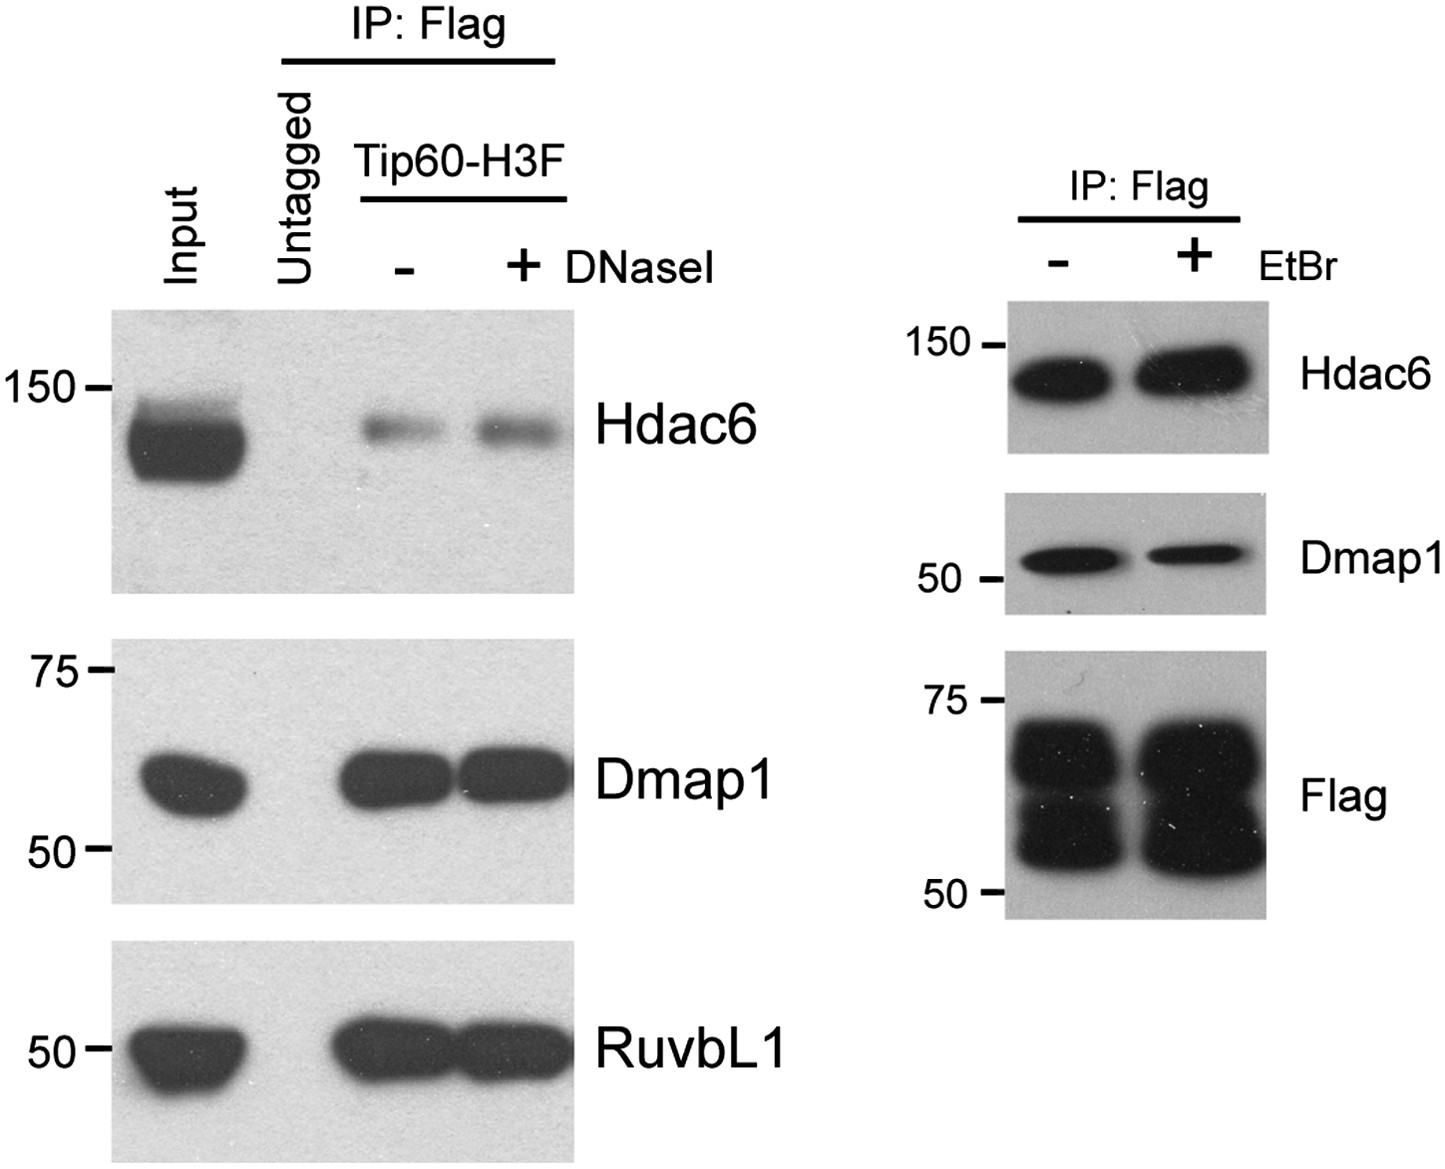
Hdac6 interaction with Tip60-p400 is independent of DNA.
DNase I (left) or ethidium bromide (right) was added into nuclear extracts during immunoprecipitation, and the Tip60-interacting proteins were analyzed by Western blotting with the indicated antibodies.
Figure 1—figure supplement 5

Hdac6 interaction with Tip60-p400 is resistant to high salt concentrations.
Tip60-H3F was purified from ESCs as above and subjected to washes with buffer containing the salt concentrations indicated.
Figure 2
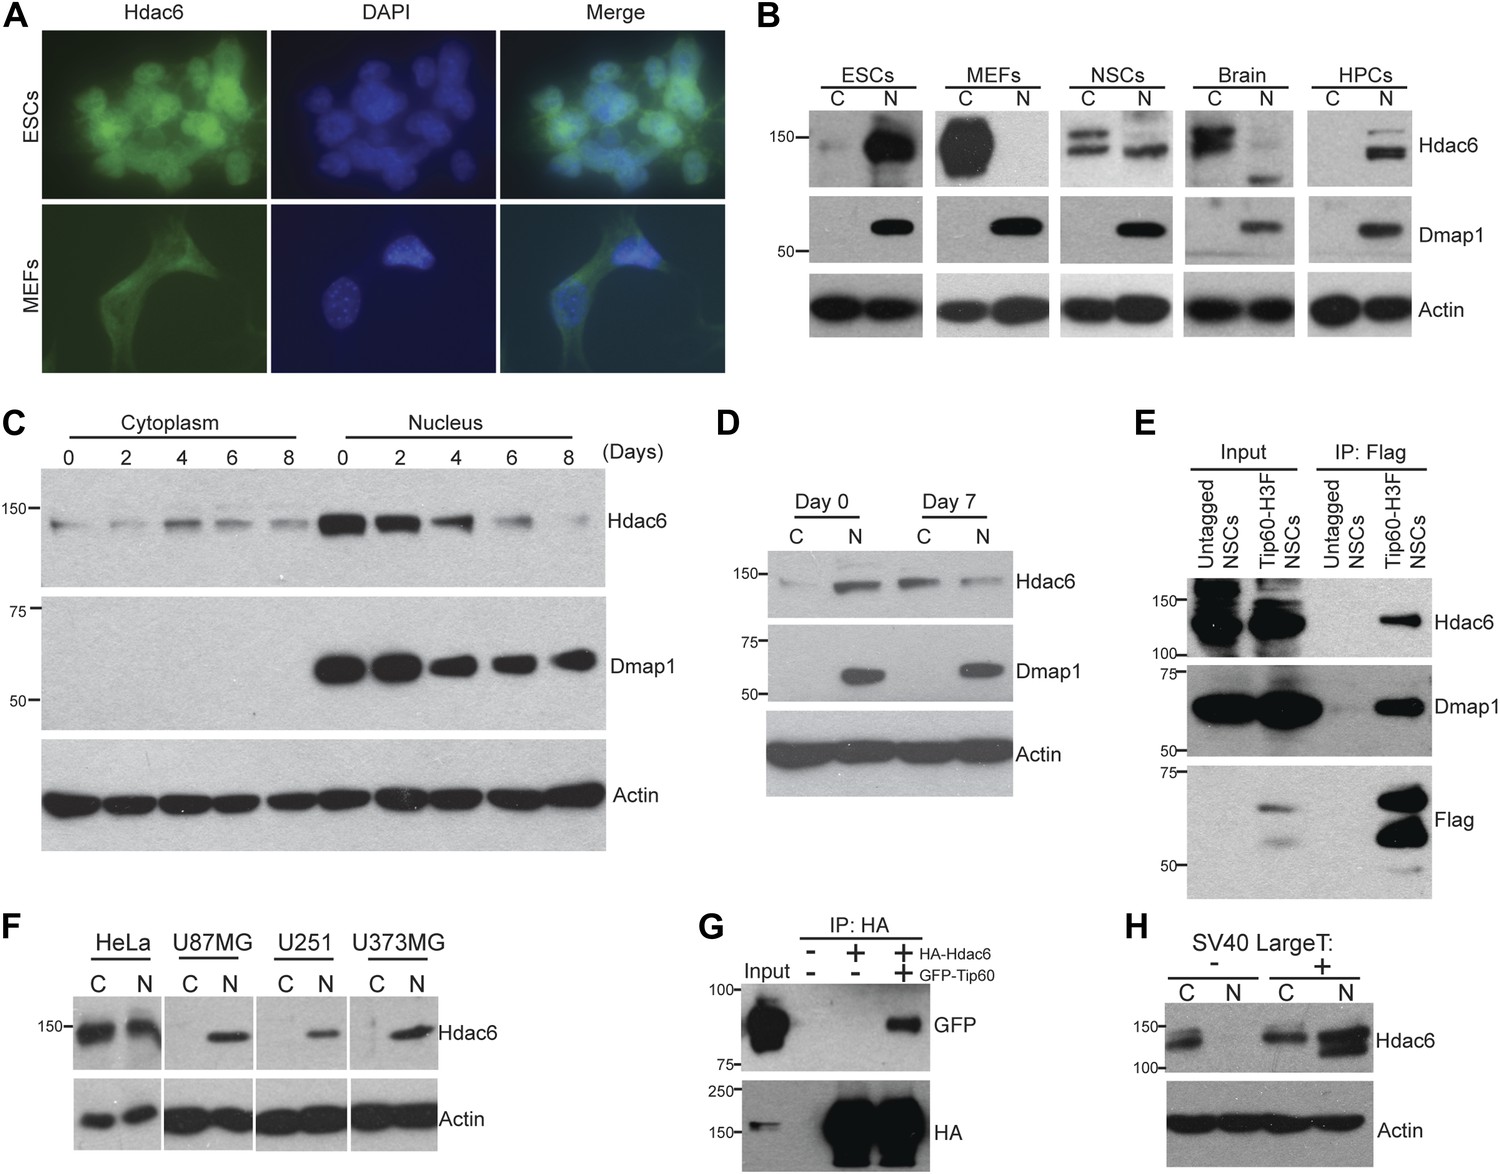
Hdac6 is partially nuclear in multiple types of undifferentiated cells and interacts with Tip60-p400 in NSCs and cancer cell lines.
(A) ESCs (top) or MEFs (bottom) were subjected to immunofluorescence using an antibody recognizing Hdac6. DAPI staining is shown to identify nuclei. (B) High levels of nuclear Hdac6 in stem cells but not differentiated cells. Western blots of Hdac6 and known Tip60-p400 subunit Dmap1 in cytoplasmic (C) and nuclear (N) fractions of indicated cells are shown, with β-actin serving as a loading control. (C) Hdac6 relocalizes to the cytoplasm during ESC differentiation. Cytoplasmic (C) and nuclear (N) fractions from ESCs differentiated for the indicated number of days were Western blotted for the indicated proteins. (D) Hdac6 relocalizes to the cytoplasm during NSC differentiation. Cytoplasmic (C) and nuclear (N) fractions from undifferentiated NSCs (day 0) or NSCs differentiated for 7 days were Western blotted for the indicated proteins. (E) Hdac6 interacts with Tip60-p400 in NSCs. Shown are Western blots for the proteins indicated of input or Tip60-p400 complex immunoprecipitated from NSCs. (F) Hdac6 is nuclear localized in cancer cell lines. Cells were fractionated and Western blotted as in (B). (G) Hdac6 interacts with Tip60-p400 in a cancer cell line. 293.T cells were transfected with the indicated constructs. Nuclear extracts were prepared, subjected to immunoprecipitation with an anti-HA antibody, and Western blotted as indicated. (H) Re-localization of Hdac6 to the nucleus is an early event during transformation. MEFs were infected with pBABE-puro retrovirus expressing SV40 large T antigen or empty vector, harvested after 5 days (including 3 days of selection), and fractionated as in (B). Western blots are shown for the proteins indicated.
Figure 3 with 4 supplements
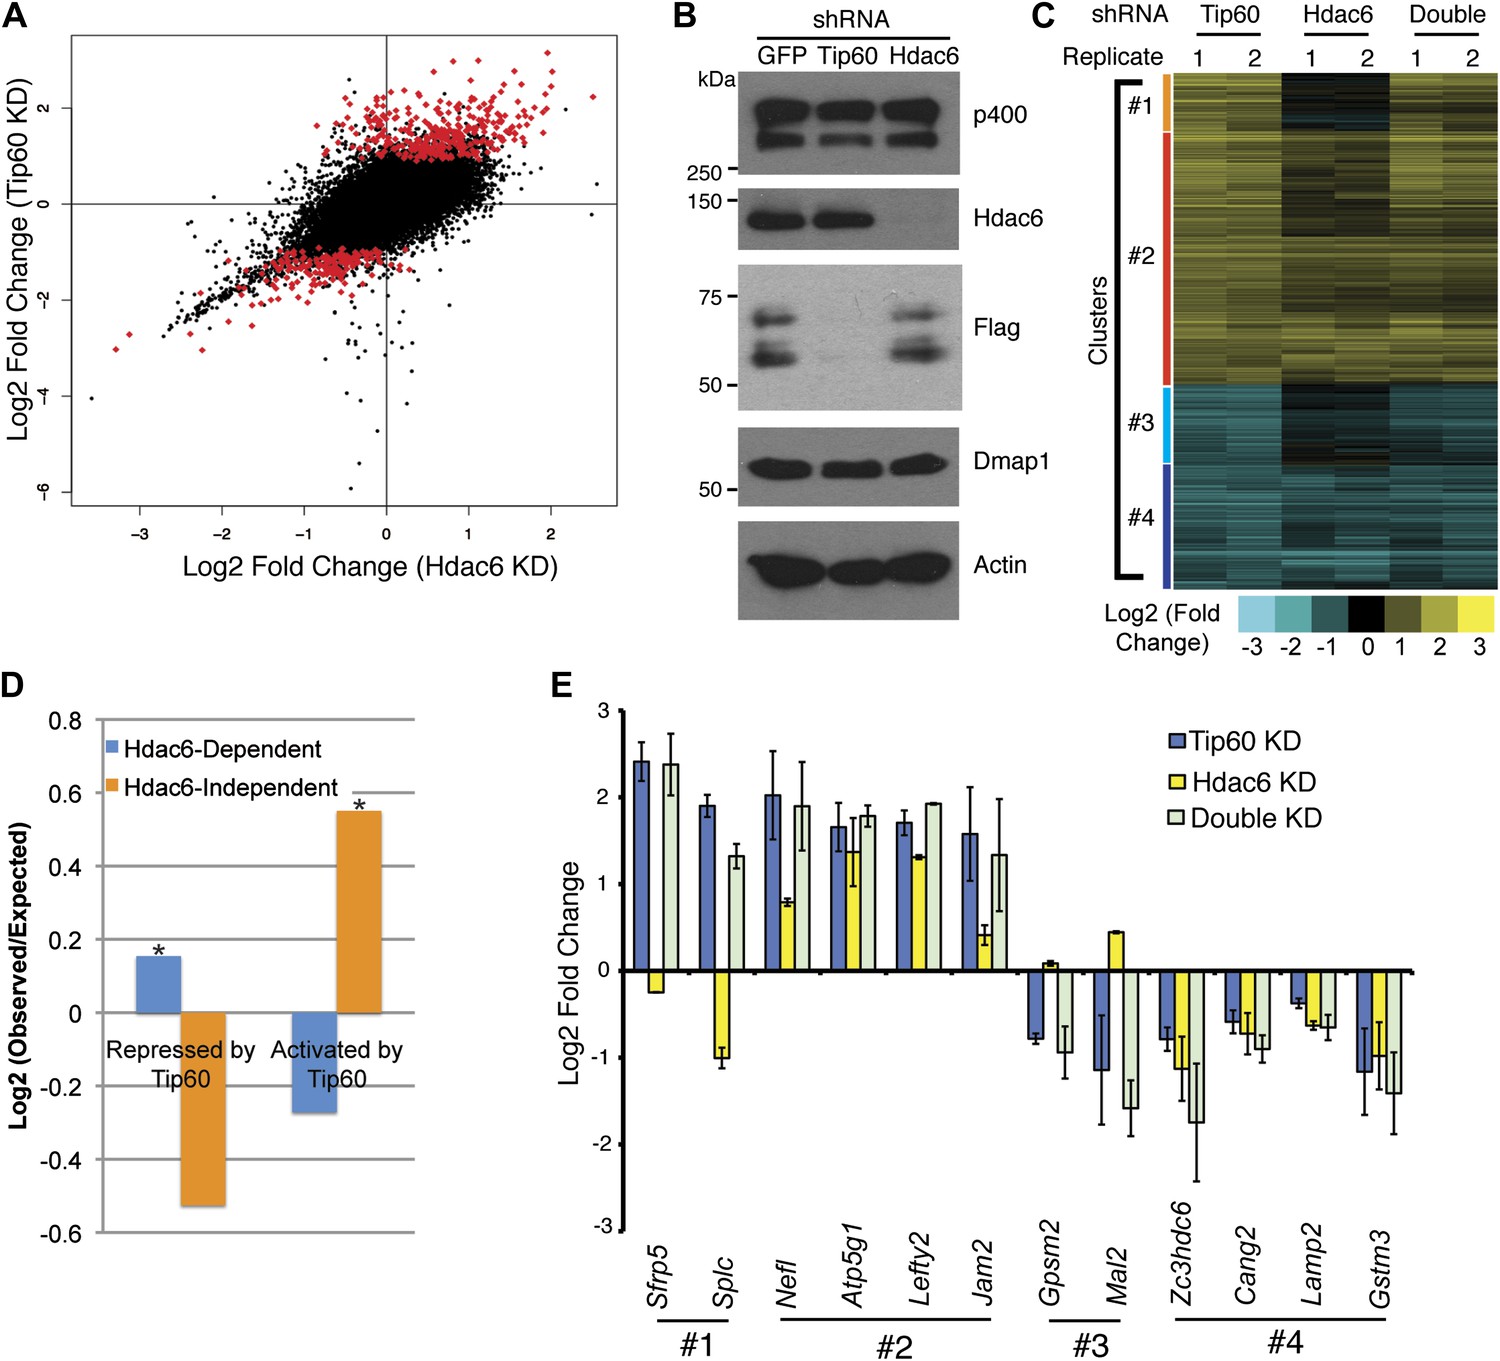
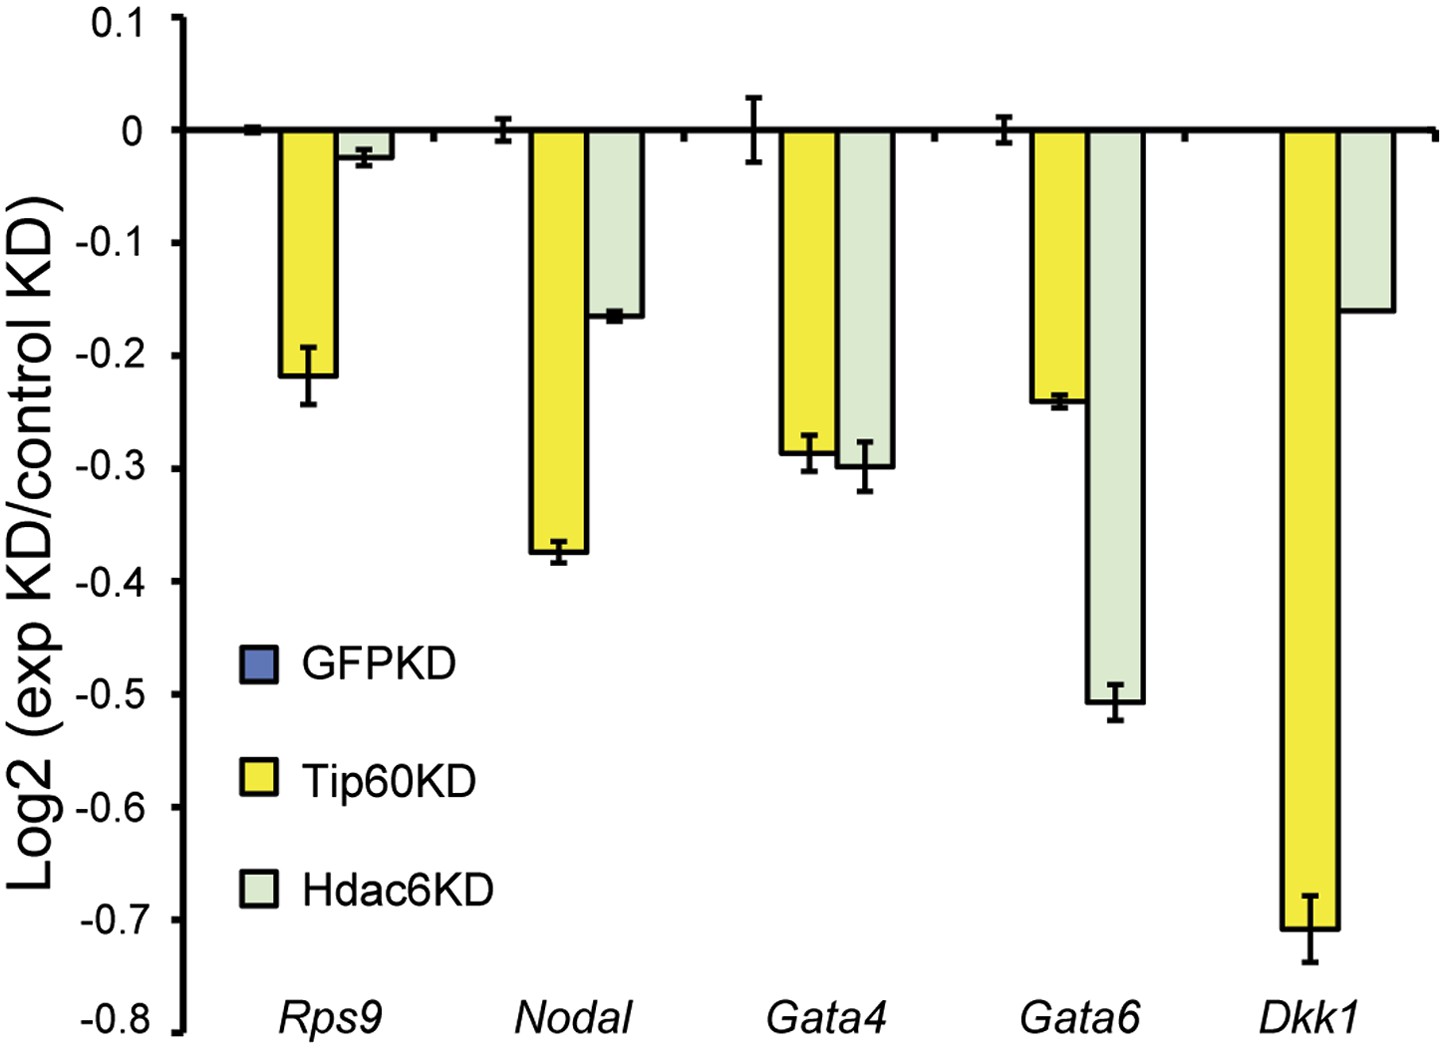
Overlapping effects of Hdac6 KD and Tip60 KD on gene expression in ESCs.
(A) Scatter plot of gene expression (Log2 (fold change) relative to control KD ESCs) upon Tip60 KD relative to Hdac6 KD. Genes misregulated upon Tip60 KD (adjusted p<0.1) are shown in red. (B) Western blot showing the levels of p400, Dmap1, Hdac6 and Tip60 (FLAG) upon Tip60 or Hdac6 KD. β-actin is shown as a loading control. (C) Unsupervised hierarchical clustering of genes misregulated (adjusted p<0.1) upon Tip60 KD. Up-regulated genes are indicated in yellow and downregulated genes are indicated in blue. The first cluster (#1) includes 200 genes that were upregulated upon Tip60 KD but not Hdac6 KD, the second cluster (#2) includes 867 genes upregulated in both Tip60 KD and Hdac6 KD ESCs, the third cluster (#3) includes 277 genes that were downregulated only in Tip60 KD cells and the forth cluster (#4) includes 424 genes that were downregulated in both Tip60 KD and Hdac6 KD ESCs. (D) Hdac6-dependent target genes are biased toward genes repressed by Tip60. Genes repressed or activated by Tip60 were split based on their Hdac6-dependence, and each group was plotted as the Log2 (ratio) of genes observed in each group relative to the expected number of genes if Hdac6-dependence was randomly distributed. Asterisk indicates statistically significant enrichment (p<10–20). (E) Validation of microarray datasets. The expression levels of genes from each cluster were measured by RT-qPCR in the indicated KDs and expressed as Log2 (fold change) values relative to control (GFP) KD ESCs after normalization. Data shown are mean ± SD of three technical replicates from one representative experiment of two biological replicates performed.
Figure 3—figure supplement 1
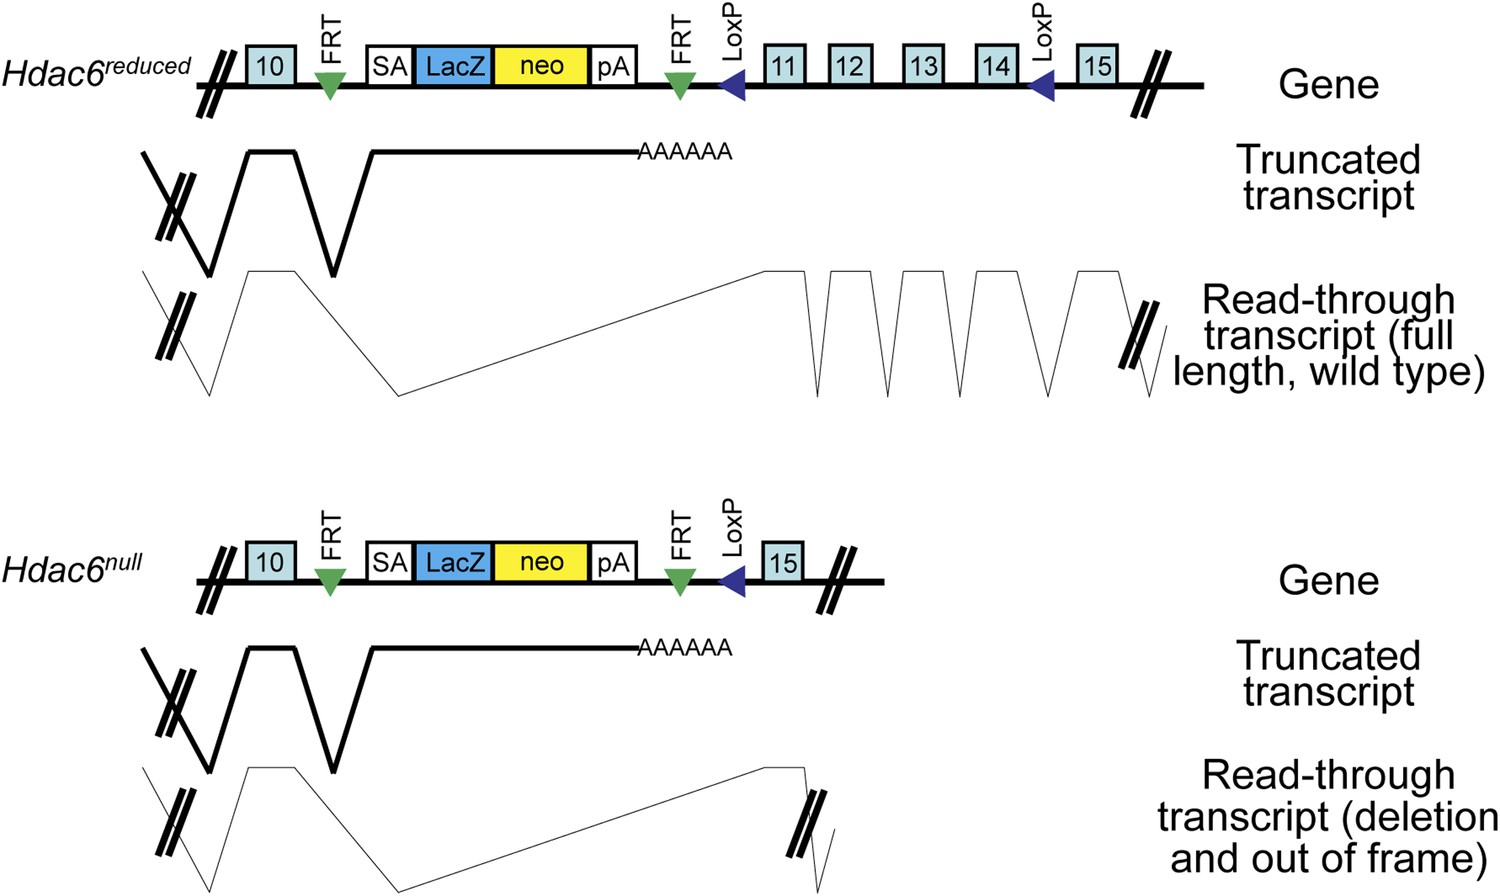
Hdac6 mutant ESCs.
Diagram of Hdac6 mutant ESC line Hdac6tm1a(EUCOMM)Wtsi before (Hdac6reduced) and after (Hdac6null) CRE expression. Since, prior to CRE expression, this line produces a low level of Hdac6 protein, we infer that some transcripts fail to include the gene trap allele and therefore produce full-length, wild-type transcript. SA: splice acceptor; pA: cleavage and polyadenylation sequence.
Figure 3—figure supplement 2

Hypomorphic and null Hdac6 mutant ESCs.
Whole cell extracts from normal (WT) ESCs or Hdac6 mutant ESCs as diagrammed in Figure 3—figure supplement 1 were prepared, followed by Western blotting for the proteins indicated. Note higher levels of acetylated tubulin upon CRE expression.
Figure 3—figure supplement 3
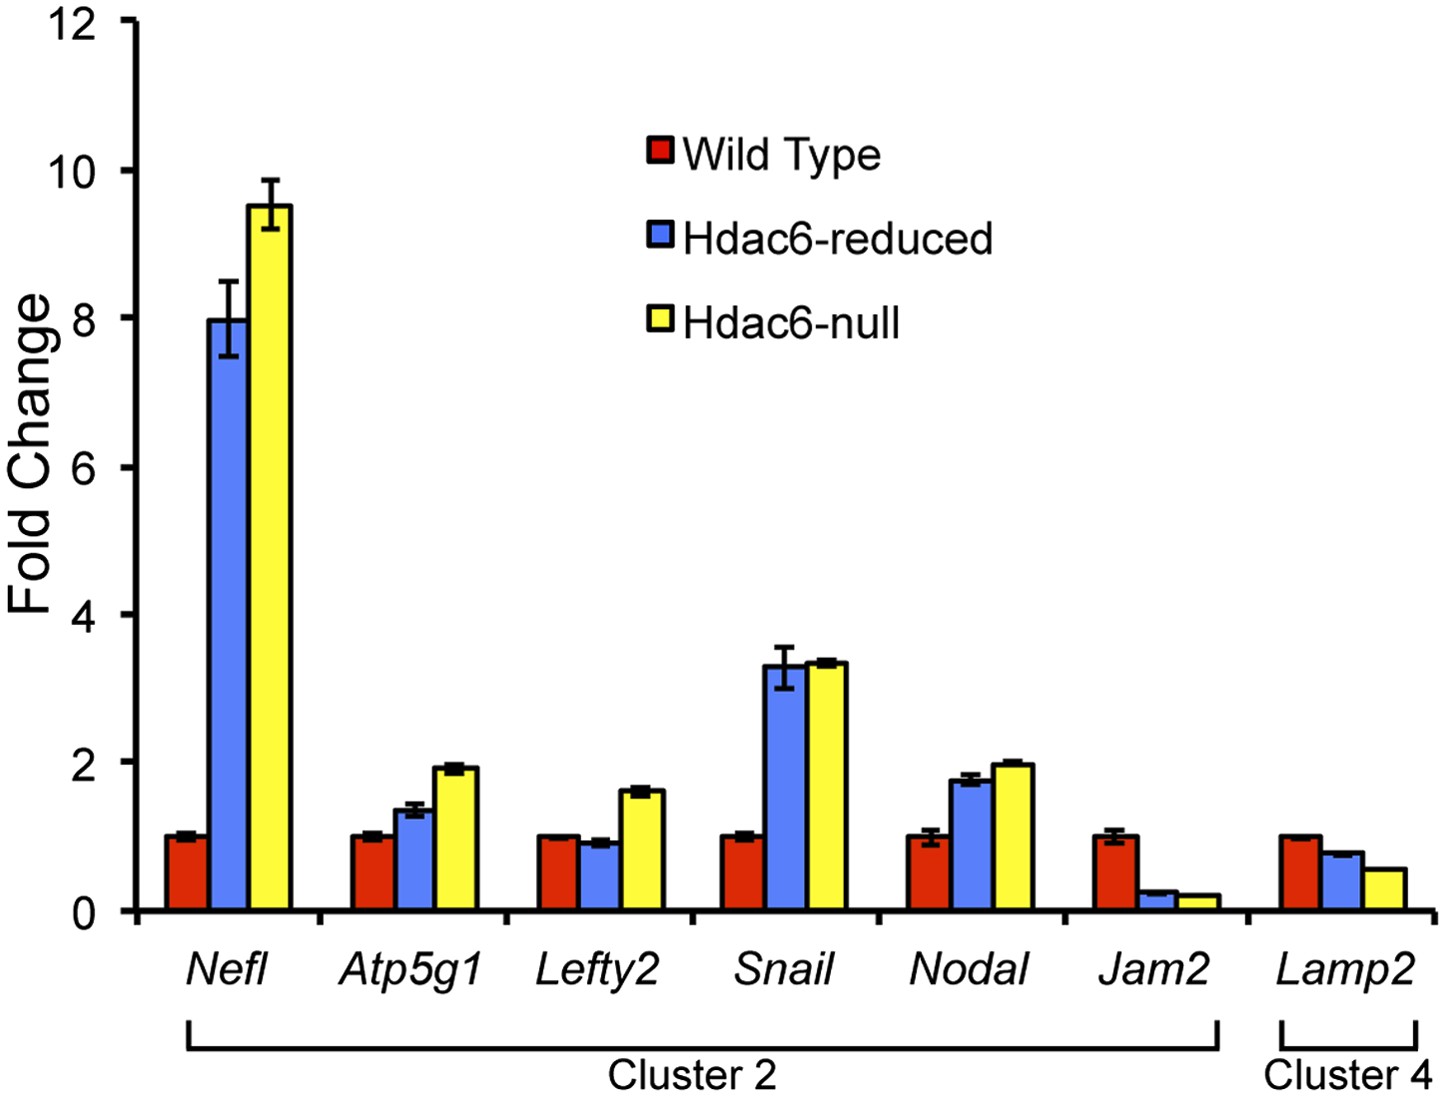
Hdac6 mutant ESCs exhibit alterations in Tip60-target gene expression consistent with KD phenotypes.
Cells described in Figure 3—figure supplement 1 were harvested for RNA and subjected to RT-qPCR for the genes indicated from Tip60/Hdac6 target gene cluster 2 (cluster 4 gene shown as a control). Data shown are mean ± SD of three technical replicates from one representative experiment of two biological replicates performed.
Figure 3—figure supplement 4

GO-term enrichment of gene clusters.
The significance of enrichment [−Log10 (p-value)] of Gene Ontology (GO) terms over-represented in each cluster of genes in Figure 3C. GO terms that were partially redundant with those listed were eliminated for brevity.
Figure 4 with 3 supplements
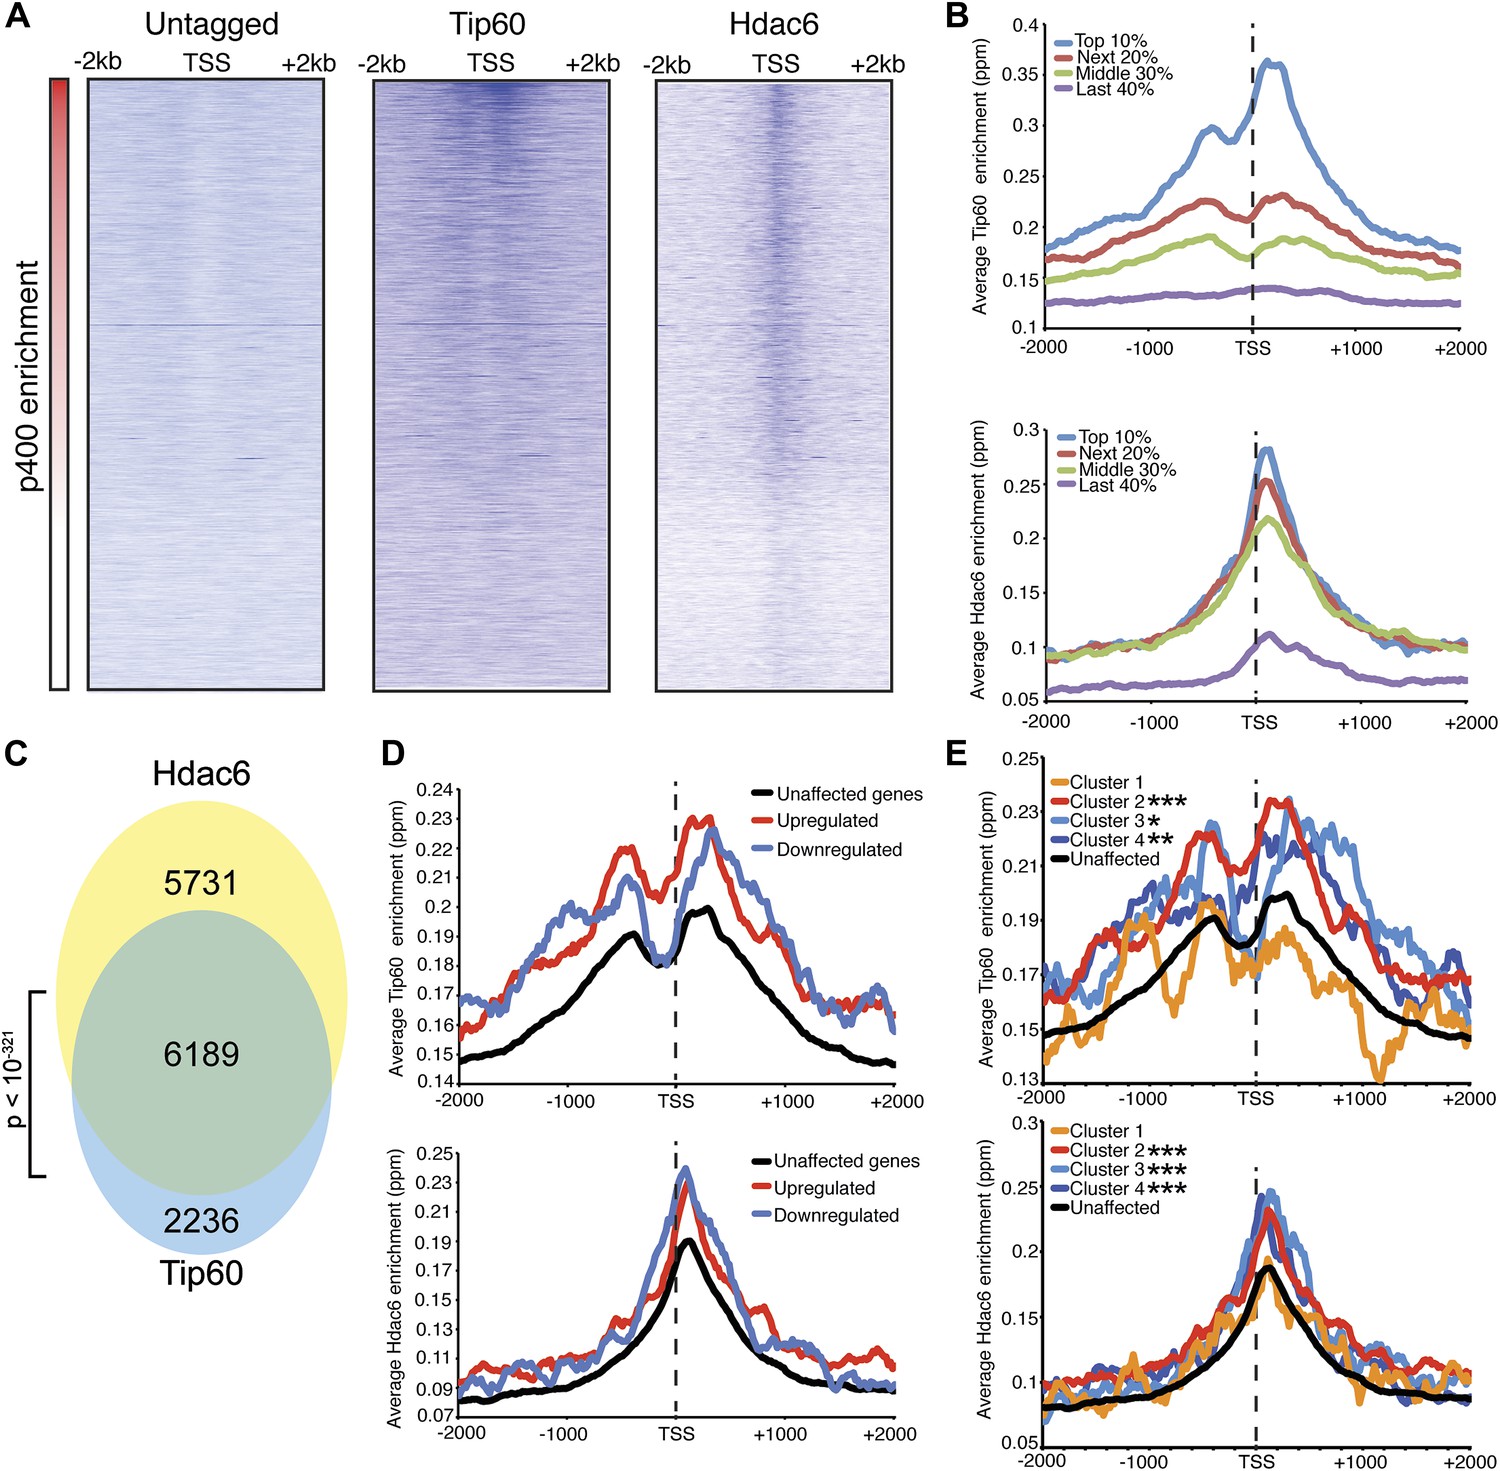
Tip60 and Hdac6 co-localize on chromatin.
(A) Heat map representation of ChIP-seq data for H3F-tagged Tip60 and Hdac6 comprising the 2 kb surrounding the transcriptional start sites (TSS) of 10,507 genes for which published p400 ChIP-chip data (Fazzio et al., 2008a) (p400 enrichment) were available. ChIP-seq data from E14 (Untagged) cells is shown as a control. All panels are sorted by decreasing p400 binding for the 1 kb surrounding the TSS, ranging from high levels of p400 binding (red) to genes unbound by p400 (white). (B) Tip60 and Hdac6 binding correlate with p400 binding. Genes in the p400 ChIP-chip dataset were grouped by the intensity of p400 enrichment: The groups of genes exhibiting the top 10% of p400 enrichment (top 10%), the 11th–30th percentile (next 20%), the 31st–60th percentile (middle 30%) and the rest of genes in dataset (last 40%). Upper panel: averaged Tip60 enrichment for groups of genes at each level of p400 binding are shown relative to the TSS. Lower panel: averaged Hdac6 binding data for genes in the same groups. (C) Correlation of Tip60 and Hdac6 binding. Shown is a Venn diagram delineating the overlap between the gene sets bound by Tip60 and Hdac6. The p-value was calculated by summing the hypergeometric probabilities of Tip60/Hdac6 overlap below the number observed and subtracting from one. (D) Hdac6 and Tip60 are enriched at genes regulated by these factors. Upper panel: Tip60 binding segregated by genes that are upregulated, downregulated, or unchanged by Tip60 KD. Bottom panel: Hdac6 binding at genes segregated as in upper panel. (E) Tip60 and Hdac6 are enriched at genes within clusters 2, 3, and 4. Tip60 (upper panel) and Hdac6 (bottom panel) binding data are shown for genes segregated by cluster, as in Figure 2C. Asterisks mark clusters exhibiting statistically significantly higher promoter-proximal (−500 to +500) binding of indicated factor than does the set of genes not regulated by Tip60 and Hdac6: *(p<0.05); **(p<0.01); ***(p<10-5).
Figure 4—figure supplement 1
Targeting of the H3F tag to the C-terminus of the endogenous Hdac6 gene.
Shown are the 3' end of the Hdac6 gene plus downstream sequence (below) and the targeting construct for introducing the C-terminal tandem 6-His-3-FLAG tag (above). The counter-selection cassette within the targeting construct is omitted for brevity. See ‘Materials and methods’ for details of ESC targeting.
Figure 4—figure supplement 2
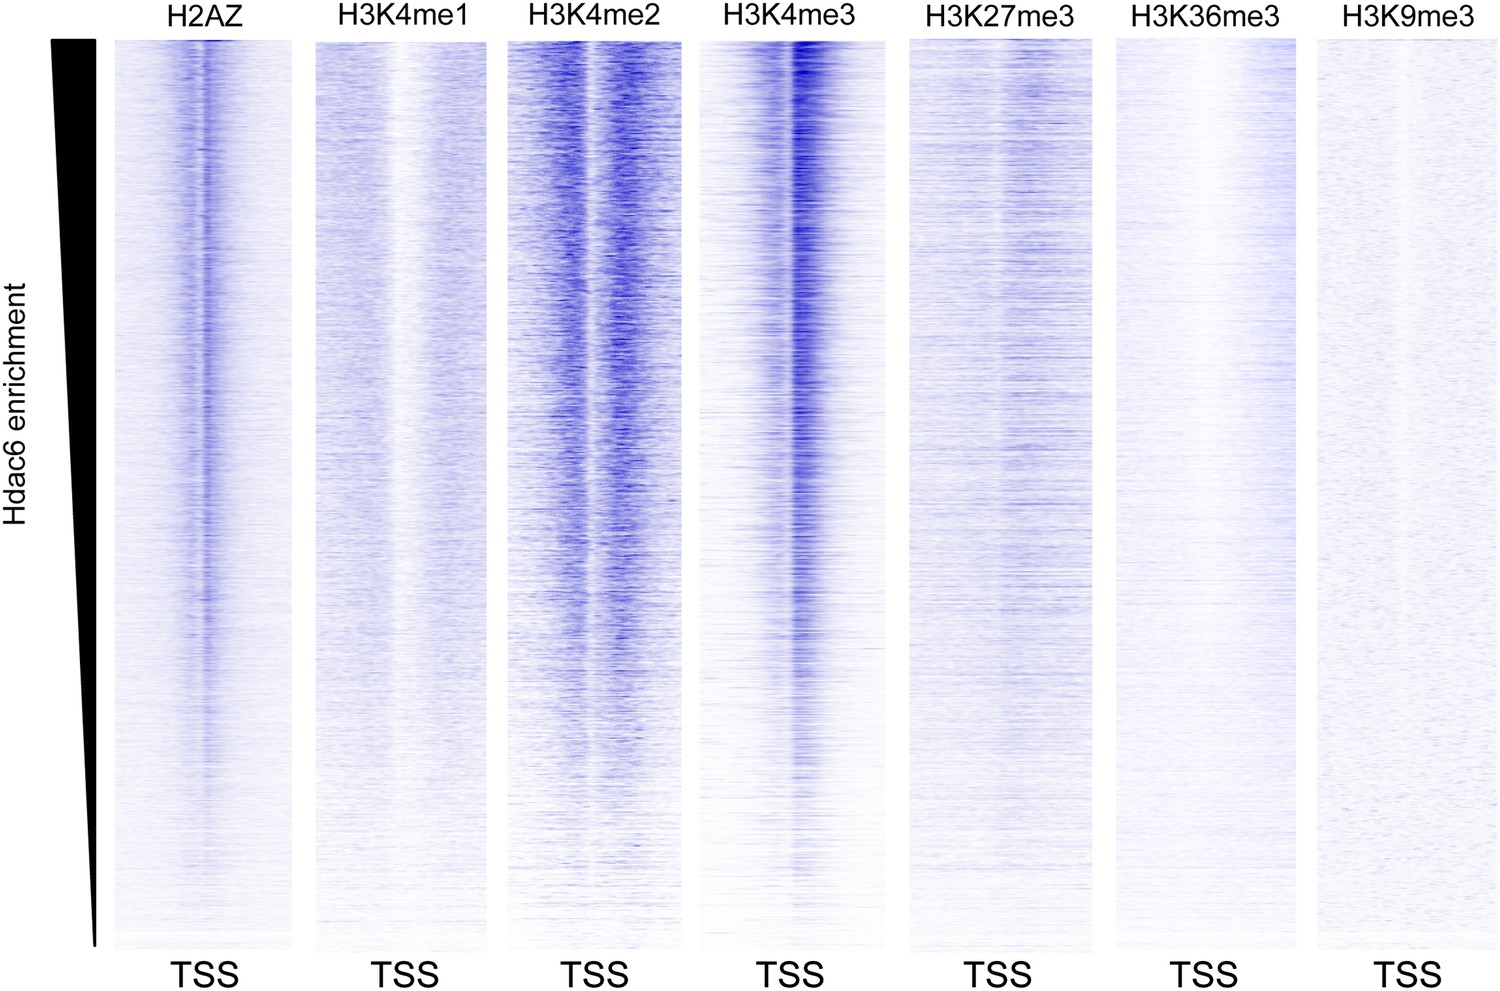
Hdac6 is enriched at genes marked by H3K4me3.
Heatmaps showing the enrichment of various histone modifications or variants within promoter-proximal regions (TSS ± 2 kb) of all genes, sorted by Hdac6 enrichment. H3K4me3 is strongly enriched at genes with high levels of Hdac6 binding, including bivalent genes marked by both H3K4me3 and H3K27me3, similar to previous findings for the p400 subunit of Tip60-p400. Histone modification data are from the following sources: H3K4me1/me2/me3, H3K27me3, H3K36me3 (Mikkelsen et al., 2007); H2AZ (Hu et al., 2013); and H3K9me3 (Teif et al., 2012)
Figure 4—figure supplement 3
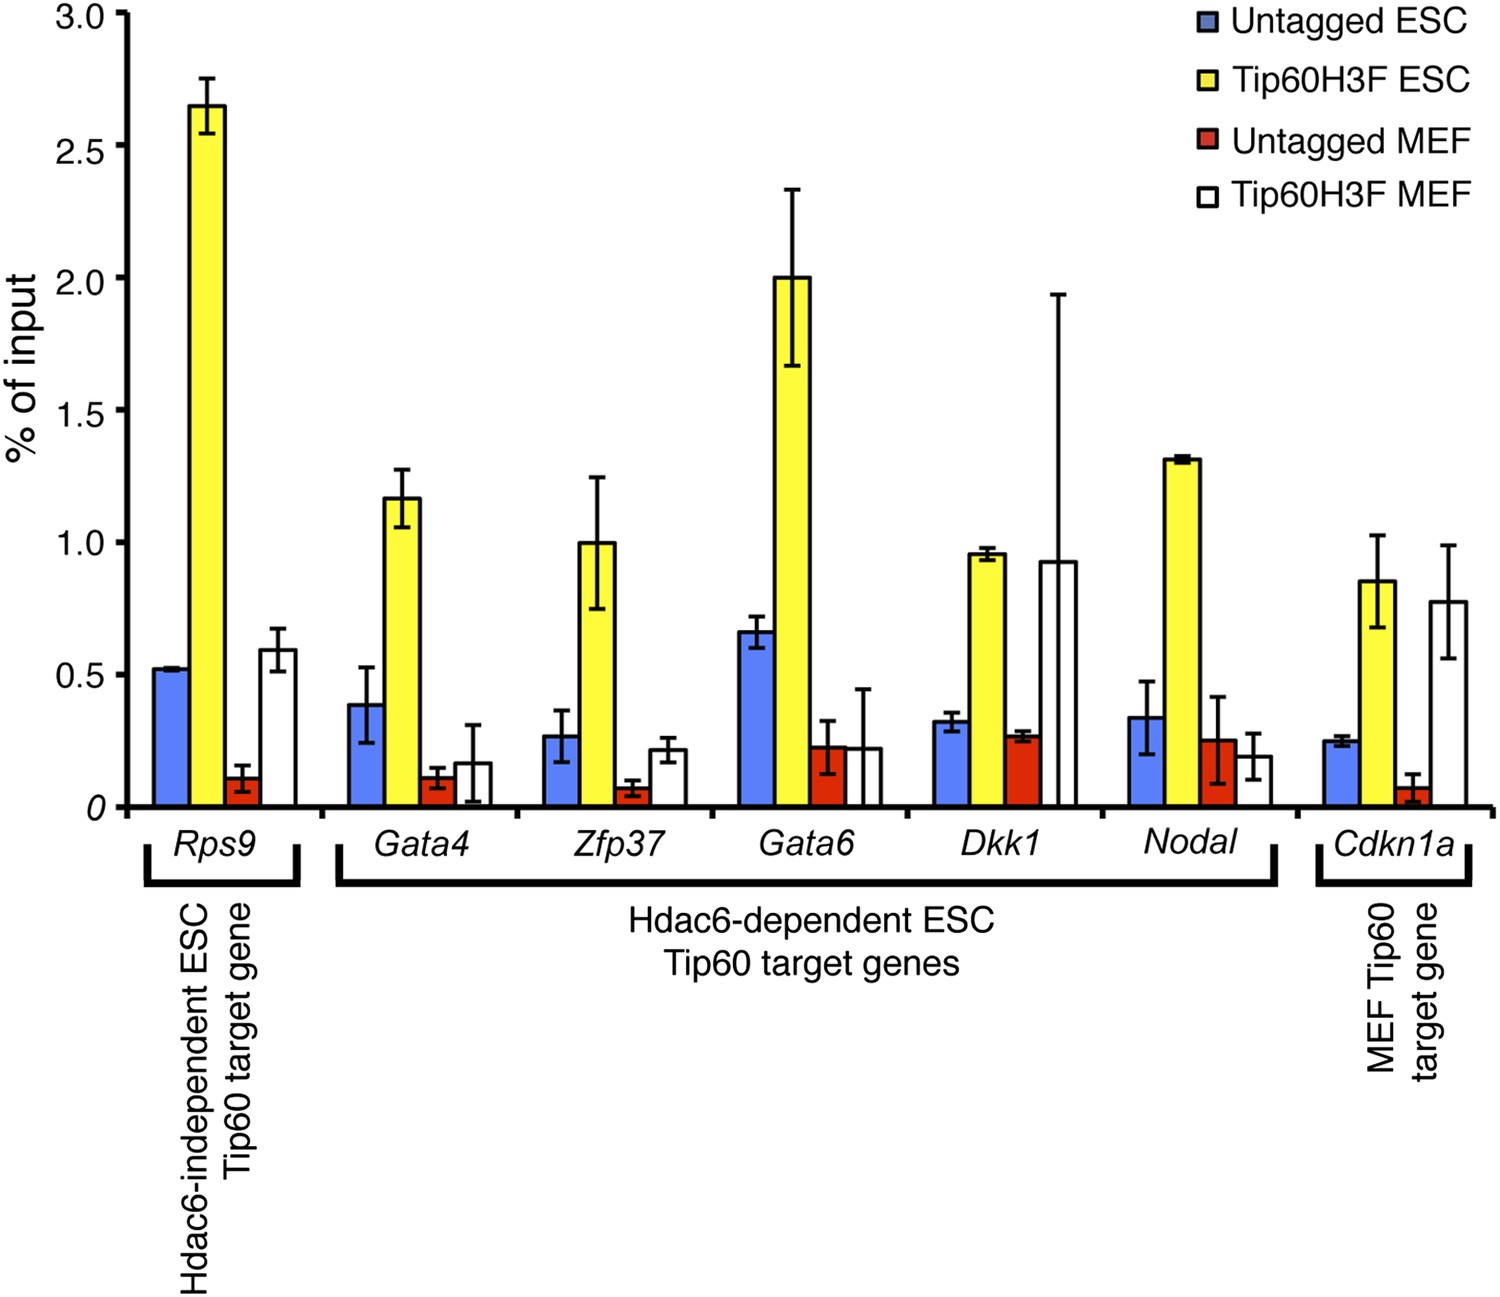
Hdac6-dependent Tip60 targets in ESCs are not bound by Tip60 in MEFs.
Tip60 enrichment near the promoters of the genes indicated was determined by ChIP-qPCR in ESCs and MEFs. We examined binding to Cdkn1a, a known Tip60 target in MEFs, as a positive control for ChIP in MEFs. Data shown are the mean ± SD of three technical replicates from one representative experiment of two biological replicates performed.
Figure 5 with 5 supplements
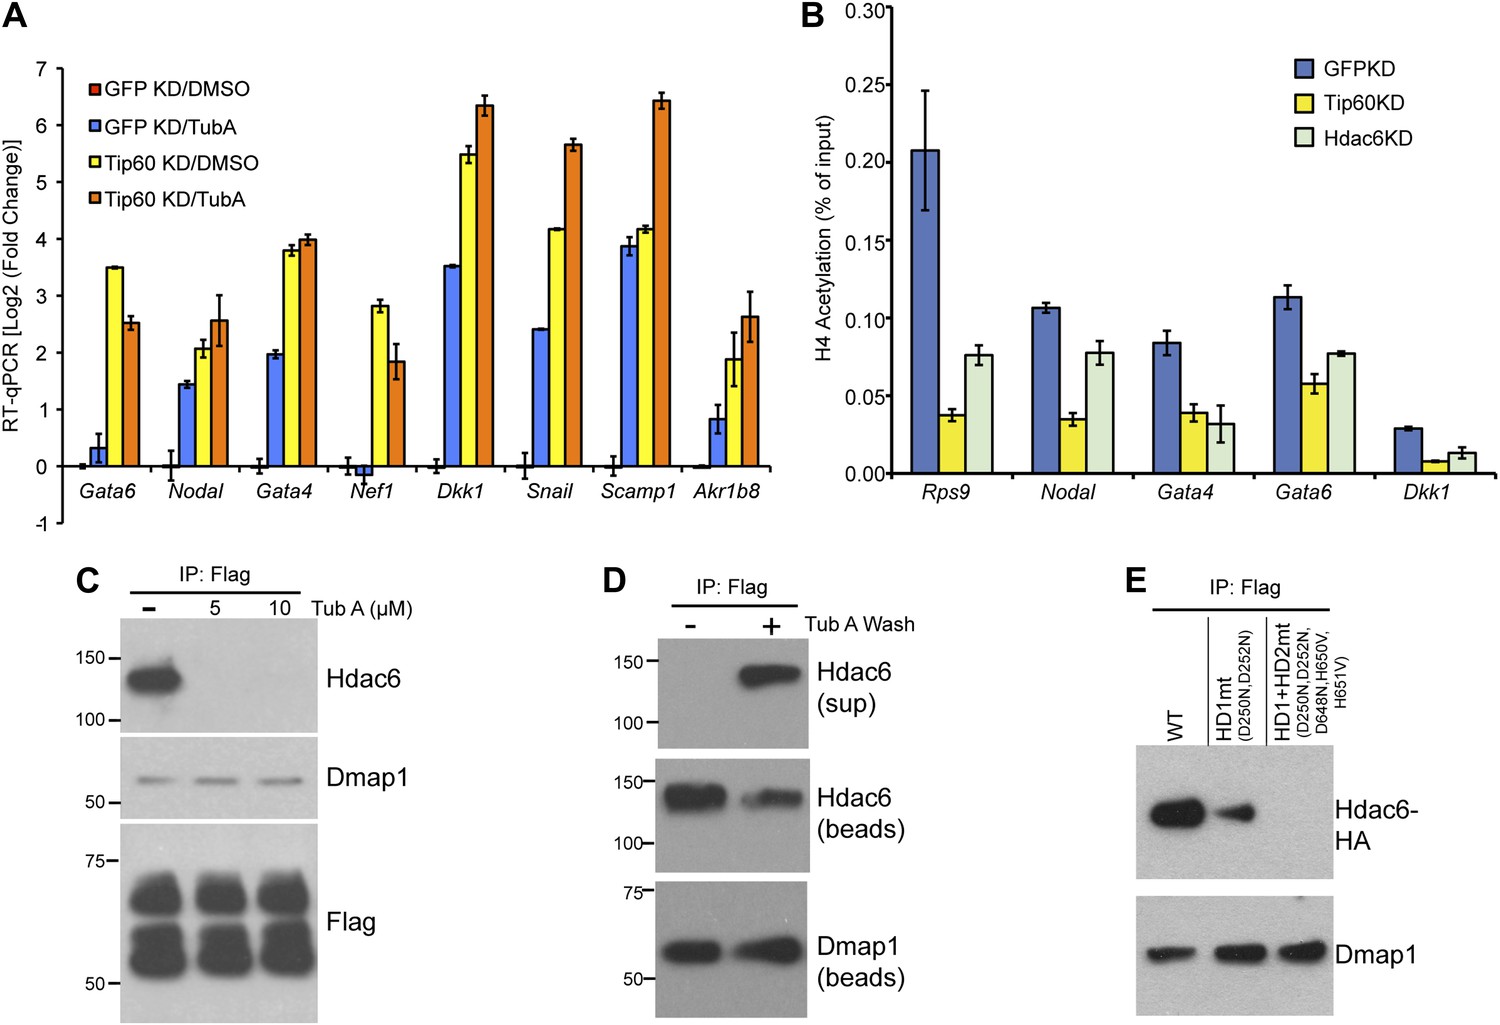
The Hdac6 deacetylase domains are necessary for Tip60-p400 binding but do not reverse histone acetylation catalyzed by Tip60.
(A) Treatment of ESCs with Hdac6 catalytic domain inhibitor Tubastatin A causes de-repression of Tip60-p400 target genes. RT-qPCRs for indicated genes are shown for GFP KD or Tip60 KD ESCs treated with either Tubastatin A (TubA) or DMSO vehicle. Data are expressed as Log2 (fold change) values relative to DMSO treated GFP KD ESCs after normalization. Shown are the mean ± SD values of three technical replicates from one representative experiment of two biological replicates performed. (B) H4 acetylation levels for several common Tip60/Hdac6 target genes in Tip60 KD and Hdac6 KD ESCs were measured by ChIP-qPCR, using an antibody specific for tetra-acetylated histone H4. H4 acetylation levels in cells knocked down as indicated are expressed as a fraction of the input. Shown are the mean ± SD values of three technical replicates from one representative experiment of two biological replicates performed. (C) ESCs were treated overnight with the indicated amounts of TubA in their growth medium, Tip60-H3F was immunoprecipitated as above, and co-immunoprecipitating proteins were examined by Western blotting. (D) Tip60-H3F was immunoprecipitated from ESCs grown under normal conditions, and the beads were washed in buffer with or without TubA. The Hdac6 eluted in the TubA wash or remaining bound to beads is shown by Western blotting, along with canonical Tip60 subunit Dmap1. (E) HA-tagged wild type, deacetylase domain 1 (HD1) mutant, or double deacetylase domain mutant (HD1 + HD2) Hdac6 was stably expressed in Tip60-H3F ESCs, Tip60-H3F was immunoprecipitated from nuclear extracts, and co-precipitating proteins were examined by Western blotting. Co-IP of canonical Tip60 complex subunit Dmap1 is shown as a control.
Figure 5—figure supplement 1
Hdac6 KD does not cause general disruption of Tip60-p400 complex.
(Left) Silver stain of Tip60-p400 complex purified from control or Hdac6 KD Tip60-H3F ESCs or untagged ESCs, as indicated. (Right) Tip60-p400 complex purified from control or Hdac6 KD ESCs Western blotted for indicated proteins.
Figure 5—figure supplement 2

Tubastatin A has no effect on Hdac6 expression or localization.
ESCs were treated as shown, and nuclear and cytoplasmic fractions were Western blotted for the proteins indicated.
Figure 5—figure supplement 3
Hdac6 KD reduces H2AK5 acetylation at Tip60-target genes.
H2AK5 acetylation levels for several common Tip60/Hdac6 target genes in Tip60 and Hdac6 KD ESCs was measured by ChIP-qPCR, expressed as Log2 ratios relative to control (GFP) KD. Data shown are mean ± SD of three technical replicates from one representative experiment of two biological replicates performed.
Figure 5—figure supplement 4
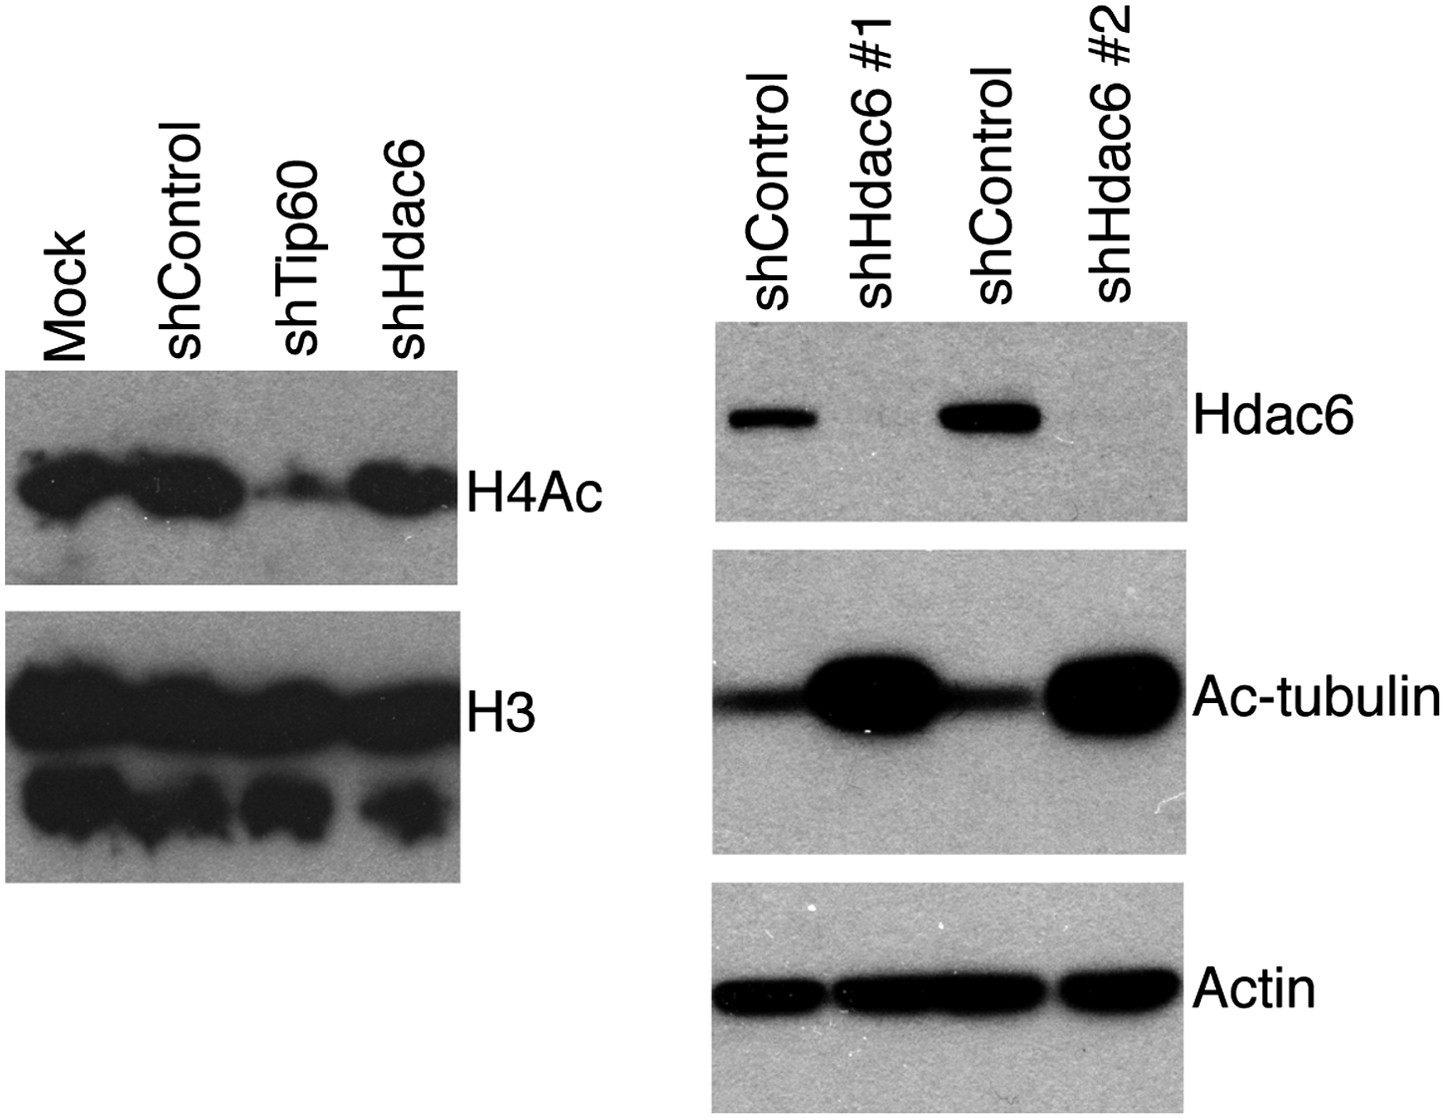
Hdac6 KD has no effect on bulk H4 acetylation levels, but strongly increases tubulin acetylation.
ESCs knocked down as indicated were Western blotted with antibodies to tetra-acetylated histone H4 or H3 (left), or acetylated tubulin (right).
Figure 5—figure supplement 5
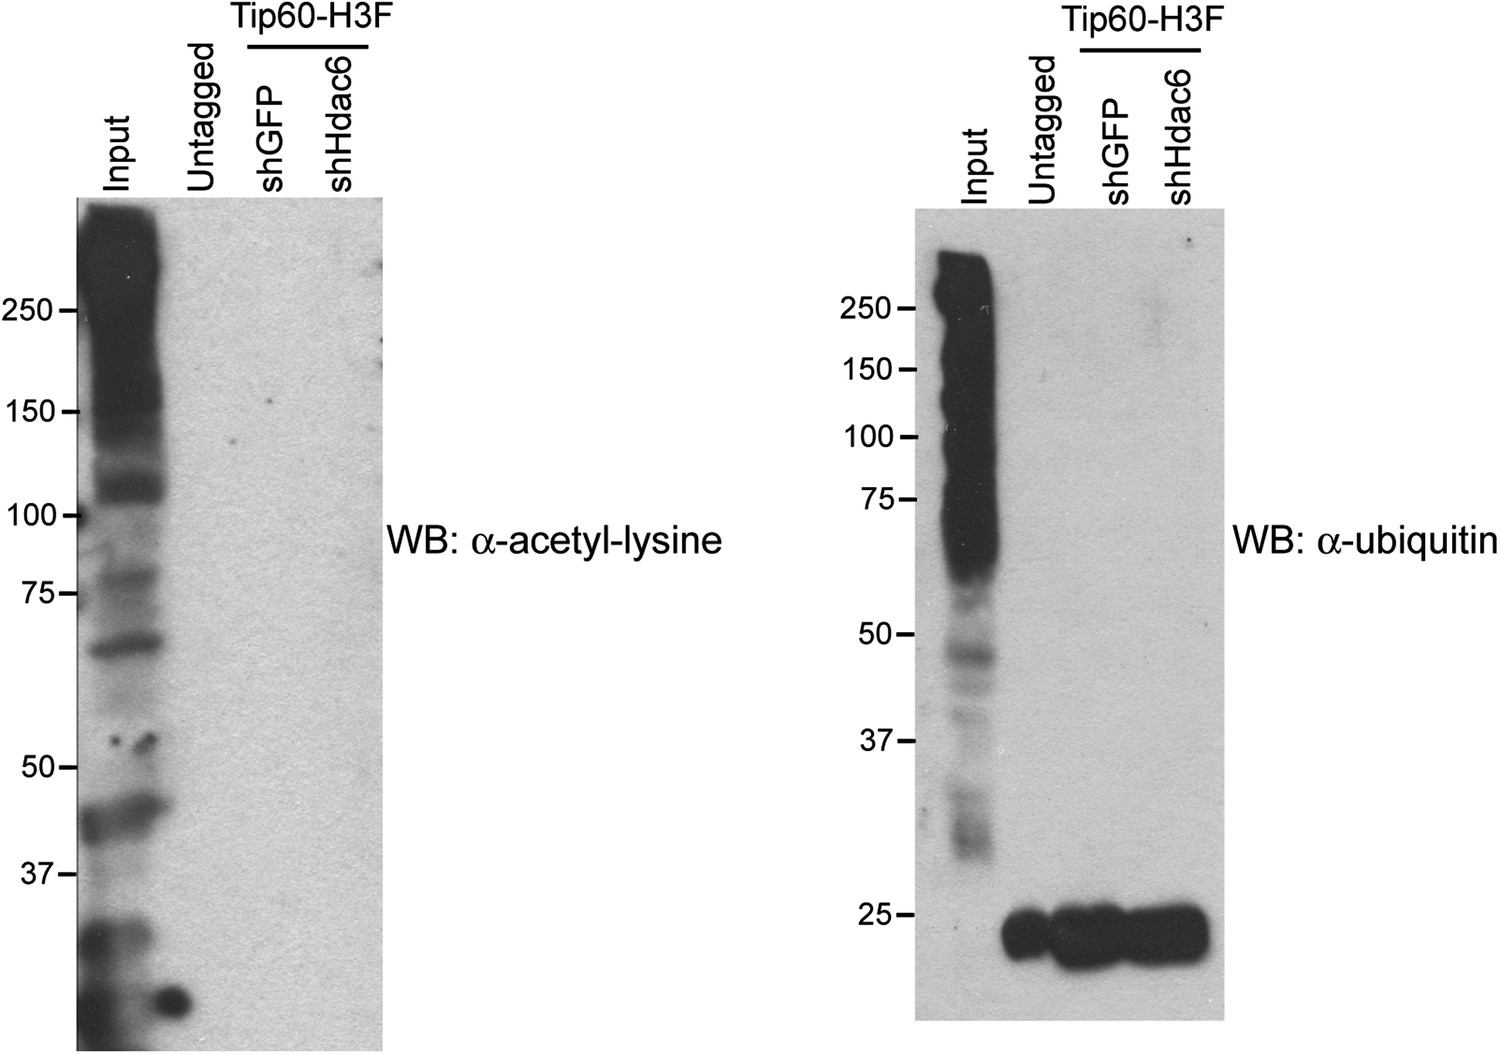
Hdac6 KD does not induce Tip60-p400 acetylation or ubiquitination.
Tip60-p400 complex purified from control or Hdac6 KD Tip60-H3F ESCs or untagged ESCs Western blotted with antibodies recognizing acetylated lysine (left) or ubiquitin (right). Note that the background band in the ubiquitin western blot is also found in the untagged control, and is therefore non-specific.
Figure 6 with 3 supplements
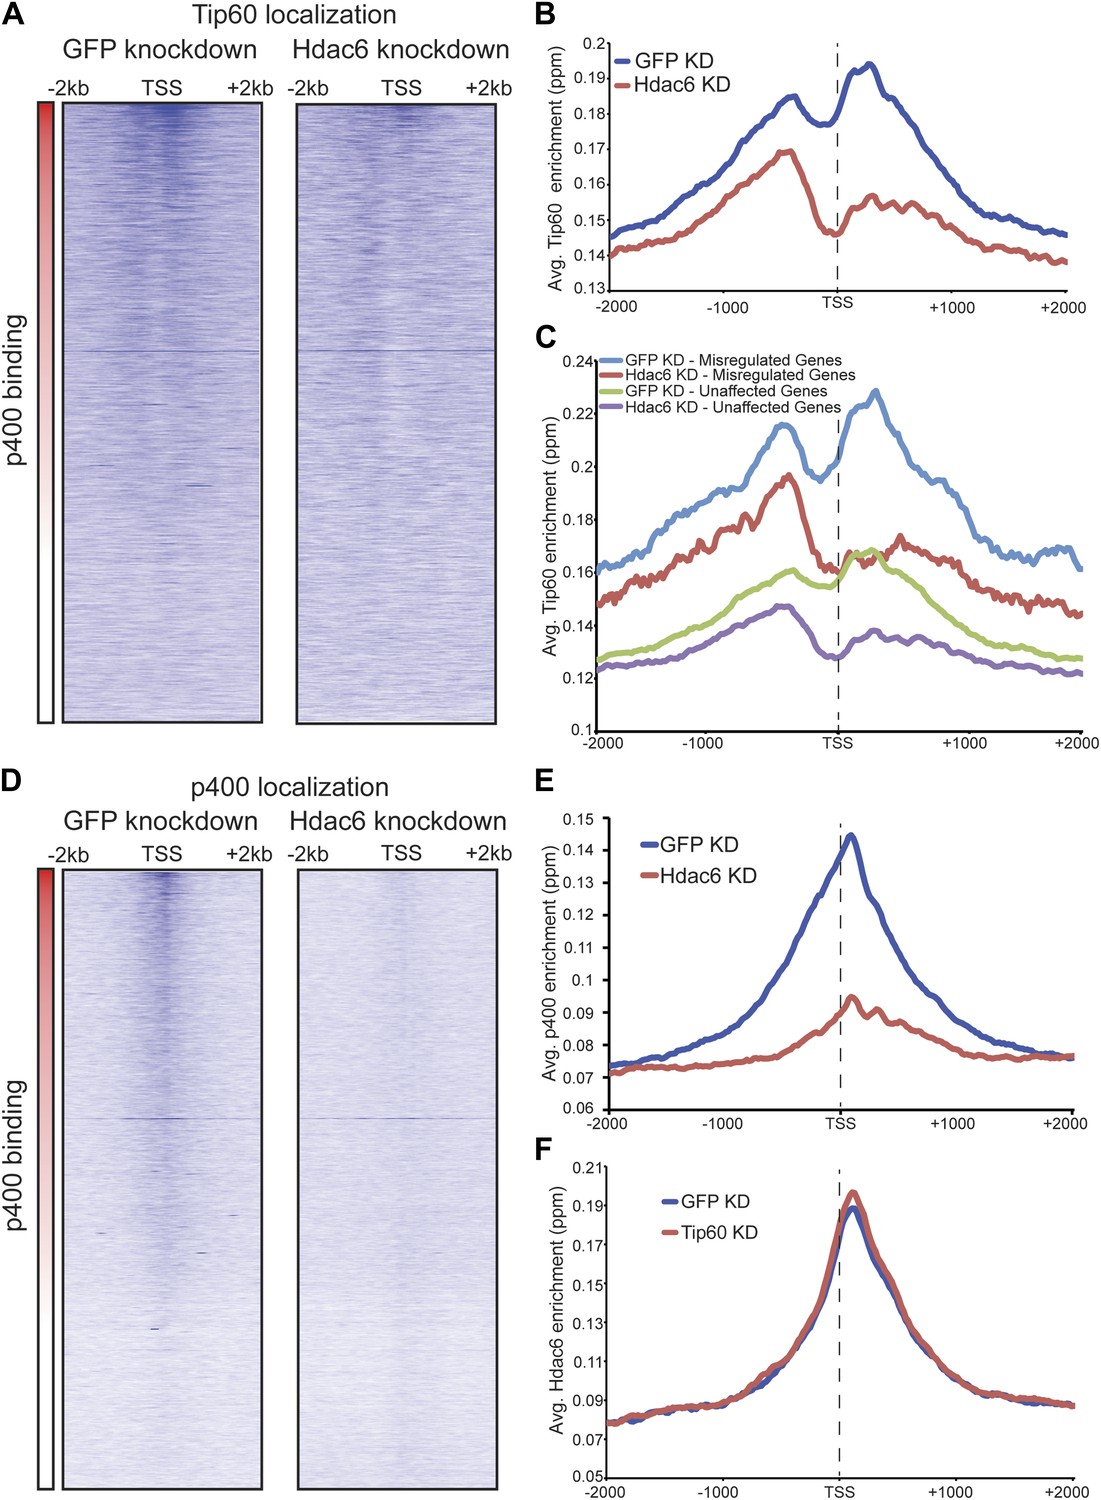
Hdac6 is necessary for normal Tip60 binding to its targets on chromatin.
(A) Heat map representations of Tip60 binding as measured by ChIP-seq in Tip60-H3F ESCs upon GFP KD or Hdac6 KD. Data are sorted by p400 binding as in Figure 3A. (B) Averaged Tip60 binding upon GFP KD or Hdac6 KD are shown relative to the TSS. (C) Hdac6 KD mainly reduces Tip60 enrichment at genes that are misregulated upon Tip60 KD. Average Tip60 binding profiles upon GFP KD or Hdac6 KD are shown for genes misregulated upon Tip60 KD (adjusted p<0.1) and genes that are unaffected. (D) Heat map representations of p400 binding as measured by ChIP-seq using an antibody against endogenous p400 in control and Hdac6 KD ESCs. Genes are sorted exactly as in (A). (E) Average p400 binding profiles upon GFP KD or Hdac6 KD are shown relative to the TSS. (F) Tip60 KD does not affect Hdac6 binding. Average Hdac6 binding profiles upon GFP KD or Hdac6 KD are plotted as in (B and E).
Figure 6—figure supplement 1

Reduced levels of Tip60 binding to differentiation genes upon Hdac6 KD.
(Left) Example genomic loci showing Tip60 binding as measured by ChIP-seq upon GFP KD or Hdac6 KD. The first two panels show that Tip60 binding to the promoter regions of highly expressed genes (Rps9, Rpl27a) is relatively unaffected by Hdac6 KD. The second two panels show that Tip60 binding to the promoter regions of differentiation genes (Nodal, Nefl) is strongly reduced downstream of the TSS upon Hdac6 KD. (Right) Anti-FLAG ChIP-qPCR data are shown for the indicated ESCs at the promoter-proximal regions of the target genes shown. Note that Speer2 is a negative control locus to which Tip60-p400 does not bind. Data shown are mean ± SD of three technical replicates from one representative experiment of two biological replicates performed.
Figure 6—figure supplement 2
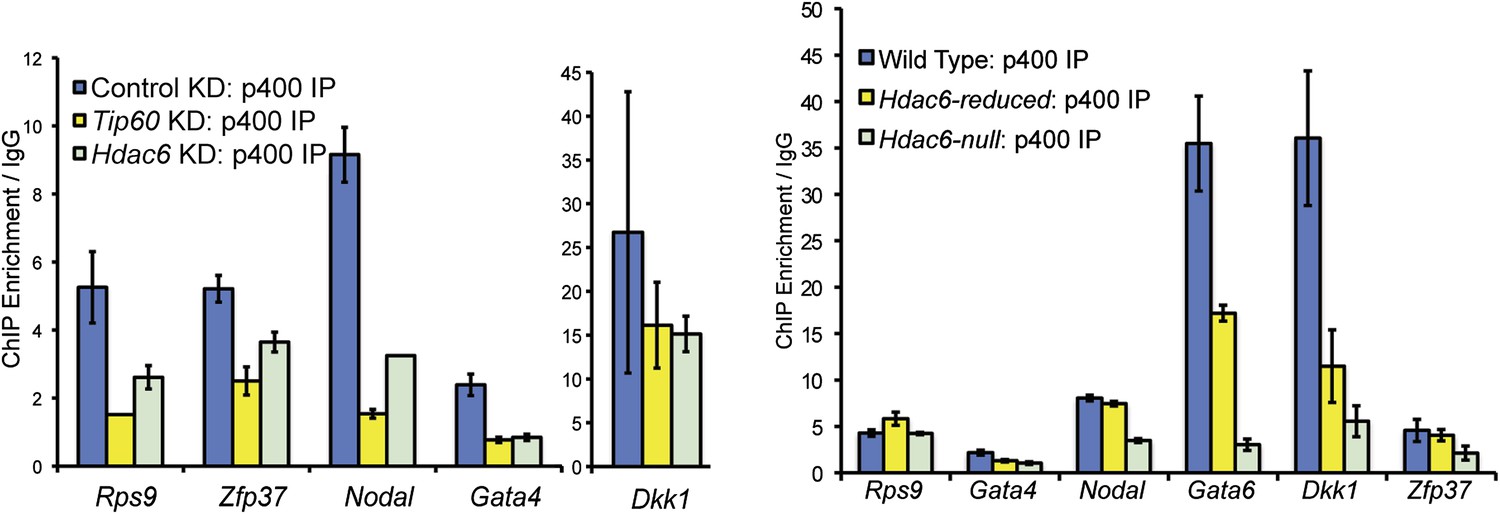
Reduced levels of p400 binding to differentiation genes upon Hdac6 KD.
Effects of Tip60 or Hdac6 KD (left) or mutation (right) on p400 binding to target genes. Anti-p400 ChIP-qPCR data are shown for the indicated KDs/mutations at the promoter-proximal regions of target genes. Data are normalized to IgG background ChIPs. Data shown are mean ± SD of three technical replicates from one representative experiment of two biological replicates performed.
Figure 6—figure supplement 3
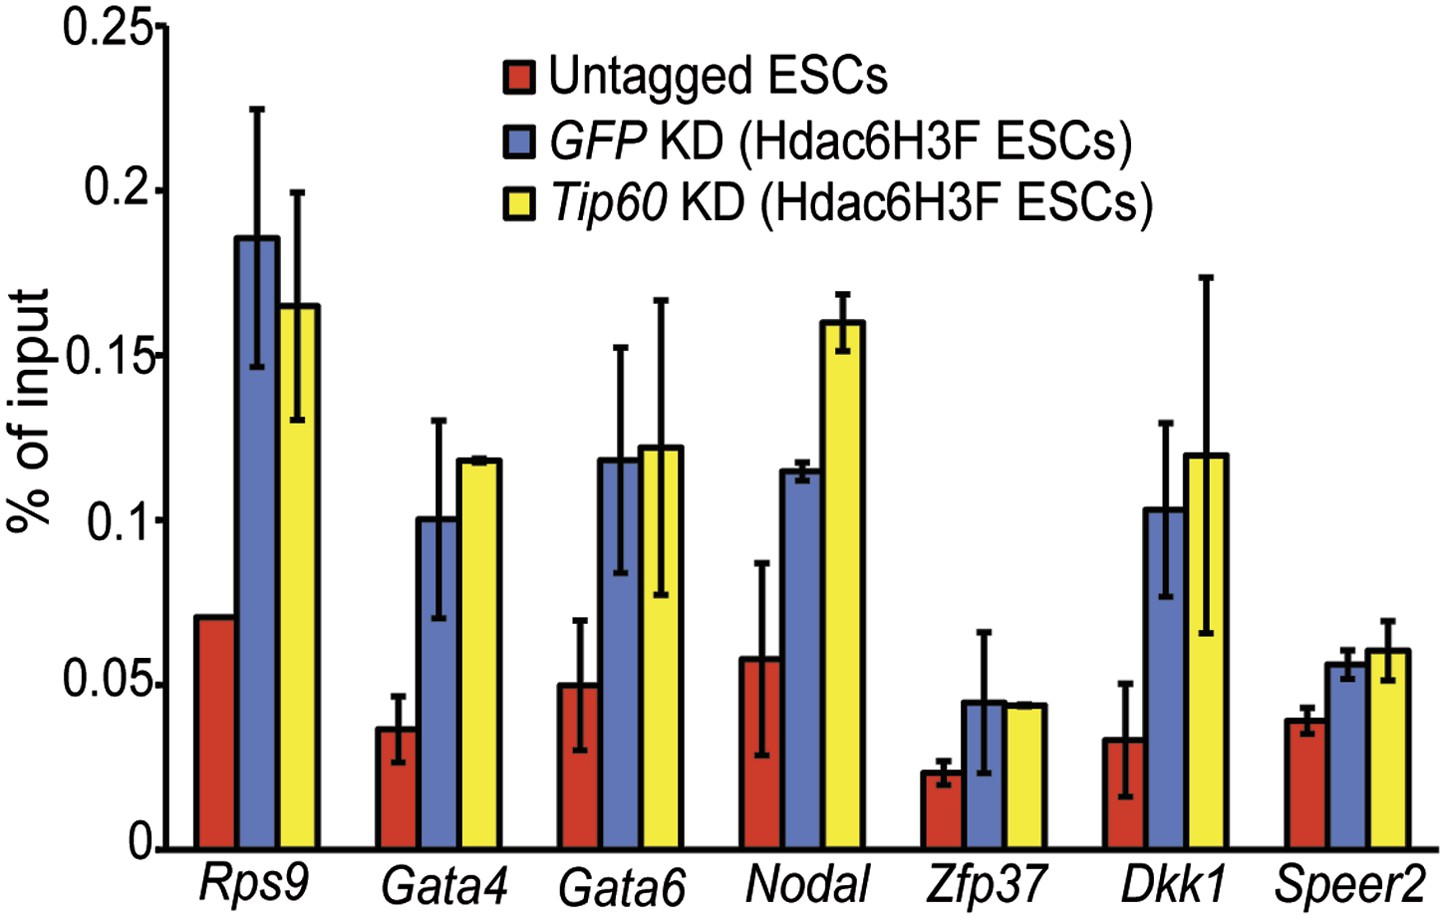
Hdac6 binding is unaffected by Tip60 KD.
Anti-FLAG ChIP-qPCR data are shown for the indicated ESCs at the promoter-proximal regions of target genes. Data shown are mean ± SD of three technical replicates from one representative experiment of two biological replicates performed.
Figure 7
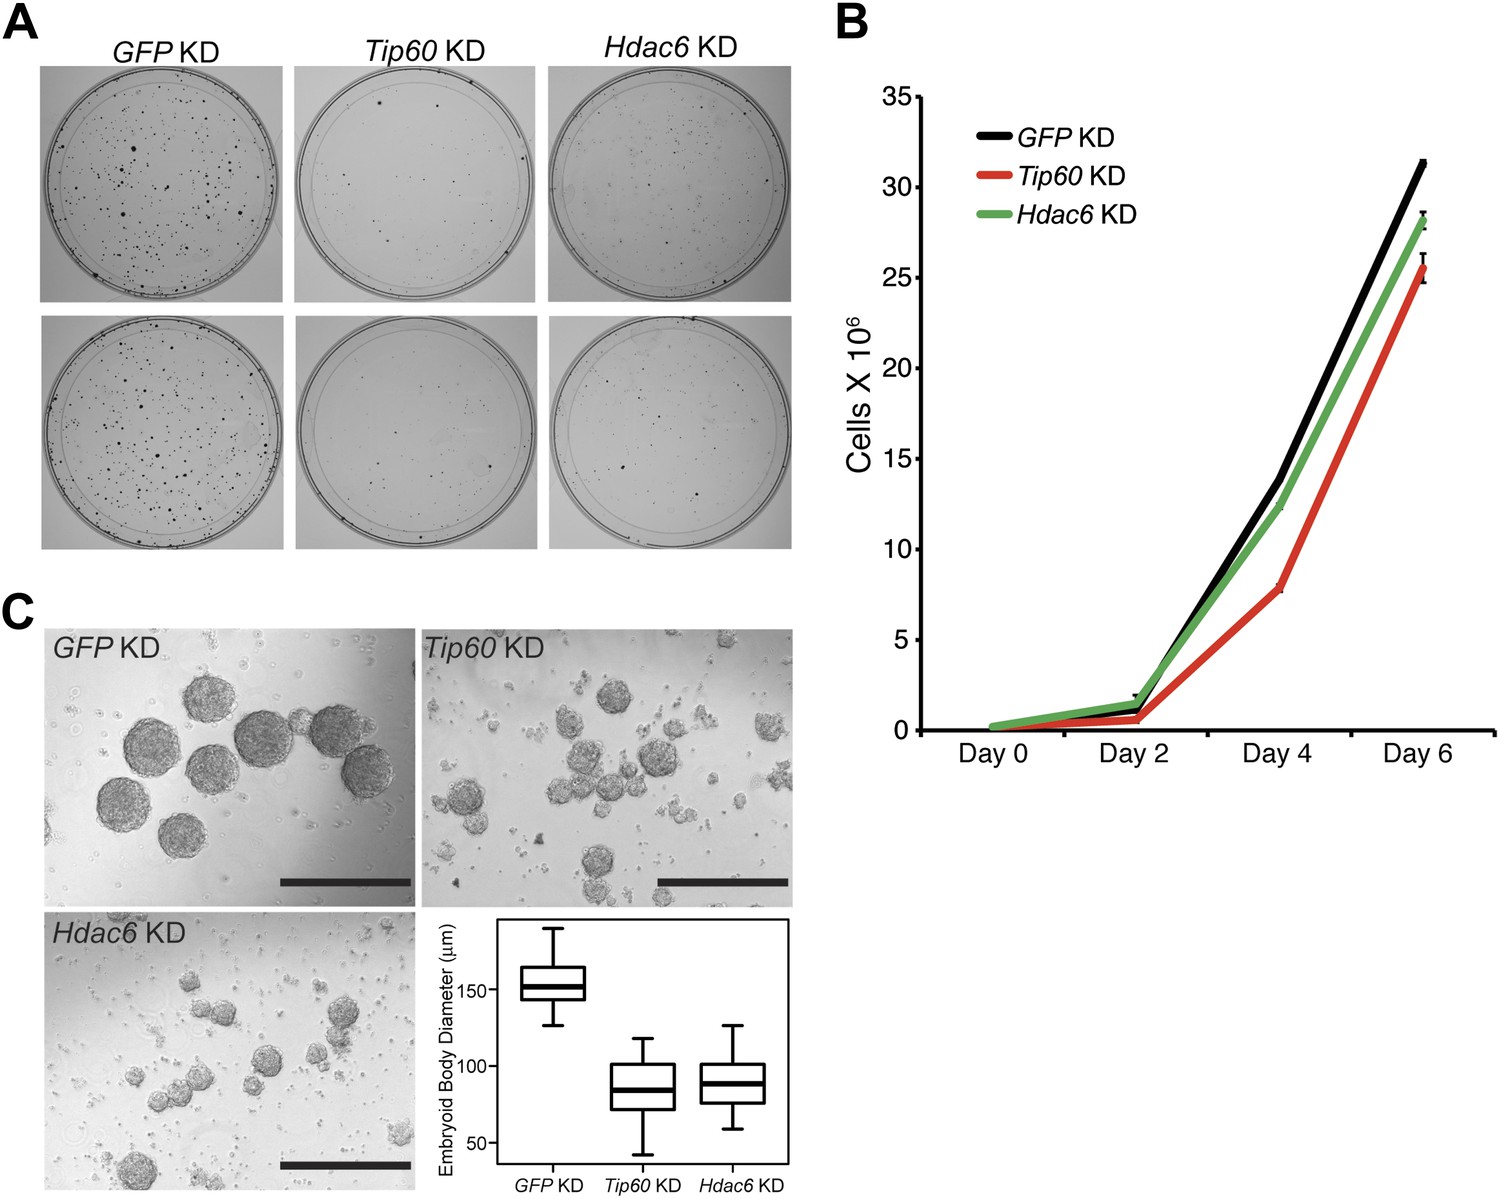
Hdac6 is necessary for ESC colony and EB formation.
(A) Colony formation assays. Indicated KD ESCs were plated at clonal density and grown for seven days, at which time they were stained with crystal violet for visualization. (B) Growth curve. ESCs were infected with shRNA expressing viruses as shown and cultured in normal ESC medium. Cells were counted at the times indicated. (C) EB formation assay. Left and upper right: Brightfield images of EBs formed by hanging-drop cultures of ESCs knocked down as indicated, then cultured in differentiation medium, as described in ‘Materials and methods’. Scale bars equal 400 μm. Lower right: box plot quantification of the range of EB sizes by diameter. The upper and lower limits of the box correspond to the 75th and 25th percentiles of each KD, respectively, and the dark line corresponds to the median of each box. At least 88 EBs were measured for each KD.
Figure 8
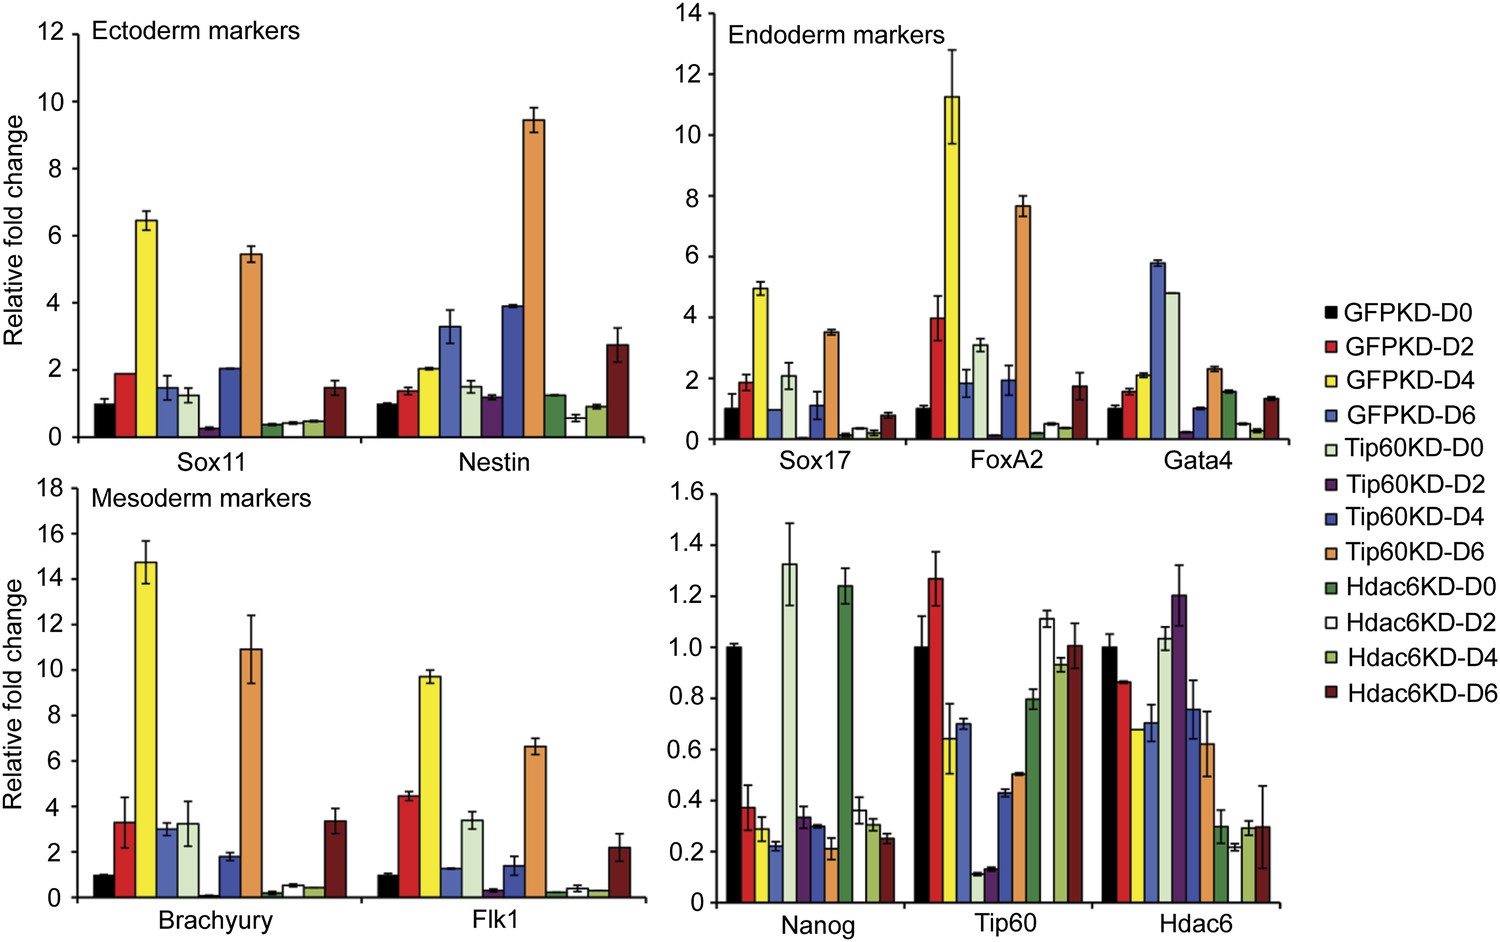
Impaired differentiation of Hdac6 KD ESCs.
Indicated KDs were differentiated for 0, 2, 4, or 6 days. At the indicated time points, RNA was isolated and RT-qPCR quantification of several differentiation markers of each primary germ layer was performed. Data shown are mean ± SD of three technical replicates from one representative experiment of two biological replicates performed.
Figure 9
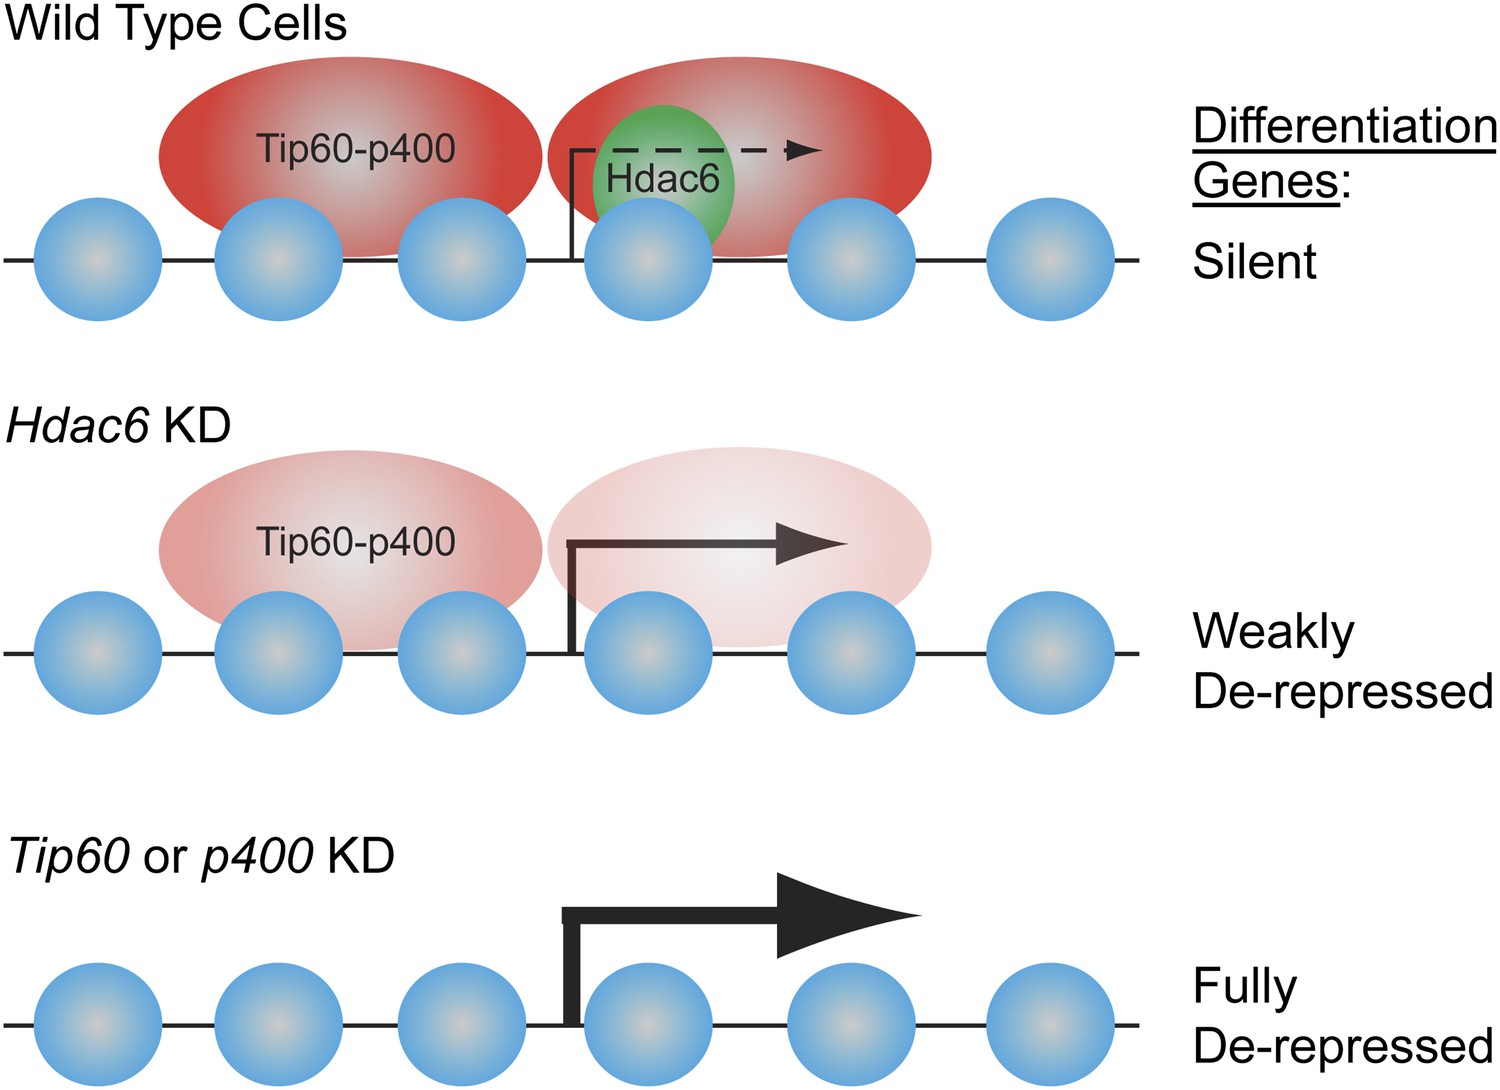
Model for Hdac6- and Tip60-p400-dependent repression of differentiation genes in ESCs.
In the presence of Hdac6, Tip60-p400 binds both upstream and downstream of TSSs and differentiation genes are silenced. In the absence of Hdac6, Tip60-p400 binding is reduced causing de-repression of differentiation genes. Tip60-p400 binding downstream of target TSSs appears to be more strongly affected by Hdac6 KD. Note that Hdac6 also appears to affect the activation of some genes (not depicted), also by recruitment of Tip60-p400 complex.
Tables
Table 1
Proteins co-purifying with Tip60-H3F in ESCs
| Name | Description | # of peptides | MW (kD) | Peptides/MW | Gel slices |
|---|---|---|---|---|---|
| Stk38 | Serine/threonine-protein kinase 38 | 78 | 54 | 1.44 | 7,14,15,16,17 |
| Ruvbl1 | RuvB-like 1 | 42 | 50 | 0.84 | 7,8,13,15,16,17 |
| Ruvbl2 | RuvB-like 2 | 38 | 51 | 0.75 | 15,16,17 |
| Acta1 or other iso | Actin | 21 | 42 | 0.50 | 18 |
| Sun2 | Protein unc-84 homolog B | 36 | 82 | 0.44 | 11,12,13 |
| Hdac6 | Histone deacetylase 6 | 38 | 126 | 0.30 | 1,2,3,4,5,6,7,8 |
| Kat5 | Histone acetyltransferase KAT5 | 17 | 59 | 0.29 | 13,14,15 |
| Actb | Actin, cytoplasmic 1 | 12 | 42 | 0.29 | 5,8,9 |
| Trrap | Transformation/transcription domain-associated protein | 72 | 292 | 0.25 | 1,2 |
| Epc1 | Enhancer of polycomb homolog 1 | 22 | 90 | 0.24 | 9,10 |
| Brd8 | Bromodomain-containing protein 8 | 24 | 103 | 0.23 | 6,7 |
| Yeats4 | YEATS domain-containing protein 4 | 6 | 27 | 0.22 | 20 |
| Epc2 | Enhancer of polycomb homolog 2 | 20 | 91 | 0.22 | 10,11 |
| H2B | Histone H2B | 3 | 14 | 0.21 | 21 |
| Ing3 | Inhibitor of growth protein 3 | 10 | 47 | 0.21 | 16,17 |
| Ep400 | E1A-binding protein p400 | 70 | 337 | 0.21 | 1,2 |
| Dmap1 | DNA methyltransferase 1-associated protein 1 | 10 | 53 | 0.19 | 14,15 |
| Hspa8 | Heat shock cognate 71 kDa protein | 13 | 69 | 0.19 | 13 |
| Lima1 | LIM domain and actin-binding protein 1 | 15 | 84 | 0.18 | 9,10 |
| Vps72 | Vacuolar protein sorting-associated protein 72 homolog | 7 | 41 | 0.17 | 16,17 |
| Actl6a | Actin-like protein 6A | 8 | 47 | 0.17 | 17,18 |
| Actg1 | Actin, cytoplasmic 1 | 6 | 42 | 0.14 | 19 |
| H2afv | Histone H2A.V | 2 | 14 | 0.14 | 22 |
| Meaf6 | Chromatin modification-related protein MEAF6 | 3 | 22 | 0.14 | 20 |
| Mbtd1 | MBT domain-containing protein 1 | 8 | 71 | 0.11 | 13,14 |
| Rps18 | 40S ribosomal protein S18 | 2 | 18 | 0.11 | 21 |
| Tubb5 | Tubulin beta-5 chain | 5 | 50 | 0.10 | 16 |
| Tuba1a or other iso | Tubulin alpha chain | 5 | 50 | 0.10 | 16 |
| Trim28 | Transcription intermediary factor 1-beta | 8 | 89 | 0.09 | 9,10 |
| Morf4l2 | Mortality factor 4-like protein 2 | 3 | 34 | 0.09 | 19 |
| Mrgbp | MRG-binding protein | 2 | 24 | 0.08 | 20 |
| Rangap1 | Ran GTPase-activating protein 1 | 5 | 64 | 0.08 | 12 |
| Spna2 | Spectrin alpha chain, brain | 18 | 285 | 0.06 | 3 |
| Setx | Probable helicase senataxin | 18 | 298 | 0.06 | 2,3 |
| Sf3b1 | Splicing factor 3B subunit 1 | 3 | 54 | 0.06 | 6 |
| Sfpq | Splicing factor, proline- and glutamine-rich | 4 | 75 | 0.05 | 10 |
| Rab5c | Ras-related protein Rab-5C | 1 | 23 | 0.04 | 20 |
| Lrrfip2 | Leucine-rich repeat flightless-interacting protein 2 | 2 | 47 | 0.04 | 16 |
| Stat2 | Signal transducer and activator of transcription 2 | 2 | 50 | 0.04 | 8 |
| Nono | Non-POU domain-containing octamer-binding protein | 2 | 55 | 0.04 | 15 |
| Tpr | Nucleoprotein TPR | 6 | 274 | 0.02 | 3 |
| Hnrnpf | Heterogeneous nuclear ribonucleoprotein F | 1 | 46 | 0.02 | 17 |
| Spnb2 | Spectrin beta chain, brain 1 | 5 | 274 | 0.02 | 3 |
| Flna | Filamin-A | 4 | 281 | 0.01 | 3 |
| Flii | Protein flightless-1 homolog | 2 | 145 | 0.01 | 6 |
| Hdx | Highly divergent homeobox | 1 | 77 | 0.01 | 11 |
| Morf4l1 | Mortality factor 4-like protein 1 | 0 | 41 | 0 | N/A |
-
Proteins in bold represent known Tip60-p400 subunits found in Tip60-H3F purification from ESCs. The protein in bold italic represents the known Tip60-p400 subunit not found in purification from ESCs.
Additional files
-
Supplementary file 1
A. ChIP-qPCR primers used. B. RT-qPCR primers used.
- https://doi.org/10.7554/eLife.01557.033
Download links
A two-part list of links to download the article, or parts of the article, in various formats.
Downloads (link to download the article as PDF)
Open citations (links to open the citations from this article in various online reference manager services)
Cite this article (links to download the citations from this article in formats compatible with various reference manager tools)
Hdac6 regulates Tip60-p400 function in stem cells
eLife 2:e01557.
https://doi.org/10.7554/eLife.01557


