Endogenous RNA interference is driven by copy number
- The Babraham Institute, United Kingdom
Figures
Figure 1
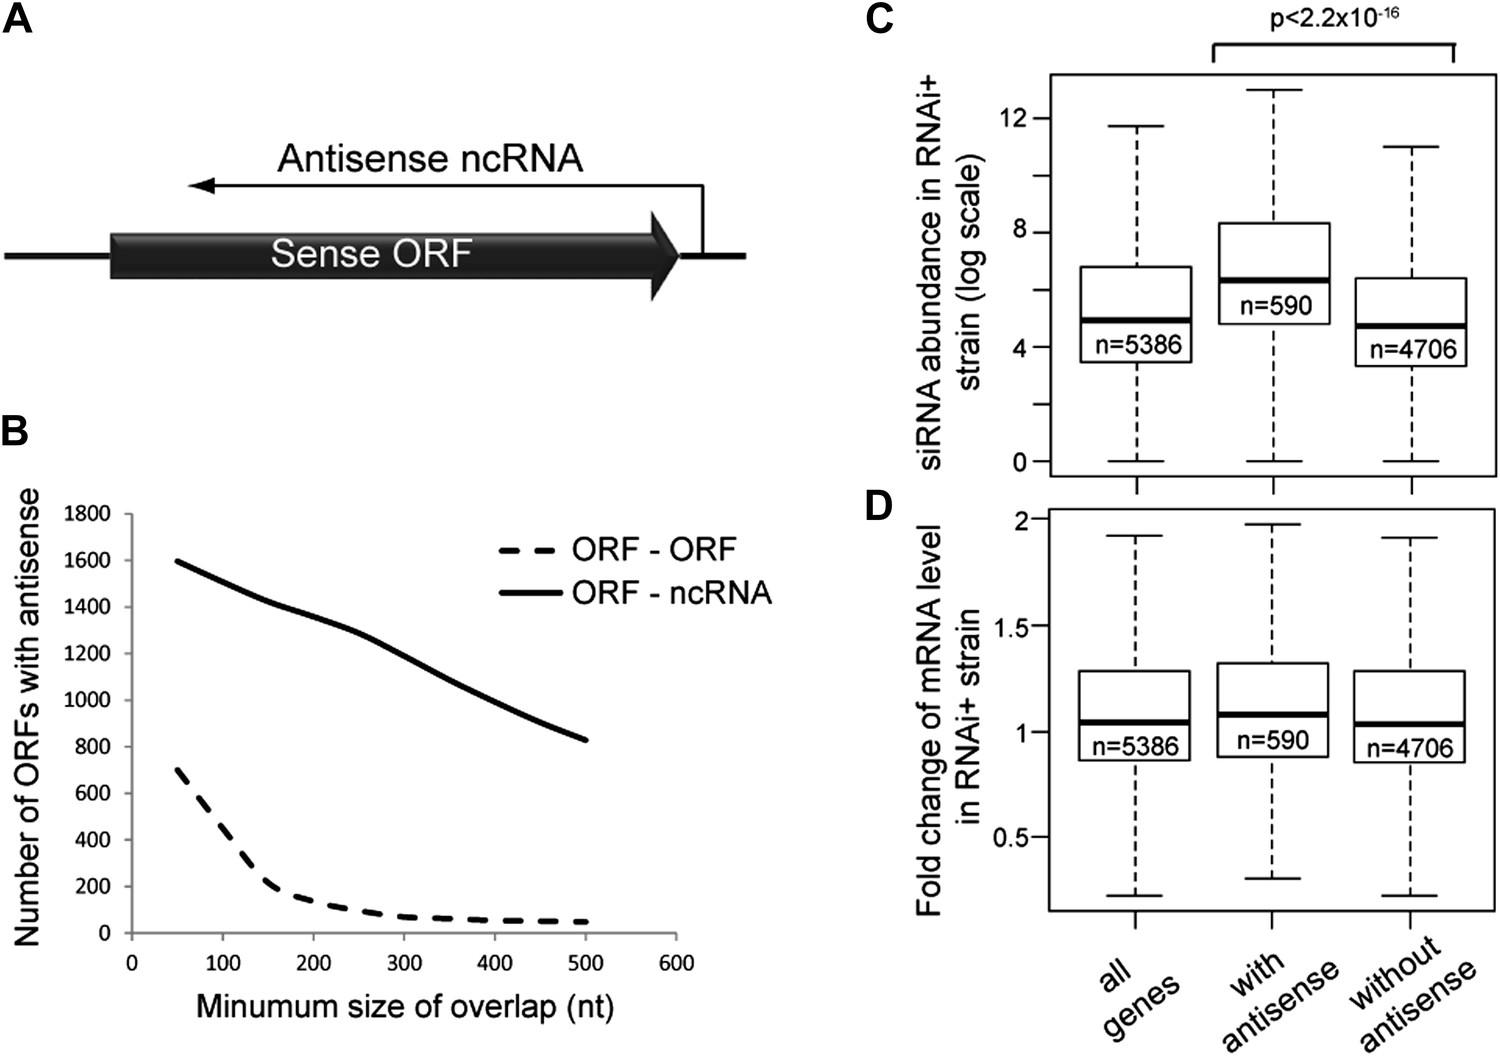
Frequency of annotated antisense non-protein coding RNAs (ncRNAs) and effects on mRNA abundance.
(A) Schematic of an example sense mRNA-antisense (ncRNA) system. (B) Number of annotated open reading frames (ORFs) with antisense transcripts. Positions of CUTs, SUTs, and XUTs were collated with expressed ORFs (Xu et al., 2009; van Dijk et al., 2011), SUTs were later re-classified as XUTs were removed. Overlaps between ORFs expressed in glucose media (total 5171, Xu et al., 2009) and other RNAs were calculated and summed for increasing minimum overlaps of 50–500 bp. ORF–ORF overlaps and ORF–ncRNA overlaps were analyzed separately as ORF–ORF overlaps are consistently smaller. Detailed figures are given in Table 1. (C) Abundance of short interfering RNAs (siRNAs) in RNA interference (RNAi)+ strain produced from expressed ORFs with and without an annotated overlapping antisense ncRNA, based on read counts from published high-throughput sequencing data (Drinnenberg et al., 2011). Minimum antisense overlap with ORF was set at 250 bp; only ORFs with >100 reads in the wild-type poly(A)+ library were assessed to remove noise. Stated p value calculated by Student’s t test. (D) Abundance of mRNA in RNAi+ cells relative to wild-type; data source and categories as in C, differences were not significant.
Figure 2 with 1 supplement
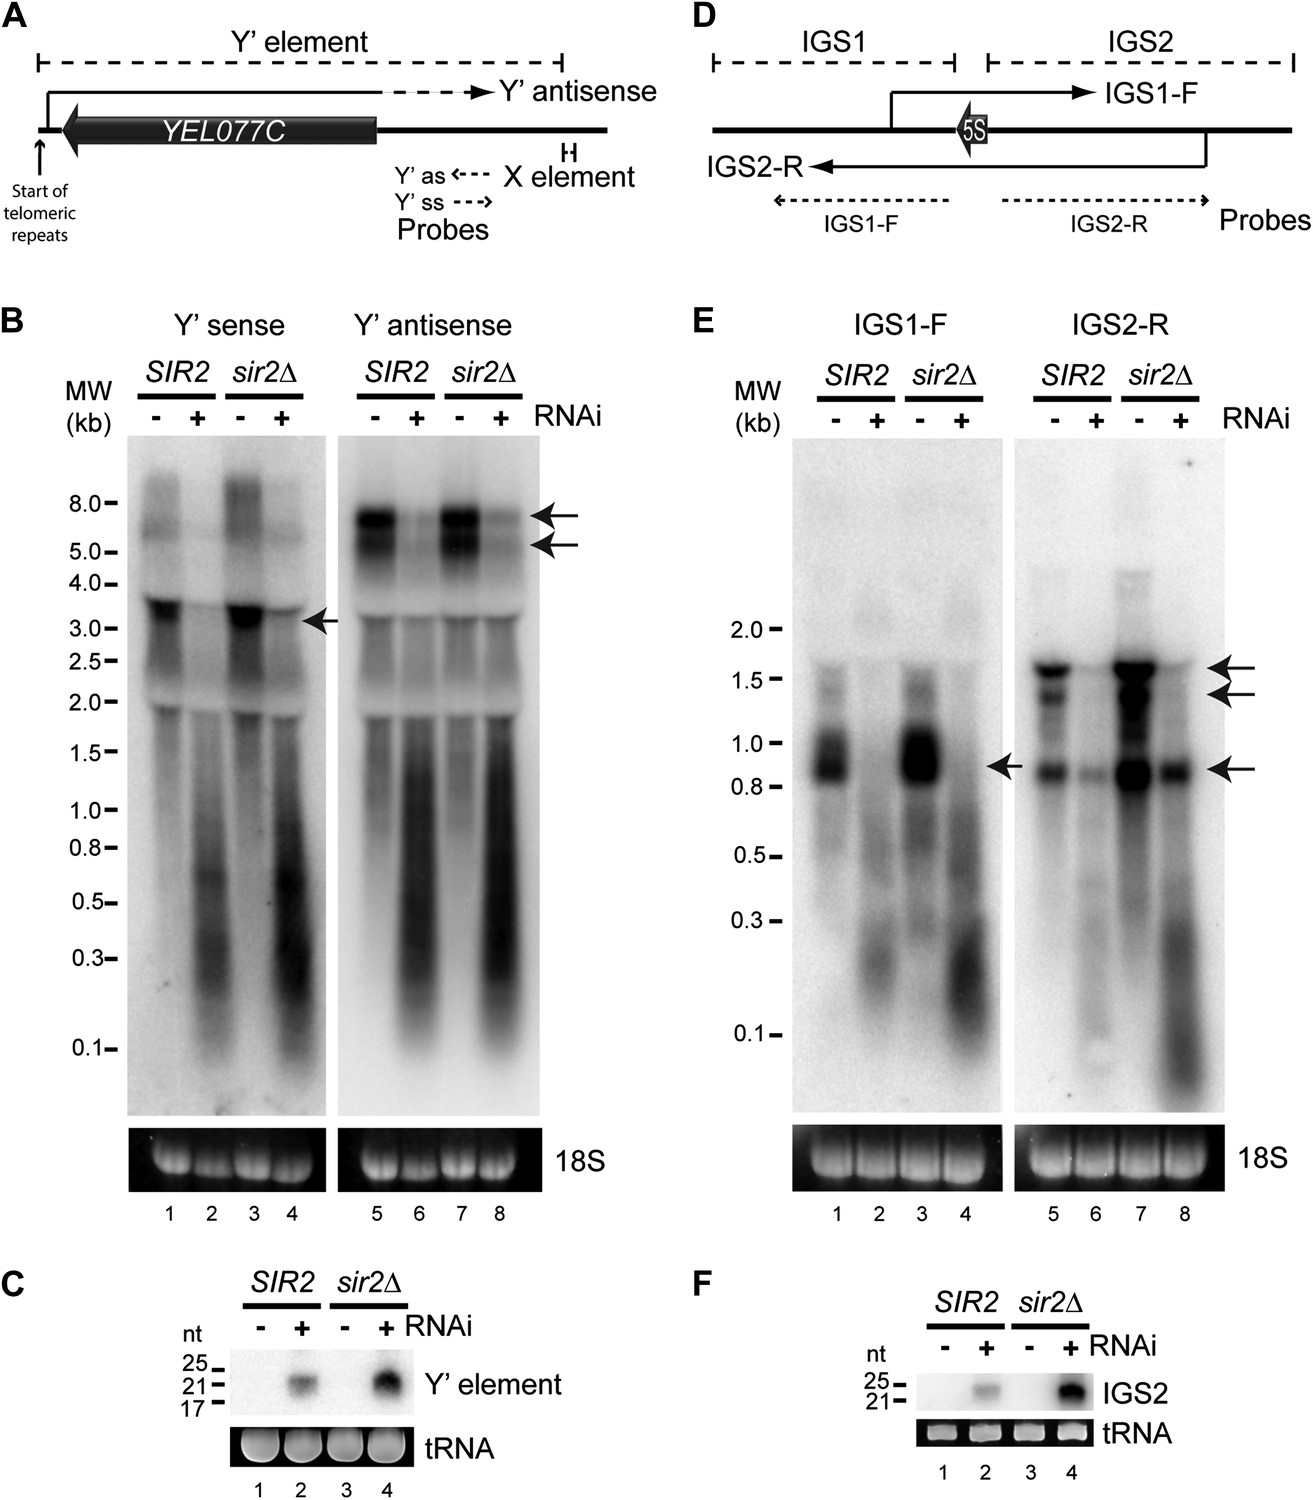
High-copy endogenous sense-antisense pairs instigate efficient RNA interference (RNAi).
(A) Schematic diagram of sub-telomeric Y′ elements. (B) Northern analysis of Y′ element non-protein coding RNAs (ncRNAs) comparing wild-type and RNAi+ strains in SIR2 and sir2Δ backgrounds. 18S ribosomal RNA is shown as a loading control. Arrows indicate full-length RNA species. (C) Northern analysis of Y′ element-derived short interfering RNAs (siRNAs) from cells in B, tRNAs are shown as a loading control. (D–F) Equivalent analysis of rDNA intergenic spacer ncRNAs.
Figure 2—figure supplement 1
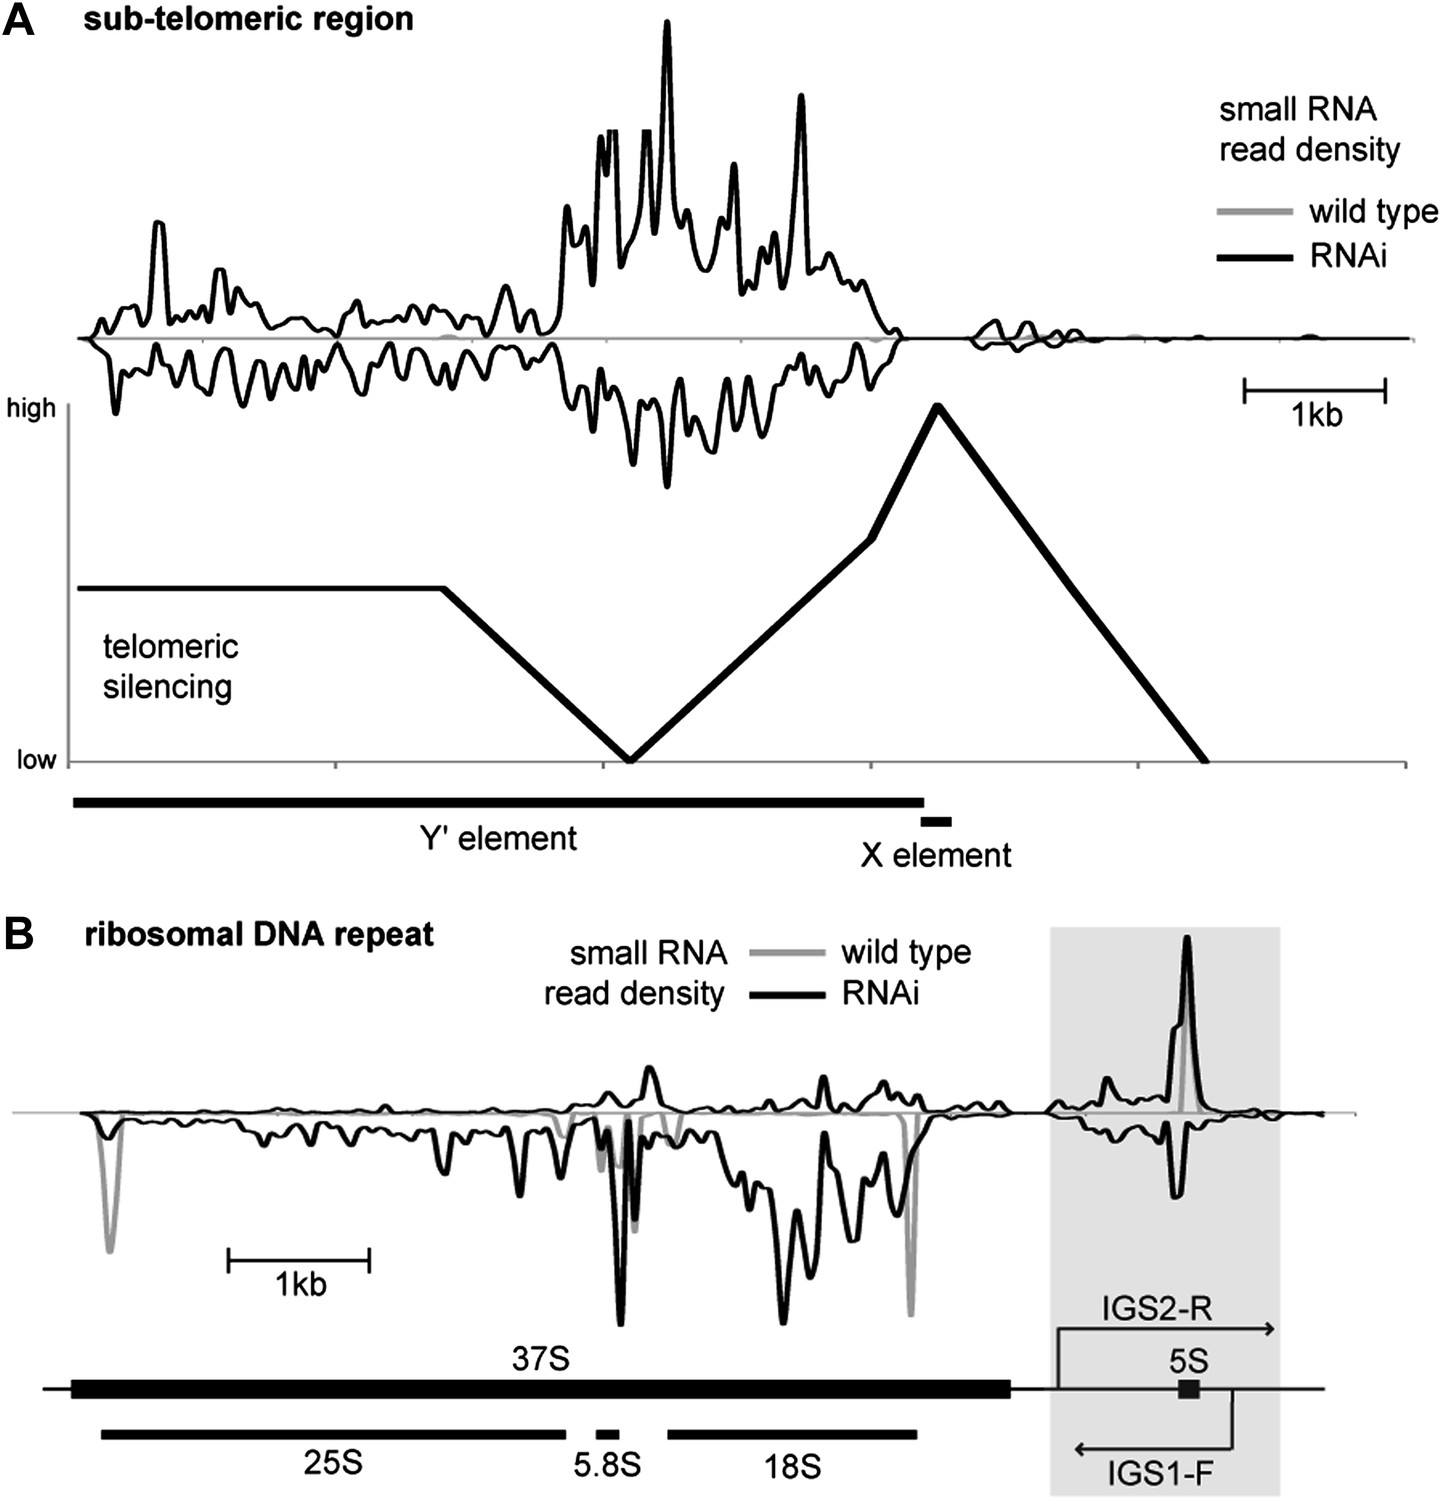
Correlation of short interfering RNAs (siRNAs) with RNA abundance and silencing. Published small RNA sequencing data (Drinnenberg et al., 2011) were re-mapped to the complete Saccharomyces cerevisiae genome including non-unique sequences and reads were then summed in 50 bp bins on each strand.
(A) Density of small RNAs in sub-telomeric Y′ elements in wild-type and RNA interference (RNAi)+ strains compared with published data for silencing efficiency of inserted transgenes (Pryde and Louis, 1999). Separate traces are shown for siRNAs mapping to sense and antisense sequences above and below the x axis, respectively. siRNA density is inversely correlated with transcriptional silencing, as would be expected if siRNAs are produced from sub-telomeric non-protein coding RNAs (ncRNAs). (B) siRNA density in a single rDNA repeat. Many small RNA fragments are produced from the 35S ribosomal RNA gene, as previously observed in Schizosaccharomyces pombe (Buhler et al., 2008); however, a discrete cluster of siRNAs is produced from the overlapping region between the IGS1-F and IGS2-R ncRNAs in the intergenic spacer region (highlighted).
Figure 3 with 6 supplements
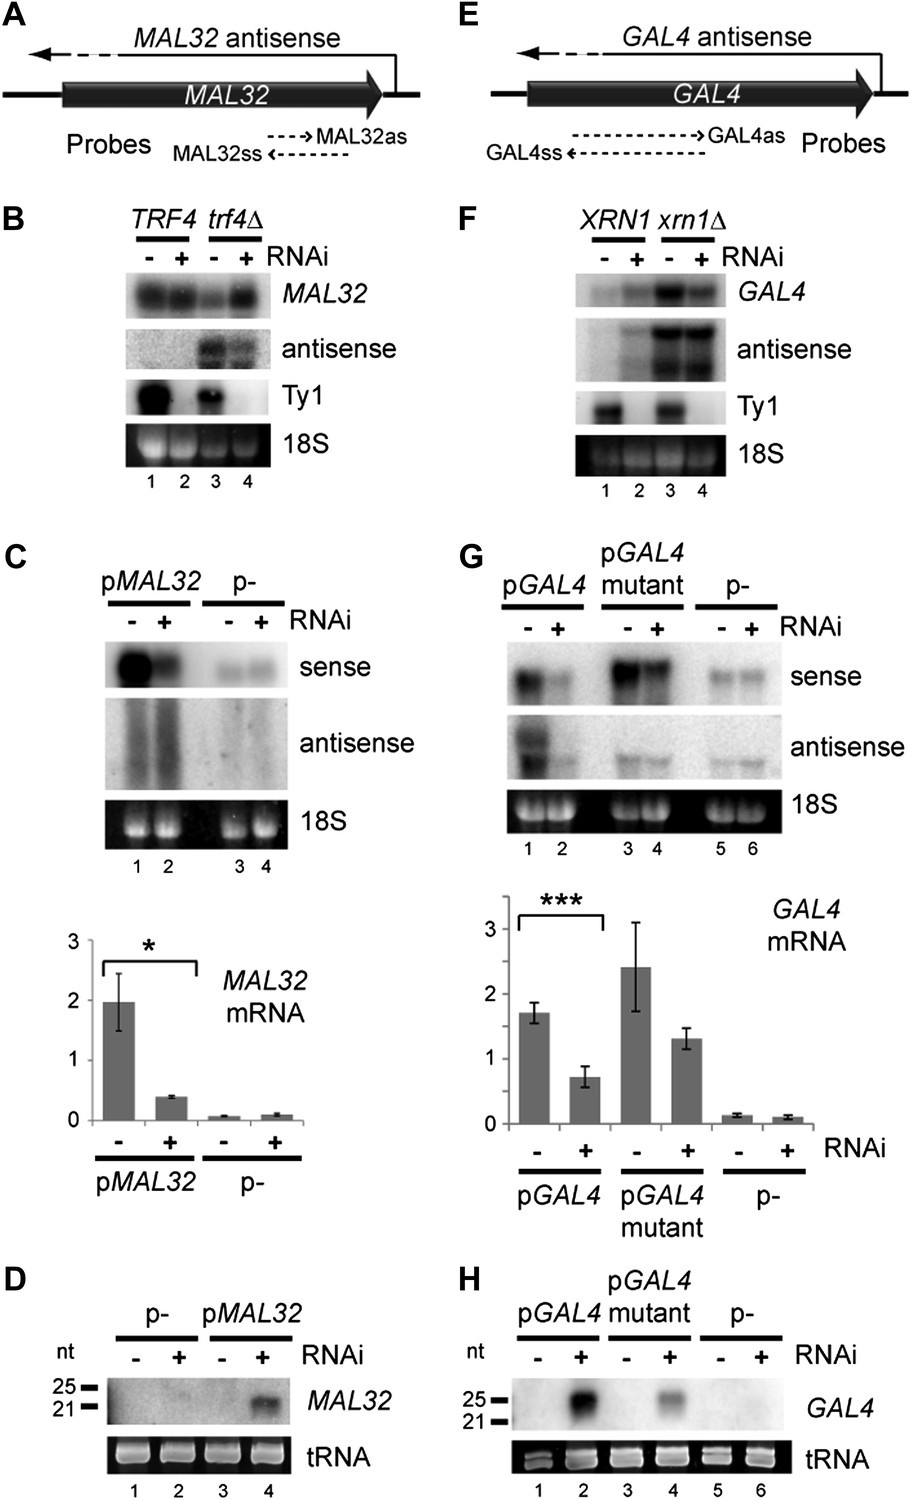
Copy number amplification of coding genes can instigate RNA interference (RNAi).
(A) Schematic of MAL32 locus. (B) MAL32 mRNA and antisense non-protein coding RNA (ncRNA) comparing wild-type and RNAi+ strains in wild-type and trf4Δ backgrounds; cells grown on YP raffinose (extended image and quantification shown in Figure 3—figure supplement 2A). (C) mRNA and antisense ncRNA from MAL32 cloned onto a high-copy plasmid in wild-type and RNAi+ strains. Lanes 3,4 show empty vector control. Antisense panel shows degradation products, no full-length antisense is detectable due to Trf4 activity. (D) Short interfering RNA (siRNA) analysis of cells from C. (E) Schematic of GAL4 locus. (F) GAL4 mRNA and antisense ncRNA in wild-type and RNAi+ strains; cells grown in YP galactose (extended image and quantification shown in Figure 3—figure supplement 2B). (G) mRNA and antisense ncRNA from GAL4 locus cloned onto a high-copy plasmid in wild-type and RNAi + strains. Lanes 5,6 show empty vector, signal is from genomic GAL4; note that cells used here are diploids to mitigate defects in galactose response (see ‘Materials and methods’). Lanes 3,4 show a previously described GAL4 antisense mutant (Geisler et al., 2012); this removes detectable antisense RNA for genomic GAL4, but the mutant sequence still expresses an antisense ncRNA when cloned on the high-copy plasmid (see Figure 3—figure supplement 4). (H) siRNA analysis of cells in G. For quantification, n = 4 biological replicates, error bars represent ± 1se, *p<0.05, ***p<0.01 by Student’s t test, y axes in arbitrary units.
Figure 3—figure supplement 1
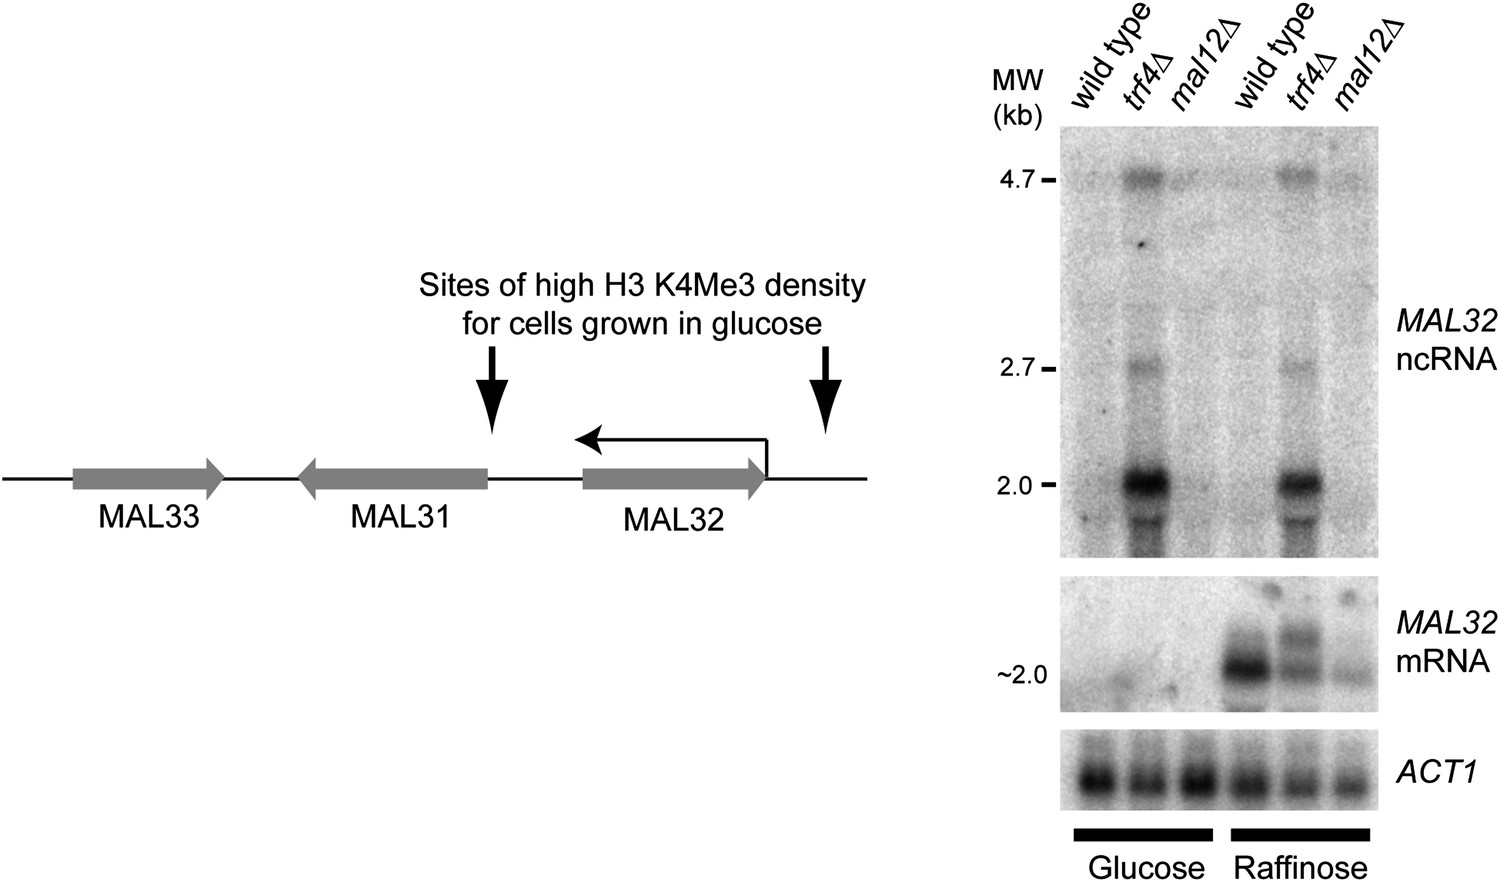
Characterization of the MAL32 sense/antisense system.
Left: diagram of the MAL cluster near telomere at the right hand end of Chr. II. Sites enriched for H3K4 Me3 are indicated for log phase cells grown in glucose (Kirmizis et al., 2007), including an enrichment site at the 3′ end of the MAL32 open reading frame (ORF) corresponding to the antisense non-protein coding RNA (ncRNA) promoter. The Saccharomyces cerevisiae genome contains two MAL clusters; the other is located at the right hand end of Chr. VII and contains the MAL32 paralogue, MAL12, which differs by only a few single-nucleotide polymorphisms in the ORF (99.5% nucleotide identity). Right: northern blot showing MAL32 antisense and mRNA expression in glucose and raffinose. The antisense ncRNA, a major 2 kb transcript with additional 2.7 kb and 4.7 kb species, is ubiquitously expressed but completely degraded by Trf4 in wild-type cells. 5′ RACE analysis in trf4Δ cells (not shown) reveals that the antisense is produced from both MAL32 and MAL12 genes. The mRNA is repressed in glucose, but in raffinose is produced from both loci as revealed by the reduced but detectable mRNA expression in the mal12Δ strain.
Figure 3—figure supplement 2
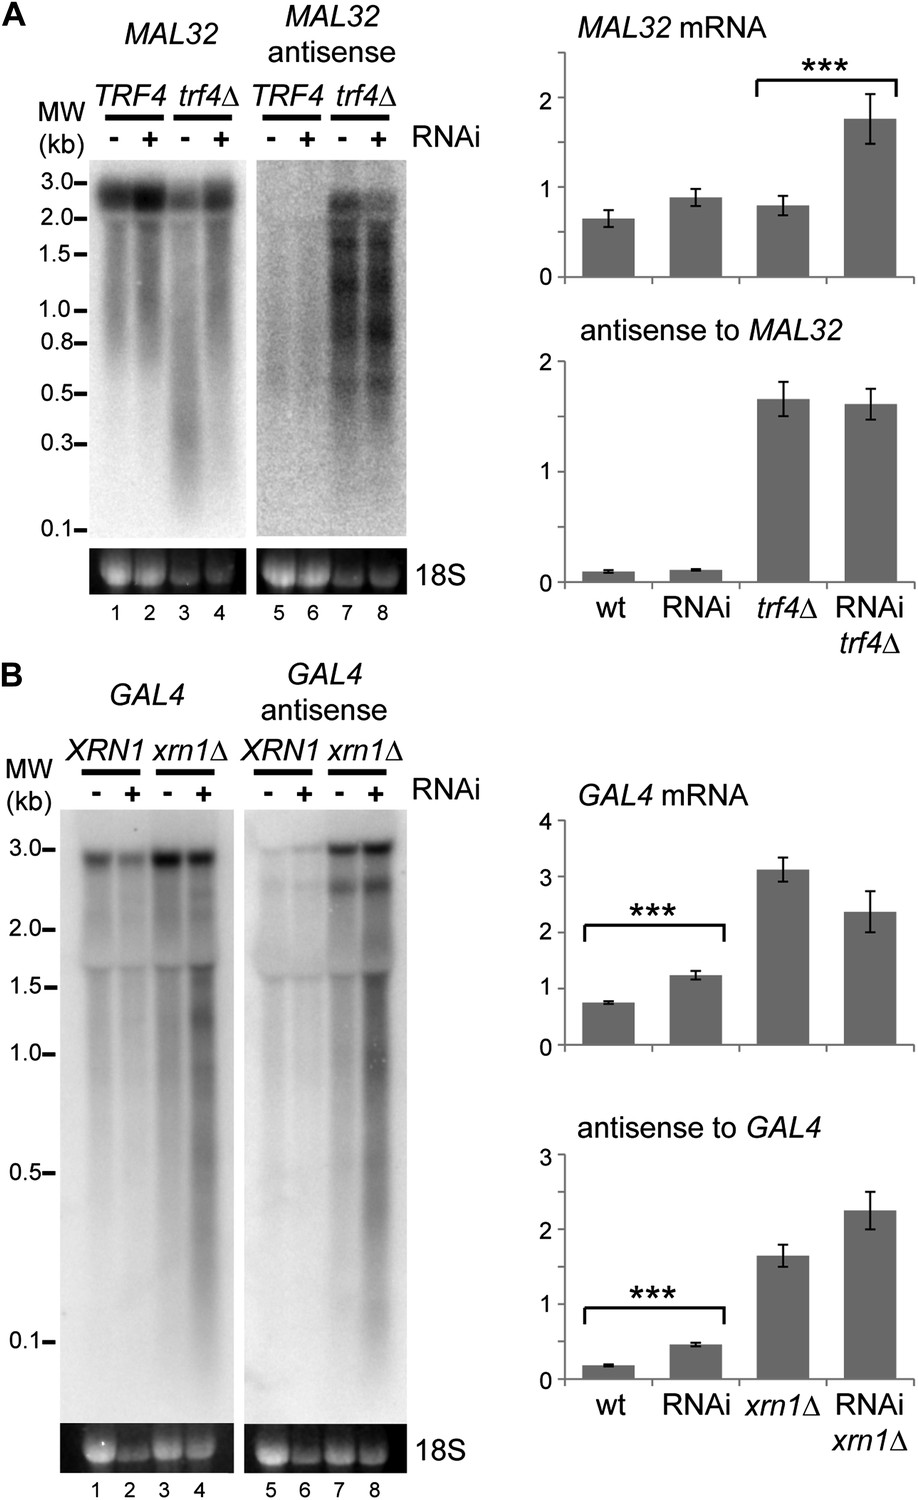
Images and quantification of RNA interference (RNAi) degradation patterns.
(A) Degradation pattern of MAL32 mRNA and antisense non-protein coding RNA (ncRNA) in cells grown on YPRaf. Note the degradation of MAL32 mRNA in the trf4Δ sample (lane 3), which is abolished in the RNAi+ strain. This result was seen in multiple experiments and appears to be an indirect effect of RNAi. The large increase in MAL32 mRNA in the trf4Δ RNAi+ strain compared with trf4Δ results from this loss of RNA degradation. All antisense RNA species are included in the quantification; note that RNAi reduces the level of the full-length antisense RNA but slightly increases some truncated species. (B) Degradation pattern of GAL4 mRNA and antisense ncRNA in cells grown on YPGal. Note that degradation products are clearly visible in RNAi+ xrn1Δ sample even though quantification does not show a significant change in full-length RNAs (compare heterogeneous species of 0.1–3 kb in lanes 4,8 with other lanes). For quantification, n = 4 biological replicates, error bars are ±1se, ***p<0.01 by Student’s t test, y axes in arbitrary units.
Figure 3—figure supplement 3
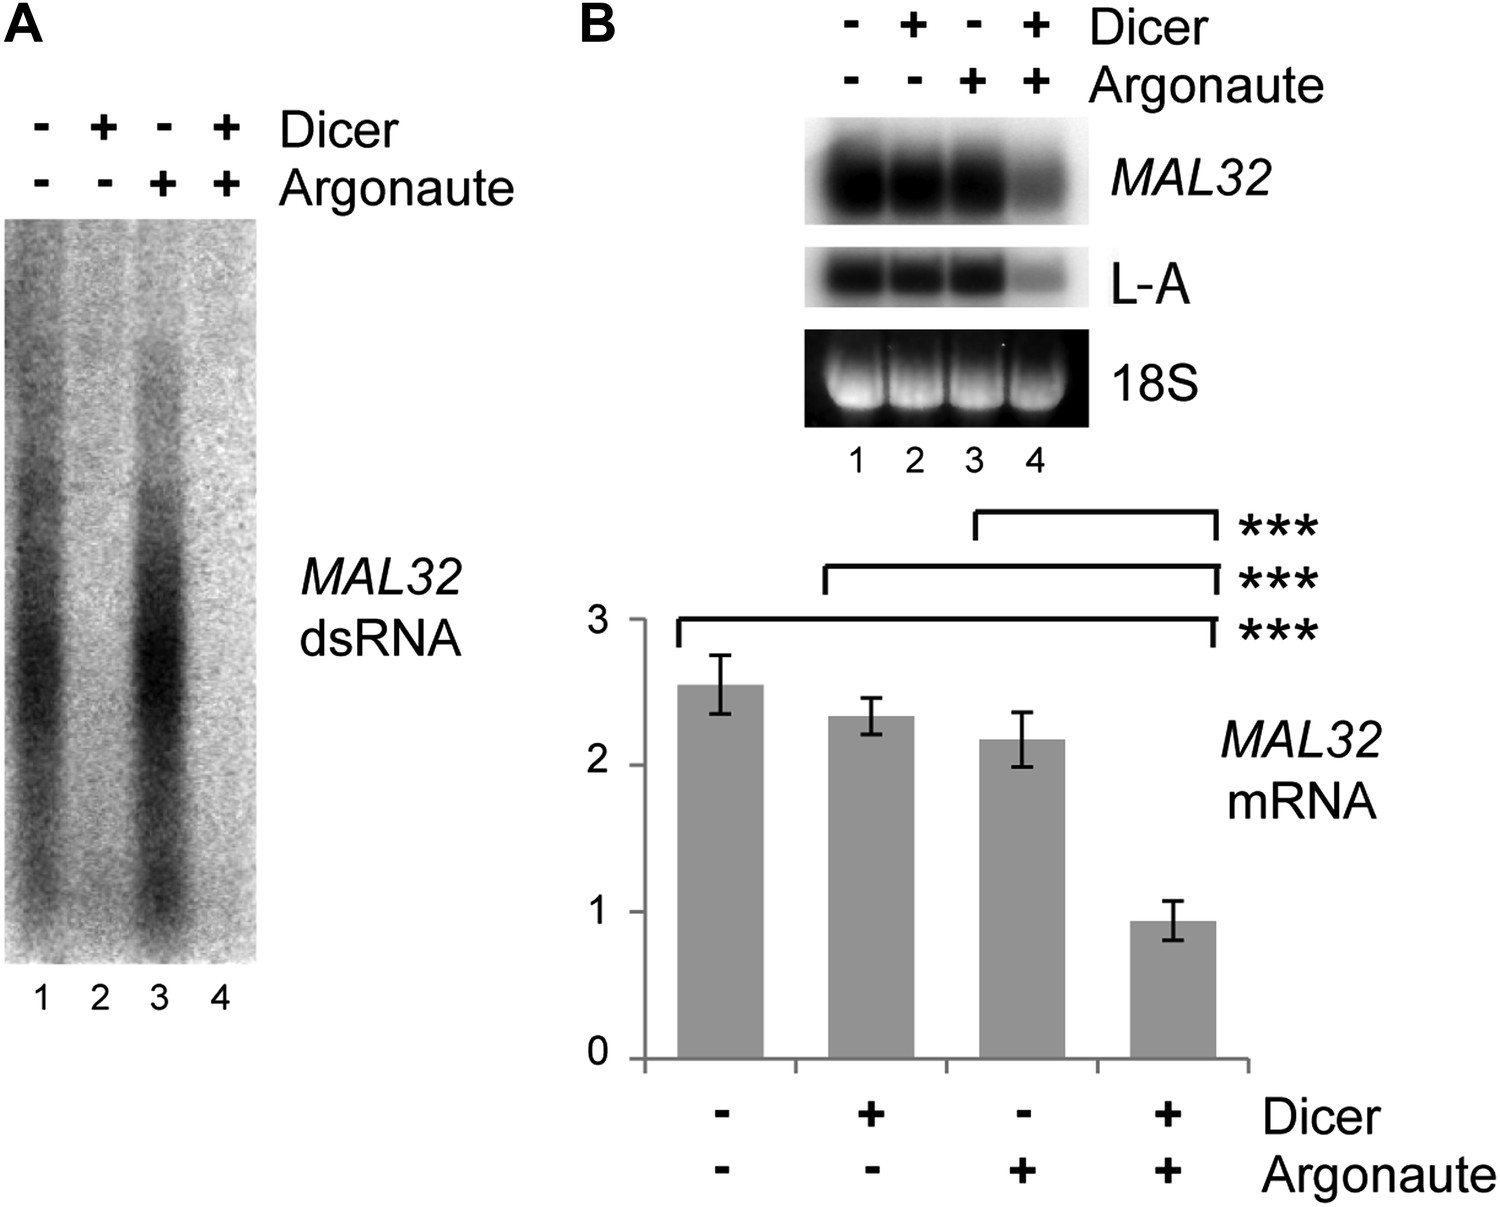
Verification of RNA interference (RNAi) knockdown.
Dicer and Argonaute were cloned out of the RNAi+ strain onto single-copy plasmids and transformed into the BY4741 background along with the MAL32 high-copy plasmid. Cells were grown on raffinose as in Figure 3C. (A) 3 µg RNase A-treated RNA was loaded in each lane to detect double stranded RNA (dsRNA), which is largely resistant to degradation by RNase A. (B) MAL32 mRNA levels, with L-A viral RNA as a positive control. For quantification, n = 3 biological replicates, error bars represent ±1se, ***p<0.01 by Student’s t test.
Figure 3—figure supplement 4
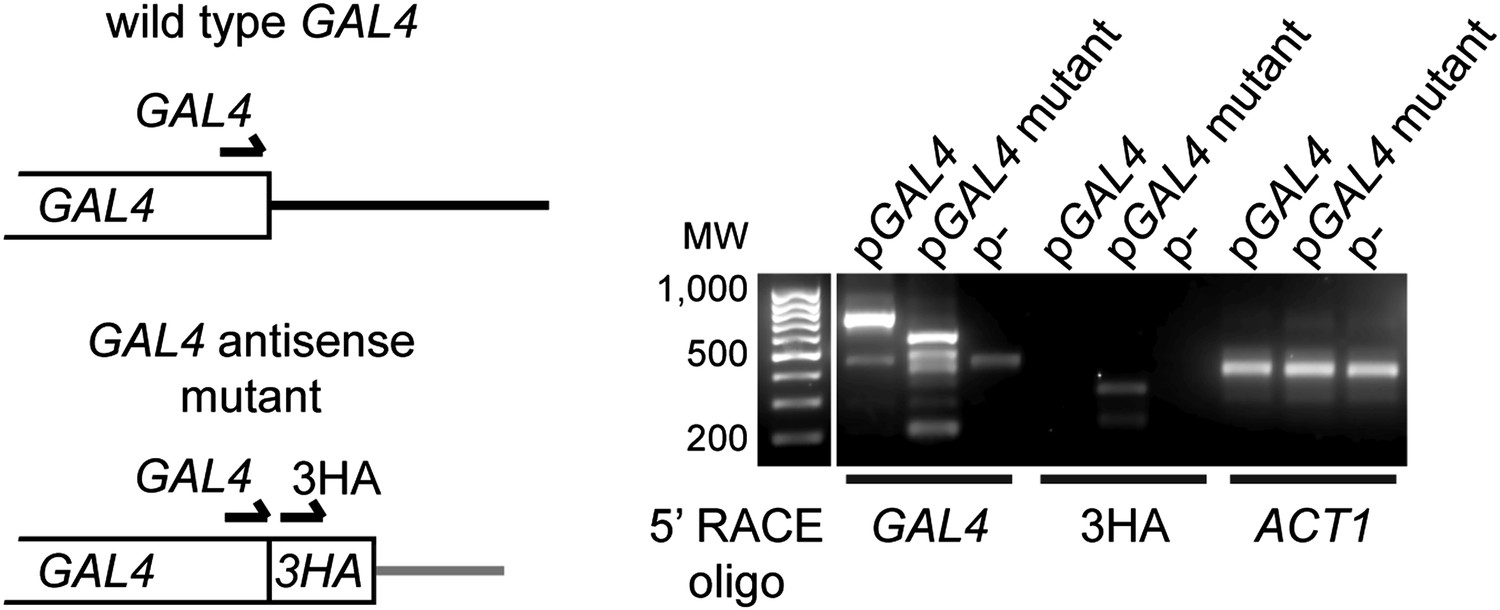
Expression of GAL4 antisense RNA in mutant construct.
Left: structure of the 3′ end of wild-type and mutant GAL4 constructs showing primer locations for 5′ RACE. Right: 5′ RACE for capped RNA present in wild-type cells with the GAL4, GAL4-3HA, or empty plasmids (RNA samples as in Figure 3G lanes 1,3,5). The GAL4 primer detects both wild-type and mutant species, and notably detects a product in the GAL4-3HA construct which is not reported to express an antisense RNA. This product is specific for 3HA as a product is also detected only in this construct with the 3HA primer at the predicted size.
Figure 3—figure supplement 5

Plasmid copy number in high-copy plasmid strains.
(A) Southern blot of wild-type and RNA interference (RNAi)+ ura3Δ cells containing high-copy plasmids for MAL32 and GAL4, with a W303 URA3 wild-type as a quantification control. DNA was extracted from cells grown to stationary phase in selective media, separated on a 1% gel, and probed for URA3 with GAL7 as a loading control. Note that the GAL7 signal is stronger in pGAL4 containing strains as these are diploids as described in ‘Materials and methods’. Plasmid copy numbers were calculated relative to the W303 URA3 signal. (B) Plasmid analysis of MAL32 high-copy plasmid in log-phase cells showing that plasmid copy numbers are similar between wild-type and RNAi+ cells in growth conditions used for RNA isolation. A proportion of the total plasmid is always isolated during RNA preparation and is detected as a slow migrating RNase A-insensitive band. For RNase treatment, the sample shown in lanes 3/9 was treated with RNase A or no enzyme followed by purification with phenol:chloroform and ethanol precipitation. A short exposure of the full-length RNA is shown for the sense probe as this signal is over-exposed when the plasmid signal is visible. (C) Short interfering RNA (siRNA) reads per 100 bp for 2µ plasmid and chromosome I, showing that the endogenous 2µ plasmid produces high levels of siRNA from all genes compared with chromosomal genes; the three clear peaks correspond to FLP1, REF1, and RAF1. The x axes are not to the same scale, data from (Drinnenberg et al., 2011).
Figure 3—figure supplement 6
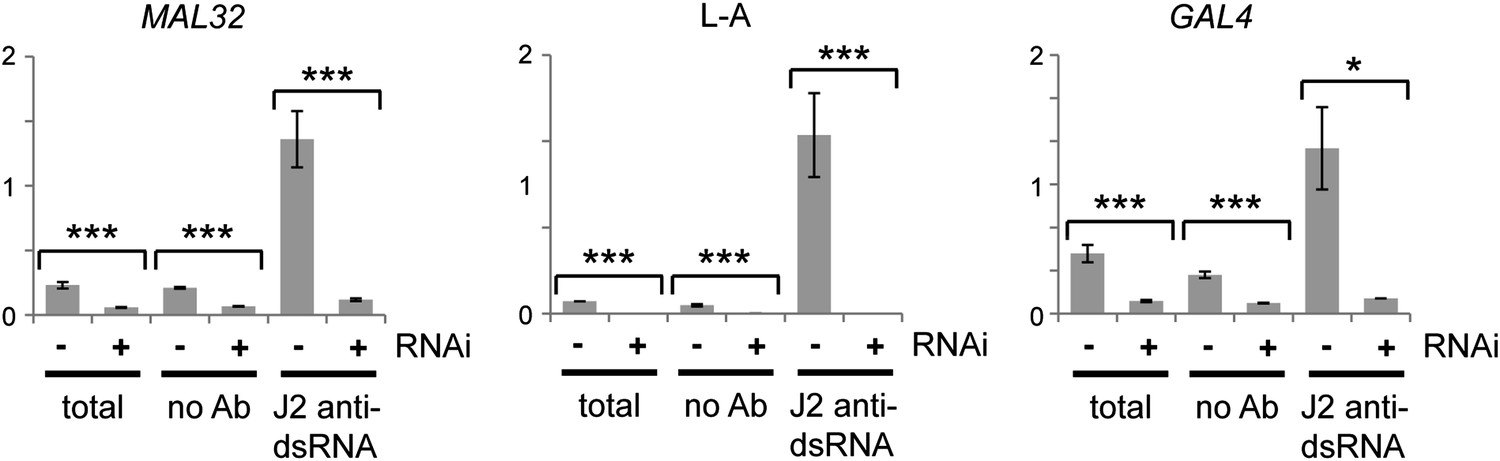
Confirmation of RNA interference (RNAi) action by immunoprecipitation and qRT-PCR.
Cells were grown under the same conditions as in Figure 3C,G, then lysed and immunoprecipitated with either no antibody or monoclonal antibody J2 against double stranded RNA (dsRNA). Quantitative RT-PCR was used to quantify MAL32 or GAL4, L-A (a dsRNA produced by Killer virus) and ACT1 in each fraction. Signals were normalized to ACT1, which should produce minimal dsRNA under normal conditions. For quantification, n = 3 biological replicates, error bars represent ±1se, *p<0.05, ***p<0.01 by Student’s t test, data were log transformed for t test to avoid issues caused by the very large difference in dsRNA quantification between wt and RNAi+ cells, y axes in arbitrary units. The significant differences in the no antibody controls match the difference in the total lysates and reflect non-specific RNA binding.
Figure 4 with 3 supplements
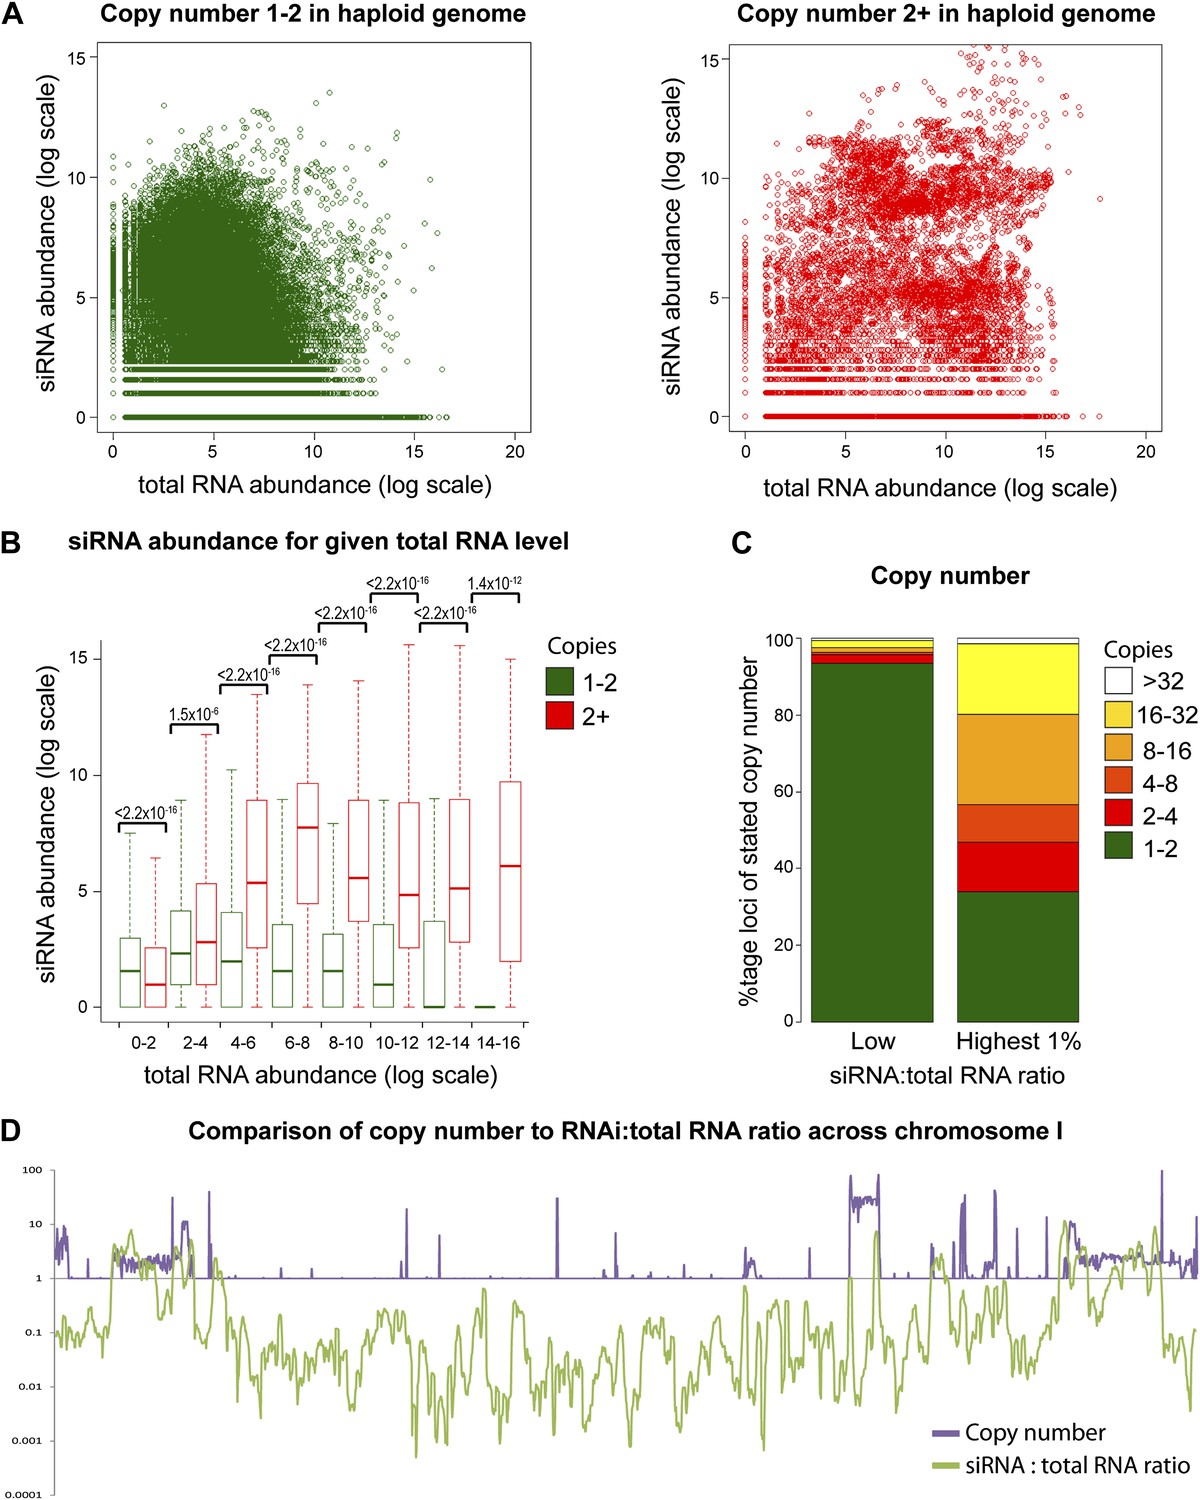
Multi-copy loci are preferentially targeted by RNA interference (RNAi).
(A) Short interfering RNA (siRNA) (Drinnenberg et al., 2011) and total RNA (Hobson et al., 2012) abundance for loci with copy number <2 (left, single-copy) or ≥2 (right, multi-copy). (B) Quantification of data from A binned into categories of increasing total RNA level, with p values for pairwise comparisons of siRNA abundance in single-copy and multi-copy datasets using the Wilcoxon Rank Sum test. (C) Copy number distribution of the 1% of loci with the highest siRNA:total RNA ratio compared with other loci; difference is significant by Wilcoxon Rank Sum test, p<2.2 × 10⁻¹⁶, loci scoring below noise threshold (0–2 category in B) were removed. n values for tests in B and C are given in Table 2. (D) Comparison of copy number with siRNA:total RNA ratio across chromosome I.
Figure 4—figure supplement 1
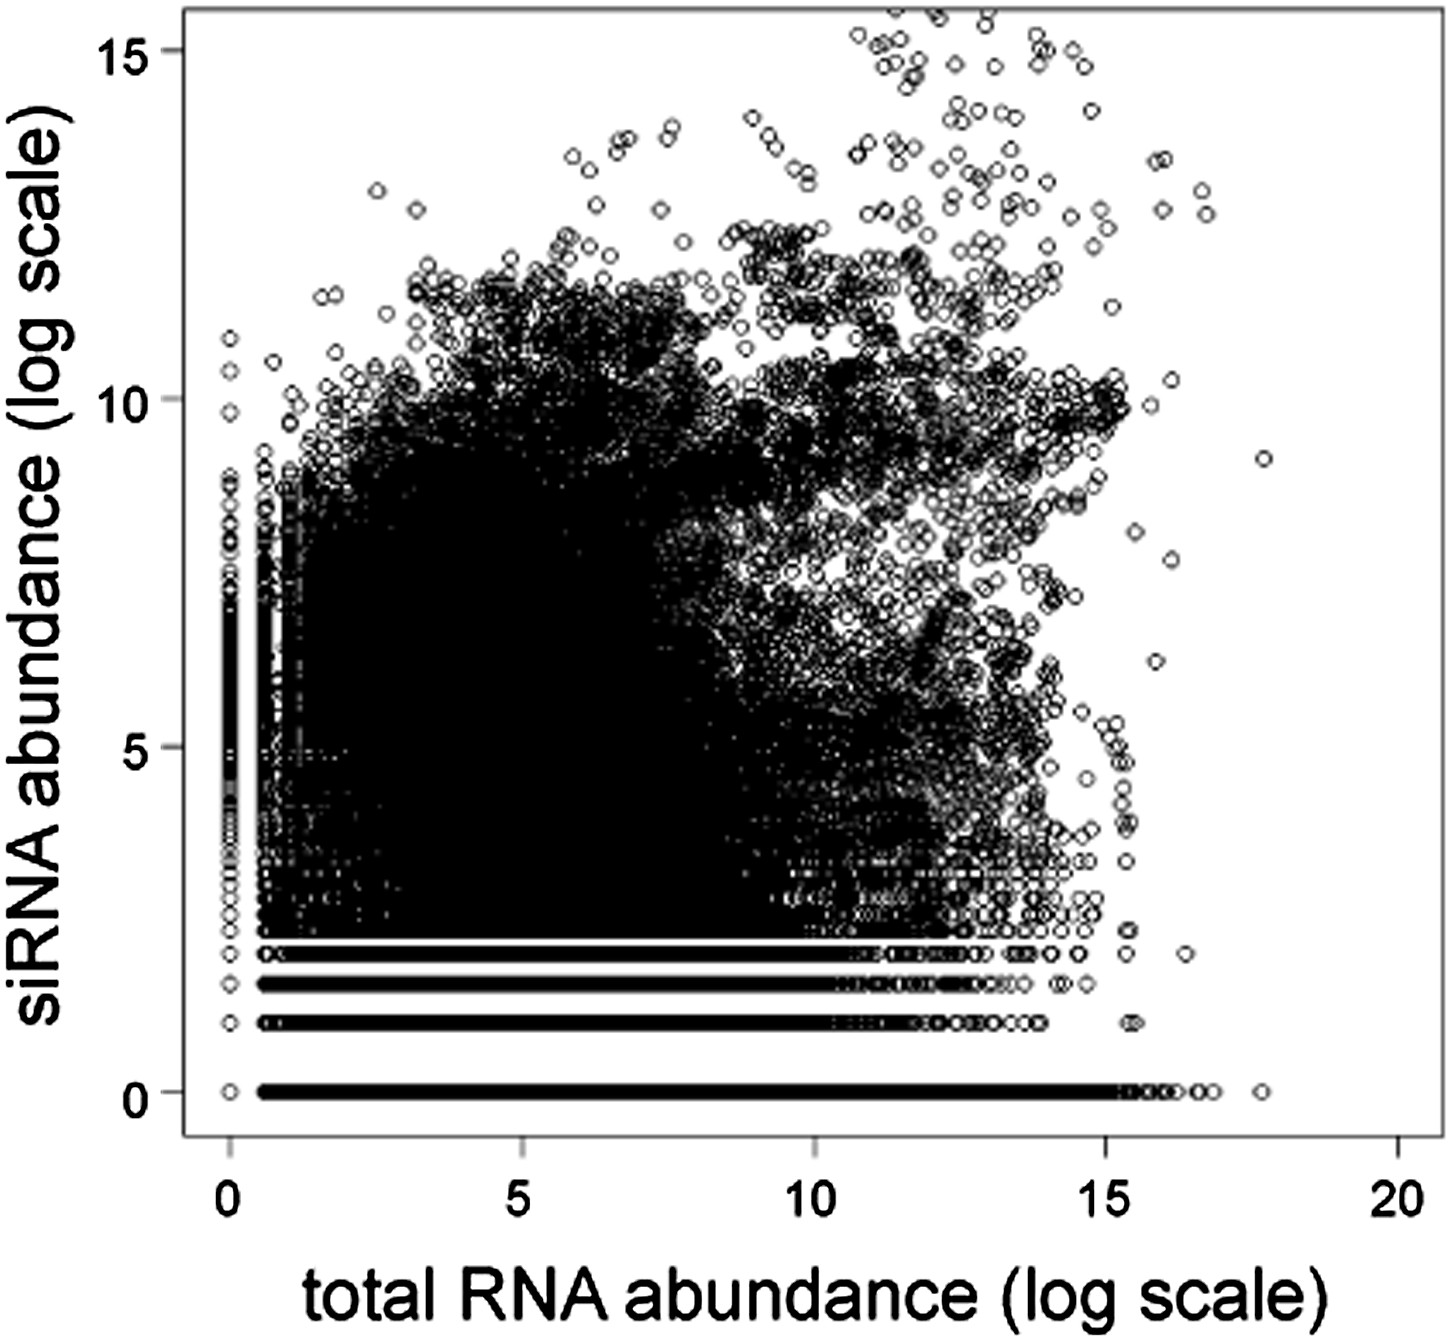
Short interfering RNA (siRNA) versus total RNA abundance.
Plot of genome-wide siRNA abundance (Drinnenberg et al., 2011) versus total RNA abundance (Hobson et al., 2012). Abundance scores represent log-transformed sums of total read counts for each 100 bp segment of the yeast genome.
Figure 4—figure supplement 2
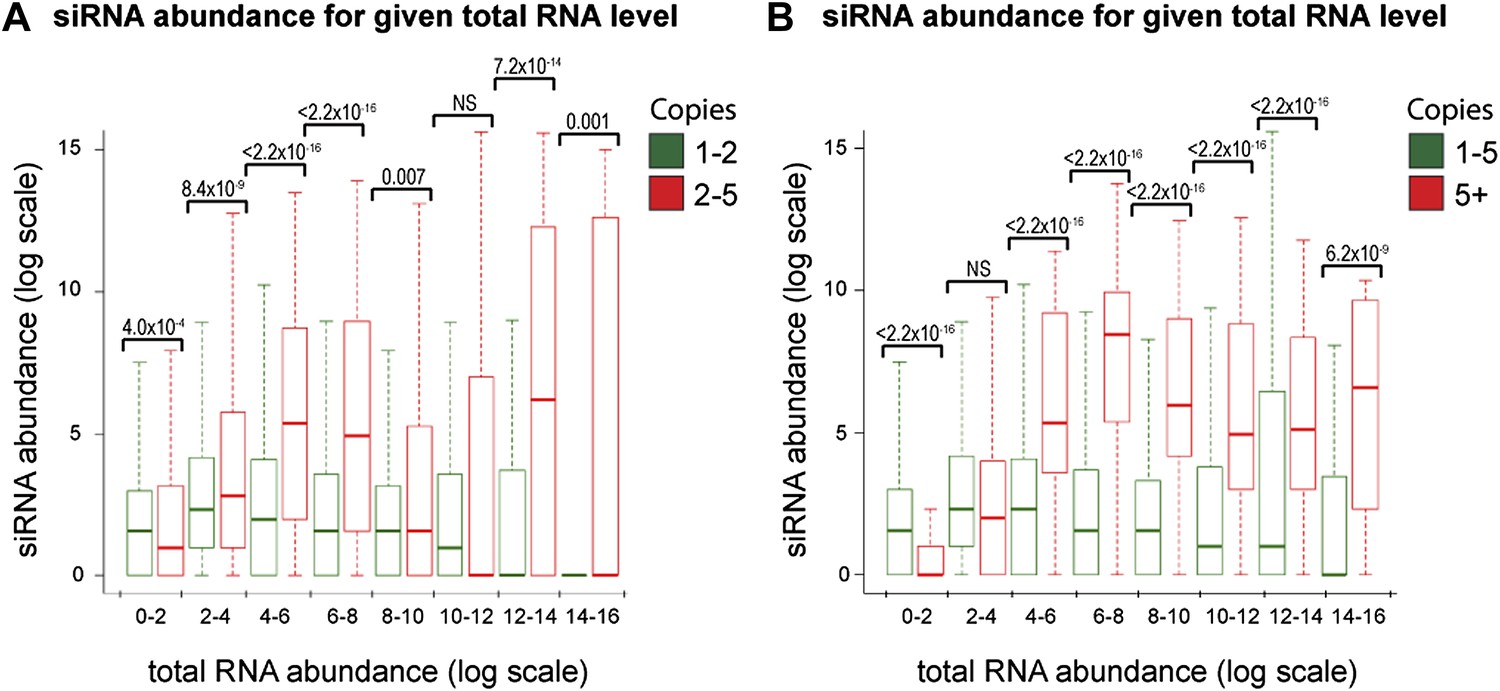
Increased short interfering RNA (siRNA) production from multi-copy sequences is robust to different cut-offs.
The dataset shown in Figure 4B was re-analyzed with varying parameters; significant differences between multi-copy and single-copy loci are observed in all cases. p values shown were calculated by Wilcoxon Rank Sum test, n values are given in Table 2. (A) Very high-copy sequences (>5 copies) were removed from the analysis to avoid the influence of a small number of very high-copy sequences. (B) The datasets were split into <5 and ≥5 copies to ensure that the observed difference was not an artefact of the arbitrary two-copy cut-off used in Figure 4B.
Figure 4—figure supplement 3
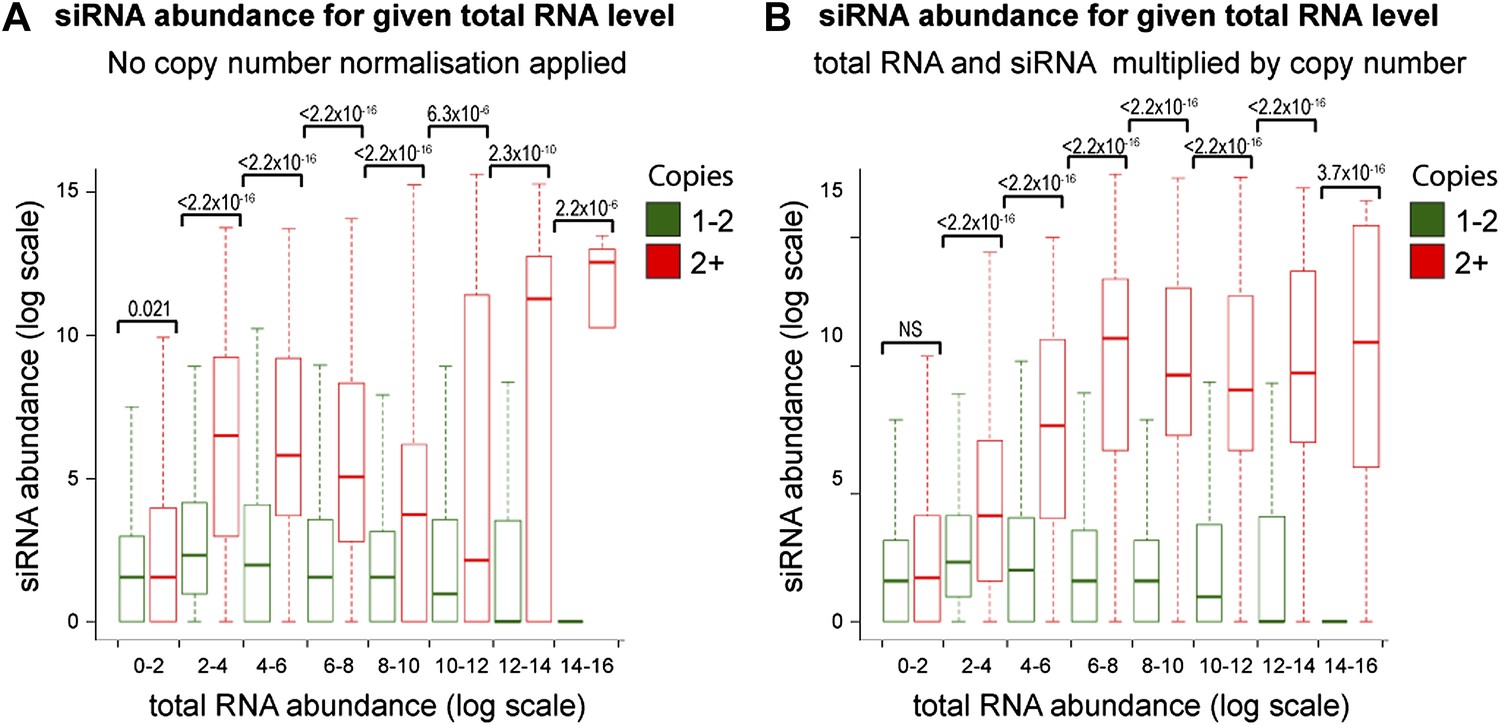
Increased short interfering RNA (siRNA) production from multi-copy sequences is not due to copy number normalization.
(A) No normalization for copy number was applied to total RNA abundance levels. (B) Both total RNA and siRNA abundance were multiplied by copy number for each analyzed locus. See ‘Materials and methods’ section for information on these normalization methods.
Figure 5
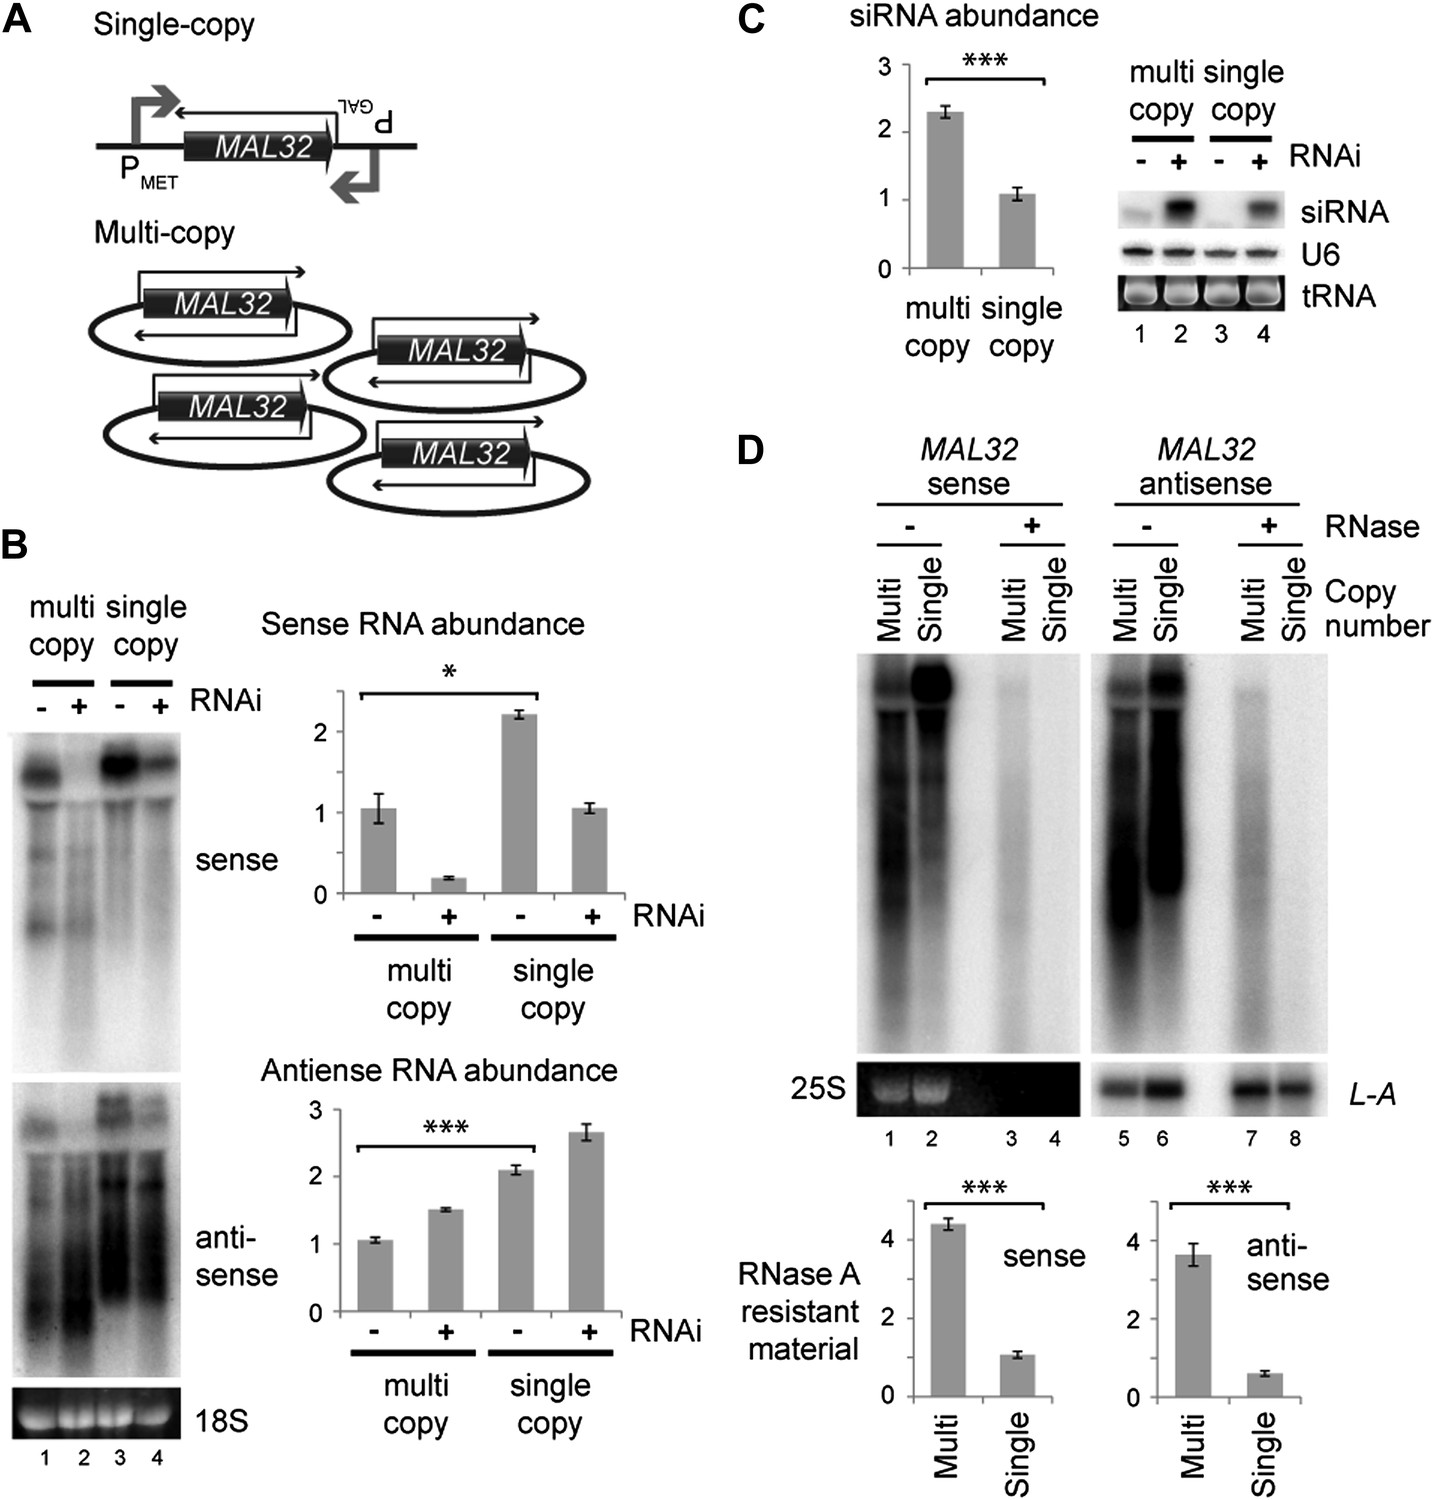
Single gene analysis of copy number effect on RNA interference (RNAi).
(A) Schematic of single-copy and multi-copy MAL32 system. (B) Northern analysis of MAL32 RNA from single-copy and multi-copy systems. All visible species are included in antisense quantification. (C) MAL32 short interfering RNA (siRNA) abundance from cells in B. (D) RNase A sensitivity of MAL32 in wild-type cells expressing multi-copy and single-copy MAL32. Cells were lysed on ice, treated with RNase A as indicated and analyzed by northern blot. 25S and L-A (a double stranded RNA) are shown as controls for loading and RNase specificity. n = 3 biological replicates, error bars ±1se, *p<0.05, ***p<0.01 by Student’s t test, y axes in arbitrary units.
Figure 6 with 1 supplement
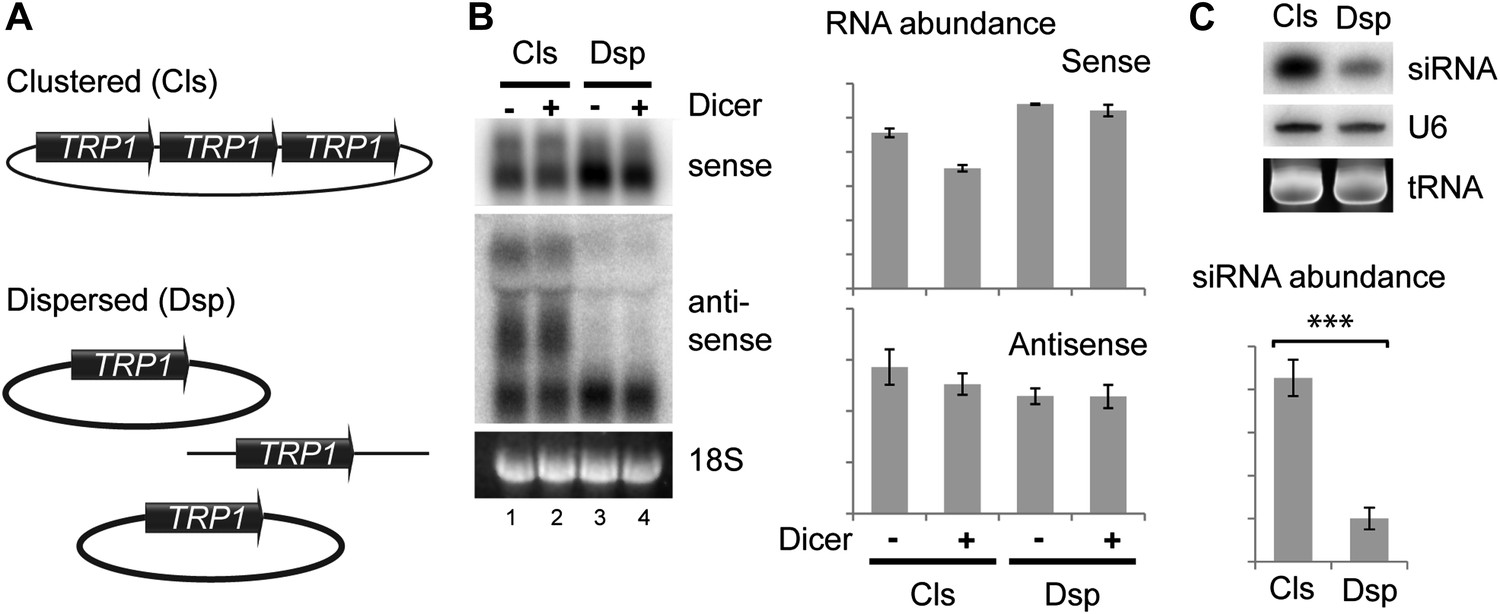
Clustered loci show higher efficiency of short interfering RNA (siRNA) formation.
(A) Comparison of the systems used. Three copies of TRP1 were placed either in tandem on a single-copy plasmid (Clustered, Cls) or a single copy was left in the genome at the TRP1 locus and two further copies were placed on different single-copy plasmids (Dispersed, Dsp). Dicer was expressed from a single-copy plasmid. (B) Sense and antisense RNA expression in clustered and dispersed systems with and without Dicer. Quantification shows that Dicer alone has little effect on total RNA levels. Read-through species visible in lanes 1,2 are included in the quantification; values have been normalized for the different number of probe binding sites in the read-through RNAs. In the absence of this normalization (i.e., counting the number of binding sites rather than the number of molecules), the clustered antisense is approximately twofold more abundant than the dispersed antisense, which is insufficient to explain the difference in siRNA formation. (C) siRNA produced from TRP1 in clustered and dispersed systems. n = 3 biological replicates, error bars ±1se, ***p<0.01 by Student’s t test, y axes in arbitrary units.
Figure 6—figure supplement 1
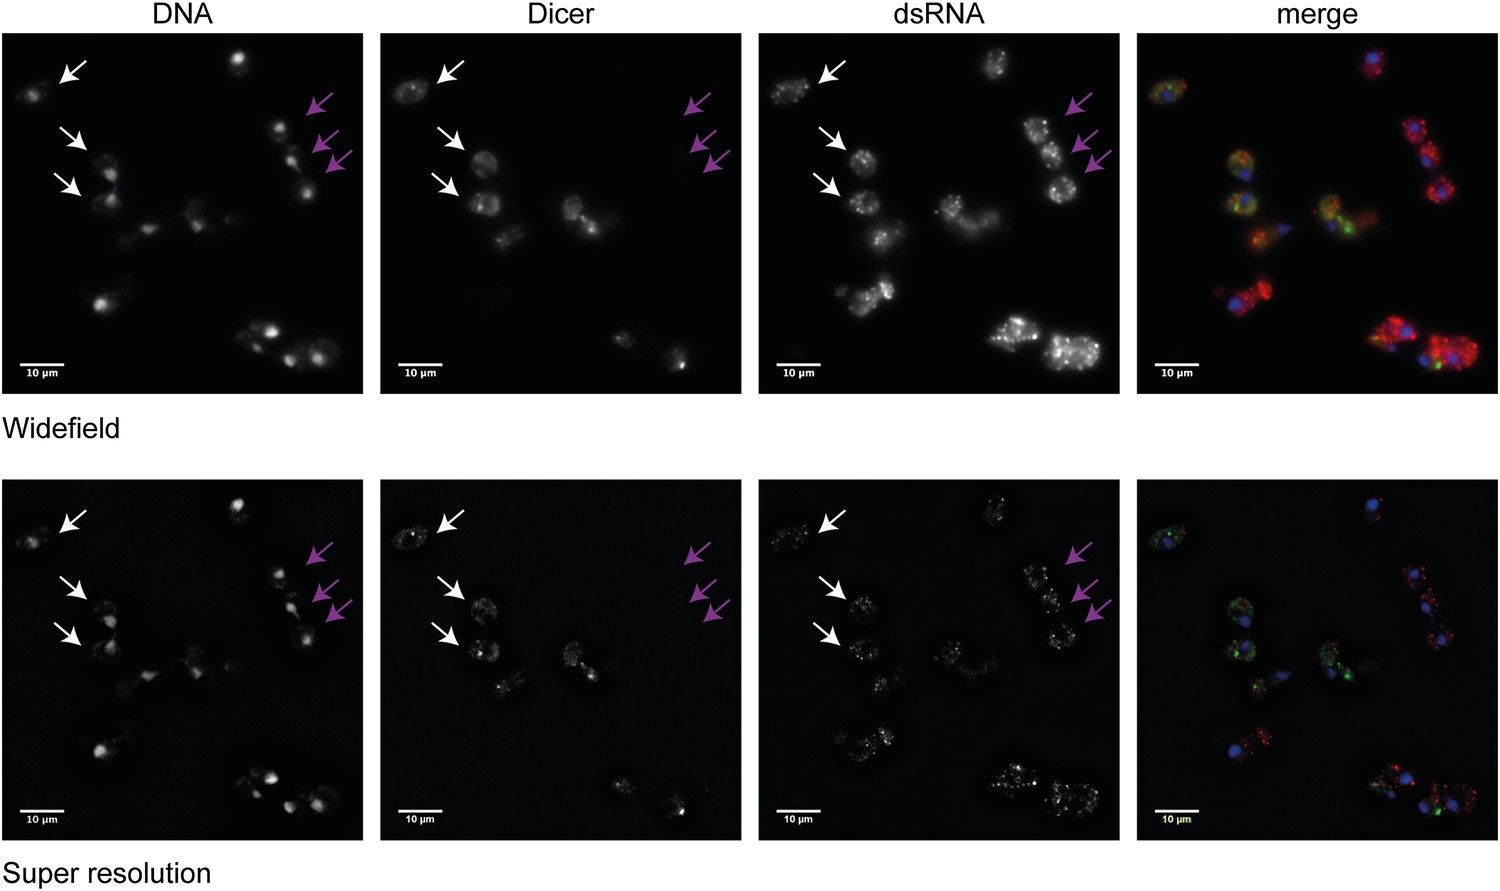
Analysis of Dicer and double stranded RNA (dsRNA) localization.
Wild-type and RNA interference (RNAi)+ cells carrying a green fluorescent protein (GFP)-tagged Dicer were grown separately in yeast extract peptone dextrose, then mixed in equal proportions before fixation. Cells were stained with anti-GFP for Dicer (green) and an antibody to dsRNA (red). Images were acquired on a Nikon N-SIM microscope; the wide-field images and the processed super resolution images are shown for comparison. Three wild-type cells (white arrows) and three RNAi+ cells (purple arrows) are indicated. Examination of multiple cells in multiple stacks did not reveal any convincing evidence of Dicer or dsRNA foci in the nucleus, and the Dicer staining overlapping the nucleus in the wide-field images was not visible after processing, nor was it detectable by confocal imaging.
Figure 7
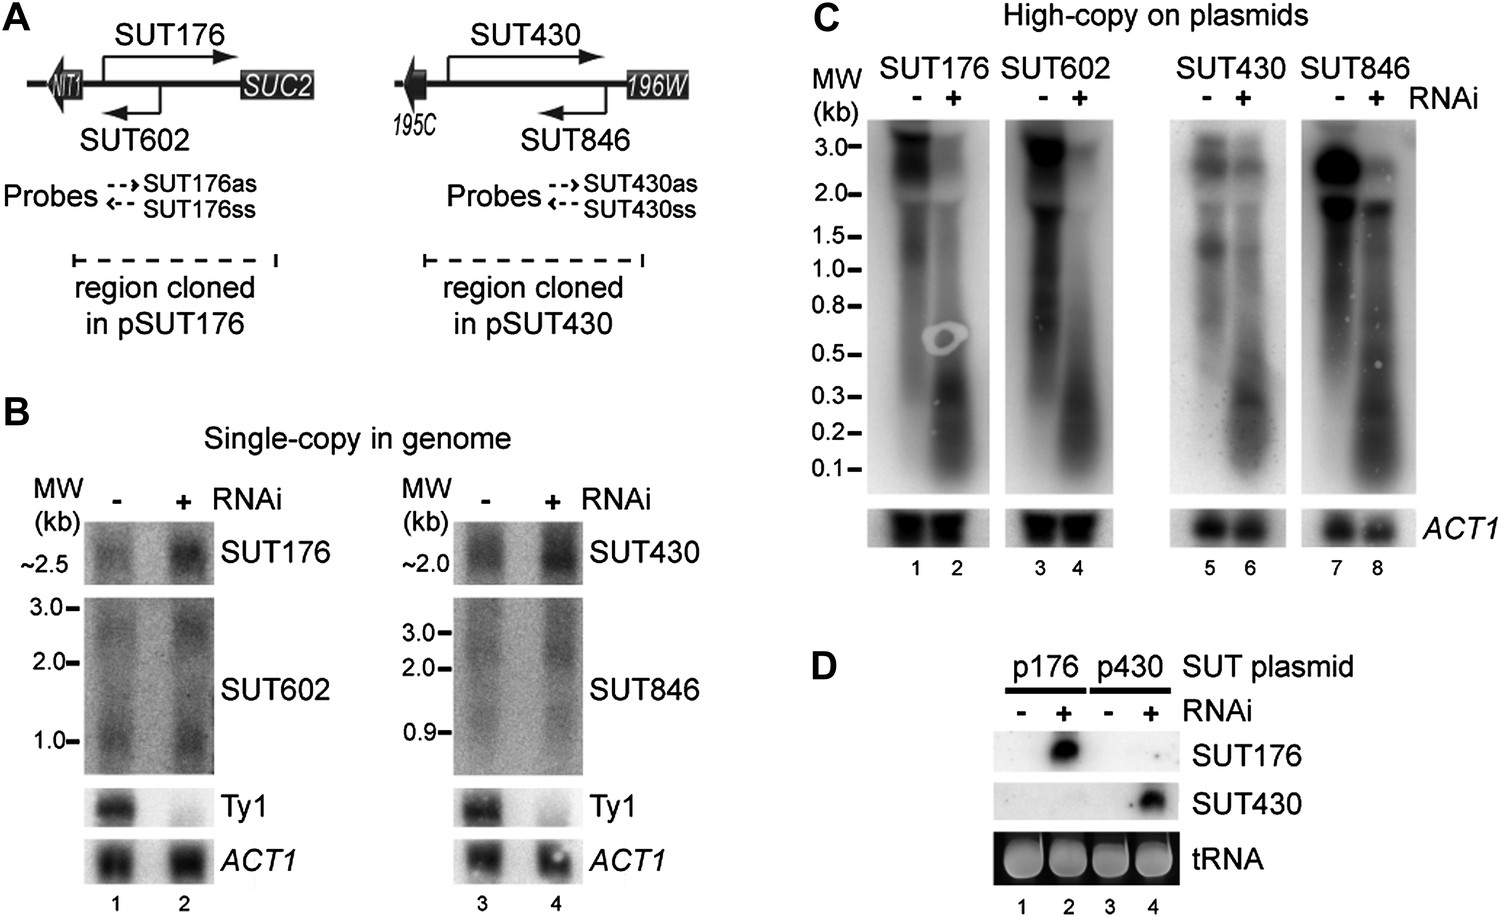
RNA interference (RNAi) against transcripts from amplified low-expression systems.
(A) Schematic diagrams of SUT176 and SUT430 loci. (B) Northern analysis of SUT176 and SUT430 transcripts from single-copy genomic loci in wild-type and RNAi+ cells. Ty1 RNA is a positive control for RNAi, ACT1 is a loading control. (C) Analysis of SUT176 and SUT430 non-protein coding RNAs (ncRNAs) expressed from high-copy plasmids in wild-type and RNAi+ cells. Amplified regions are indicated in A. (D) Short interfering RNA analysis of cells in C.
Figure 8 with 1 supplement
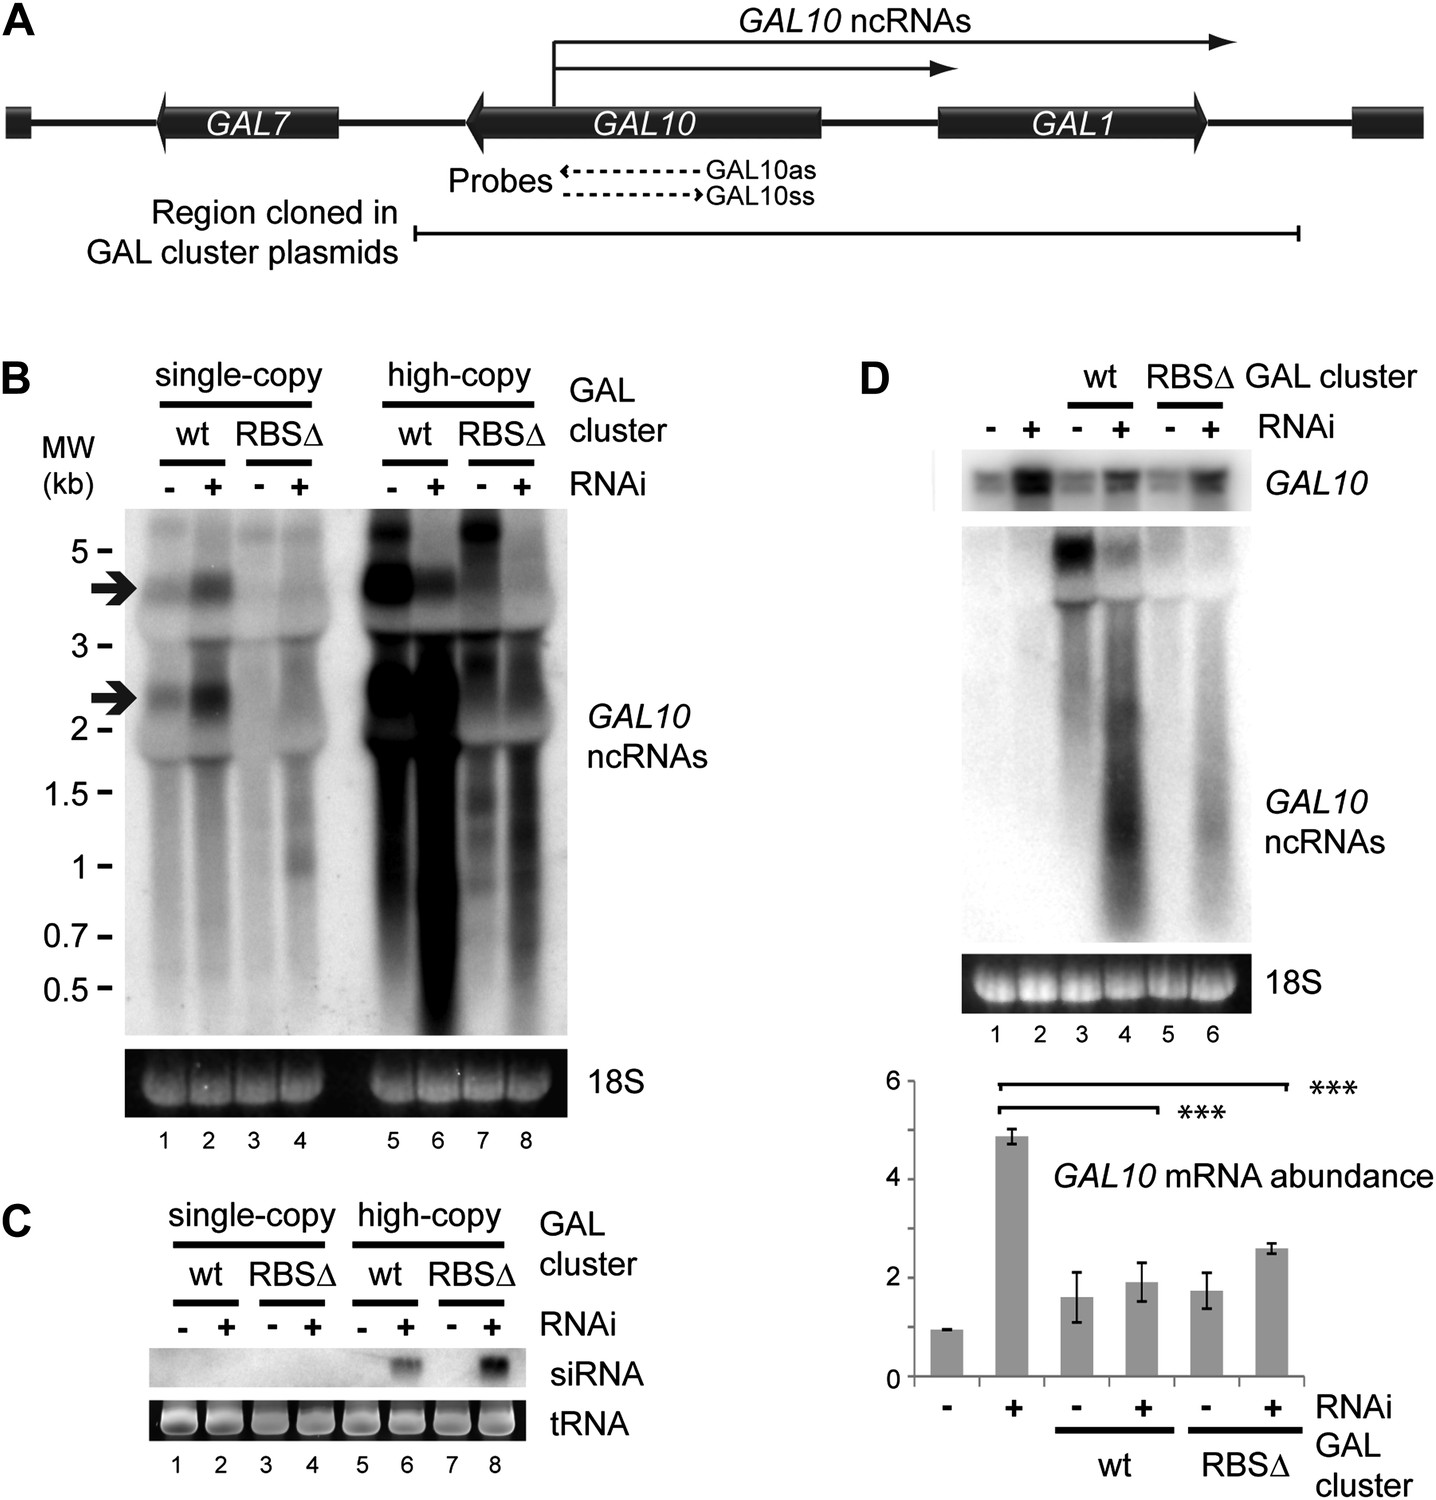
RNA interference (RNAi) against pervasive transcripts from the repressed GAL cluster.
(A) Schematic representation of the GAL cluster. (B) Non-strand-specific northern blot of non-protein coding RNAs (ncRNAs) produced from the GAL locus present at single-copy (lanes 1–4) or high-copy (lanes 5–8), showing wild-type and RBSΔ mutant. Arrow indicates GAL10 antisense RNA. Strand-specific northern blots for the same RNA are shown in Figure 8—figure supplement 1. (C) GAL10 short interfering RNA (siRNA) from the same cells as in B. (D) Expression of GAL10 mRNA from a single-copy genomic locus under the control of a Cu2+-responsive promoter in wild-type and RNAi+ strains carrying an empty vector (lanes 1,2), high-copy wild-type GAL cluster (lanes 3,4), or high-copy RBSΔ GAL cluster (lanes 5,6). n = 3 biological replicates, error bars ±1se, ***p<0.01 by Student’s t test, y axes in arbitrary units.
Figure 8—figure supplement 1
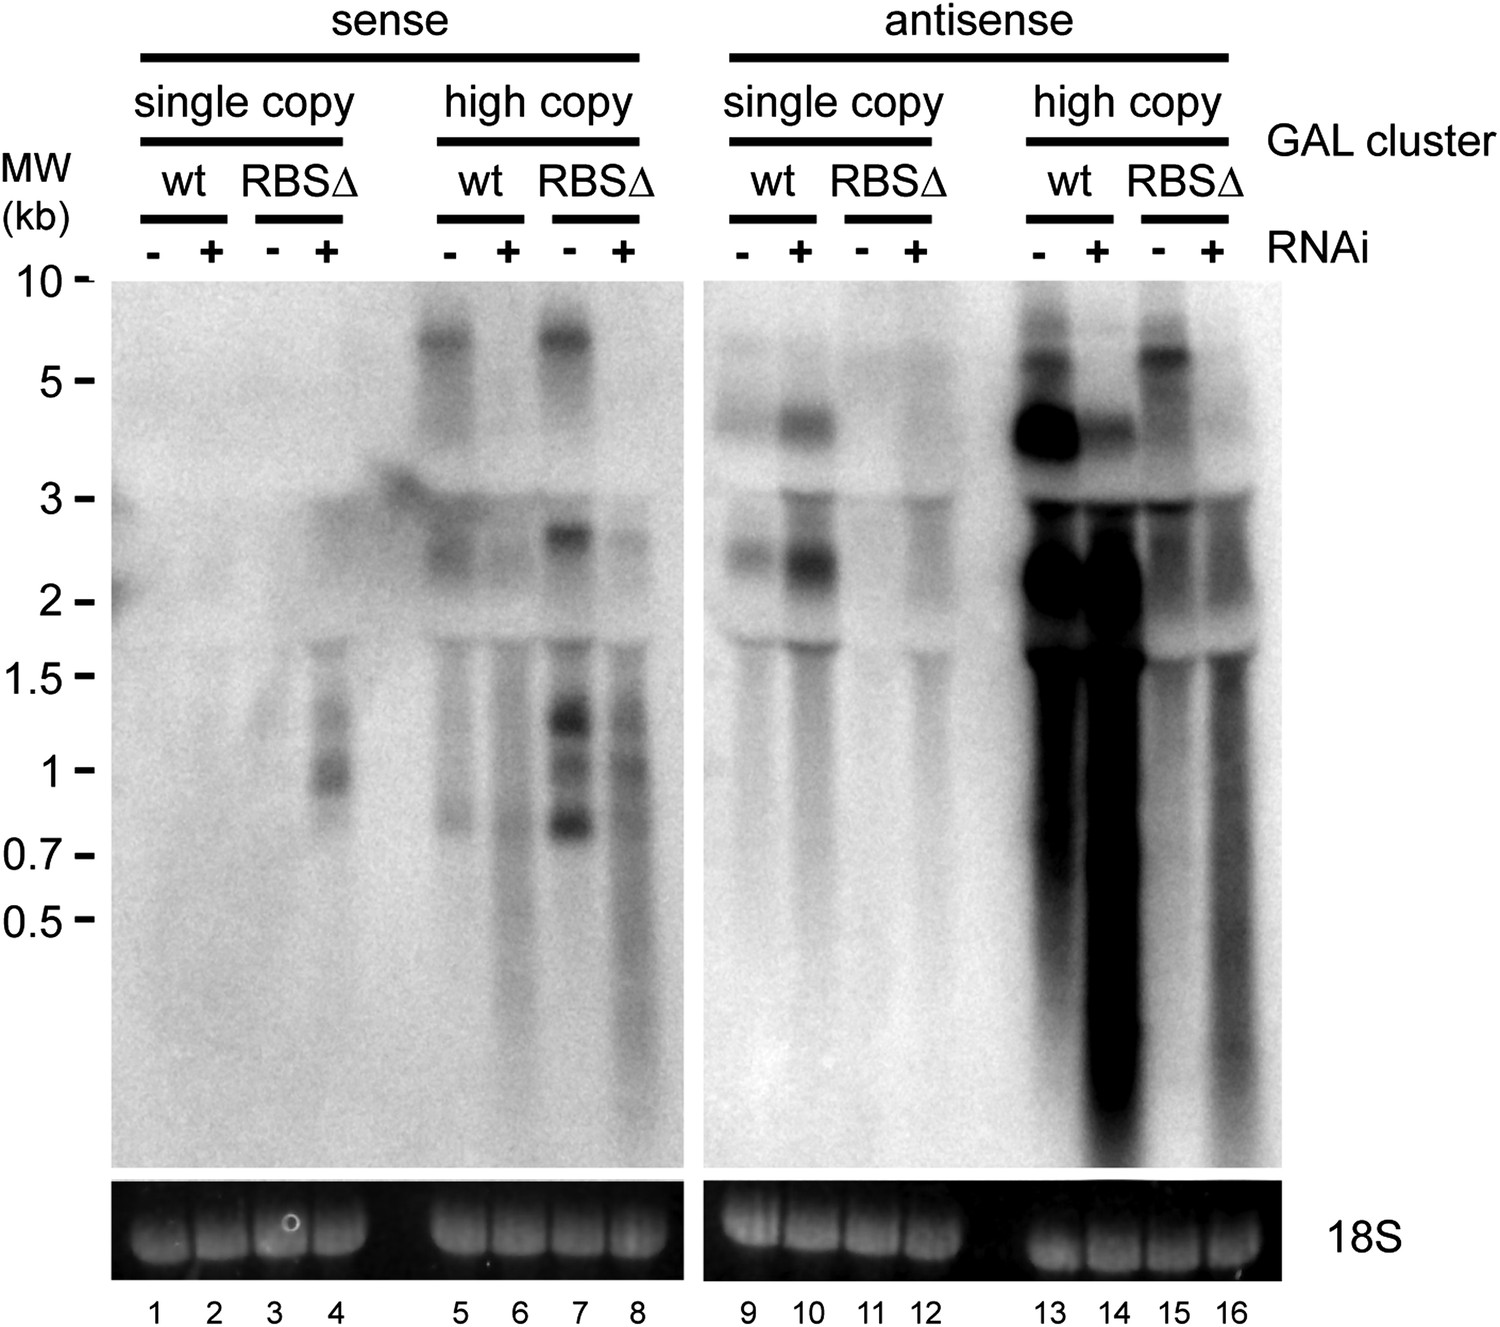
Strand-specific analysis of GAL10 non-protein coding RNAs (ncRNAs).
RNA samples from Figure 8B were separated on two gels and probed with strand-specific probes sense and antisense to the GAL10 optical reading frame (ORF). Known GAL10 antisense ncRNA species (Houseley et al., 2008; Pinskaya et al., 2009) are visible in lanes 9 and 10, and are more prevalent in the RNA interference (RNAi)+ strain for unknown reasons. These species are highly expressed from the high-copy plasmid (lanes 13,14), along with an additional high molecular weight RNA. No sense RNAs were detected from the single-copy wild-type GAL10 locus (lanes 1,2), although heterogeneous RNA species of 0.8–1.5 kb are observed in the RNAi+ strain carrying the single-copy RBSΔ GAL10 plasmid (lane 4). These sense RNAs are more clearly visible from the high-copy RBSΔ GAL10 plasmid in wild-type cells (lane 7), and are faintly visible in the wild-type GAL10 plasmid (lane 5).
Figure 9
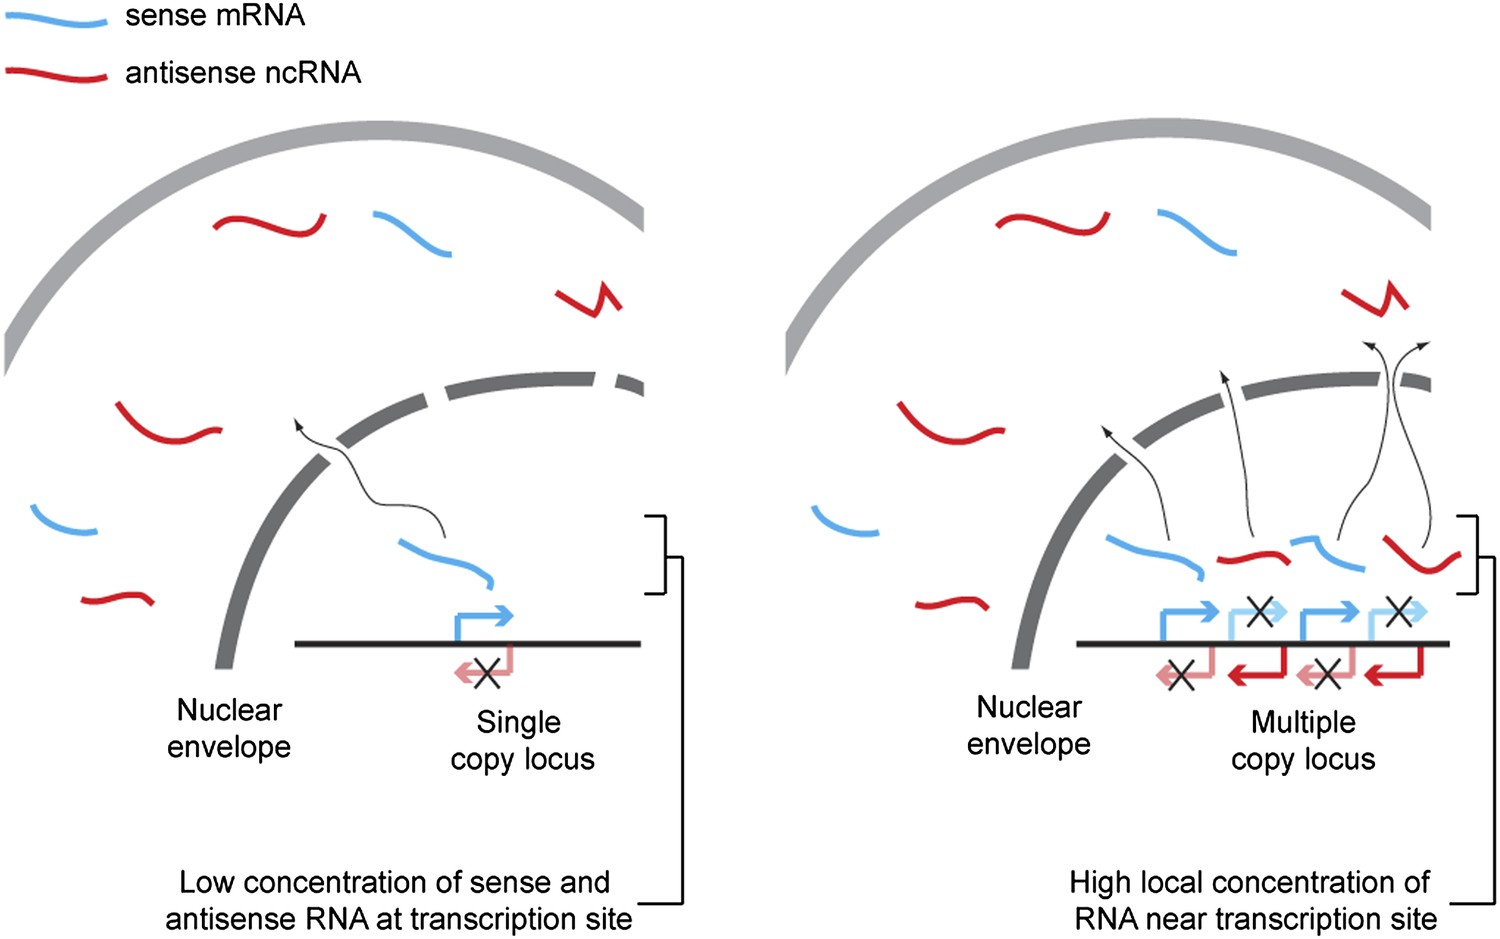
Proposed mechanism for RNA interference (RNAi) on high-copy loci.
The rate of double stranded RNA (dsRNA) formation, the required first step in RNAi, is highly dependent on local RNA concentration. Single-copy loci cannot simultaneously transcribe sense and antisense RNA, allowing RNA export to occur before the strands meet and requiring hybridization to occur in the relatively large cytoplasmic volume. In contrast, sense and antisense RNA can be simultaneously transcribed from different parts of a multi-copy locus and, therefore, if the copies are closely juxtaposed in the genome or in 3D space, the local concentration of sense and antisense RNA around the transcription sites should be high, favoring dsRNA formation.
Tables
Table 1
Stability of antisense ncRNAs
| Overlap size (bp) | Overlap type | Totals | ||||
|---|---|---|---|---|---|---|
| ORF–ORF | ORF–XUT | ORF–CUT | ORF–SUT | ORF–ncRNA | ORF–unstable ncRNA | |
| 50 | 700 | 1066 | 575 | 522 | 1596 | 1448 (91%) |
| 100 | 449 | 1008 | 543 | 475 | 1507 | 1367 (91%) |
| 150 | 216 | 967 | 508 | 425 | 1423 | 1306 (92%) |
| 200 | 136 | 931 | 478 | 403 | 1358 | 1249 (92%) |
| 250 | 96 | 893 | 434 | 380 | 1287 | 1181 (92%) |
| 300 | 69 | 812 | 391 | 363 | 1189 | 1085 (91%) |
| 350 | 62 | 759 | 335 | 351 | 1086 | 990 (91%) |
| 400 | 54 | 694 | 292 | 334 | 992 | 899 (91%) |
| 450 | 51 | 637 | 244 | 322 | 904 | 811 (90%) |
| 500 | 48 | 591 | 204 | 302 | 828 | 741 (89%) |
-
Number of ORFs overlapping with ORFs and various classes of ncRNAs, with various minimum size cut-offs for the overlapping region.
-
Totals are given for ORFs overlapping with ncRNAs and with unstable ncRNAs, including a percentage of overlapping ncRNAs that are unstable.
-
ncRNA: non-protein coding RNA; ORF: optical reading frame; XUT: Xrn1-sensitive unstable transcript (degraded in cytoplasm); CUT: cryptic unstable transcript (degraded by nuclear exosome); SUT: stable unannotated transcript (not known to be degraded).
Table 2
n values for statistical tests
| Figure | Category | n | Category | n |
|---|---|---|---|---|
| 4B | 0–2 single-copy | 19,892 | 0–2 multi-copy | 1128 |
| 2–4 single-copy | 36,474 | 2–4 multi-copy | 1111 | |
| 4–6 single-copy | 34,921 | 4–6 multi-copy | 1177 | |
| 6–8 single-copy | 16,208 | 6–8 multi-copy | 1356 | |
| 8–10 single-copy | 4060 | 8–10 multi-copy | 1424 | |
| 10–12 single-copy | 922 | 10–12 multi-copy | 1505 | |
| 12–14 single-copy | 270 | 12–14 multi-copy | 887 | |
| 14–16 single-copy | 56 | 14–16 multi-copy | 199 | |
| 4C | Bulk 1–2 copies | 85,495 | Top 1% 1–2 copies | 252 |
| Bulk 2–4 copies | 1419 | Top 1% 2–4 copies | 95 | |
| Bulk 4–8 copies | 544 | Top 1% 4–8 copies | 98 | |
| Bulk 8–16 copies | 981 | Top 1% 8–16 copies | 238 | |
| Bulk 16–32 copies | 1978 | Top 1% 16–32 copies | 212 | |
| Bulk >32 copies | 695 | Top 1% >32 copies | 25 | |
| 4—Supplement 1A | 0–2 single-copy | 19,892 | 0–2 multi-copy | 836 |
| 2–4 single-copy | 36,474 | 2–4 multi-copy | 906 | |
| 4–6 single-copy | 34,921 | 4–6 multi-copy | 724 | |
| 6–8 single-copy | 16,208 | 6–8 multi-copy | 387 | |
| 8–10 single-copy | 4060 | 8–10 multi-copy | 189 | |
| 10–12 single-copy | 922 | 10–12 multi-copy | 167 | |
| 12–14 single-copy | 270 | 12–14 multi-copy | 128 | |
| 14–16 single-copy | 56 | 14–16 multi-copy | 29 | |
| 4—Supplement 1B | 0–2 low-copy | 20,728 | 0–2 high-copy | 292 |
| 2–4 low-copy | 37,380 | 2–4 high-copy | 205 | |
| 4–6 low-copy | 35,645 | 4–6 high-copy | 453 | |
| 6–8 low-copy | 16,595 | 6–8 high-copy | 969 | |
| 8–10 low-copy | 4249 | 8–10 high-copy | 1235 | |
| 10–12 low-copy | 1089 | 10–12 high-copy | 1338 | |
| 12–14 low-copy | 398 | 12–14 high-copy | 759 | |
| 14–16 low-copy | 85 | 14–16 high-copy | 170 | |
| 4-Supplement 2A | 0–2 single-copy | 20,030 | 0–2 multi-copy | 1999 |
| 2–4 single-copy | 36,494 | 2–4 multi-copy | 2104 | |
| 4–6 single-copy | 34,883 | 4–6 multi-copy | 2098 | |
| 6–8 single-copy | 16,178 | 6–8 multi-copy | 1668 | |
| 8–10 single-copy | 4078 | 8–10 multi-copy | 644 | |
| 10–12 single-copy | 873 | 10–12 multi-copy | 204 | |
| 12–14 single-copy | 215 | 12–14 multi-copy | 66 | |
| 14–16 single-copy | 52 | 14–16 multi-copy | 10 | |
| 4-Supplement 2B | 0–2 single-copy | 19,892 | 0–2 multi-copy | 1128 |
| 2–4 single-copy | 36,474 | 2–4 multi-copy | 1111 | |
| 4–6 single-copy | 34,921 | 4–6 multi-copy | 1177 | |
| 6–8 single-copy | 16,208 | 6–8 multi-copy | 1356 | |
| 8–10 single-copy | 4060 | 8–10 multi-copy | 1424 | |
| 10–12 single-copy | 922 | 10–12 multi-copy | 1505 | |
| 12–14 single-copy | 270 | 12–14 multi-copy | 887 | |
| 14–16 single-copy | 56 | 14–16 multi-copy | 199 |
Additional files
-
Supplementary file 1
Yeast strains, primers, plasmids, and probes used in this study. Strains. Strains used in this study. aDiploid strains from mating W303α with BY4741. Primers. Primers used in this study organized by locus. Plasmids. Plasmids used in this study. Probes. Probes used in this study for northern and Southern blot analysis. Probe target is given in parentheses after probe name.
- https://doi.org/10.7554/eLife.01581.026
Download links
A two-part list of links to download the article, or parts of the article, in various formats.
Downloads (link to download the article as PDF)
Open citations (links to open the citations from this article in various online reference manager services)
Cite this article (links to download the citations from this article in formats compatible with various reference manager tools)
Endogenous RNA interference is driven by copy number
eLife 3:e01581.
https://doi.org/10.7554/eLife.01581


