Earlier menarche is associated with a higher prevalence of Herpes simplex type-2 (HSV-2) in young women in rural Malawi
- London School of Hygiene and Tropical Medicine, United Kingdom
- Karonga Prevention Study, Malawi
Figures
Figure 1
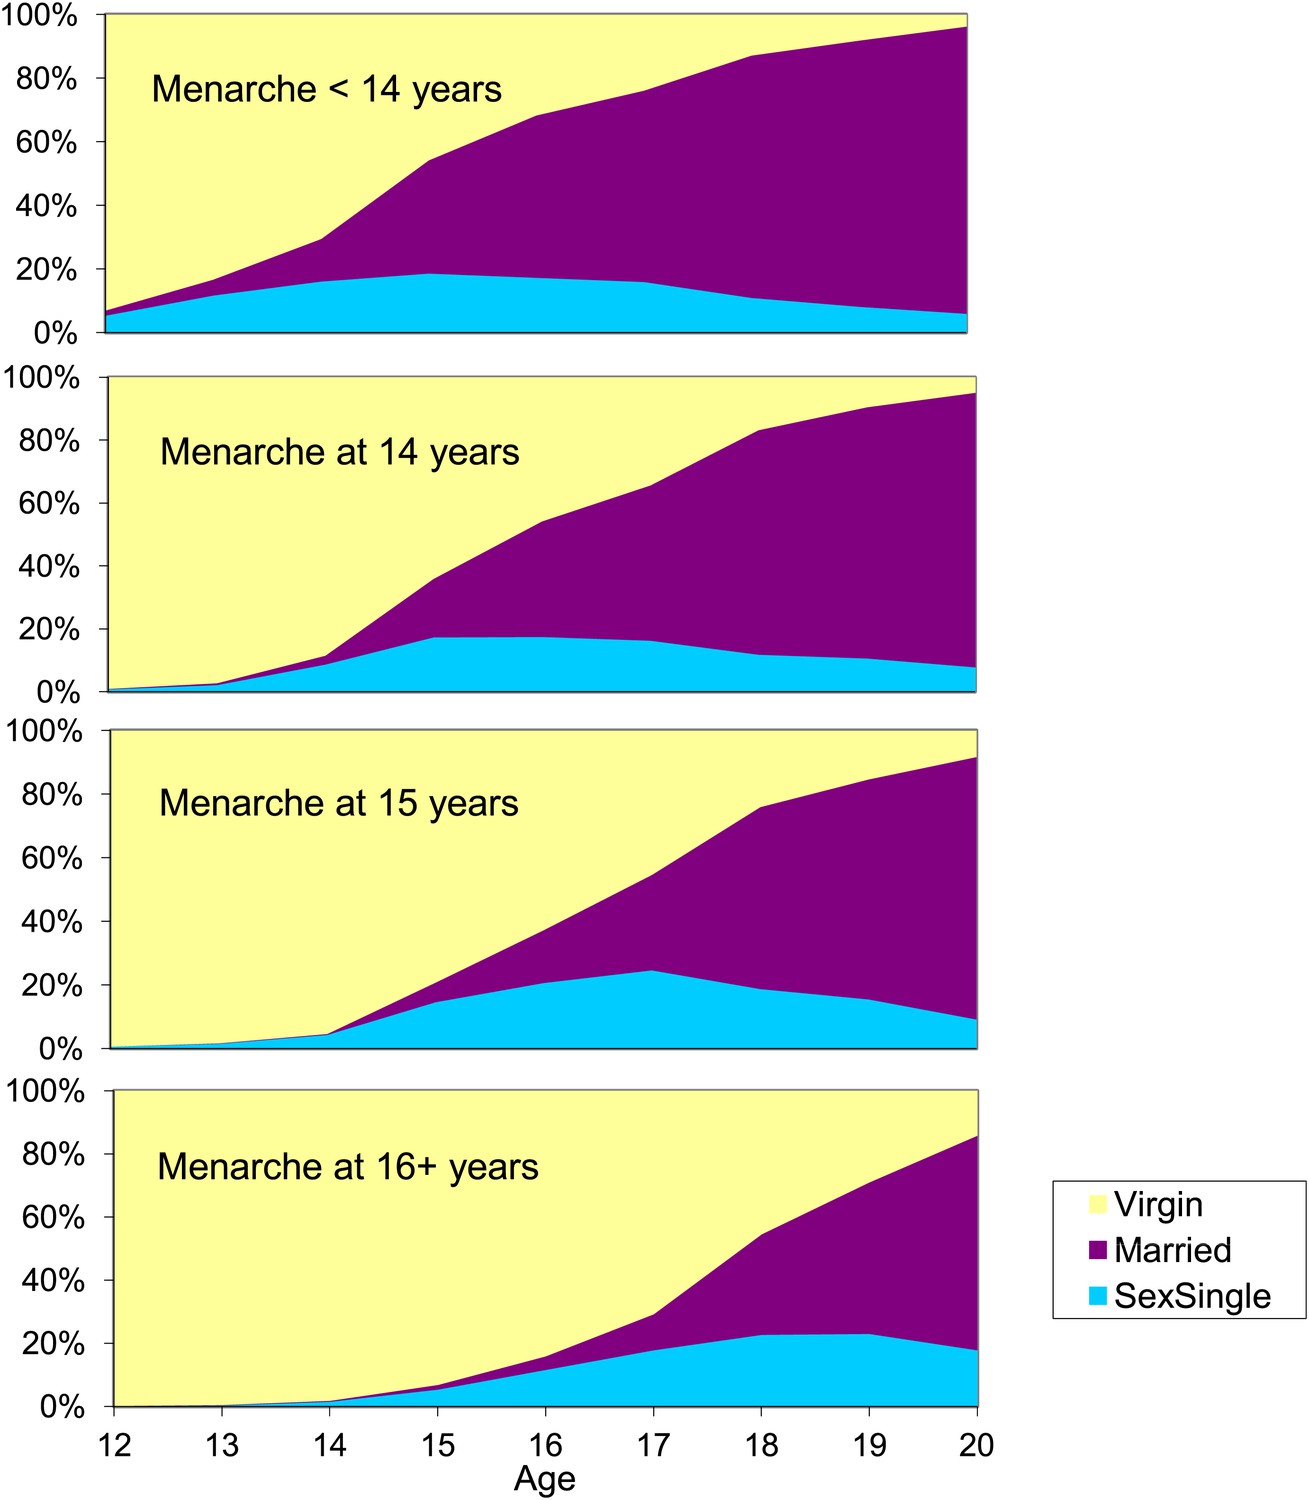
Multistate lifetables showing proportion of young women who are still virgins, have started sex but are unmarried, and are married, by age and age at menarche.
Karonga District, Malawi.
Figure 2

Prevalence of HSV-2 and HIV infection in women by age, Karonga District, Malawi.
https://doi.org/10.7554/eLife.01604.004
Figure 3
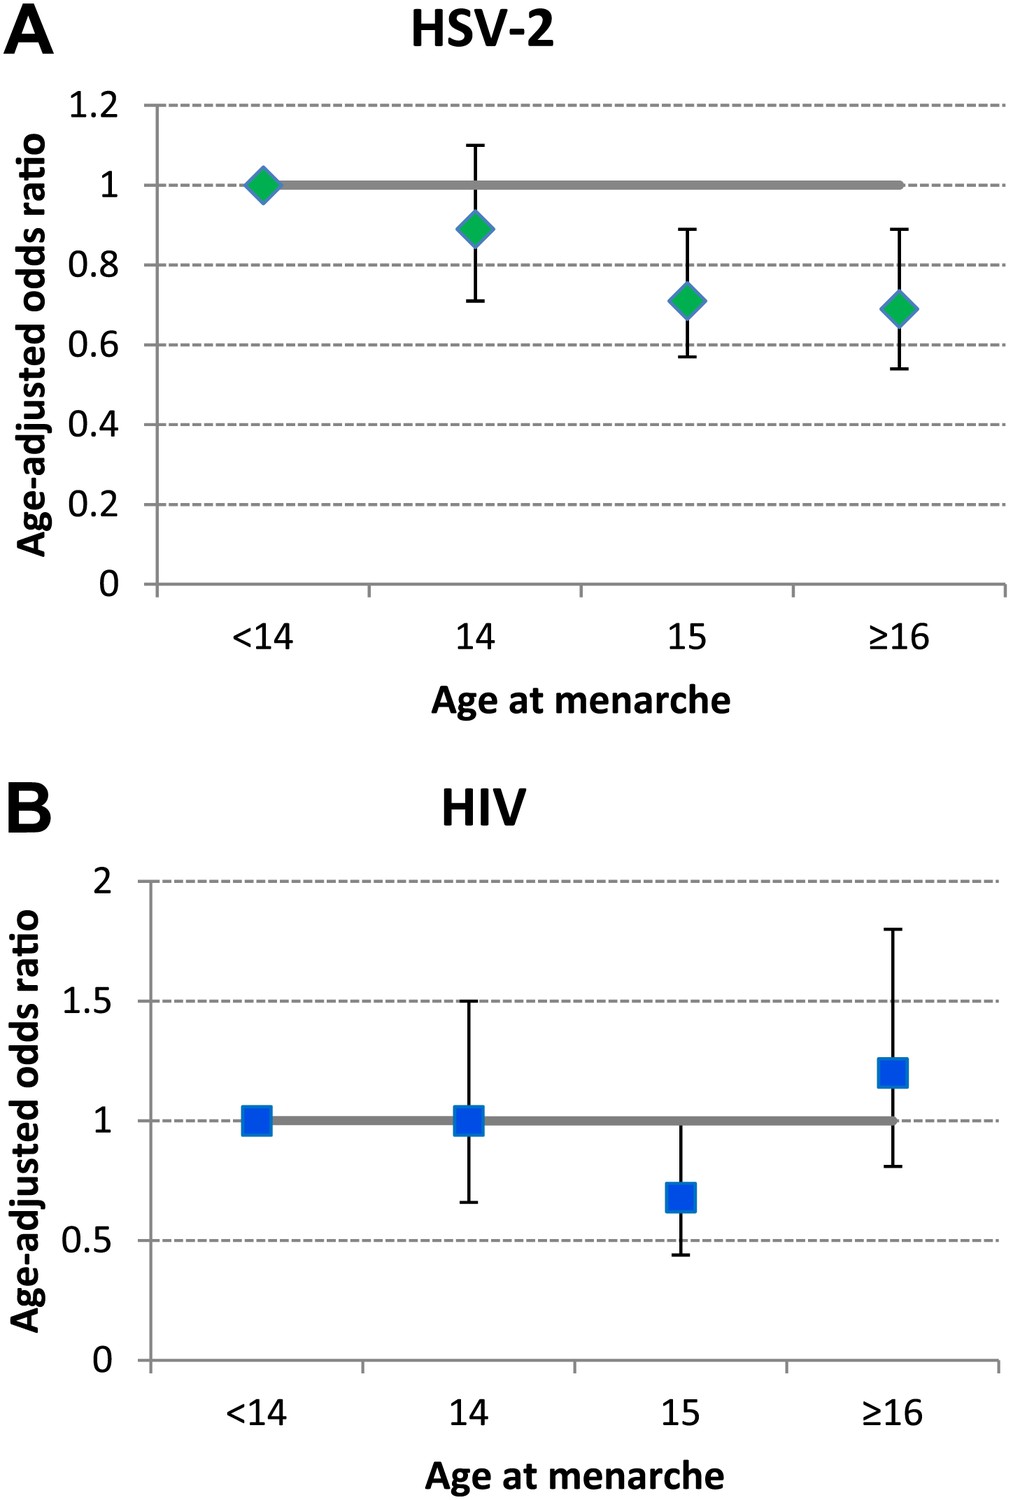
Association between age at menarche and (A) HSV-2 and (B) HIV, adjusted for current age.
Karonga District, Malawi.
Tables
Table 1
Risk factors for HSV2 and HIV infection in 15–30 year old women in a population survey, Karonga District, Malawi 2007–8
| HSV2 | HIV | |||||||
|---|---|---|---|---|---|---|---|---|
| n/N | % | OR (95% CI) | Age adjusted | n/N | % | OR (95% CI) | Age adjusted | |
| OR (95% CI) | OR (95% CI) | |||||||
| All | 870/3419 | 25.5 | 203/3651 | 5.6 | ||||
| Age | ||||||||
| 15–9 | 126/1240 | 10.2 | 1 | 18/1314 | 1.4 | 1 | ||
| 20–24 | 276/1072 | 25.8 | 3.1 (2.4–3.9) | 64/1128 | 5.7 | 4.3 (2.6–7.4) | ||
| 25–30 | 468/1107 | 42.3 | 6.5 (5.2–8.1) | 121/1209 | 10.0 | 8.0 (4.8–13.2) | ||
| Age at menarche | ||||||||
| <14 | 245/815 | 30.1 | 1 | 1 | 51/861 | 5.9 | 1 | 1 |
| 14 | 195/769 | 25.4 | 0.79 (0.63–0.99) | 0.89 (0.71–1.1) | 43/819 | 5.3 | 0.88 (0.60–1.3) | 1.0 (0.66–1.5) |
| 15 | 225/960 | 23.4 | 0.71 (0.58–0.88) | 0.71 (0.57–0.89) | 41/1030 | 4.0 | 0.66 (0.43–1.0) | 0.68 (0.44–1.0) |
| ≥16 | 157/622 | 25.2 | 0.79 (0.62–0.99) | 0.69 (0.54–0.89) | 51/665 | 7.7 | 1.3 (0.88–2.0) | 1.2 (0.81–1.8) |
| Age at first sex | ||||||||
| Never | 51/639 | 8.0 | 0.21 (0.15–0.29) | 0.48 (0.33–0.69) | 10/684 | 1.5 | 0.23 (0.12–0.44) | 0.69 (0.32–1.3) |
| <16 | 296/1014 | 29.2 | 1 | 1 | 66/1076 | 6.1 | 1 | 1 |
| 16–17 | 235/797 | 29.5 | 1.0 (0.83–1.2) | 0.99 (0.80–1.2) | 53/847 | 6.3 | 1.0 (0.70–1.4) | 0.99 (0.68–1.5) |
| 18+ | 273/930 | 29.4 | 1.0 (0.83–1.2) | 0.76 (0.62–0.93) | 71/1002 | 7.1 | 1.2 (0.82–1.7) | 0.90 (0.63–1.3) |
| Marital status | ||||||||
| Never | 76/826 | 9.2 | 1 | 1 | 19/885 | 2.2 | 1 | 1 |
| Current | 681/2330 | 29.2 | 4.1 (3.2–5.2) | 1.7 (1.3–2.3) | 133/2481 | 5.4 | 2.6 (1.6–4.2) | 0.78 (0.44–1.4) |
| Previous | 113/263 | 43.0 | 7.4 (5.3–10.4) | 3.4 (2.4–5.0) | 51/285 | 17.9 | 9.9 (5.8–17.2) | 3.2 (1.7–5.9) |
| Lifetime no. of partners | ||||||||
| 0 | 51/639 | 8.0 | 0.33 (0.24–0.46) | 0.76 (0.53–1.1) | 10/684 | 1.5 | 0.49 (0.25–0.98) | 1.4 (0.66–3.2) |
| 1 | 304/1475 | 20.6 | 1 | 1 | 46/1574 | 2.9 | 1 | 1 |
| 2 | 320/900 | 35.6 | 2.1 (1.8–2.6) | 2.0 (1.7–2.4) | 82/951 | 5.6 | 3.1 (2.2–4.5) | 2.9 (2.0–4.2) |
| 3 | 139/289 | 48.1 | 3.6 (2.7–4.6) | 3.2 (2.4–4.2) | 41/313 | 13.1 | 5.0 (3.2–7.8) | 4.4 (2.8–6.8) |
| ≥4 | 53/107 | 49.5 | 3.8 (2.5–5.6) | 3.5 (2.3–5.3) | 24/120 | 20.0 | 8.3 (4.9–14.2) | 7.4 (4.3–12.8) |
| Distance from road | ||||||||
| <1 km | 410/1589 | 25.8 | 1 | 1 | 100/1595 | 6.3 | 1 | 1 |
| >1 km | 460/1830 | 25.1 | 0.97 (0.83–1.1) | 0.94 (0.80–1.1) | 62/1835 | 3.4 | 0.52 (0.38–0.72) | 0.50 (0.36–0.70) |
| Schooling | ||||||||
| None/Primary 1–5 | 101/347 | 29.1 | 1 | 16/378 | 4.2 | 1 | 1 | |
| Primary 6–7 | 215/889 | 24.2 | 0.78 (0.59–1.0) | 0.88 (0.66–1.2) | 38/945 | 4.0 | 0.95 (0.52–1.7) | 1.1 (0.59–2.0) |
| Primary 8 | 271/1011 | 26.8 | 0.89 (0.68–1.2) | 0.89 (0.67–1.2) | 58/1069 | 5.4 | 1.3 (0.74–2.3) | 1.3 (0.75–2.4) |
| Secondary 1–3 | 218/860 | 25.4 | 0.83 (0.63–1.1) | 0.88 (0.65–1.2) | 70/916 | 7.6 | 1.9 (1.1–3.3) | 2.0 (1.2–3.6) |
| Secondary 4/Tertiary | 36/196 | 18.4 | 0.55 (0.36–0.84) | 0.42 (0.27–0.66) | 18/215 | 8.4 | 2.1 (1.0–4.1) | 1.8 (0.87–3.6) |
| Mother schooling | ||||||||
| <=Primary | 716/2861 | 25.0 | 1 | 1 | 151/3021 | 5.0 | 1 | 1 |
| Secondary | 80/352 | 22.7 | 0.88 (0.68–1.1) | 1.0 (0.76–1.3) | 30/382 | 7.9 | 1.6 (1.1–2.4) | 1.8 (1.2–2.8) |
| Father schooling | ||||||||
| <=Primary | 517/2046 | 25.3 | 1 | 1 | 94/2158 | 4.4 | 1 | 1 |
| Secondary | 260/1095 | 23.7 | 0.92 (0.78–1.1) | 0.96 (0.80–1.1) | 81/1166 | 7.0 | 1.6 (1.2–2.2) | 1.7 (1.3–2.3) |
| Housing quality | ||||||||
| 1 (Best) | 148/662 | 22.4 | 1 | 1 | 71/732 | 9.7 | 1 | 1 |
| 2 | 149/565 | 26.4 | 1.2 (0.96–1.6) | 1.2 (0.89–1.5) | 32/598 | 5.4 | 0.53 (0.34–0.81) | 0.48 (0.31–0.75) |
| 3 | 317/1238 | 25.6 | 1.2 (0.96–1.5) | 1.0 (0.96–1.3) | 60/1296 | 4.6 | 0.45 (0.32–0.65) | 0.38 (0.26–0.55) |
| 4 (Worst) | 227/843 | 26.9 | 1.3 (1.0–1.6) | 1.2 (0.96–1.6) | 38/903 | 4.2 | 0.41 (0.27–0.61) | 0.37 (0.25–0.56) |
| Occupation | ||||||||
| Farmer | 652/2229 | 29.3 | 1 | 1 | 143/2369 | 6.0 | 1 | 1 |
| In education | 63/720 | 8.8 | 0.23 (0.18–0.31) | 0.55 (0.40–0.76) | 10/767 | 1.3 | 0.21 (0.11–0.39) | 0.58 (0.28–1.2) |
| Not working | 23/77 | 29.9 | 1.0 (0.63–1.7) | 1.1 (0.66–1.9) | 8/88 | 9.1 | 1.6 (0.74–3.3) | 1.6 (0.77–3.5) |
| Other | 102/272 | 37.5 | 1.5 (1.1–1.9) | 1.3 (1.0–1.7) | 38/293 | 13.0 | 2.3 (1.6–3.4) | 2.1 (1.4–3.1) |
| Times of insufficient food in household in last year | ||||||||
| No | 674/2575 | 26.2 | 1 | 1 | 162/2748 | 5.9 | 1 | 1 |
| Yes | 166/728 | 22.8 | 0.83 (0.69–1.0) | 0.83 (0.67–1.0) | 39/775 | 5.0 | 0.85 (0.59–1.2) | 0.85 (0.59–1.2) |
| Times when can’t afford soap in last year | ||||||||
| No | 519/2021 | 25.7 | 1 | 1 | 136/2166 | 6.3 | 1 | 1 |
| Yes | 321/1280 | 25.1 | 0.97 (0.82–1.1) | 0.97 (0.82–1.1) | 65/1355 | 4.8 | 0.75 (0.56–1.0) | 0.75 (0.55–1.0) |
-
OR = odds ratio
Table 2
Association between age at menarche and HSV2 and HIV, adjusted for other variables, among 15–30 year-old women in Karonga District Malawi
| HSV2 (N = 3034)* | HIV (N = 3231)* | ||||||
|---|---|---|---|---|---|---|---|
| Adjusted for age | Also adjusted for socio-economic variables | Also adjusted for behavioural variables | Adjusted for age | Also adjusted for socio-economic variables | Also adjusted for behavioural variables | ||
| OR (95% CI) | OR (95% CI)† | OR (95% CI)‡ | OR (95% CI) | OR (95% CI)† | OR (95% CI)‡ | ||
| Age at menarche | |||||||
| <14 | 1 | 1 | 1 | 1 | 1 | 1 | |
| 14 | 0.91 (0.72–1.2) | 0.92 (0.73–1.2) | 0.92 (0.72–1.2) | 0.97 (0.63–1.5) | 0.94 (0.61–1.4) | 0.96 (0.62–1.5) | |
| 15 | 0.73 (0.58–0.91) | 0.76 (0.60–0.95) | 0.77 (0.61–0.98) | 0.68 (0.44–1.0) | 0.64 (0.41–0.98) | 0.65 (0.42–1.0) | |
| ≥16 | 0.70 (0.54–0.89) | 0.75 (0.58–0.97) | 0.77 (0.59–1.0) | 1.2 (0.79–1.8) | 1.1 (0.69–1.6) | 1.1 (0.70–1.7) | |
-
*
To allow the effects of these potential mediators to be explored fully, the analysis is restricted to individuals with no missing data for the factors included.
-
†
age, schooling, occupation, lack of food.
-
‡
age, schooling, occupation, lack of food, marital status, lifetime number of partners.
Download links
A two-part list of links to download the article, or parts of the article, in various formats.
Downloads (link to download the article as PDF)
Open citations (links to open the citations from this article in various online reference manager services)
Cite this article (links to download the citations from this article in formats compatible with various reference manager tools)
Earlier menarche is associated with a higher prevalence of Herpes simplex type-2 (HSV-2) in young women in rural Malawi
eLife 3:e01604.
https://doi.org/10.7554/eLife.01604


