Arf1/COPI machinery acts directly on lipid droplets and enables their connection to the ER for protein targeting
- Yale University School of Medicine, United States
- Ecole Normale Supérieure de Paris, Université Pierre et Marie Curie, Université Paris Diderot, Centre National de la Recherche Scientifique, France
- University of Heidelberg, Germany
- Gladstone Institute of Cardiovascular Disease, United States
- University of California, San Francisco, United States
Figures
Figure 1 with 1 supplement
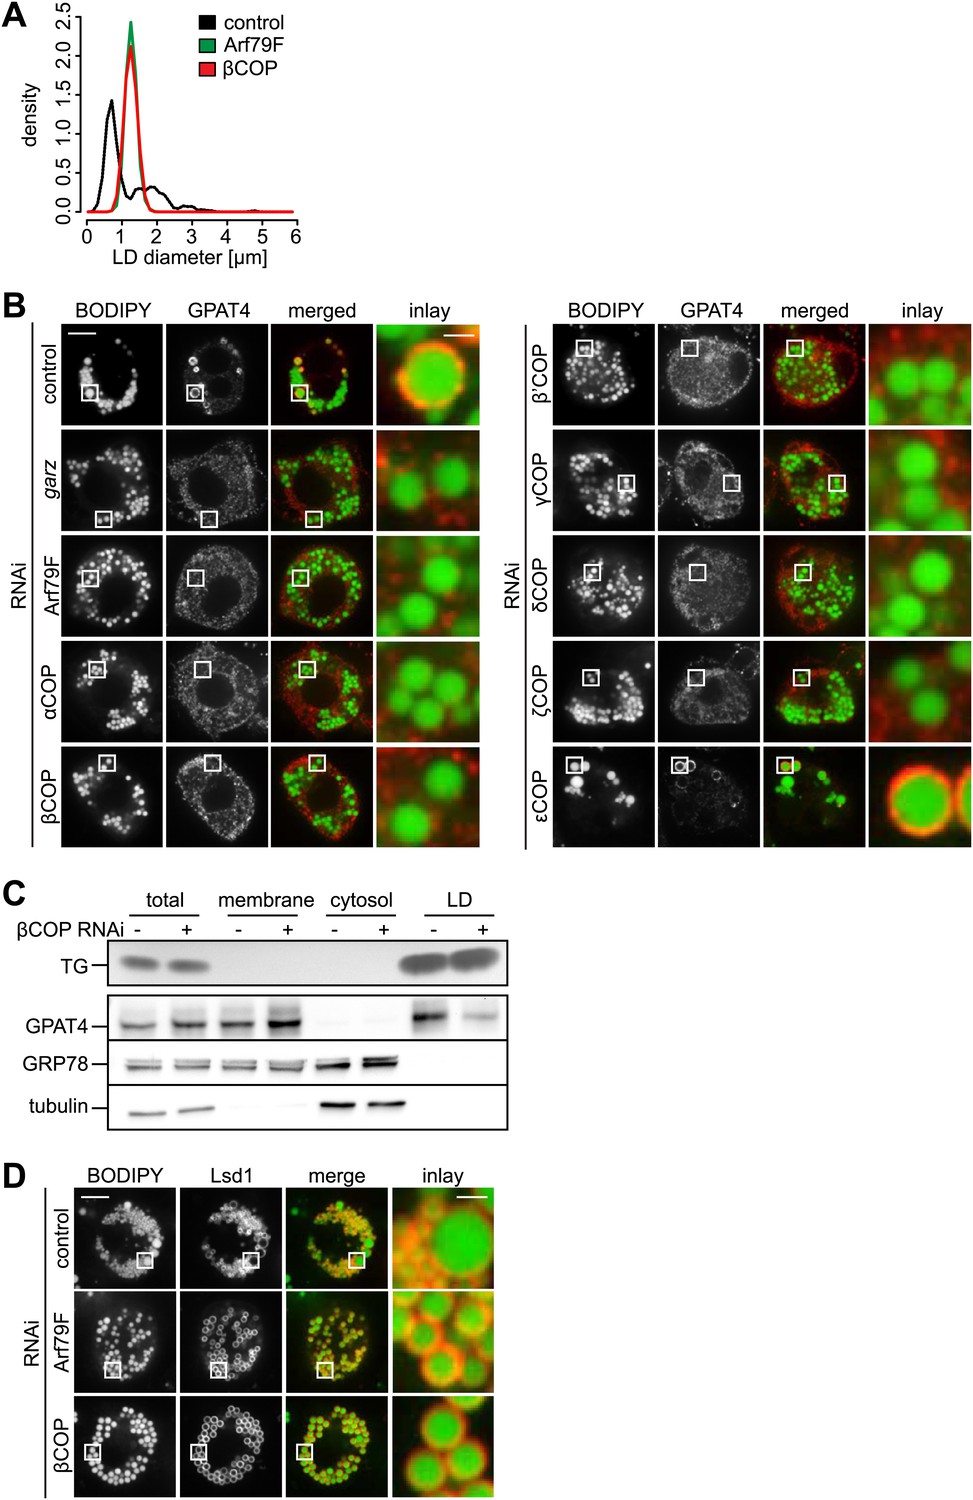
The COPI machinery is required for LD targeting of specific proteins.
(A) The bimodal size distribution of control cells (black line) with few large LDs and many small LDs shifts a monodisperse size in Arf1/COPI-depleted cells (green and red line). The figure shows the density function of the LD size distribution. (B) Endogenous GPAT4 detected by immunofluorescence localizes to LDs (stained by BODIPY) in control treated cells, but not in the absence of any of the COPI machinery components, except εCOP. (C) The amount of GPAT4 fractionating with LDs (detected by thin layer chromatography of TG) is reduced in cells depleted of βCOP. (D) Arf1/COPI effects on LD protein targeting are protein specific, as Lsd1 targeting to LDs is not affected in cells depleted of Arf1/COPI. Cherry-Lsd1 localizes to LDs stained with BODIPY in the absence of Arf79F (middle panel) or βCOP (bottom panel). Scale bars are 10 μm (overview) or 1 μm (inlay).
Figure 1—figure supplement 1
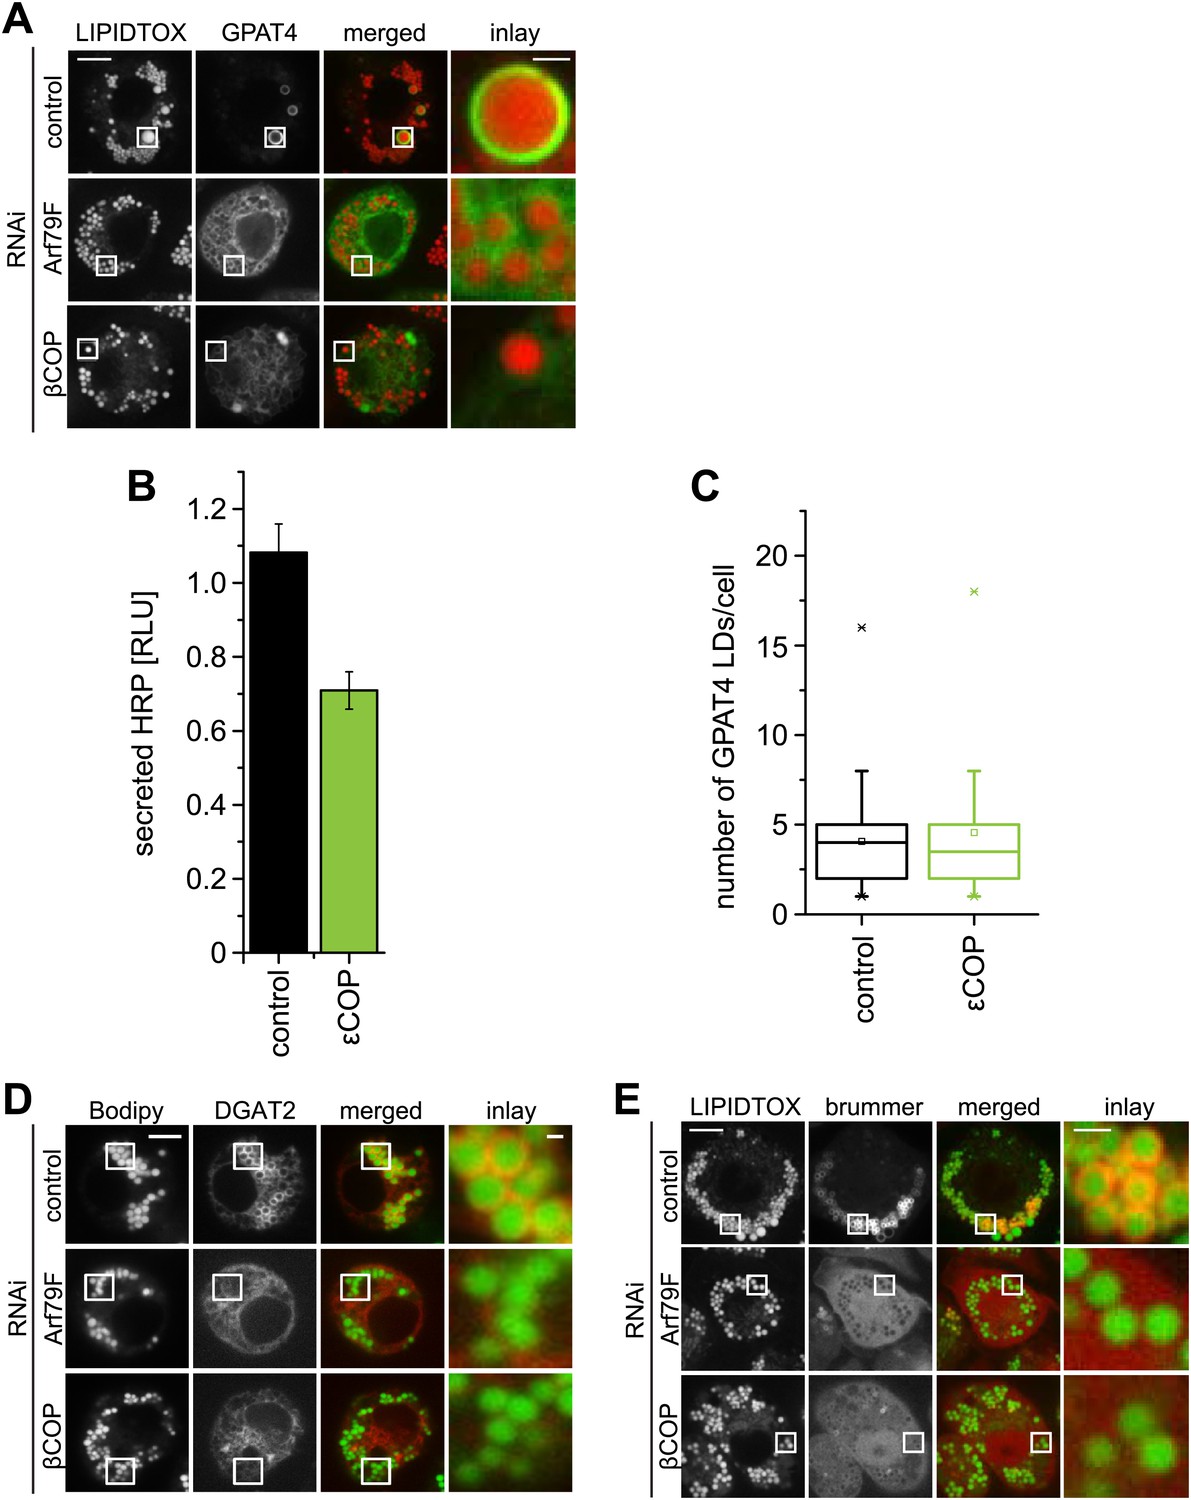
The COPI machinery is required for LD targeting of specific proteins.
(A) Targeting of GPAT4 from the ER to LDs depends on Arf1/COPI. GFP-GPAT4 localizes to LDs stained with lipidtox in control-treated cells, but not in the absence of COPI machinery subunits, Arf79F (middle panel) or βCOP (bottom panel). (B) Depletion of 'COP does not significantly affect the secretion of HRP. (C) The number of GPAT4 positive LDs per cell remains unaffected when comparing control-treated cells with cells in which 'COP has been depleted. (D) DGAT2, catalyzing the formation of TG from DAG and fatty acid–CoA depends on Arf1/COPI for its targeting to LDs. Cherry-DGAT2 was expressed in S2 cells, and localized in respect to LDs (stained with BODIPY) by fluorescence microscopy in control cells and cells depleted for Arf79F (middle panel) or βCOP (bottom panel). Scale bars are 10 μm (overview) or 1 μm (inlay). (E) Brummer LD targeting in S2 cells is dependent on Arf1/COPI. GFP-Brummer localizes to LDs stained with lipidtox (top panel). GFP-Brummer LD targeting is abolished in the absence of either Arf79F (middle panel) or βCOP (bottom panel).
Figure 2 with 1 supplement

Arf1/COPI mediate LD protein targeting by establishing connections between the ER and LDs.
(A) Schematic representation of cell–cell fusion experiments. (B) Fusion of βCOP depleted cells expressing GFP-GPAT4 and induced LDs with WT cells rapidly rescues GFP-GPAT4 targeting to LDs. Soluble cherry fluorescent protein is expressed as a marker for content mixing of fused cells. Scale bars are 10 μm (overview) or 1 μm (inlay). (C) Time lapse analysis of GFP-GPAT4 targeting to LDs. Upper panels shows representative images from time-lapse imaging of cell–cell fusion experiments. Arrows point to apparent connections between LDs and the ER. Scale bar = 1 μm. Lower panel shows quantitation of GFP-GPAT4 localization to LDs in nine independent cell–cell fusion experiments. Time = 0 indicates fusion and content mixing of cells. (D) Rate of GFP-GPAT4 recruitment to LDs after cell–cell fusion. Insert shows the histogram of characteristic recovery time τ.
Figure 2—figure supplement 1
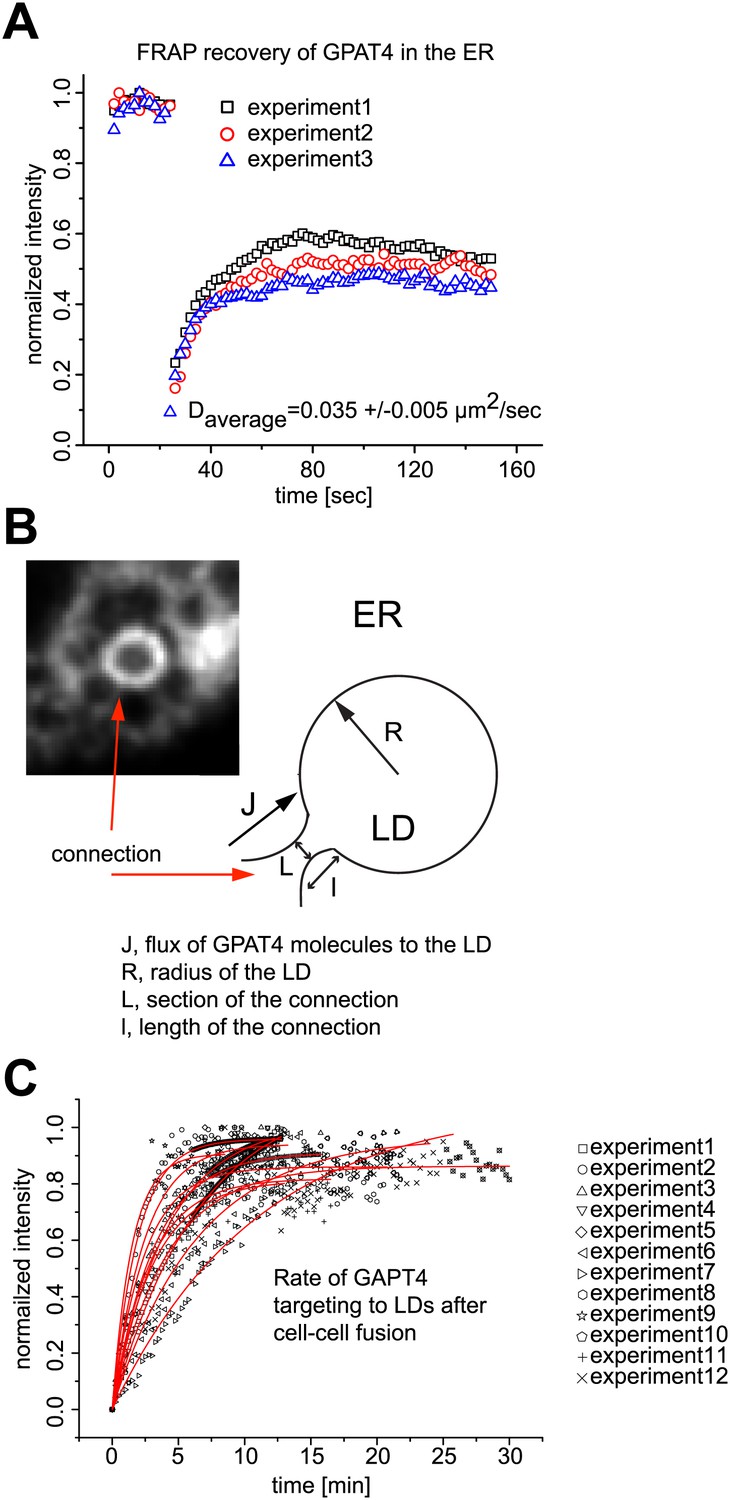
Mathematical model for GPAT4 targeting to LDs through bridges with the ER.
(A) Measurement of GPAT4-GFP diffusion in the ER. D = 0.035μm2/sec denotes for the apparent diffusion coefficient of GPAT4 in the ER, determined by FRAP recovery experiments. Normalized fluorescence intensity of recovery in a bleached ER tubule from three independent experiments are shown. (B) Mathematical Model Estimating the Number of Connections, nc, Necessary to Target GPAT4. The image and cartoon of a connection between ER and LD, with the different connection parameters, are shown. The gradient of concentration of GPAT4 between ER and LD follows: (1) C0−N/S = J/k, where C0 is the GPAT4 concentration in the ER, considered constant; N is the molar number of GPAT4 molecules on the LD at time t; S is the surface of the LD, J is the surface flux of GPAT4 molecules from ER to LD; k, homogeneous to a permeability, reflects the speed at which GPAT4 molecules travels along the connections to reach the LD, and writes as D/I. l is the characteristic length of the ER-LD connection. Within a time dt, the amount of proteins, dN, targeting the LD, via nc connections, writes as: (2) dN = nc × JLdt. L is the characteristic length of the section of ER-LD connections. Combining (1) and (2) yields: (3) dN/dt = nc × kL(C0−N/S), with the solution: (4) N = C0S(1−exp(−t/τ)), where τ = S/(nc × kL) and equals: (5) τ = lS/(nc × DL). τ is the characteristic time of GPAT4 targeting to LDs and experimentally found to be τ = 3.6min in Figure 2D. From (5), the required number of connections to target GPAT4 during that time τ is nc = lS/(τ×DL). The surface S of the LD is 4πR2 and l/L varies between 1.5 and 3 depending on the experiment; we take l/L ∼2, and define τ as τ = lS/(DL) = 8πR2/D. τ varies between 21–31min (depending on the diffusion coefficient D). Therefore nc, writing as nc = τ/τ, varies between 5 to 9 connections. (C) Time Lapse Analysis of GFP-GPAT4 Targeting to LDs. Rate of GFP-GPAT4 recruitment to LDs after cell-cell fusion for 12 different experiments.
Figure 3 with 1 supplement
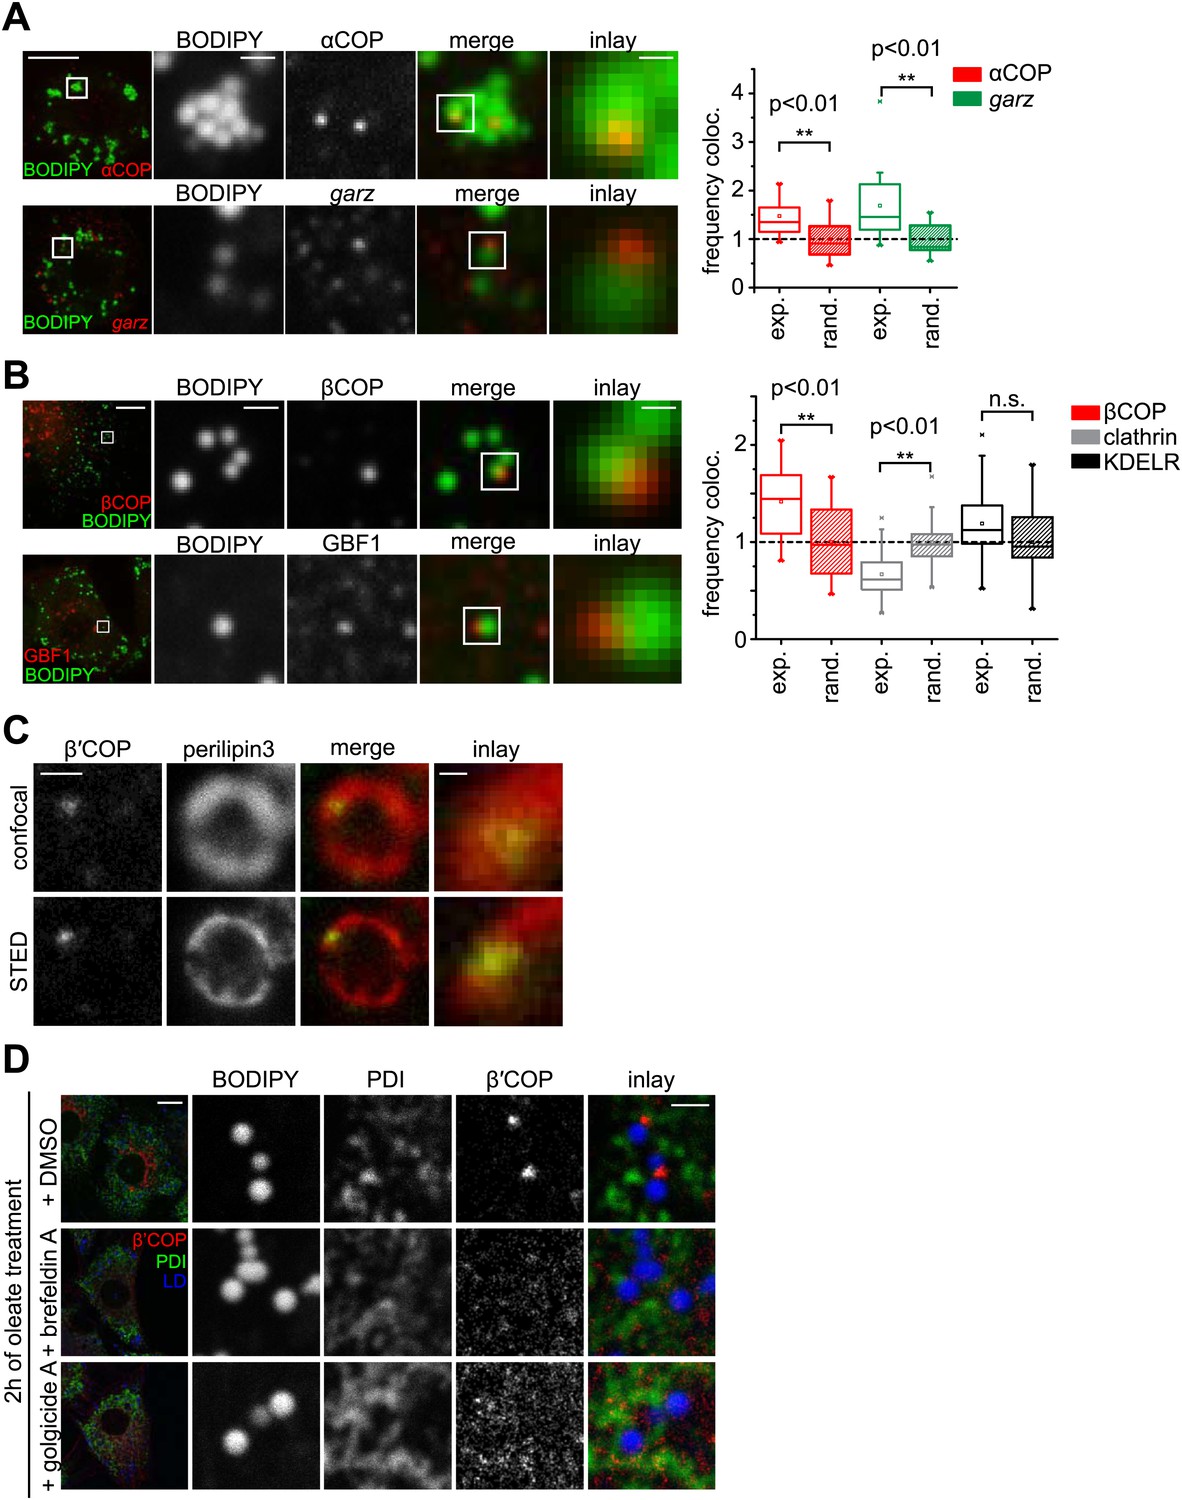
The COPI machinery localizes to the LD surface.
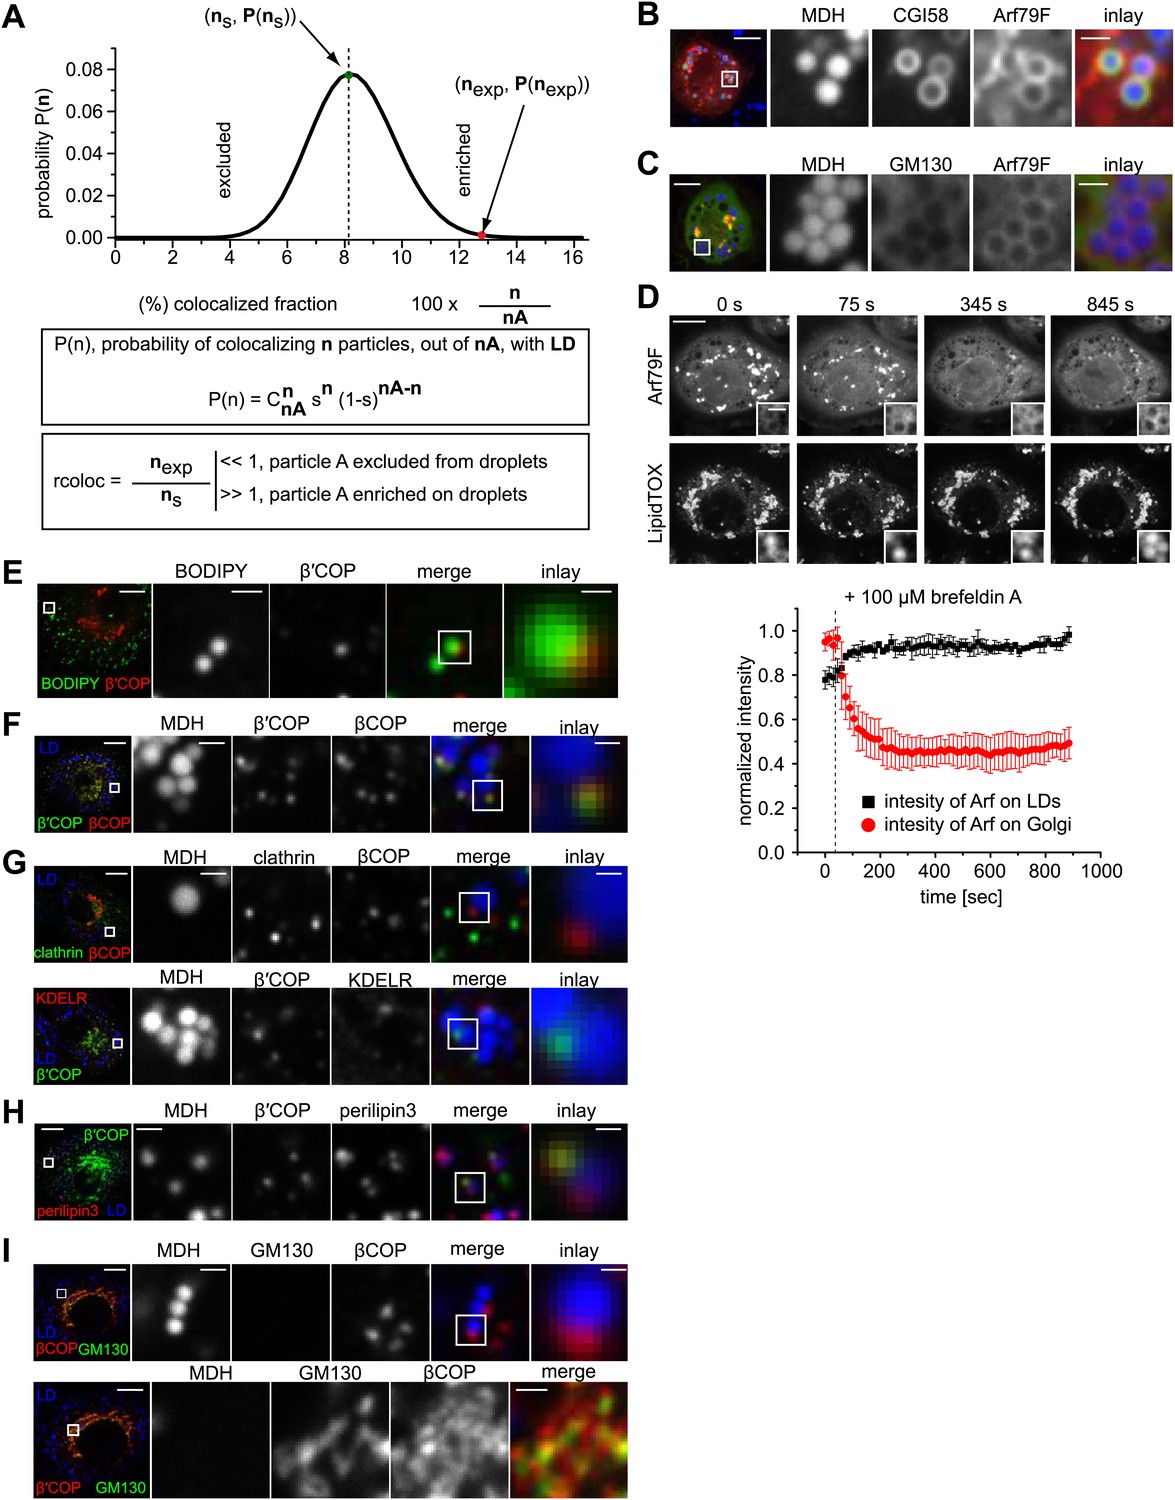
(A) The endogenous COPI machinery stained with αCOP or garz antibodies (red) localizes to LDs in S2 cells. Frequencies of colocalization of αCOP and garz spots with LDs from experiments are higher than expected from a random distribution. (B) The endogenous COPI machinery localizes to LDs in NRK cells. NRK cells stained for βCOP or GBF1 by immunofluorescence (red) show partial colocalization with LDs stained with BODIPY (green). Colocalization of βCOP with LDs in NRK cells is not random. Relative frequencies of βCOP, KDEL receptor and clathrin spots colocalizing with LDs determined in experiments are respectively compared to the frequencies of colocalization from a binomial random distribution. From the two frequencies (experiment vs simulation), a significant overrepresentation of βCOP on LDs is observed, whereas clathrin and KDEL receptor (KDELR) are not found on LDs. For (A) and (B) scale bars are 10 μm (overview) or 1 μm (first inlay) or 250 nm (second inlay). Statistical significance was tested by a student t test with p<0.01 (n = 30). (C) Localization of β’COP (green) to the LD surface (perilipin3, red) using confocal (upper panel) and super-resolution STED microscopy (lower panel). Scale bar = 500 nm (overview) or 100 nm (inlay). (D) Localization of β’COP to LDs is efficiently blocked by treatment of cells with the Arf1 GEF inhibitors brefeldin A or golgicide A. Scale bar = 10 μm (overview) or 1 μm (inlay).
Figure 3—figure supplement 1
COPI machinery localizes to the surface of LDs.
(A) The probability P of having n colocalization events from nA type A dots (A = βCOP, αCOP, clathrin, KDELR) follows a binomial distribution. ns is the fraction with the highest probability of colocalization from the random distribution. nexp is the fraction of colocalization observed in the experiment. If nexp is larger than ns, A is overrepresented on LDs. A representative plot of P(n) obtained for an experiment of βCOP colocalization with LDs is depicted showing that β COP is overrepresented on LDs (nexp >> ns). (B) Arf79F-cherry (red) colocalizes with the LD marker protein CGI-58 (green). LDs are visualized by MDH (blue). (C) GFP-GM130 (green) and Arf79F-cherry (red) show colocalization in the perinuclear region of S2 cells, representing the Golgi apparatus (lower panel) but not on LDs (upper panel). (D) Arf79F-GFP binding to LDs is stabilized by treatment with brefeldin A. Arf79F-GFP localization was followed after the addition of 100 µM brefeldin A over time. LDs are stained with LipidTOX. Left panels show representative images of such an experiment. Right panel shows a quantification of at least three independent experiments. Error bars represent the s.d. of the mean. Scale bars are 10 μm (overview) or 1 μm (inlay). (E) NRK cells stained for β’COP by immunofluorescence (red) show partial colocalization with LDs stained with BODIPY (green). (F) NRK cells costained for endogenous βCOP (red) and β’COP (green) show colocalization in the same structures on LDs visualized by MDH (blue). (G) NRK cells co-stained for endogenous clathrin (green) and βCOP (red) (upper panel) or β′COP (green) and KDELR (red) (lower panel) show no colocalization on LDs (blue). (H) Endogenous β’COP (green) colocalizes with the LD marker protein perilipin3 (red). LDs are visualized by MDH (blue). (I) NRK cells co-stained for endogenous GM130 (green) and βCOP (red) show colocalization in the perinuclear region of cells, representing the Golgi apparatus (lower panel) but not on LDs (upper panel).
Figure 4 with 1 supplement
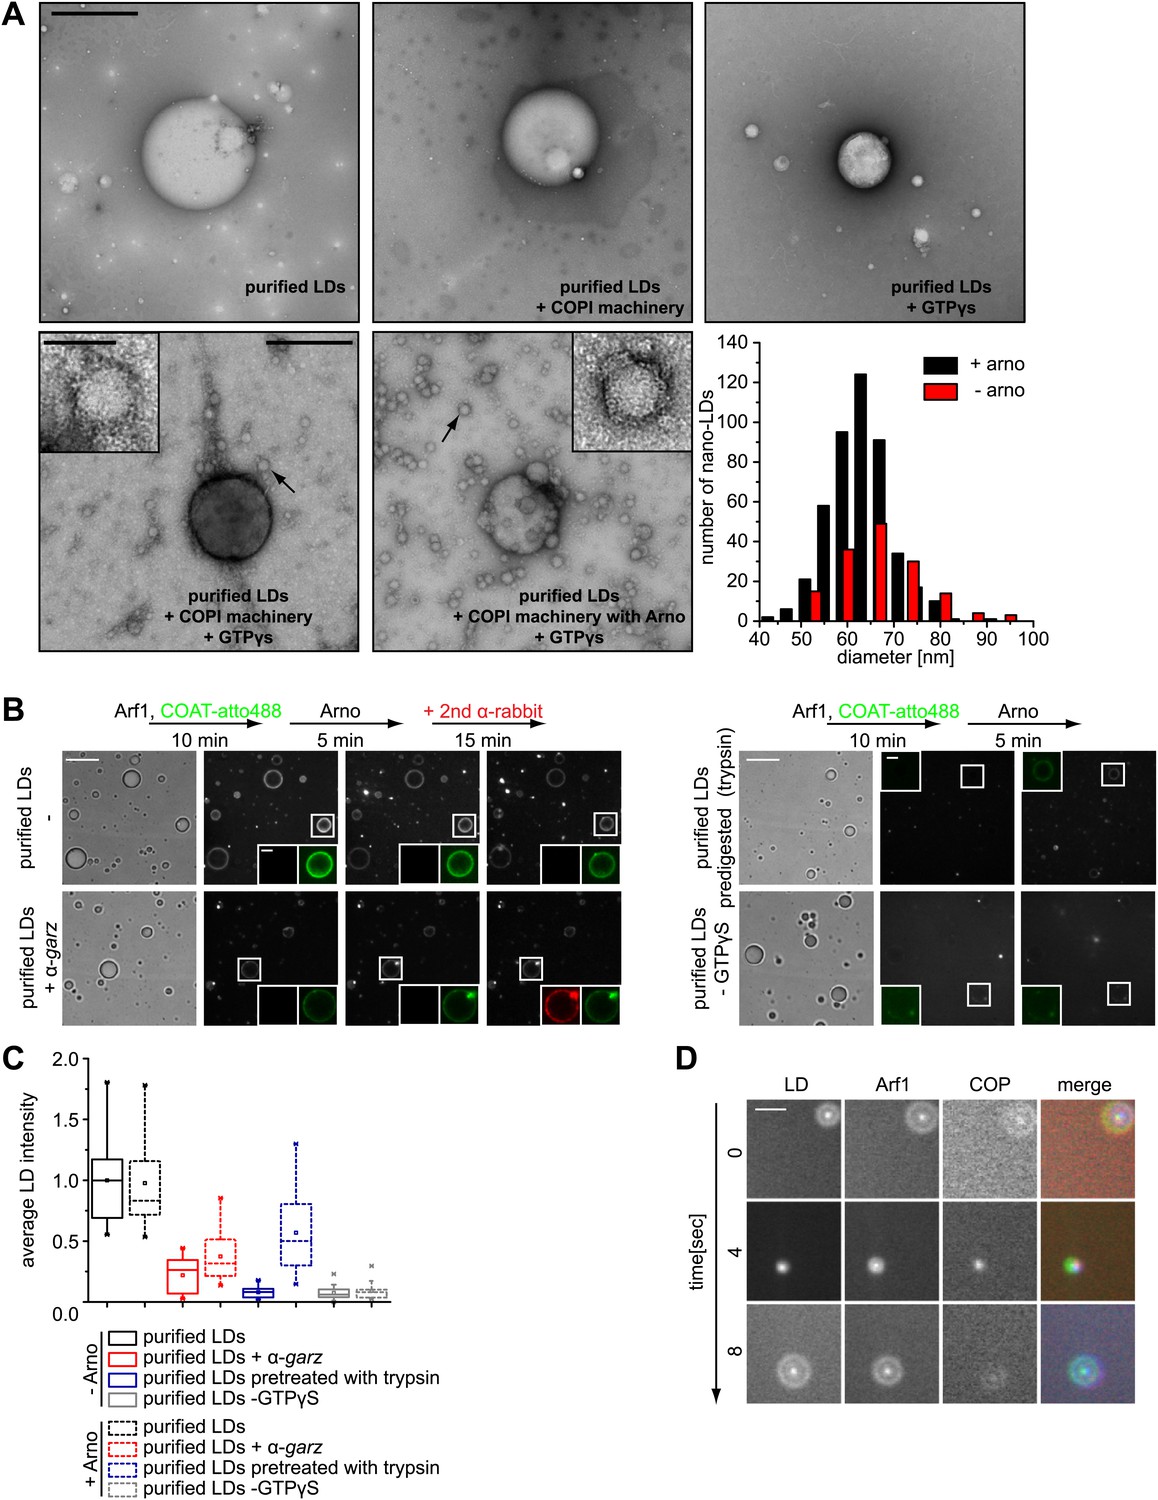
Arf1/COPI bud nano-LDs from purified, cellular LDs.
(A) Purified LDs from S2 cells were incubated with components of the Arf1/COPI machinery in the presence or absence of GTPγS. Representative electron micrographs reveal abundant nano-LDs formed in the presence of activated Arf1/COPI. Scale bars are 500 nm (overview) or 100 nm (inset). Histograms show the size distribution of nano-LDs formed. (B) Purified LDs have the ability to activate Arf1 by GTP loading. Purified LDs incubated with Arf1, GTPγS, and fluorescently labeled COPI, but without the addition of a nucleotide exchange factor, are able to recruit COPI (green) in a GTP-dependent manner (top left panel and bottom right panel). COPI binding is abolished by blocking the exchange factor garz with an antibody (bottom left panel), or by digesting LD proteins with trypsin prior to the experiment (top right panel). Recruitment is partially restored by addition of a soluble Arf1-GEF, ARNO. Adding a secondary antibody (red) that recognizes the αgarz antibody labeled LDs dependent on the presence of the primary antibody. Scale bars are 5 μm (overview) or 1 μm (inlay). (C) Quantification of the recruitment of COPI to purified LDs. For each experiment in (B) the average intensity of 15 LDs was determined. (D) Nano-LDs formed from cellular LDs into the buffer visualized by fluorescence microscopy detecting Arf1 (red), COPI (green) and LDs (MDH labeled, blue). Scale bar is 5 µm.
Figure 4—figure supplement 1
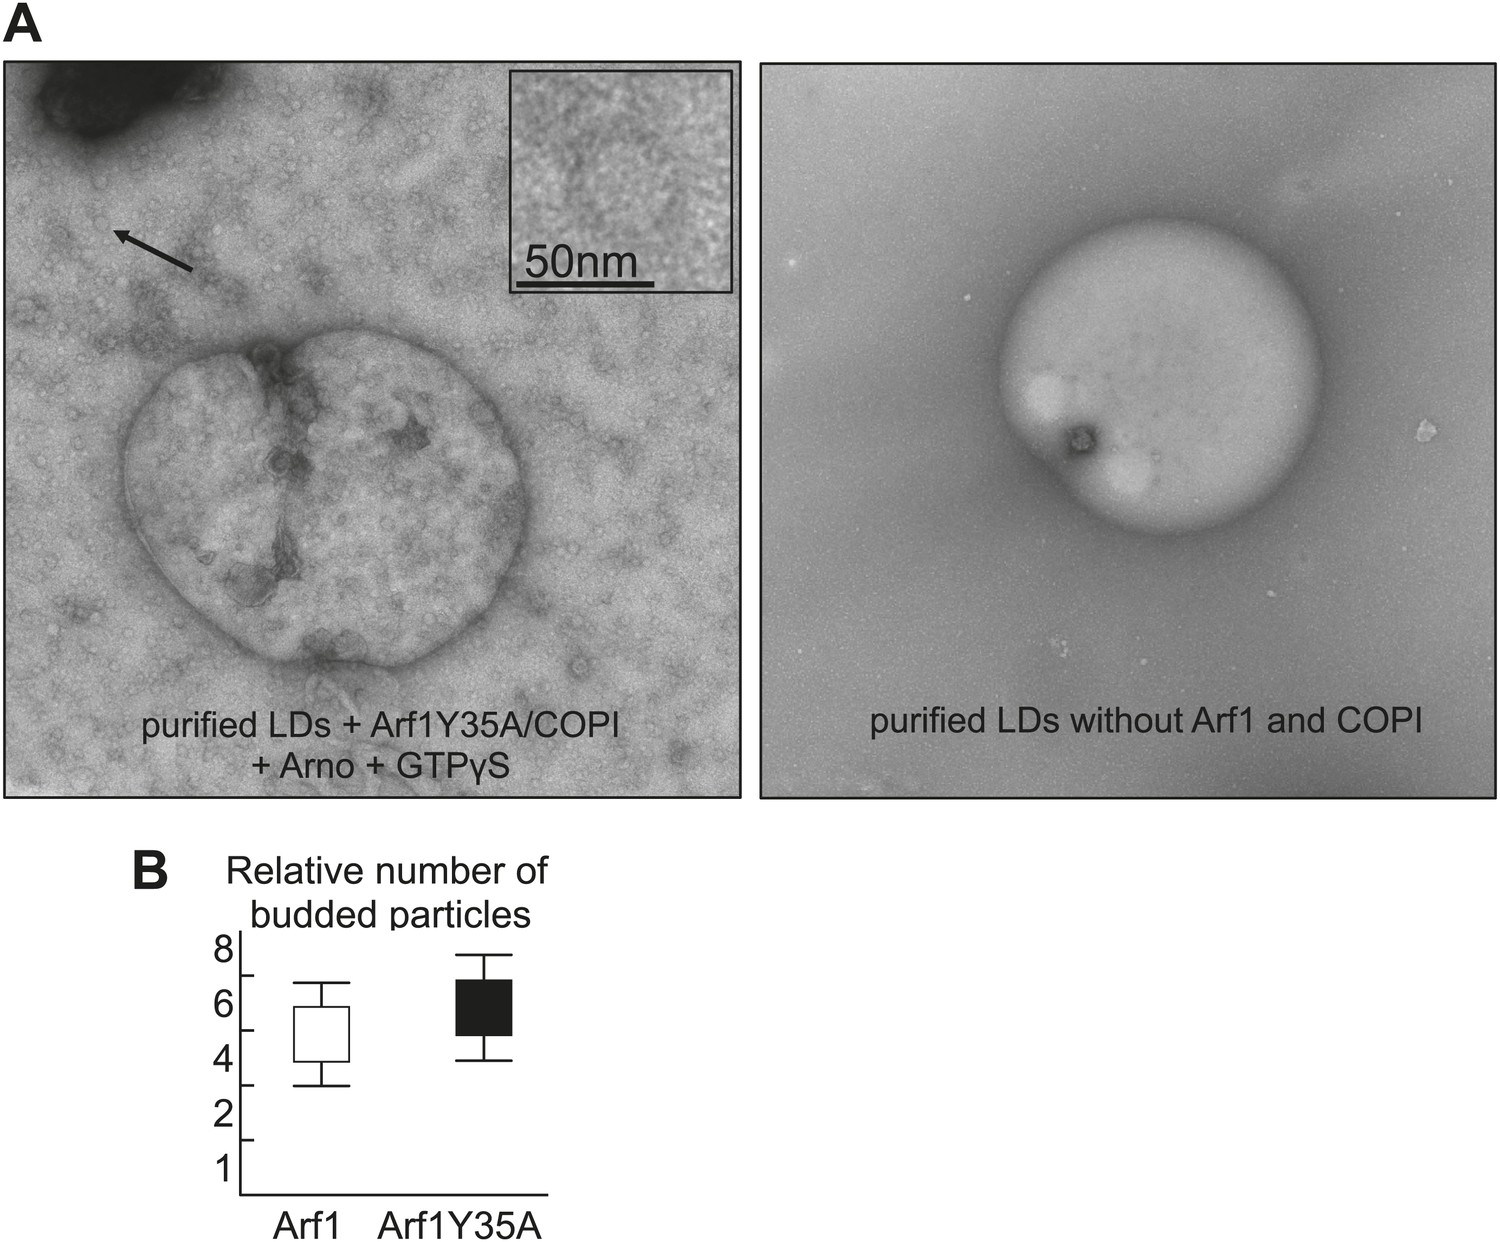
Purified LDs were incubated with Arf1-Y35A, coatomer, ARNO and GTPγS, upon budding conditions shown in Figure 4A.
The left panel shows an electron micrograph reaction products with budded nano-LDs as shown in the inlay. Dimerization deficient Arf1-Y35A is able to induce nano-LDs formation similarly to Arf1. Quantifications were done using the approach of the paper Thiam et al., 2013a. The right panel shows an electron micrograph without the COPI machinery.
Figure 5 with 1 supplement

Lack of Arf1/COPI increases phospholipids on LDs, abolishing GPAT4 LD targeting.
(A) PC and PE, but not TG levels are increased in LDs from βCOP depleted cells compared with WT cells. (B) LD (green) targeting of endogenous CCT1 (red) is delayed in cells depleted of βCOP. Time = 0 indicates the addition of oleate to the cells. Ratios between nuclear and LD targeted CCT1 signals are shown. Error bars represent the SD of the mean ratio from 100 cells. Western blot analysis shows decreased targeting of CCT1 to LDs when cells are depleted for βCOP. (C) Efficient co-depletion of CCT1 and Arf1 or βCOP restores GPAT4 targeting to LDs even in the absence of a functional COPI machinery. (D) Arf1/CCT1 or βCOP/CCT1 co-depletion blocks HRP secretion. Error bars represent the SD of triplicate measurements.
Figure 5—figure supplement 1
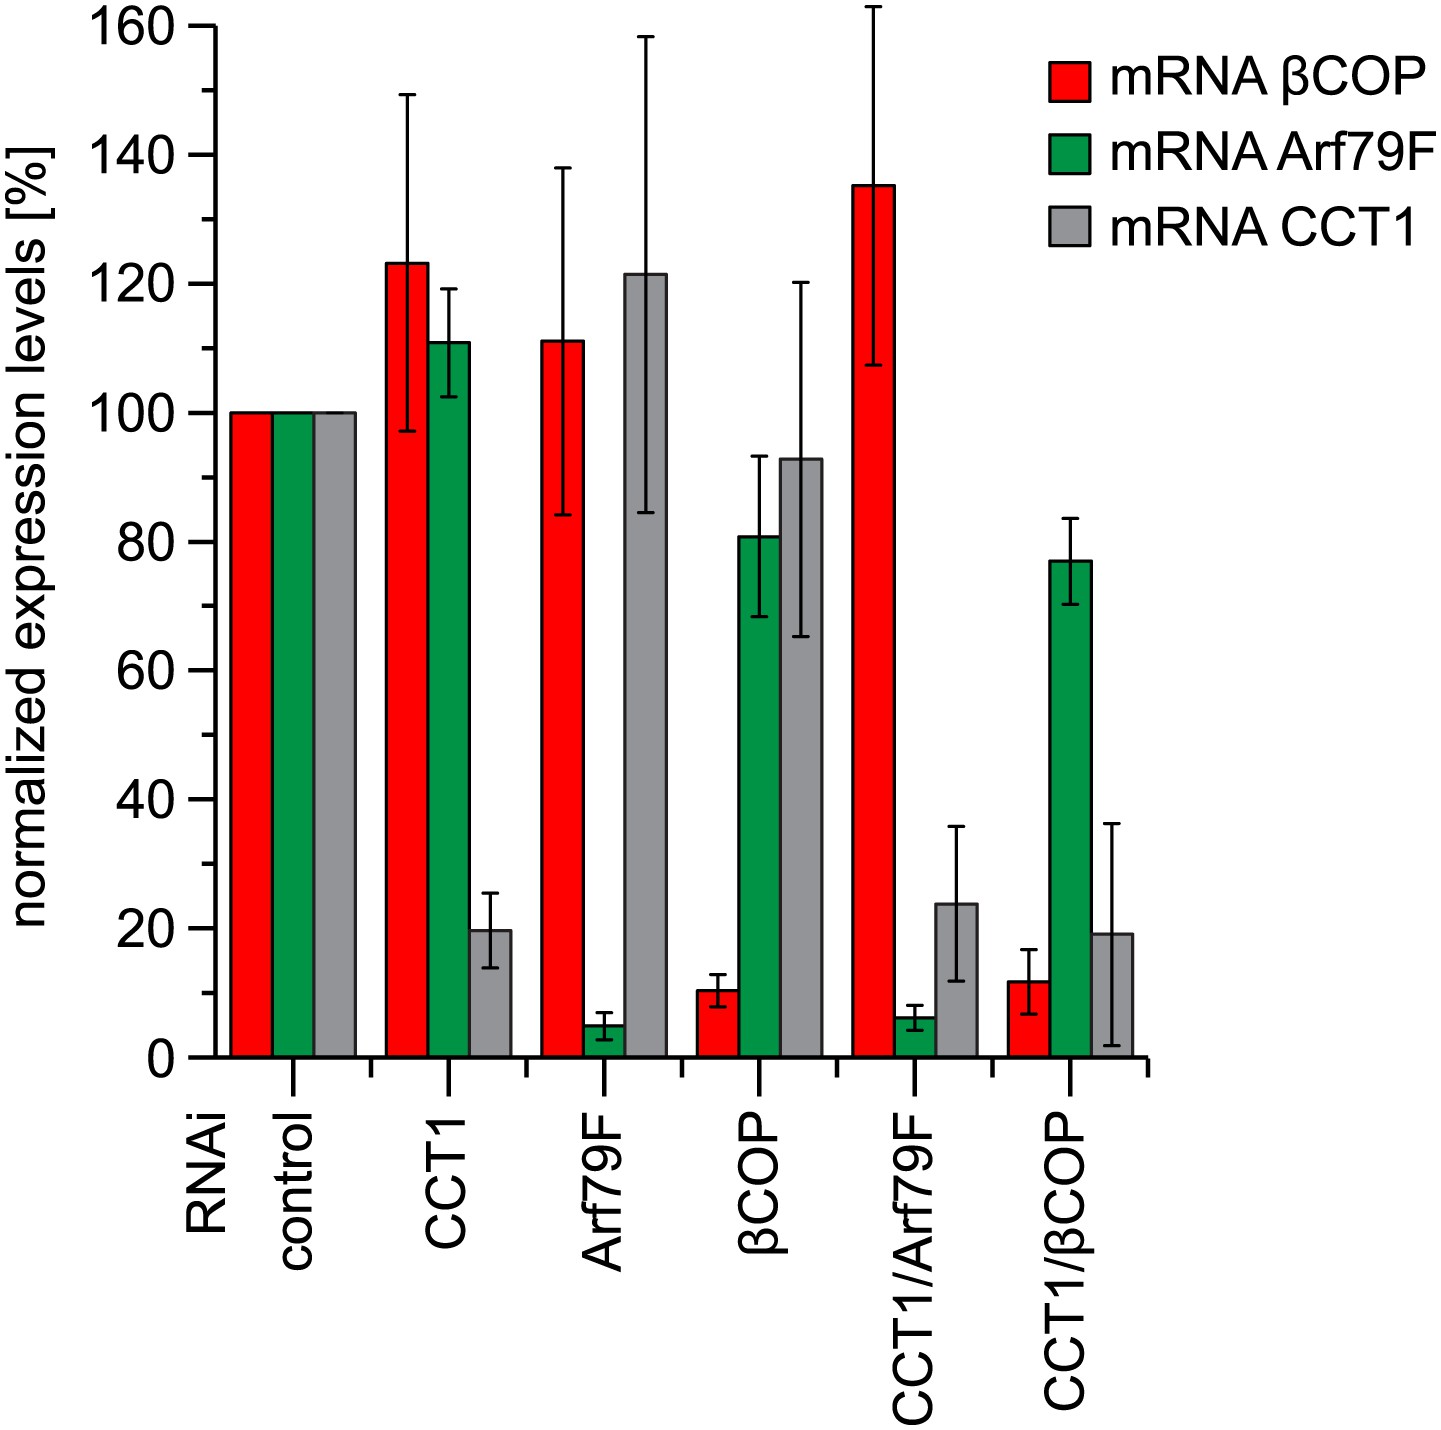
Depletion of COPI machinery components is efficient.
Expression of indicated subunits were measured by quantitative real-time CR. Primers used are listed in Table 1. Means ± SD of three experiments are shown.
Figure 6 with 1 supplement
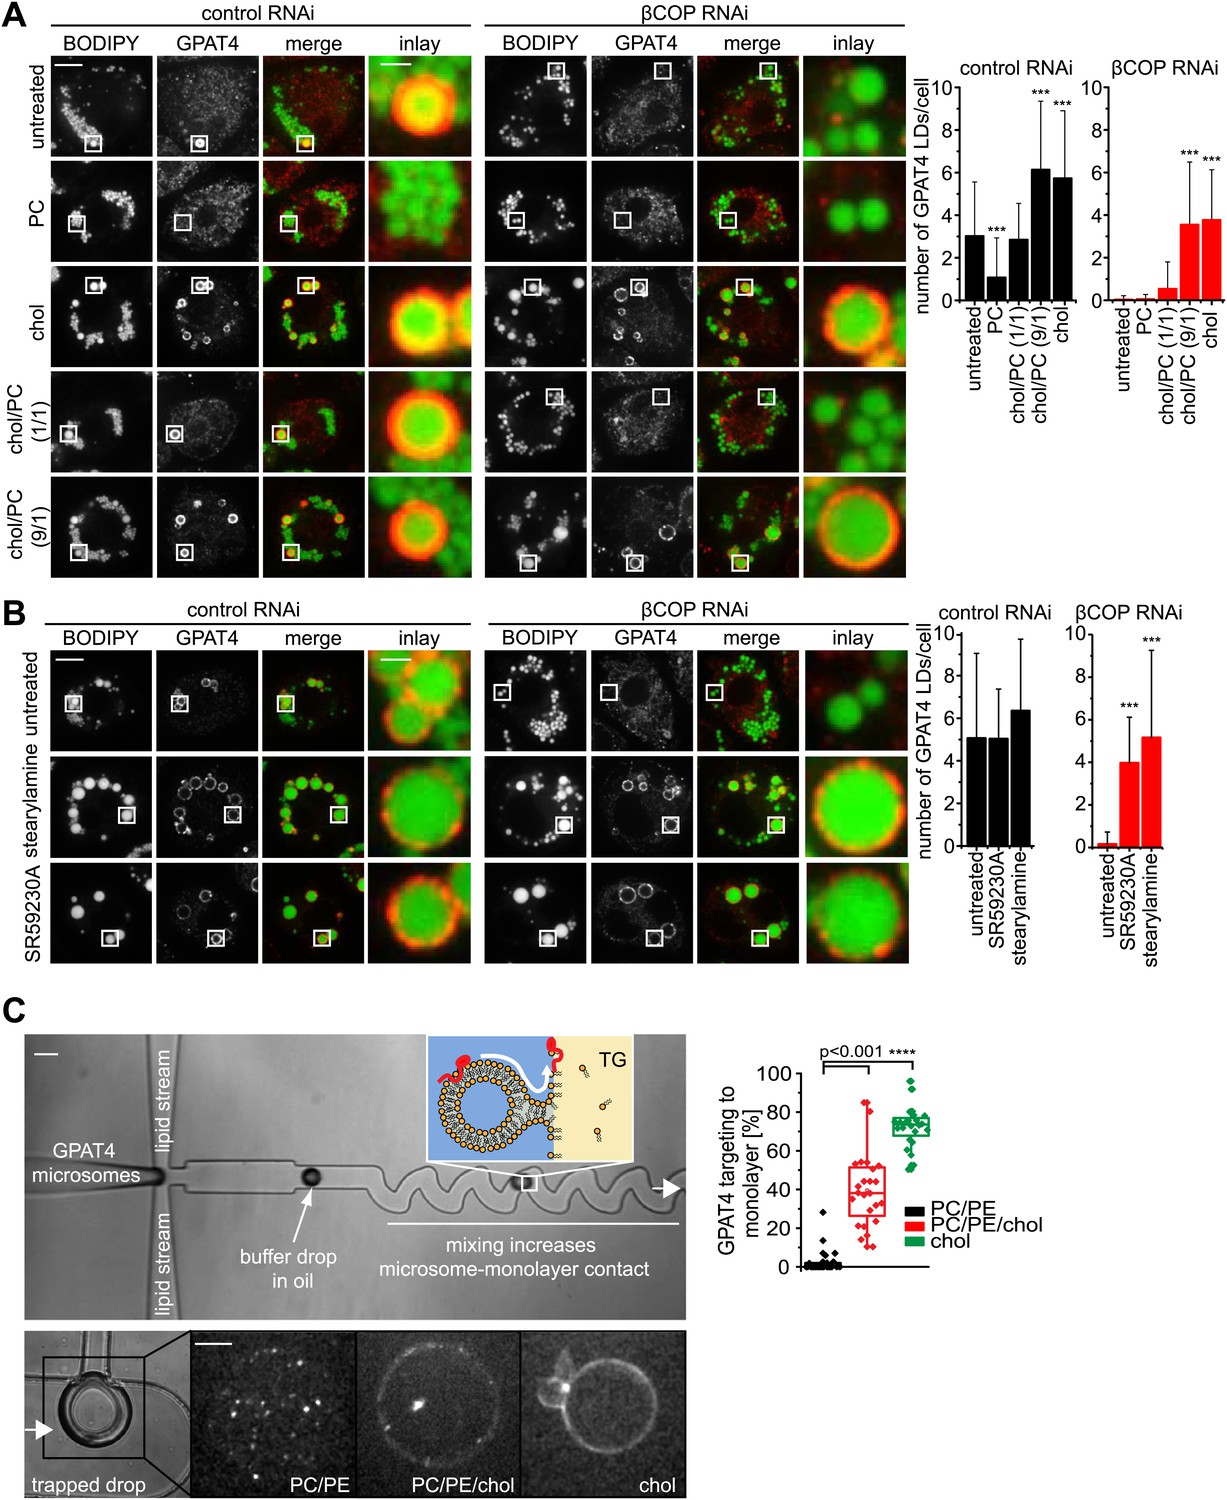
LD surface properties modulate GPAT4 LD targeting.
(A) Addition of exogenous PC to S2 cells inhibited GPAT4 LD targeting in βCOP or control RNAi-treated cells. Cholesterol (chol) addition to cells restored GPAT4 LD targeting in βCOP-depleted cells. Targeting efficiency depends on the ratio of added cholesterol and PC in βCOP or control RNAi-treated cells. (B) The artificial compounds SR59230A or stearylamine rescued GPAT4 LD targeting in βCOP depleted cells. The numbers of GPAT4-targeted LDs per cell are shown. Error bars represent the SD from the mean number of GPAT4-targeted LDs in 40 cells. Statistical significance was calculated using ANOVA, followed by a Dunnett test with a 99% confidence interval (p=0.01). (C) GPAT4 targeting to phospholipid monolayers depends on the surface tension. Buffer drops containing GPAT4-GFP-labeled microsomes are formed in a microfluidics device by flow focusing. The buffer micro-reactors are surrounded by oil of different composition (TG containing PC/PE (0.25% ea.) or PC/PE (0.25% ea.) + 2% cholesterol, or cholesterol only (0.5%); concentrations are w/w compared to TG). Each formed buffer drop pass through a zigzag region where microsomes inside the buffer drop are constantly brought into contact with the monolayer at the oil interface. Drops are arrested in a network of trapping chambers. In the presence of PC/PE, little GPAT4-GFP is targeted to the monolayer but stays in microsomes. Addition of 2% cholesterol or cholesterol alone significantly increased GPAT4-GFP signal on the monolayer. Quantification of the relocalization efficiency of GPAT4 from microsomes to the monolayer interface. Bar = 100 μm (device) or 25 µm (drop).
Figure 6—figure supplement 1
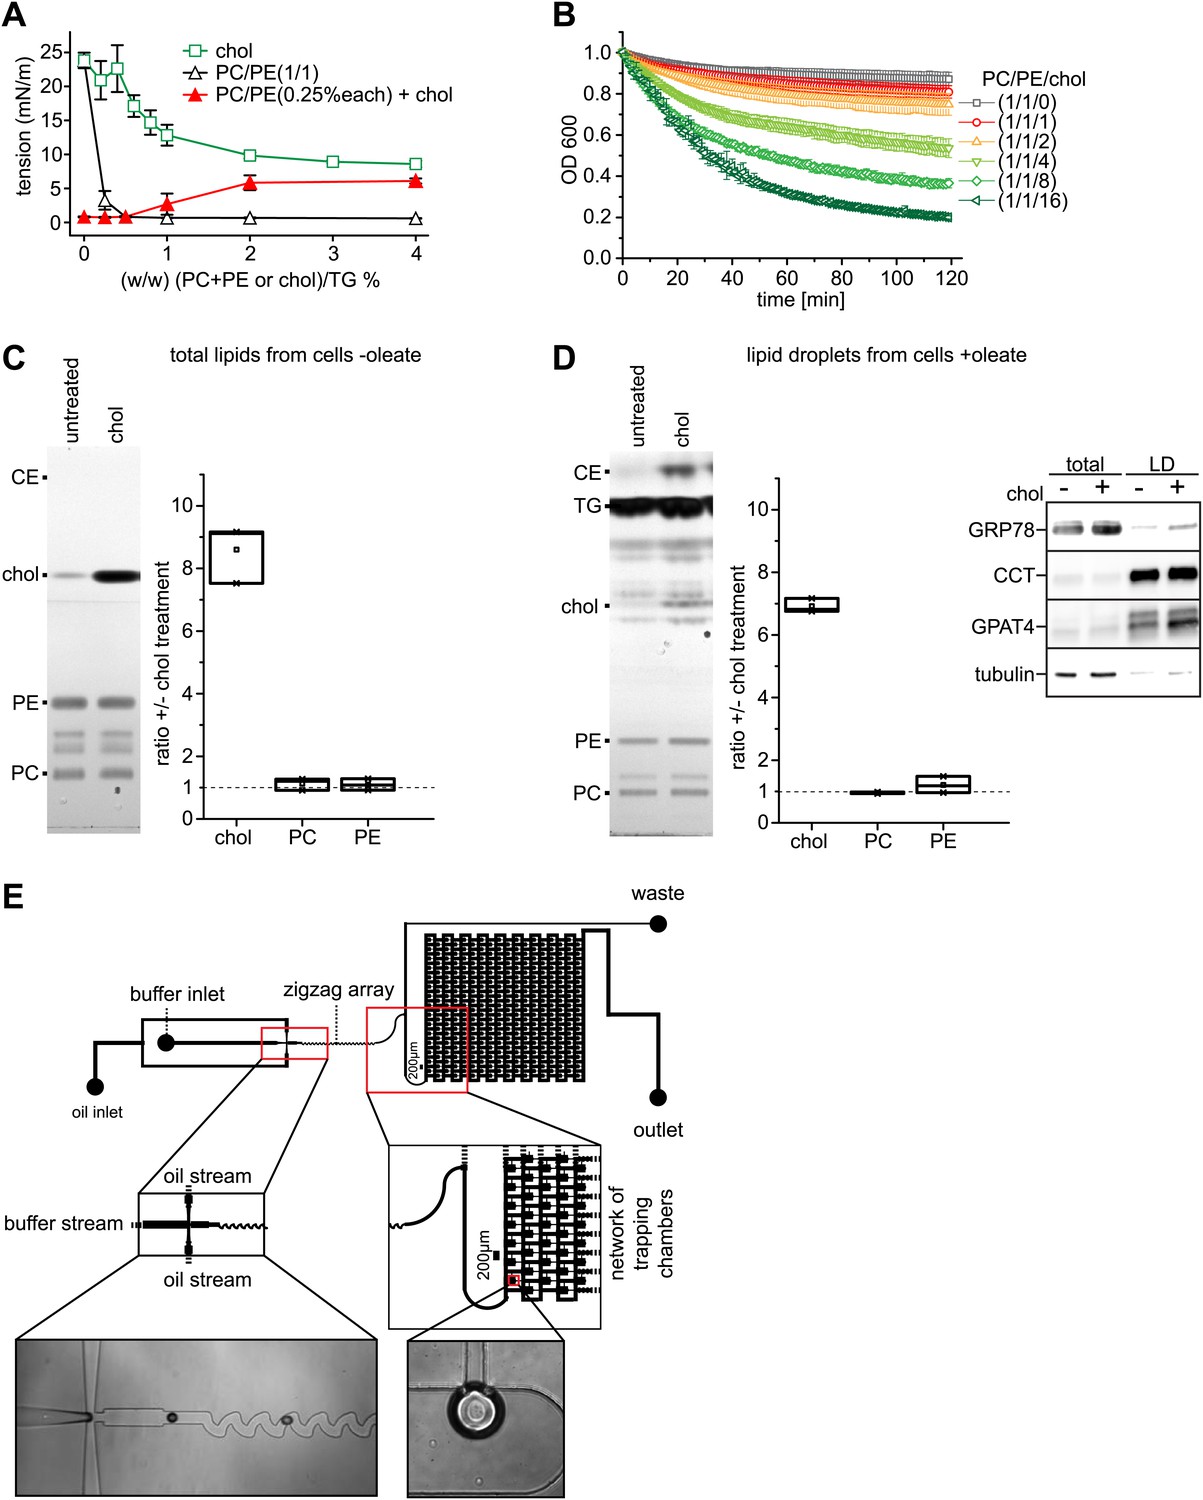
Cholesterol leads to an increase of surface tension at a TG/buffer interface.
(A) Cholesterol increases the surface tension of PC/PE monolayer at a TG/buffer interface. Surface tension was measured by a drop weight method for the indicated phospholipid/cholesterol ratios. Error bars represent the SD of the mean from a minimum of 15 experiments. (B) Cholesterol decreases the stability of artificial oil microdroplets in buffer. Time course of the optical density evolution of TG droplets with PC/PE and increasing amounts of cholesterol is shown. Error bars represent the s.d. of the mean from six independent experiments. (C and D) Exogenously added cholesterol is incorporated into cellular membranes and LDs. Total lipids from control or cholesterol-treated cells normalized to 200 μg of protein (C) or isolated LD fraction normalized to 50 μg of protein (D), where separate by TLC and stained using Hanessian's stain. The band intensity for PE, PC and cholesterol was measured from three biological replicates. Western blots show the purity of the LD fraction. (E) The initial oil stream (containing TG, cholesterol and/or phospholipids) is split into two streams that flow perpendicularly to a buffer stream with GPAT4-GFP containing microsomes. ‘Flow focusing’ the oil streams continuously pinches small buffer micro-reactors with defined size into the oil stream. After formation, the micro-reactor enters a zigzag pattern that creates a chaotic flow inside the micro-reactor. This increases the contact of the encapsulated microsomes with the interfacial monolayer formed at the buffer micro-reactor phase and the surrounding oil. Micro-reactors are arrested in a network of trapping chambers after the zigzag, allowing imaging and analysis of the monolayer targeted GPAT4 population.
Videos
Video 1
Time lapse analysis of GFP-GPAT4 targeting to LDs in cell–cell fusion experiments.
https://doi.org/10.7554/eLife.01607.007
Video 2
Time lapse video of Arf1/COPI coated nano-LDs formed from cellular LDs.
Nano-LDs are visualized by fluorescence microscopy detecting Arf1 (red), COPI (green) and LDs (MDH labeled, blue). Shifts between channels are due to short time delays between channel acquisitions, during which nano-LDs diffuse in solution.
Tables
Table 1
Sequences of primers used for RNAi experiments
| Gene | Gene ID | Forward | Reverse |
|---|---|---|---|
| garz | CG8487 | TTGCACAAACTTTGATTCCTG | CATATCGGCGCACTATAATC |
| Arf79F | CG8385 | TAGCGATTAGCGTTCTTCA | CTGCCAAATGCAATGAACG |
| αCOP | CG7961 | AGGAAGCTAAGCTTGTCAAA | GGACGAGTCTGGAGTGTTT |
| βCOP | CG6223 | CCAGTCAGTTGGGTGACCTT | CCTAGCAAGCCCATAACCAA |
| β’COP | CG6699 | ATCTTGCTTCCCACAACGTC | CCGAAGGACAACAACACCTT |
| γCOP | CG1528 | ATTACGTTCACAGCACGCAG | CAGAGGAGGGCTATGACGAC |
| ζCOP | CG3948 | CCGTCGCAGATCTCGTC | GCATCCTGGCCAAGTACTA |
| εCOP | CG9543 | AGGTGCCAGATGTTGGTCTC | CCAACTCGGTGCTATTCGAT |
| δCOP | CG14813 | AAGCTGTCTGCGCCATAAAT | TCCAGTGGCACATTCCAATA |
| CCT1 | CG1049 | ACATCTATGCTCCT1CTCAAGGC | CTCTGCAGACTCTGGTAACTGC |
| pBluescript | AATTCGATATCAAGCTTATCGAT | TAAATTGTAAGCGTTAATATTTTG |
Table 2
Sequences of primers used for RT-PCR
| Gene | Gene ID | Forward | Reverse |
|---|---|---|---|
| GAPDH1 | CG12055 | TTGTGGATCTTACCGTCCG | ACCTTAGCCTTGATTTCGTC |
| Arf79F | CG8385 | TTACAGTGTGGGATGTGGG | GAAGATAAGACCTTGTGTATTCTGG |
| βCOP | CG6223 | GACTTCTGCAATATCAAGGCC | GGTTTCGTAAACAATATTGCCG |
| CCT1 | CG1049 | GATACGGAGTGCGTCA | AATTCATCGGACAGAGTCCA |
Download links
A two-part list of links to download the article, or parts of the article, in various formats.
Downloads (link to download the article as PDF)
Open citations (links to open the citations from this article in various online reference manager services)
Cite this article (links to download the citations from this article in formats compatible with various reference manager tools)
Arf1/COPI machinery acts directly on lipid droplets and enables their connection to the ER for protein targeting
eLife 3:e01607.
https://doi.org/10.7554/eLife.01607


