Multiple knockout mouse models reveal lincRNAs are required for life and brain development
- Harvard University, United States
- Broad Institute of MIT and Harvard, United States
- Massachusetts Institute of Technology, United States
- Rutgers, The State University of New Jersey, United States
- Regeneron Pharmaceuticals Inc., United States
- Harvard Medical School, United States
Figures
Figure 1 with 2 supplements
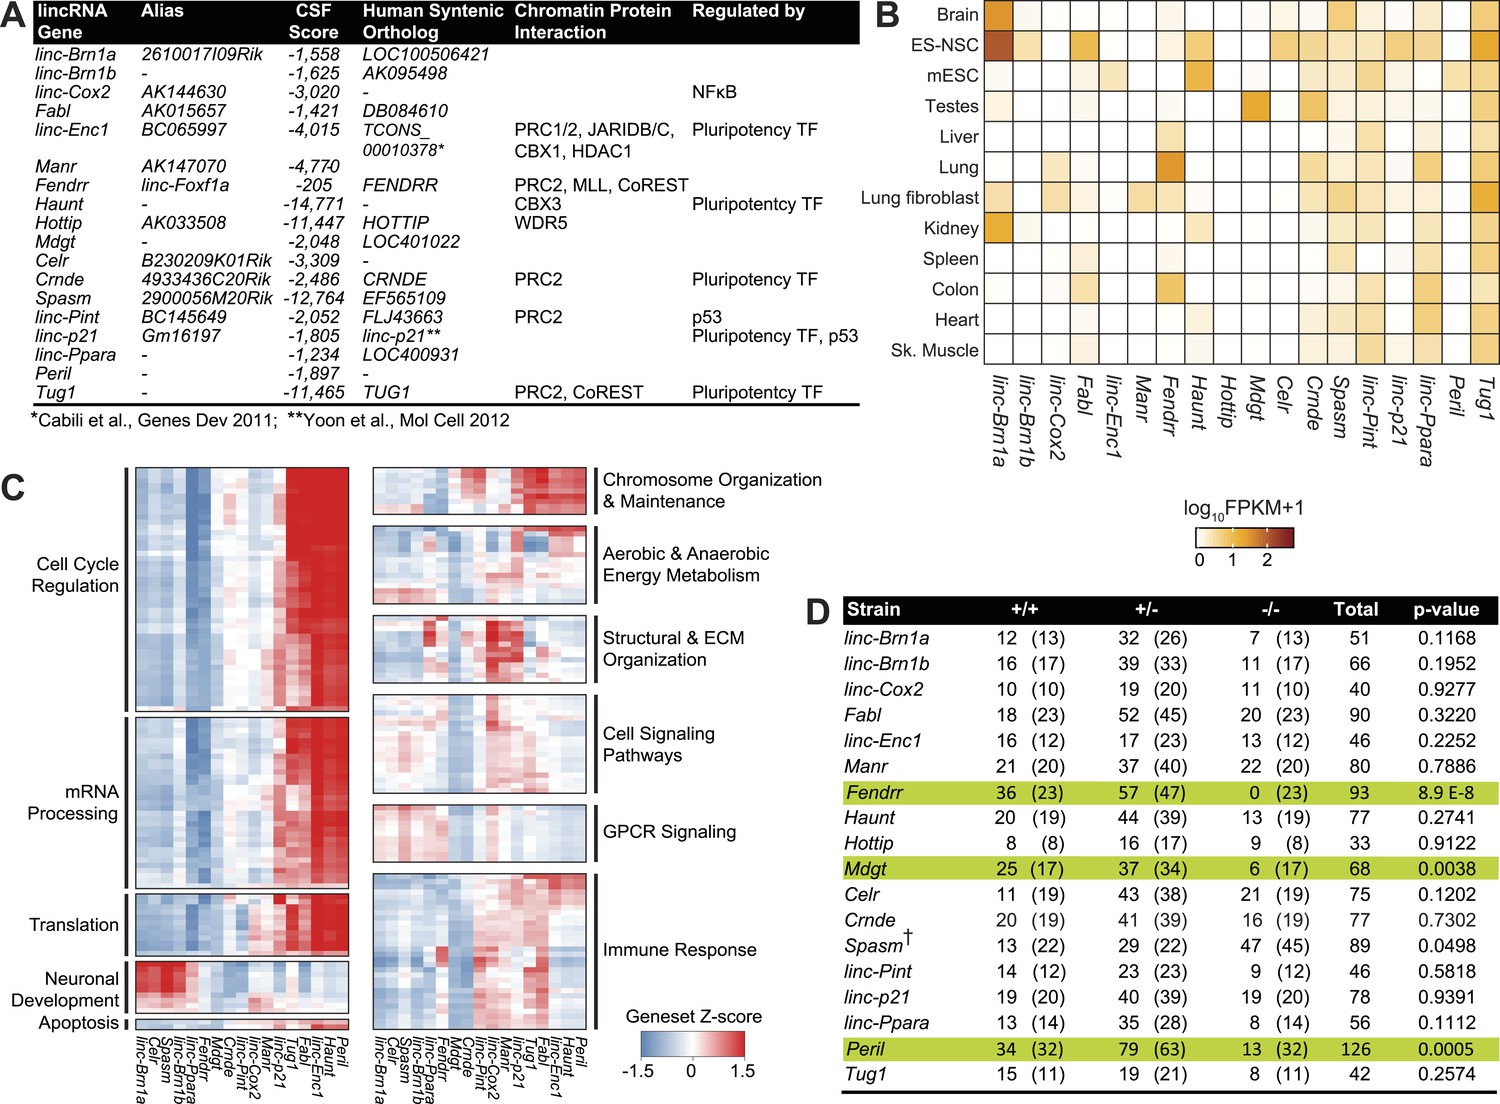
Properties of the 18 lincRNA candidates and Mendelian inheritance.
(A) List of the 18 lincRNA candidates for targeted deletion in mouse and overview of criteria used for their selection. (B) Heatmap of log10 FPKM+1 expression levels of the 18 lincRNAs in a panel of adult mouse tissues and cell lines via RNA-Seq. (C) Guilt-by-association (GBA) analysis for 17/18 lincRNA candidates. Individual tiles represent significant (p<1.0 × 10⁻⁶) gene sets from the CP Reactome collection at MSigDB. Tiles are filled based on the Z-score of the Pearson correlation values between a given lincRNA and the genes within the gene set across a compendium of RNA-Seq samples. (D) Mendelian inheritance of the 18 lincRNA mutant alleles from the progeny of heterozygote intercrosses. Numbers of observed and expected (in parenthesis) wild-type (+/+), heterozygote (+/−) and homozygote (−/−) mice are indicated. Mice were genotyped at weaning age. The p value is based on X2 test. † The Spasm gene is located on the X chromosome.
Figure 1—figure supplement 1
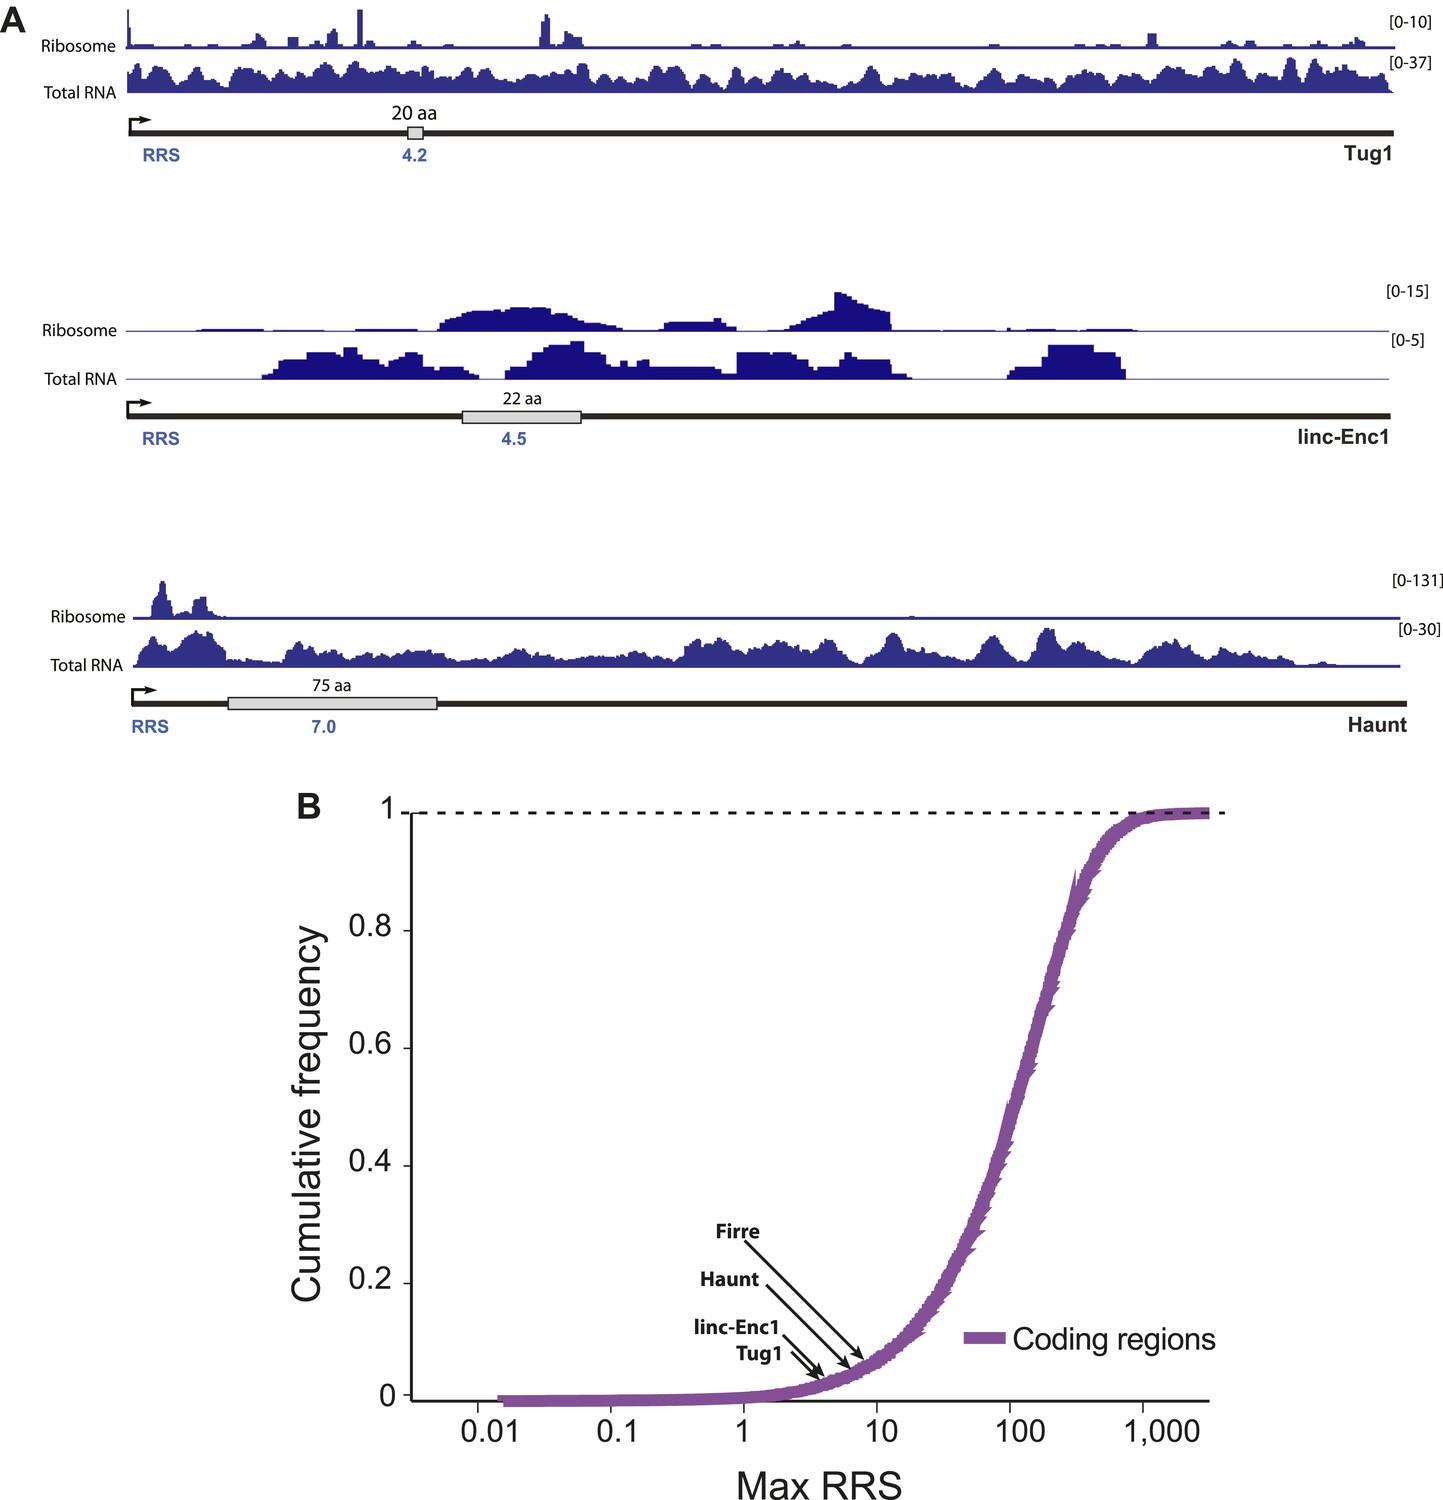
Ribosome release score of lncRNAs.
The ribosome release score (RRS) measures evidence of ribosome disassociation at the stop codon of a putative coding region. A putative coding region is defined as the region between a start codon and then next in-frame stop codon. Its putative 3′-UTR is defined as the region beginning immediately after the stop codon and ending at the next start codon in any frame. The RRS score is defined as the total number of ribosome-associated reads overlapping the putative coding region, divided by the number of ribosome-associated reads contained within the 3′-UTR. This ratio is then normalized by the same ratio for total RNA reads. (A) The ORF with maximum RRS score for each lincRNA is shown. (B) Maximum RRS scores of lincRNAs are compared to the distribution of RRS scores for known coding genes.
Figure 1—figure supplement 2
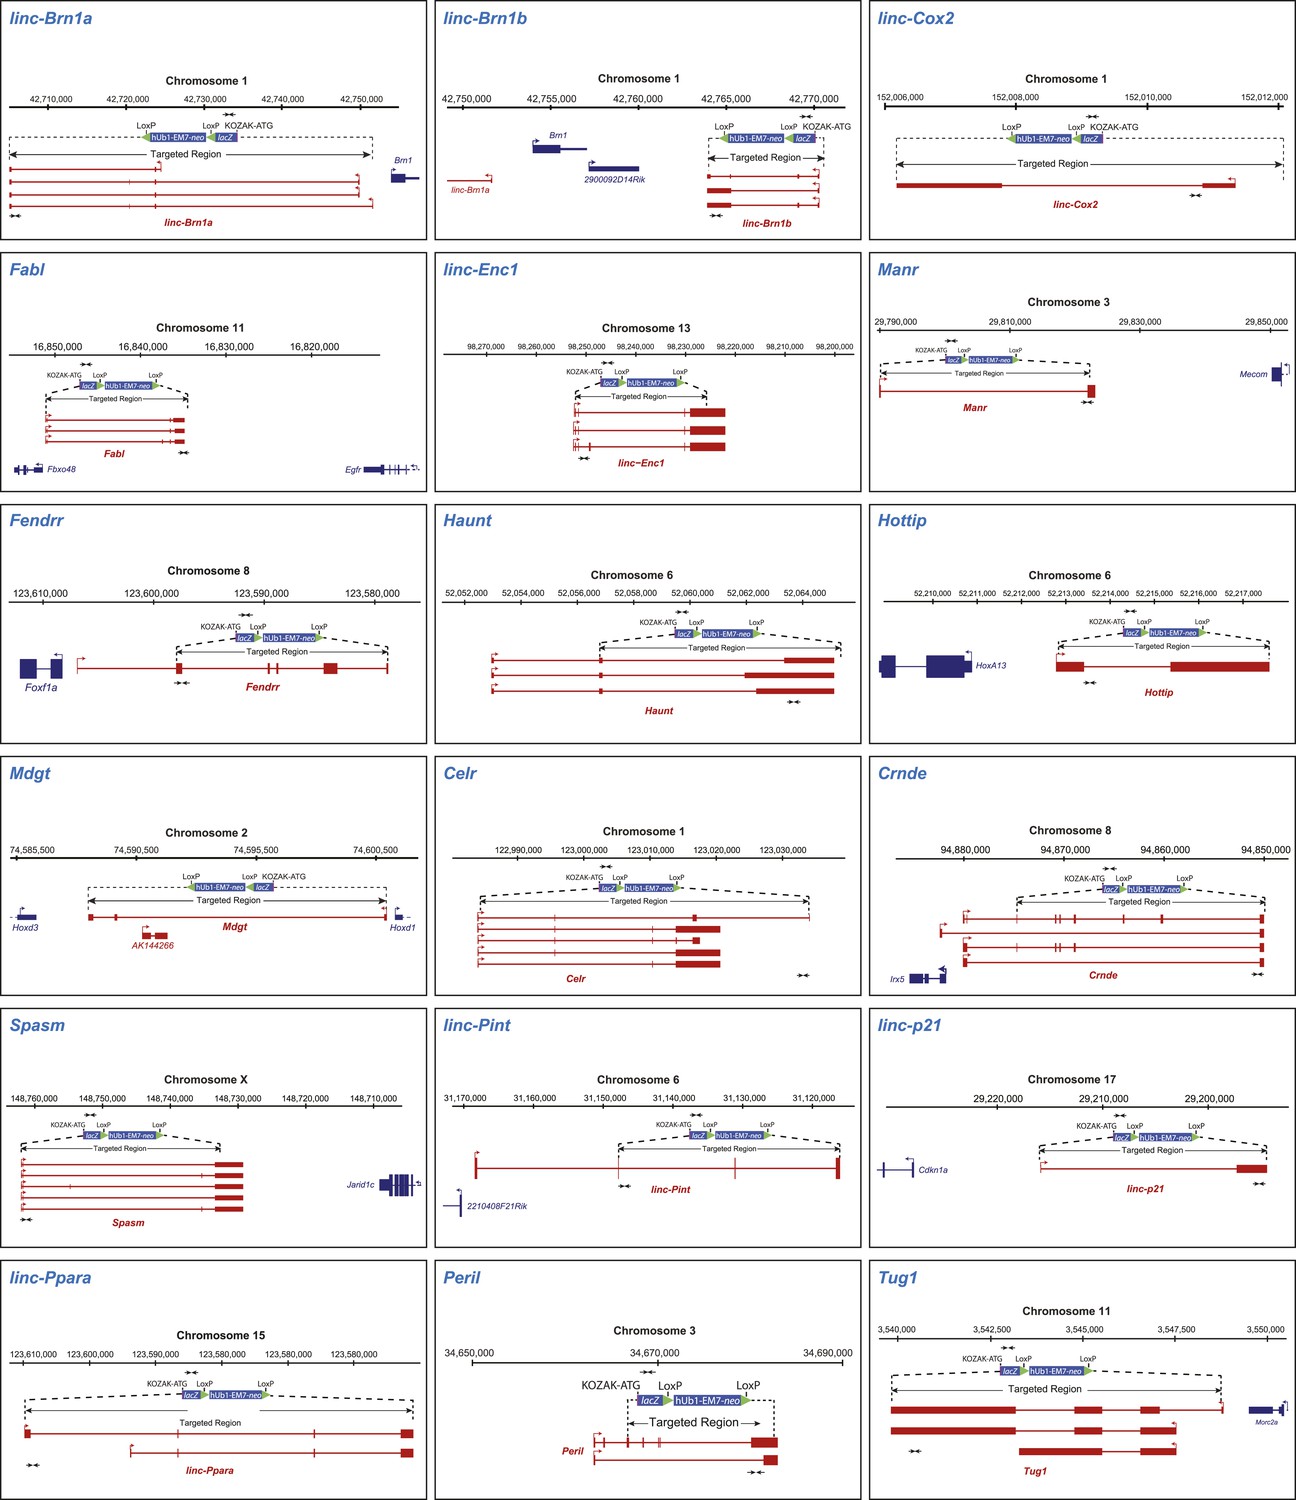
lincRNA candidates knockout targeting strategy.
Genomic locus and targeted deletion scheme for the 18 lincRNA candidates. Briefly, each lincRNA gene was replaced by a ß-galactosidase (lacZ) reporter cassette containing a KOZAK-ATG sequence, polyadenylation signal, and a LoxP-flanked neomycin (neo) resistance gene driven by the human ubiquitin C promoter (hUb1) (mammalian cells) and EM7 promoter (for gap repair cloning selection in bacteria). Arrows indicate location of the primer sets used for genotyping.
Figure 2 with 1 supplement

Deletion of Peril leads to reduced viability.
(A) Genotyping results from heterozygote intercrosses (Upper panel) at different developmental stages (*pups dying within days after birth) and homozygote intercrosses (Lower panel) at birth. The p value is based on X2 test. (B) Newborn (P0) Peril−/− mutants and wild-type littermates. (C) Peril genomic locus and targeting scheme. (D) RNA-Seq expression profile for Peril across a panel of mouse tissues and cell types. (E) Single-molecule FISH targeting Peril in wild type mouse embryonic stem cells (mES). Nuclei were stained with DAPI. (F) Whole mount and coronal section lacZ stainings reporting expression of Peril in the brain and spinal cord of a heterozygote E14.5 embryo. LGE/CGE, Lateral and Caudal Ganglionic Eminence; P, Pons; CP, Choroid Plexus; SC, Spinal Cord; D, dorsal; V, ventral; R, rostral; C, caudal. Scale bars = 1 mm, whole brains; 500 µm, sections. (G) Relative expression levels of Peril as assessed by RT-PCR and expression estimates (FPKM) of the neighboring genes Sox2 and Sox2ot as assessed by RNA-Seq in E18.5 brain of homozygote mutant and wild-type littermates (n = 2 each).
Figure 2—figure supplement 1
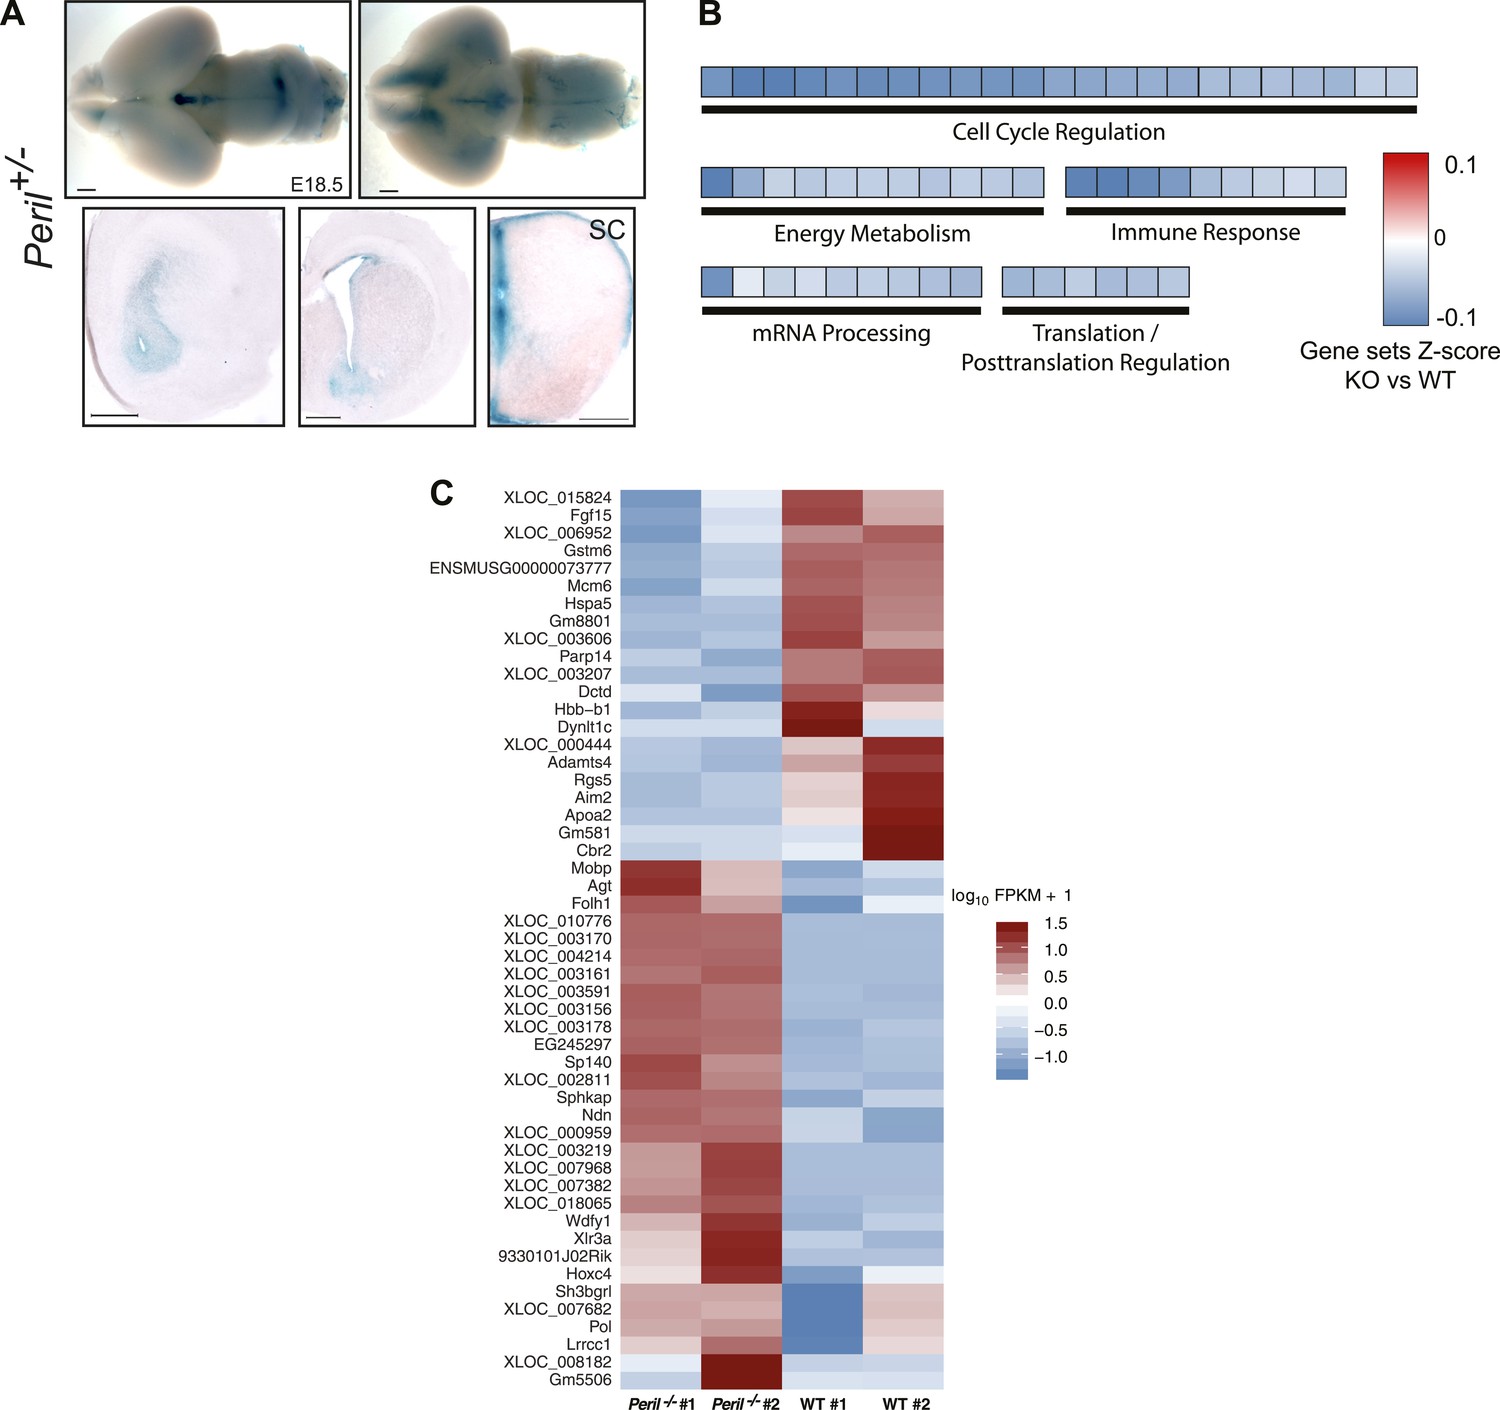
Peril E18.5 brain differential RNA-Seq analysis.
(A) lacZ staining reporting expression of Peril in brain and spinal cord of a heterozygote E18.5 embryo. SC, Spinal Cord. Scale bars = 1 mm whole brains, 500 µm sections. Scale bars = 1 mm whole brains, 500 µm sections. SC, spinal cord. (B) GSEA of Peril−/− vs wild-type E18.5 total brain RNA-Seq. Each tile is a significant (q<0.001; Mann-Whitney, BH) gene set from the Reactome collection at mSigDB, based on the Peril−/−/wild-type ranking of test-statistic values from a Cuffdiff2 differential analysis. Tiles are shaded based on the z-score of the test-statistic for genes within the given gene set, relative to all genes for a given condition to show direction of expression relative to wild-type. (C) Heatmap of significant (q<0.05, CuffDiff2) differentially expressed genes (log10 FPKM+1) in Peril−/− vs wild-type E18.5 total brain by RNA-Seq.
Figure 3 with 2 supplements

Fendrr−/− pups have multiple defects in lung, heart and gastrointestinal tract.
(A) Fendrr locus and targeting strategy. Arrows indicate location of the primers used for genotyping. (B) Genotyping results from heterozygote intercrosses at embryonic stages E14.5, E18.5 and at birth (P0). The p value is based on X2 test. (*) All newborns died within 24 hr after birth. (C) Fendrr−/− E18.5 embryos and wild-type littermates. (D) RNA-Seq expression profile for Fendrr across a panel of mouse tissues and cell types. (E and F) lacZ reporter stained organs and sections showing expression of Fendrr in specific regions of the lung (Lu), trachea (Tr) and esophagus (Es), but not in heart (H) in E14.5 and E18.5 embryo (E) and in the gut and stomach (St) (F). Sm, smooth muscle; Ep, Epithelia; Me, Mesenchyme; Ly, Lymphoid aggregates. Scale bars = 1 mm whole organ, 200 µm sections. (G) Number of E18.5 embryos successfully breathing after surgical delivery. (H) Size difference of Fendrr−/− lungs at E14.5 compared to wild-type littermates (n = 3 each). (I–K) Representative hematoxylin and eosin (H&E) stained sections showing unstructured vessels (arrow) in E14.5 Fendrr mutant lungs compared to wild type littermates (n = 3) (I, upper panels), alveolar defects at E18.5 (I, lower panel), thinner mesenchymal layer of the mucosa and external smooth muscle layer of the oesophagus (J) and ventricular septal defects in the heart (K) of Fendrr−/− E18.5 embryos compared to wild type (n = 3). Scale bars= 500 µm, 100 µm for esophagus. (L) RNA-Seq expression levels of Fendrr and the neighboring coding gene Foxf1a in E18.5 lung of homozygote mutant and wild-type littermates (n = 2 each). (M) GSEA of Fendrr−/− vs wild-type E18.5 lung and total brain RNA. Each tile is a significant (q<0.001; Mann-Whitney, BH) gene set from the Reactome collection at mSigDB, based on the Fendrr−/−/wild-type ranking of test-statistic values from a Cuffdiff2 differential analysis. Tiles are shaded based on the z-score of the test-statistic for genes within the given gene set, relative to all genes for a given condition to show direction of expression relative to wild-type.
Figure 3—figure supplement 1
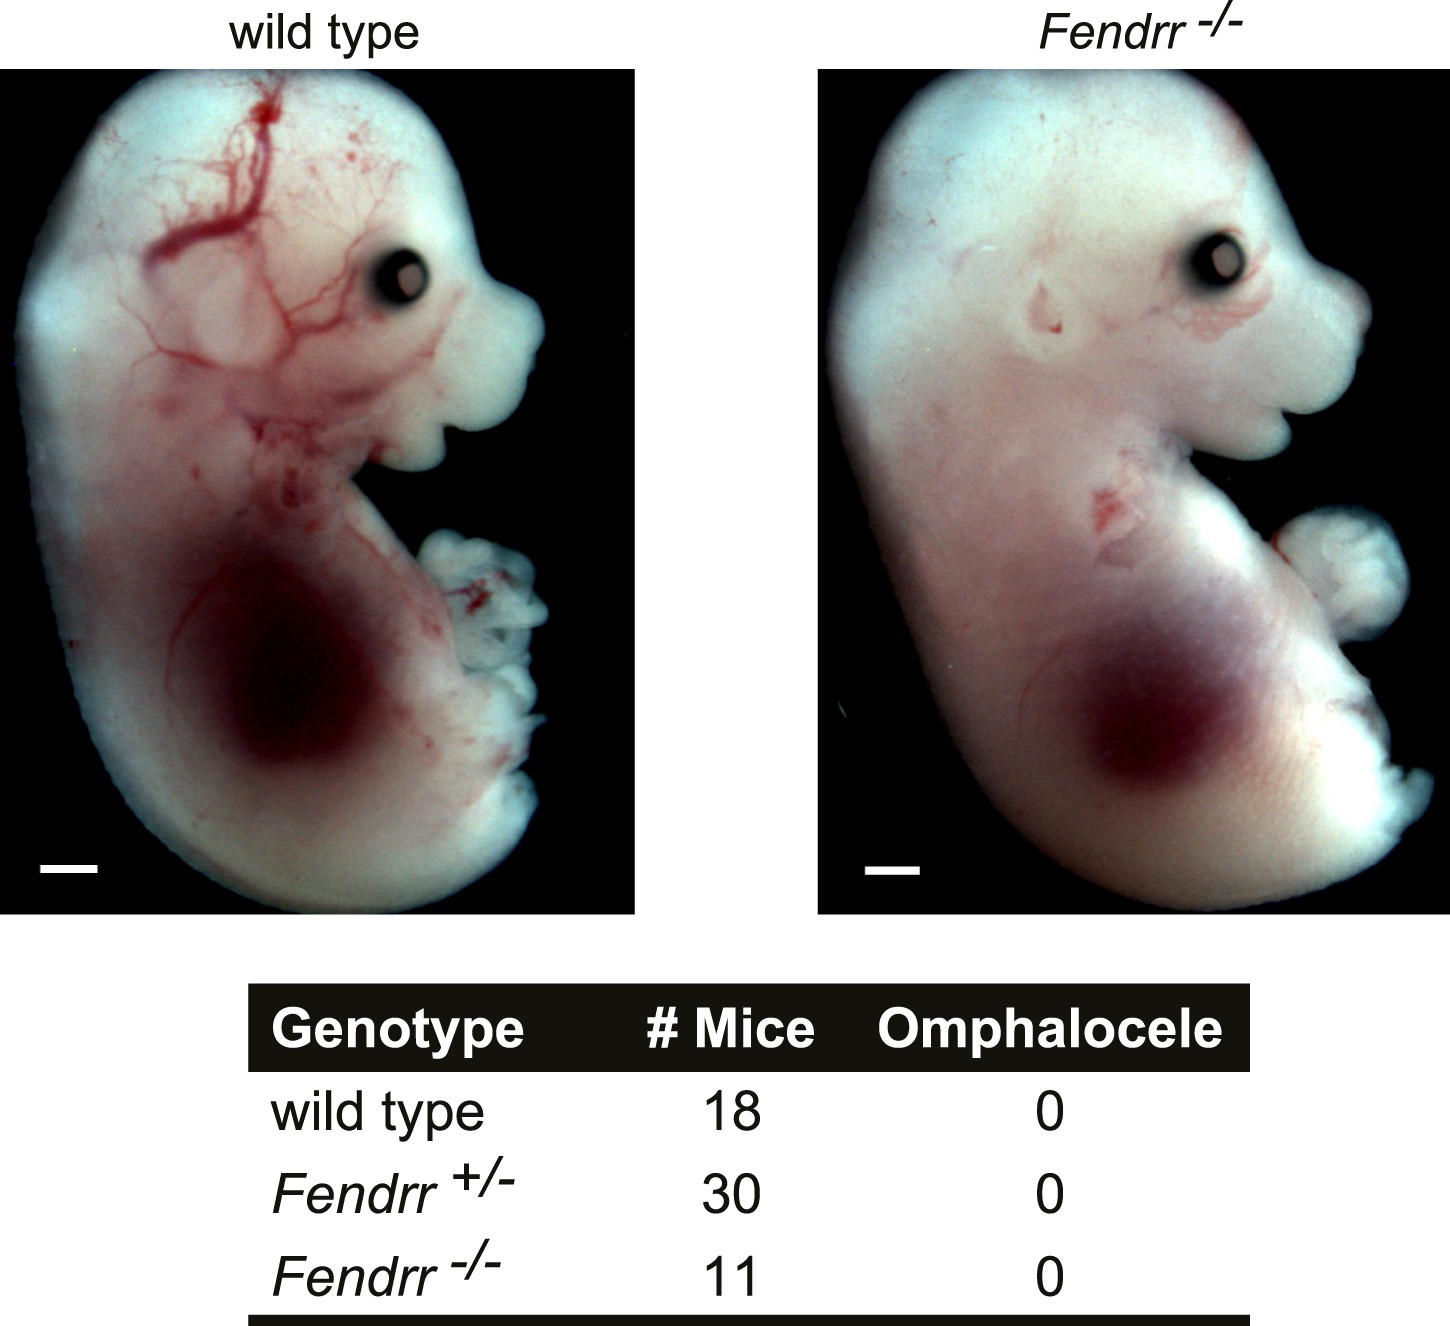
Fendrr−/− embryos don’t have an omphalocele.
Wild type and Fendrr mutant E14.5 embryos were harvested and examined for the presence of an omphalocele. Numbers of embryos analyzed for each genotype are indicated. Tail and limbs were removed. Scale bar = 1 mm.
Figure 3—figure supplement 2
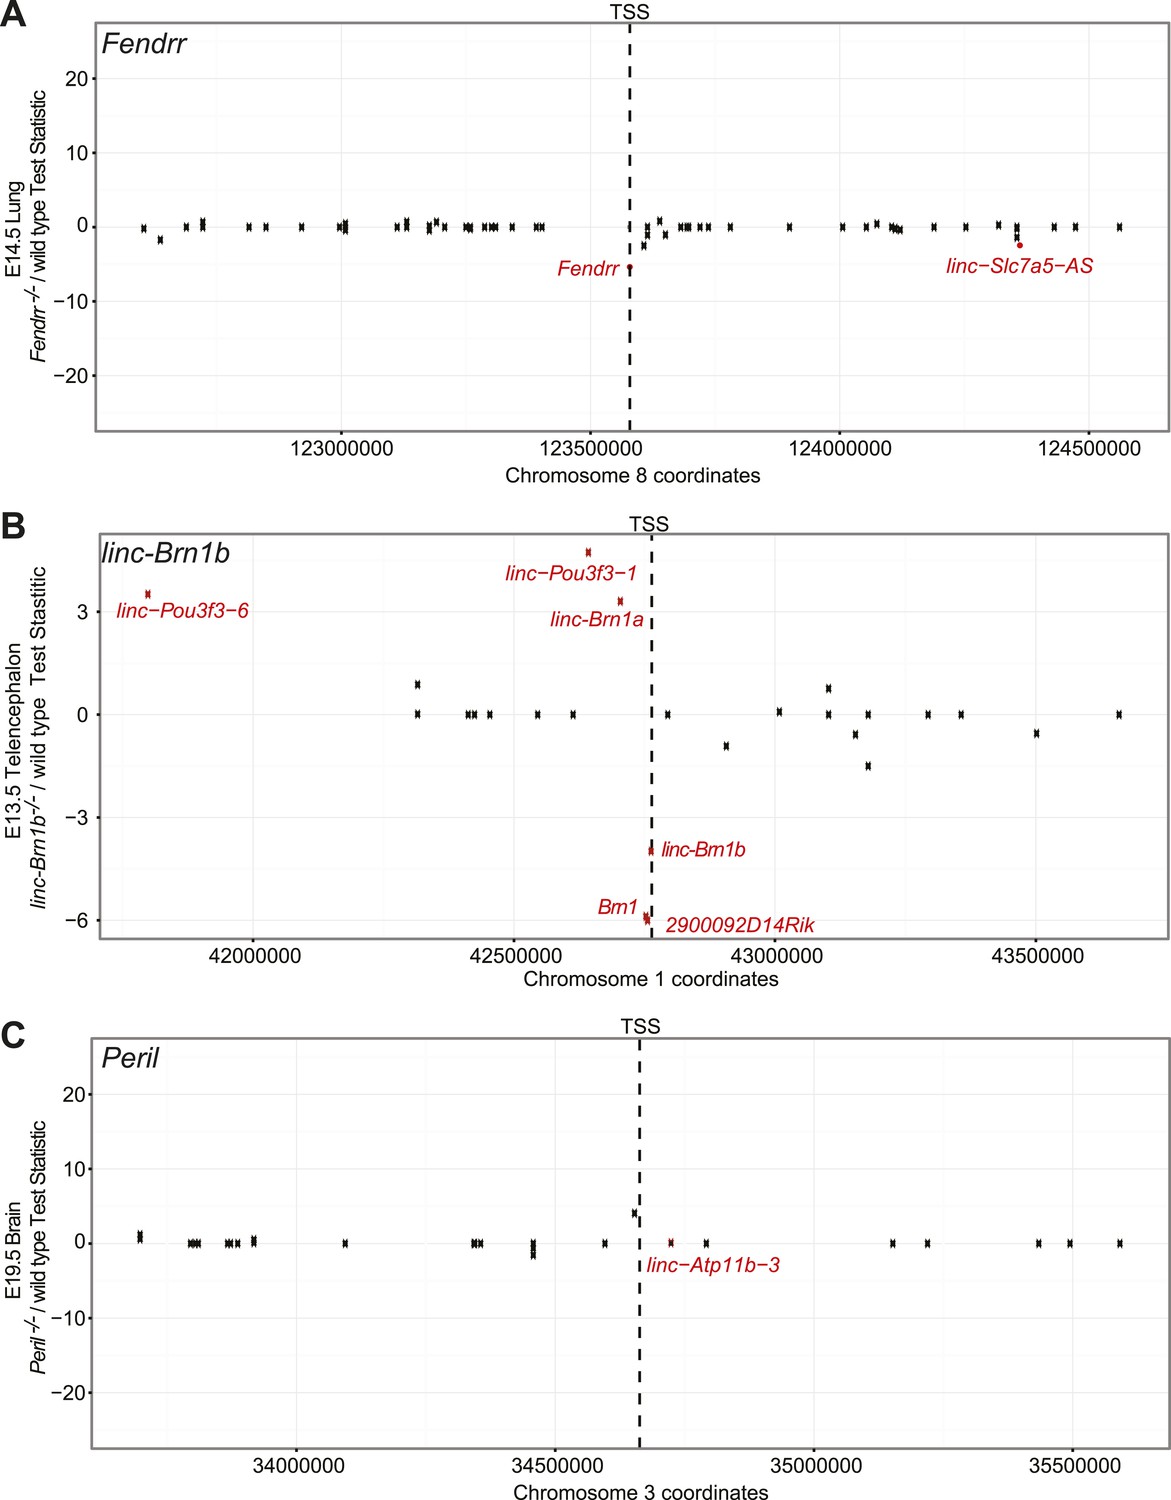
Fendrr, linc–Brn1b, and Peril do not act as cis-enhancer elements.
Scatterplot showing Cuffdiff2 test-statistic (Knockout/wild type) for each gene ±1 Mb from the start site of the lincRNA. Genes with significant differential expression (q≤0.05) are highlighted in red. In each case, there is no significant enrichment for differentially expressed genes within the ±1 Mb window relative to the background distribution of differentially genes, as determined from random sampling of windows for each comparison.
Figure 4 with 1 supplement
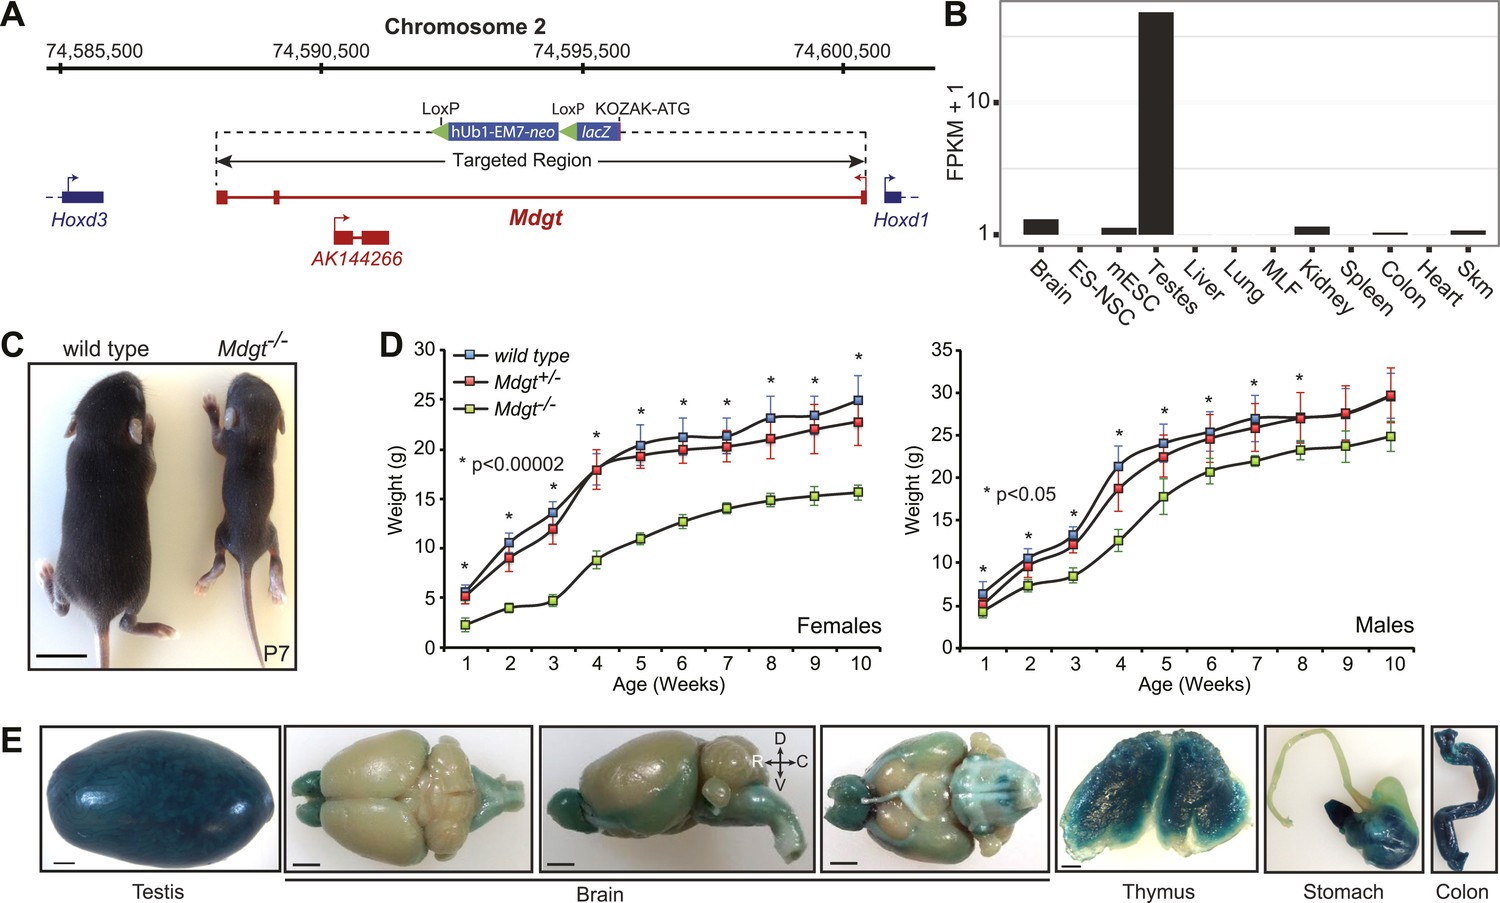
Mdgt−/− surviving mice have growth defects.
(A) Mdgt genomic locus and targeting scheme. (B) RNA-Seq expression profile for Mdgt across a panel of mouse tissues and cell types. (C) Representative example showing the reduced size of Mdgt−/− pups compared to wild type 7 days after birth (P7). (D) Body weight (g) measurements over a 10 weeks period show growth retardation in both female and male Mdgt−/− mice compared to wild type and Mdgt+/− littermates (Females: n = 5 Mdgt−/−, n = 15 Mdgt+/− and n = 10 wild types; Males: n = 3 Mdgt−/−, n = 10 Mdgt+/− and n = 10 wild types). Significant p values at each time point are indicated (*). (E) Whole mount lacZ stainings reporting expression of Mdgt in adult tissues of heterozygote mutant mice. Scale bars = 1 mm, testis, thymus; 2 mm, brain, stomach, colon.
Figure 4—figure supplement 1
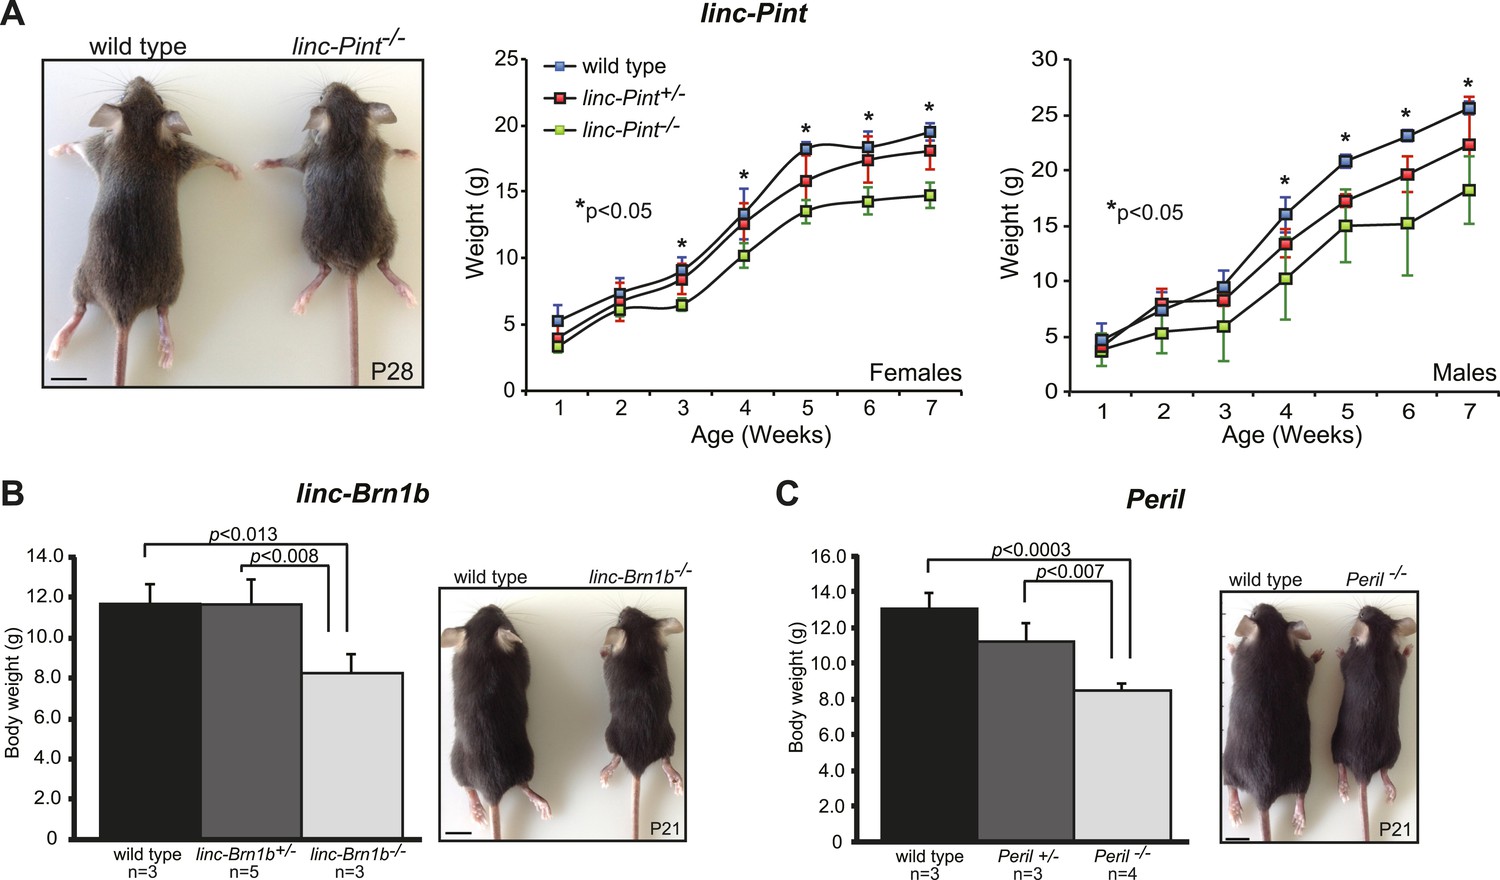
Growth retardation phenotype in lincRNA knockout strains.
Body weight (g) measurements of wild type, lincRNA heterozygote and homozygote mutants for (A) linc–Pint, (B) linc–Brn1b and (C) Peril were taken at the indicated postnatal time points. Animals used for measurements (n) were derived from at least 2–3 litters. Paired Student's t test was used to assess statistical significance (p) in mean values. Scale bar = 1 cm.
Figure 5 with 1 supplement
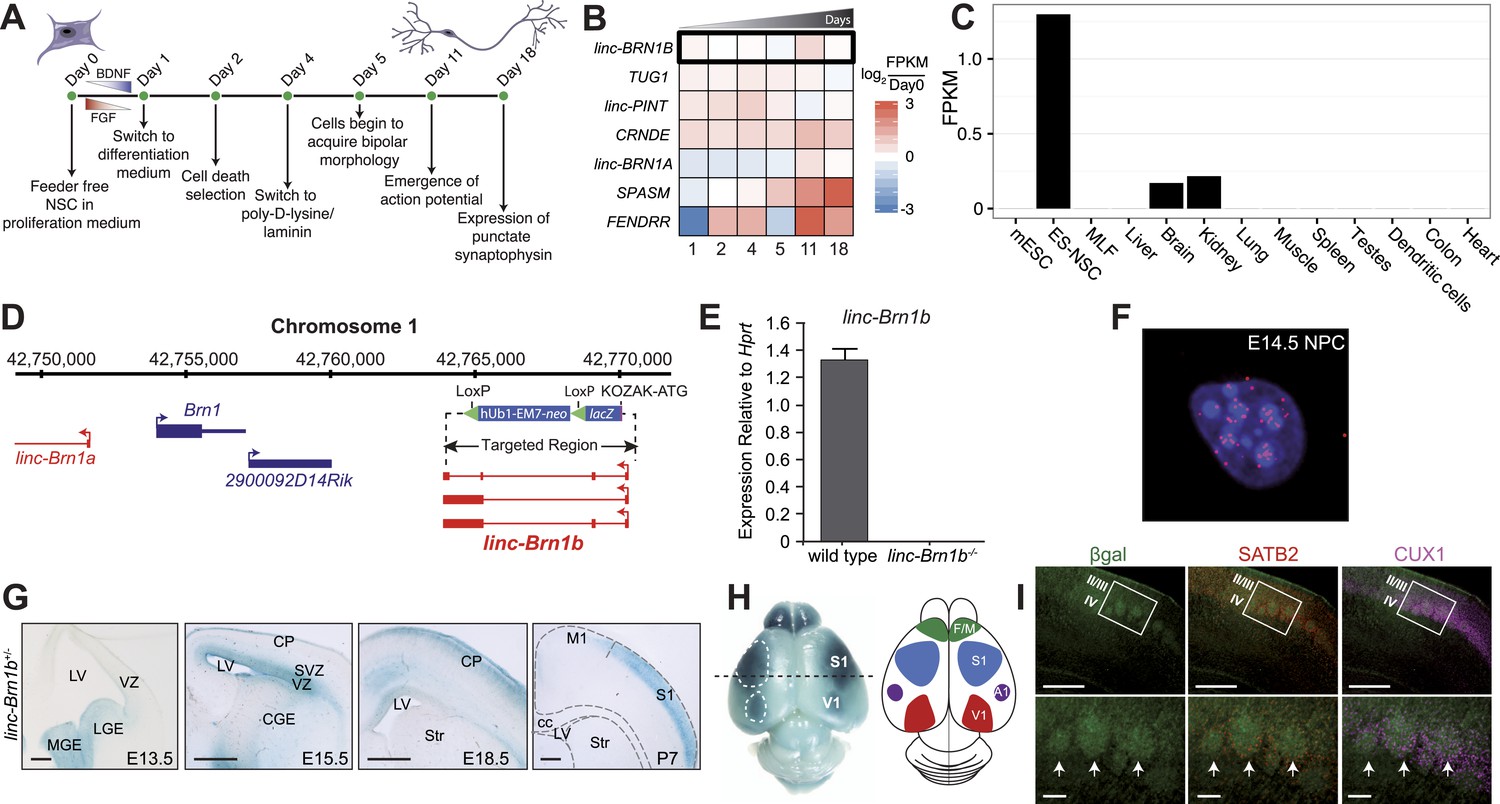
linc–Brn1b is spatio-temporally regulated during corticogenesis.
(A) Schematic overview of the in vitro human neural stem cell differentiation protocol. RNA was collected at the indicated time points and sequenced to identify significantly differentially expressed lincRNA human orthologs. (B) Heatmap of log2 ratios to undifferentiated (Day 0) human neural stem cells for 7 of the 20 lincRNAs selected for deletion with a significant (q<0.01; Cuffdiff2) increase in expression during differentiation. (C) RNA-Seq expression profile for linc–Brn1b across a panel of mouse tissues and cell types. (D) linc–Brn1b genomic locus and targeting strategy. (E) qRT–PCR confirmation of the genotype for both heterozygotes (+/−) and homozygous null (−/−) mutants. (F) Single-molecule RNA FISH targeting linc–Brn1b in wild-type E14.5 cortical neurospheres. (G) lacZ staining shows expression profile of linc–Brn1b at different embryonic (E13.5, E15.5 and E18.5) and early postnatal stages (P7) in linc–Brn1b+/− telencephalon. lacZ expression in neural progenitors of both ventral telencephalon (lateral ganglionic eminence, LGE and medial ganglionic eminence, MGE) (E13.5) and dorsal telencephalon (ventricular zone, VZ and subventricular zone, SVZ) (E15.5) is detected. Restricted expression in the upper cortical layers is observed in both E18.5 and P7 cortex. (H) Whole mount lacZ staining of P7 linc–Brn1b+/− brain shows distinct linc–Brn1b expression in primary somatosensory (S1) and visual (V1) cortical areas. (I) β-galactosidase immunofluorescence on coronal sections of P7 linc–Brn1b−/− cortex shows linc–Brn1b expression in layer IV of the somatosensory area (white boxes), specifically within the barrel structures (white arrows), as determined by co-staining with the upper layer markers SATB2 and CUX1. Abbreviations: LV, lateral ventricle; LGE, lateral ganglionic eminence; MGE, medial ganglionic eminence; CGE, caudal ganglionic eminence; CP, cortical plate; SVZ, subventricular zone; VZ, ventricular zone; Str, striatum; M1, primary motor area; S1, primary somatosensory area; cc, corpus callosum; V1, primary visual cortex; A1, primary auditory cortex; F/M, frontal motor cortex. Scale bars: 500 µm (G), (I, upper panels); 100 µm (I, lower panels).
Figure 5—figure supplement 1
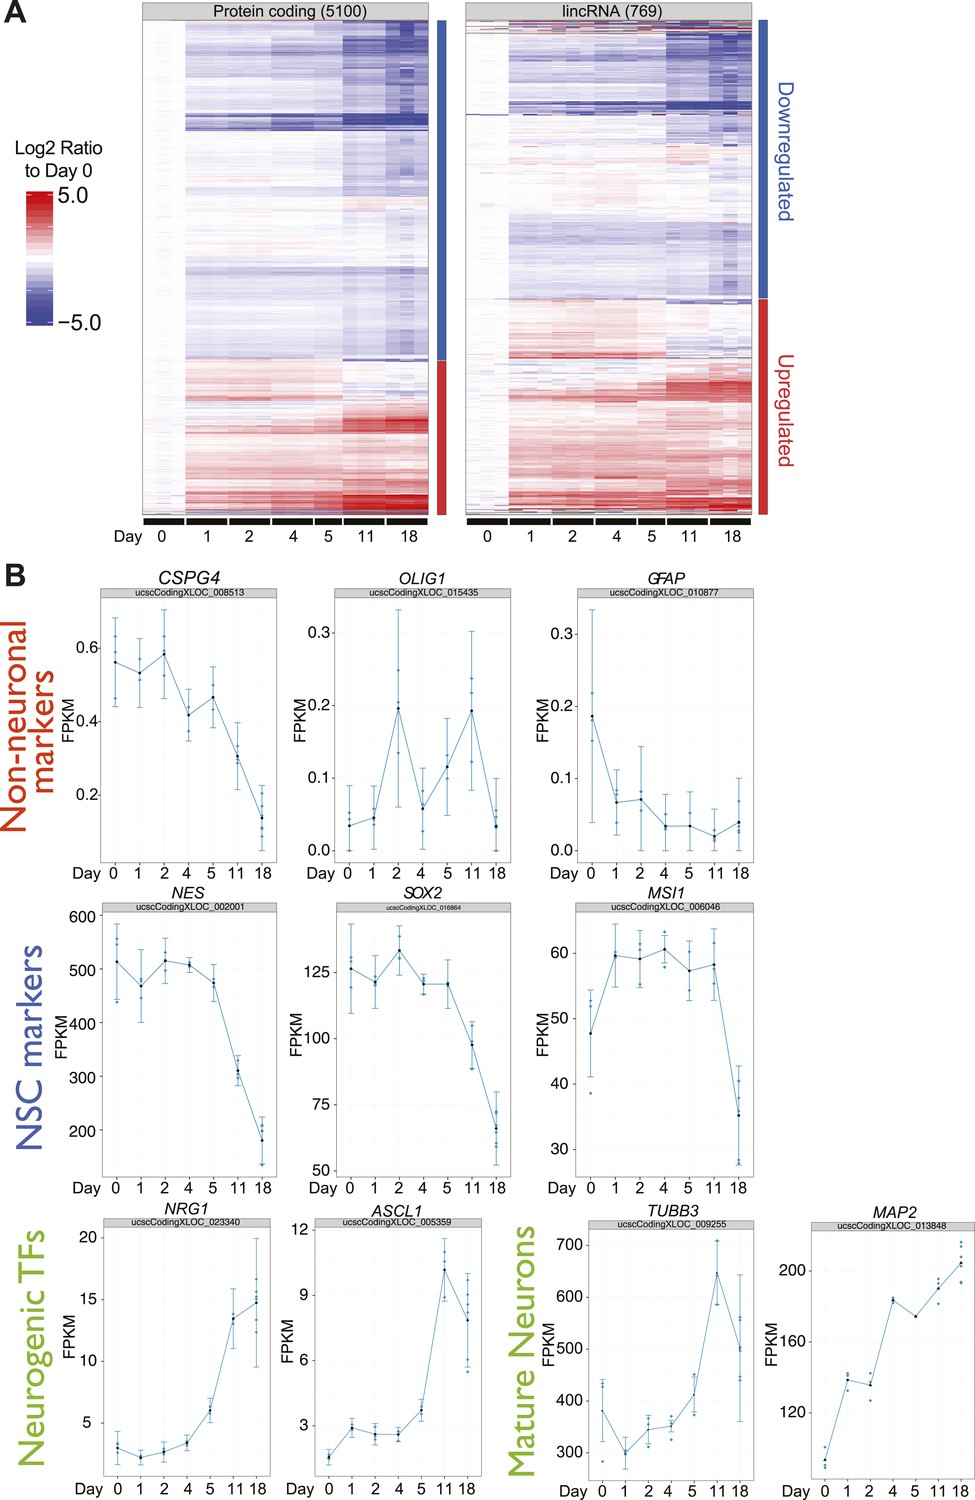
Differential expression of protein coding genes, lncRNAs and neuronal markers during human ES-derived neuronal differentiation time course.
(A) Heatmap of Cuffdiff2 estimated expression values (FPKM) expressed as log2 fold-change to Day 0 for 5,100 significant protein-coding genes and 769 significant lncRNAs (q<0.001; Cuffdiff2) from a human H1-derived NSC differentiation timecourse. (B) Individual expression plots for key neural stem cell markers, neuronal markers, and non-neuronal markers confirm the differentiated state of the human H1-derived NSC into predominantly neurons.
Figure 6 with 1 supplement
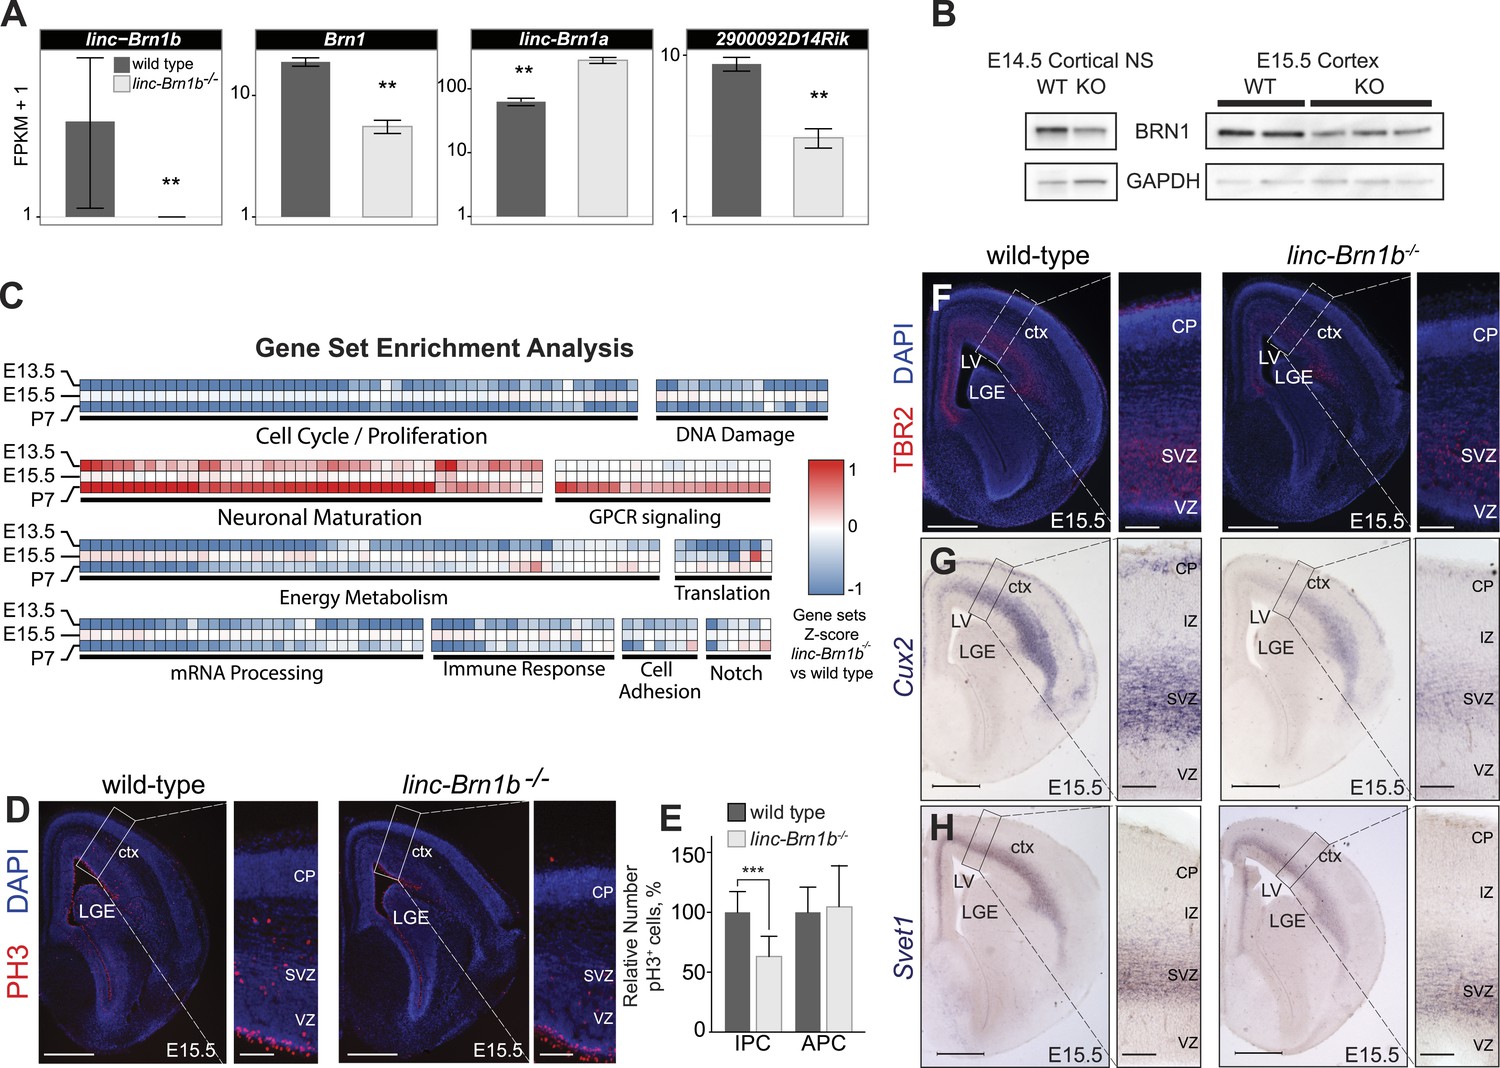
linc–Brn1b−/− mice demonstrate defects in proliferation of IPCs.
(A) RNA-Seq expression estimates from E15.5 wild type and linc–Brn1b−/− telencephalon for linc–Brn1b, the protein coding gene Brn1, and neighboring genes linc–Brn1a and 2900092D14Rik. (B) Western blots of wild type and linc–Brn1b−/− E14.5 cortical neurospheres (NS), and E15.5 cortices. (C) GSEA of linc–Brn1b−/− vs wild type in E13.5 and E15.5 telencephalon and P7 whole brain (as described in Figure 3). (D and E) Immunofluorescence staining for the mitotic marker phosphorylated histone H3 (pH3) in E15.5 coronal sections of cortex (D) and pH3+ cell counts of apical progenitors (APC) and intermediate progenitors (IPC) (E). (F–H) Immunofluorescence staining for TBR2 (F), and in situ hybridization for Cux2 (G) and Svet1 (H) in wild type and linc–Brn1b−/− E15.5 cortex show that mutant mice have decreased expression of SVZ intermediate progenitor markers. Scale bars = 500 µm (D–H). **p<0.01, ***p<0.001; Student’s t test. LGE, lateral ganglionic eminence; LV, lateral ventricule; ctx, cortex; CP, cortical plate; VZ, ventricular zone; SVZ, subventricular zone; IZ, intermediate zone.
Figure 6—figure supplement 1
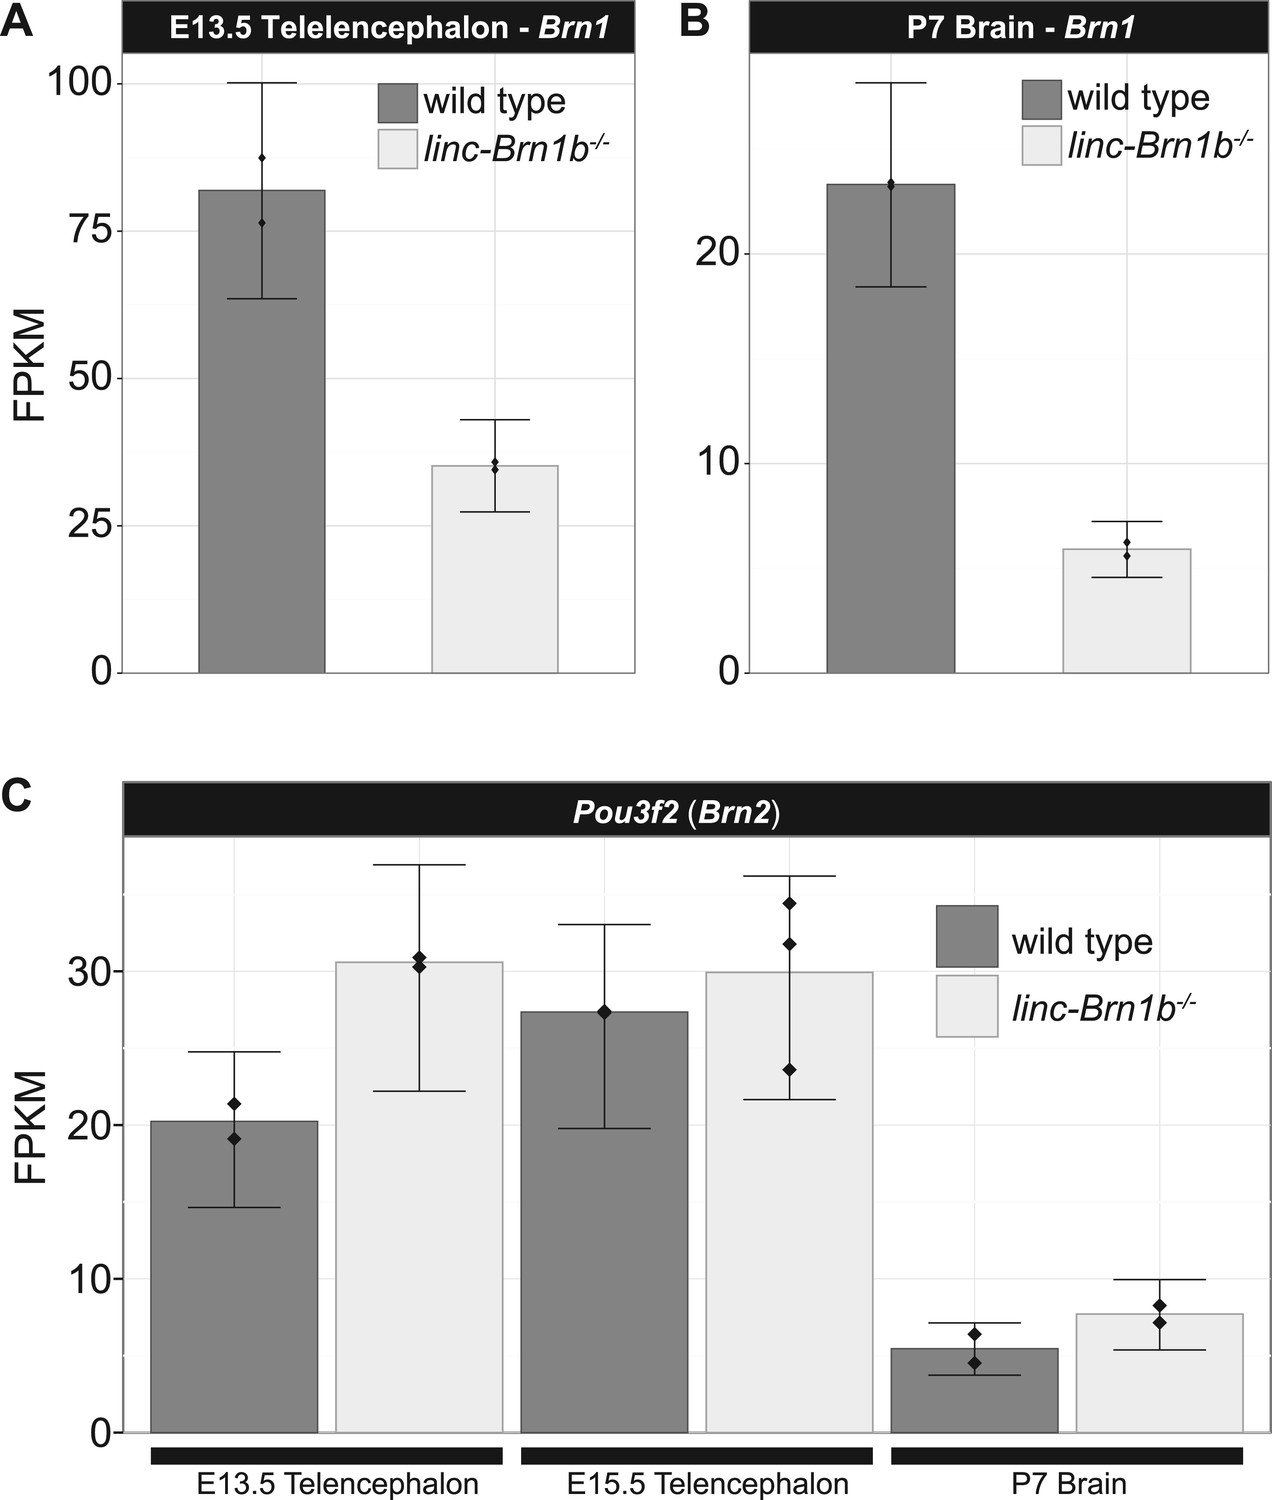
Brn1 transcript is reduced in linc–Brn1b−/− E13.5 telencephalon and P7 brain.
RNA-Seq expression estimates (FPKM) for the Brn1 protein coding gene in E13.5 telencephalon (A) and P7 brain (B) harvested from wild type and linc-Brn1b-/- littermates (n=2). (C) The Brn1 paralog Brn2 has no significant changes in expression in the linc-Brn1b-/- mice in any condition, suggesting no contribution from this gene to the observed phenotype.
Figure 7
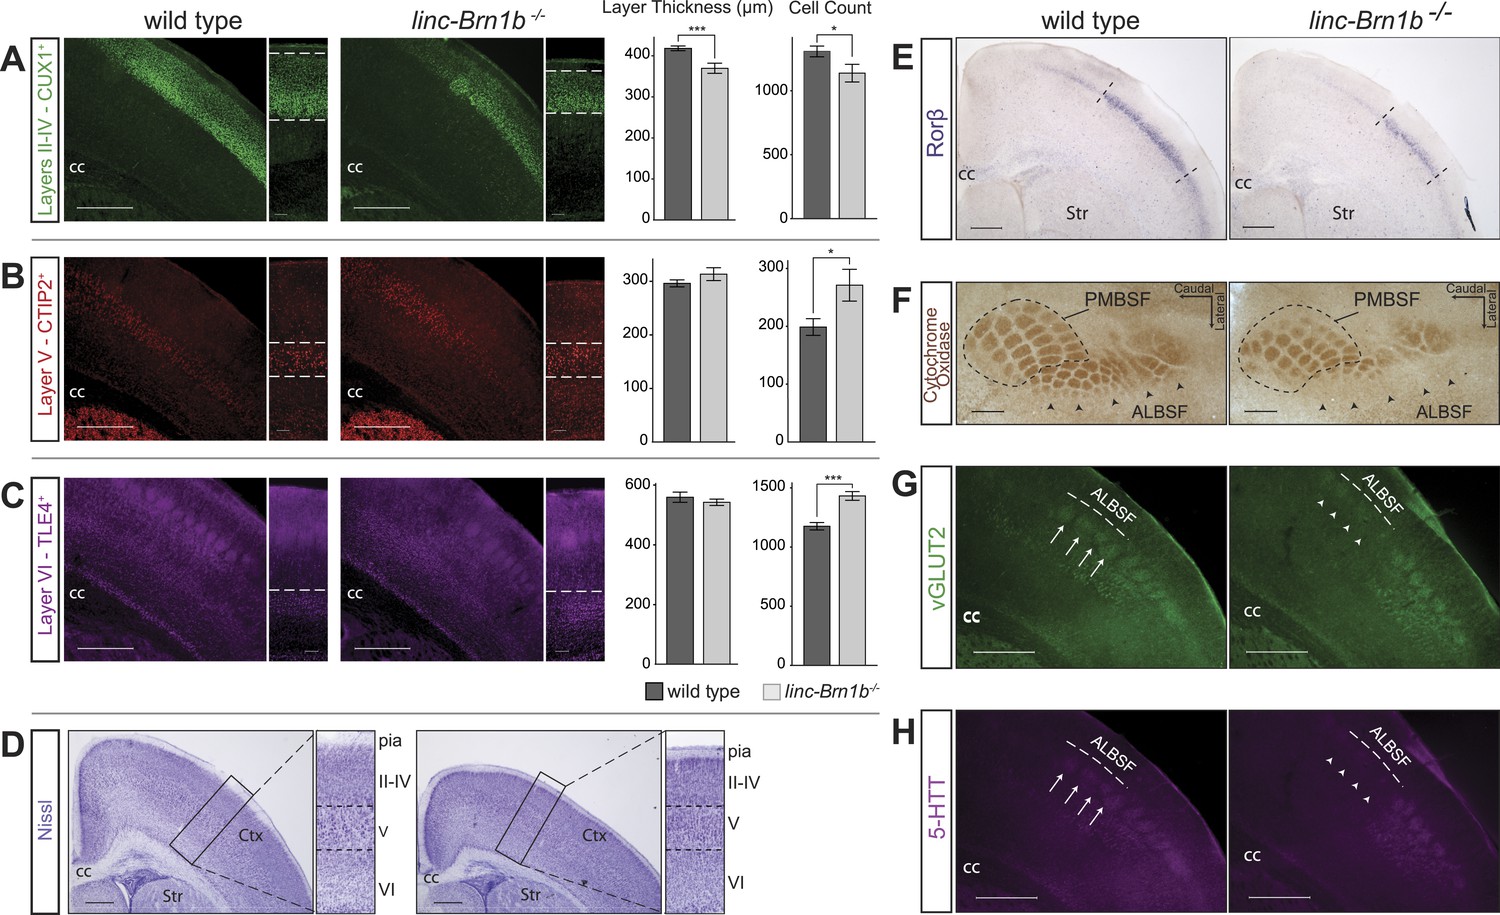
Abnormal cortical lamination and disruption of the barrel cortex in linc–Brn1b−/− mice.
(A) Immunofluoresence staining and quantification on coronal sections of P7 wild type and linc–Brn1b−/− cortices for upper layer II–IV marker CUX1 show a significant reduction in absolute layer thickness and total number of CUX1+ projection neurons in linc–Brn1b−/− mice. (B and C) Immunofluorescence staining and quantification on coronal sections of P7 wild type and linc–Brn1b−/− cortices for layer V marker CTIP2 (B), and for layer VI marker TLE4 (C) show not significant change in the total thickness of layer V and VI, but significant increase in the number of CTIP2+ subcerebral projection neurons and TLE4+ corticothalamic neurons in linc–Brn1b−/− mice. (D) Nissl staining of coronal sections of P8 wild type and linc–Brn1b−/− cortices shows overall cortical reduction and specific decrease in upper layer thickness in linc–Brn1b−/− mice. (E) Rorβ in situ hybridization on coronal sections of P7 wild type and linc–Brn1b−/− primary somatosensory cortex. (F) Cytochrome oxidase c activity on sections spanning barrel cortex shows reduction in the anteriolateral barrel subfield (ALBSF) in linc–Brn1b−/− mice. The loss of barrels in the ALBSF and their general disorganization are confirmed by immunofluorescence staining for vGLUT2 (G) and 5-HTT (H). The full arrows indicate individual barrels and arrowheads point to corresponding barrels that are absent in the linc–Brn1b−/− brains. *p<0.05, **p<0.01, ***p<0.001; Student’s t test. Scale bars = 500 µm (A–E) and (G–H), 100 µm (F). ctx, cortex; cc, corpus callosum; str, striatum; PMBSF and ALBSF, posteriomedial and anteriolateral barrel subfield.
Additional files
-
Supplementary file 1
(A) lincRNA genomic and targeted deletion coordinates (mm9). (B) Mass spectrometry peptide tags at background level identified for 4 lincRNA candidates (lif-over of lincRNA candidates to hg19). (C) Mouse genotyping primer sequences. (D) Quantitative RT-PCR primers. (E) Single molecule FISH probe sequences. (F) Taqman qPCR primers for targeted mES diagnostic.
- https://doi.org/10.7554/eLife.01749.018
Download links
A two-part list of links to download the article, or parts of the article, in various formats.
Downloads (link to download the article as PDF)
Open citations (links to open the citations from this article in various online reference manager services)
Cite this article (links to download the citations from this article in formats compatible with various reference manager tools)
Multiple knockout mouse models reveal lincRNAs are required for life and brain development
eLife 2:e01749.
https://doi.org/10.7554/eLife.01749


