Structure of the SAS-6 cartwheel hub from Leishmania major
- Medical Research Council Laboratory of Molecular Biology, United Kingdom
Figures
Figure 1 with 2 supplements
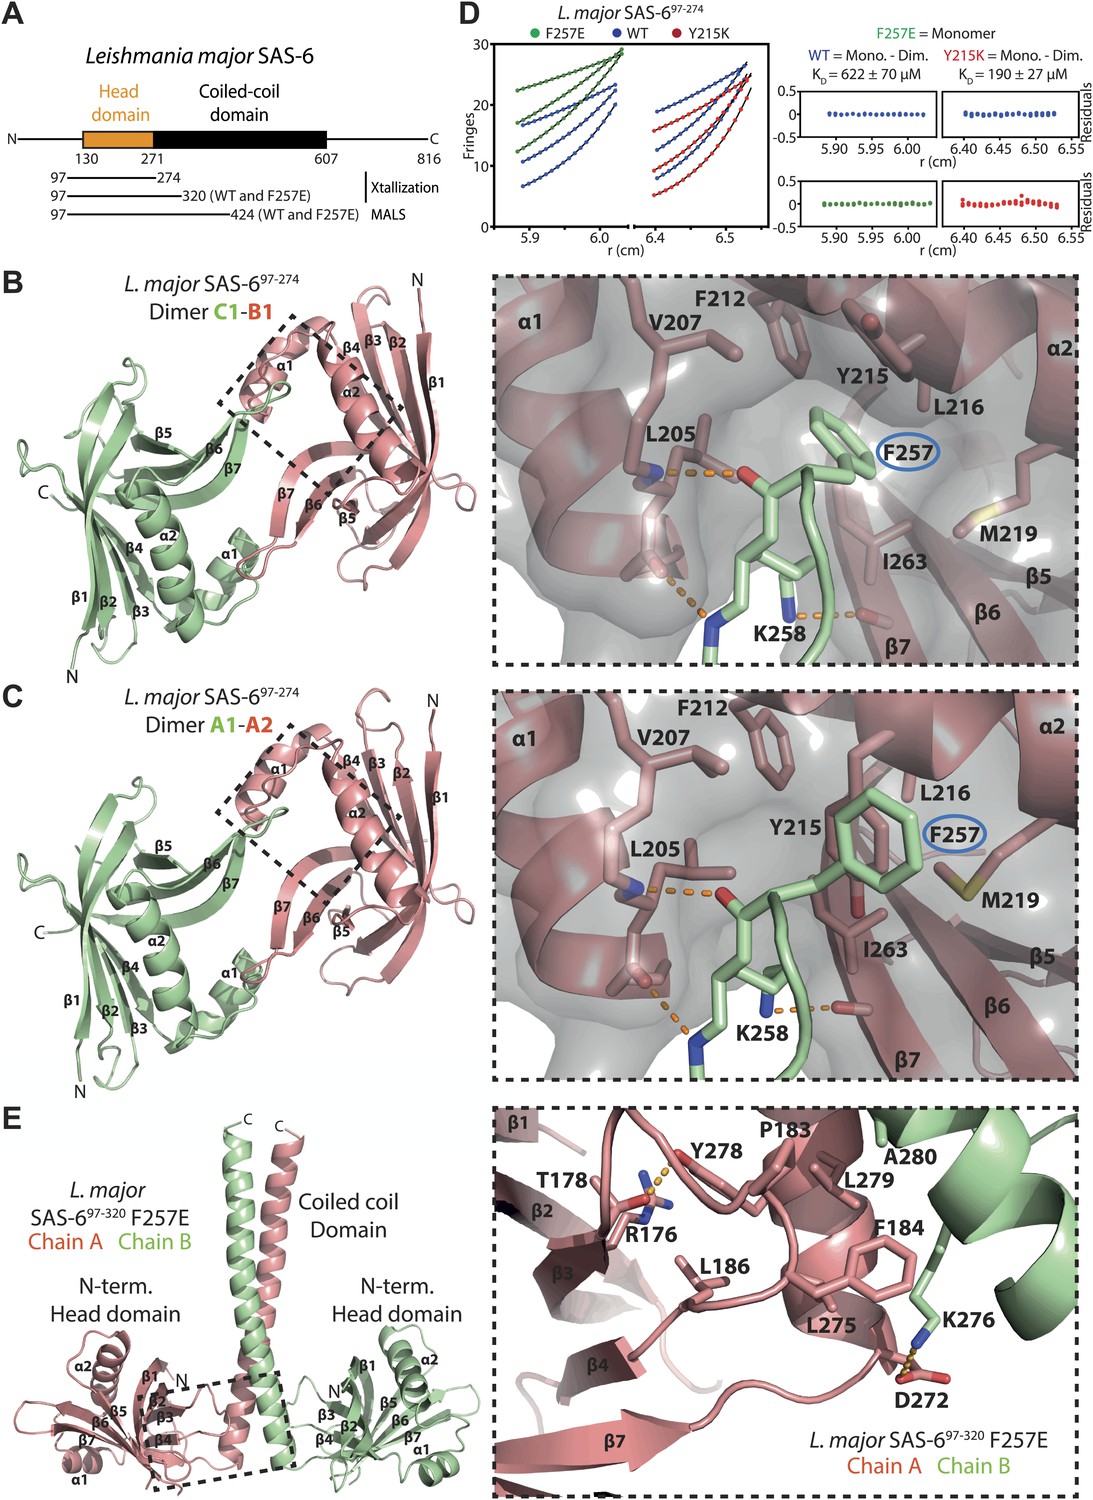
Structural and biophysical characterization of L. major SAS-6.
(A) Domain overview of L. major SAS-6. Lines indicate constructs that were used in this work. (B and C) Left: ribbon presentation of the head-to-head dimers of L. major SAS-6’s N-terminal domain present in the SAS-697–274 crystal. Shown are the dimers formed between chain B and chain C (B) and chain A and symmetry-related chain A (C). α-helices (α) and β-sheets (β) are numbered sequentially. Right: detailed views of the corresponding dimerization interfaces. Interface residues are labelled and shown in sticks, dotted orange lines indicate hydrogen bonds. The two dimers show largely identical side-chain orientations in their interfaces. Note, however, that F257 (ringed in blue) in the B–C dimer inserts into a hydrophobic pocket, while in the A–A dimer Y215 is flipped into this pocket and displaces F257. To better illustrate this, a semi-transparent molecular surface of one of the subunits is also presented (grey). (D) Sedimentation-equilibrium analytical ultracentrifugation data for 400 µM L. major SAS-697–274 wild-type (blue circles) and F257E mutant (green circles) and Y215K mutant (red circles) obtained at 11300, 17000, and 21200 rpm. Data for the F257E mutant were fitted to an ideal single-species model (solid line). Analysis of multiple concentrations gave a molecular weight of 17,727 ± 219 Da, close to the expected molecular weight for the monomer of 19,640 Da. As initial fits to a similar model for the WT and Y215K data gave higher molecular weights of 27,589 ± 209 Da and 30,951 ± 595 respectively, the data were fitted to a monomer–dimer equilibrium model (solid line) giving dissociation constants, KD, of 622 ± 70 µM for the WT and 190 ± 27 µM for Y215K mutant. The plots on the right show the residuals of the fits to the data for the wild-type (blue circles) and the corresponding F257E mutant (green circles) and Y215K mutant (red circles). (E) Left: ribbon presentation of the L. major SAS-697–320 F257E coiled-coil dimer structure (chain A: red, chain B: green). Right: detailed view of the region boxed on the left. Interaction interface between N-terminal head domain and the coiled-coil stalk. Residues that make contact are labelled and are shown as sticks, dotted orange lines indicate hydrogen bonds.
Figure 1—figure supplement 1
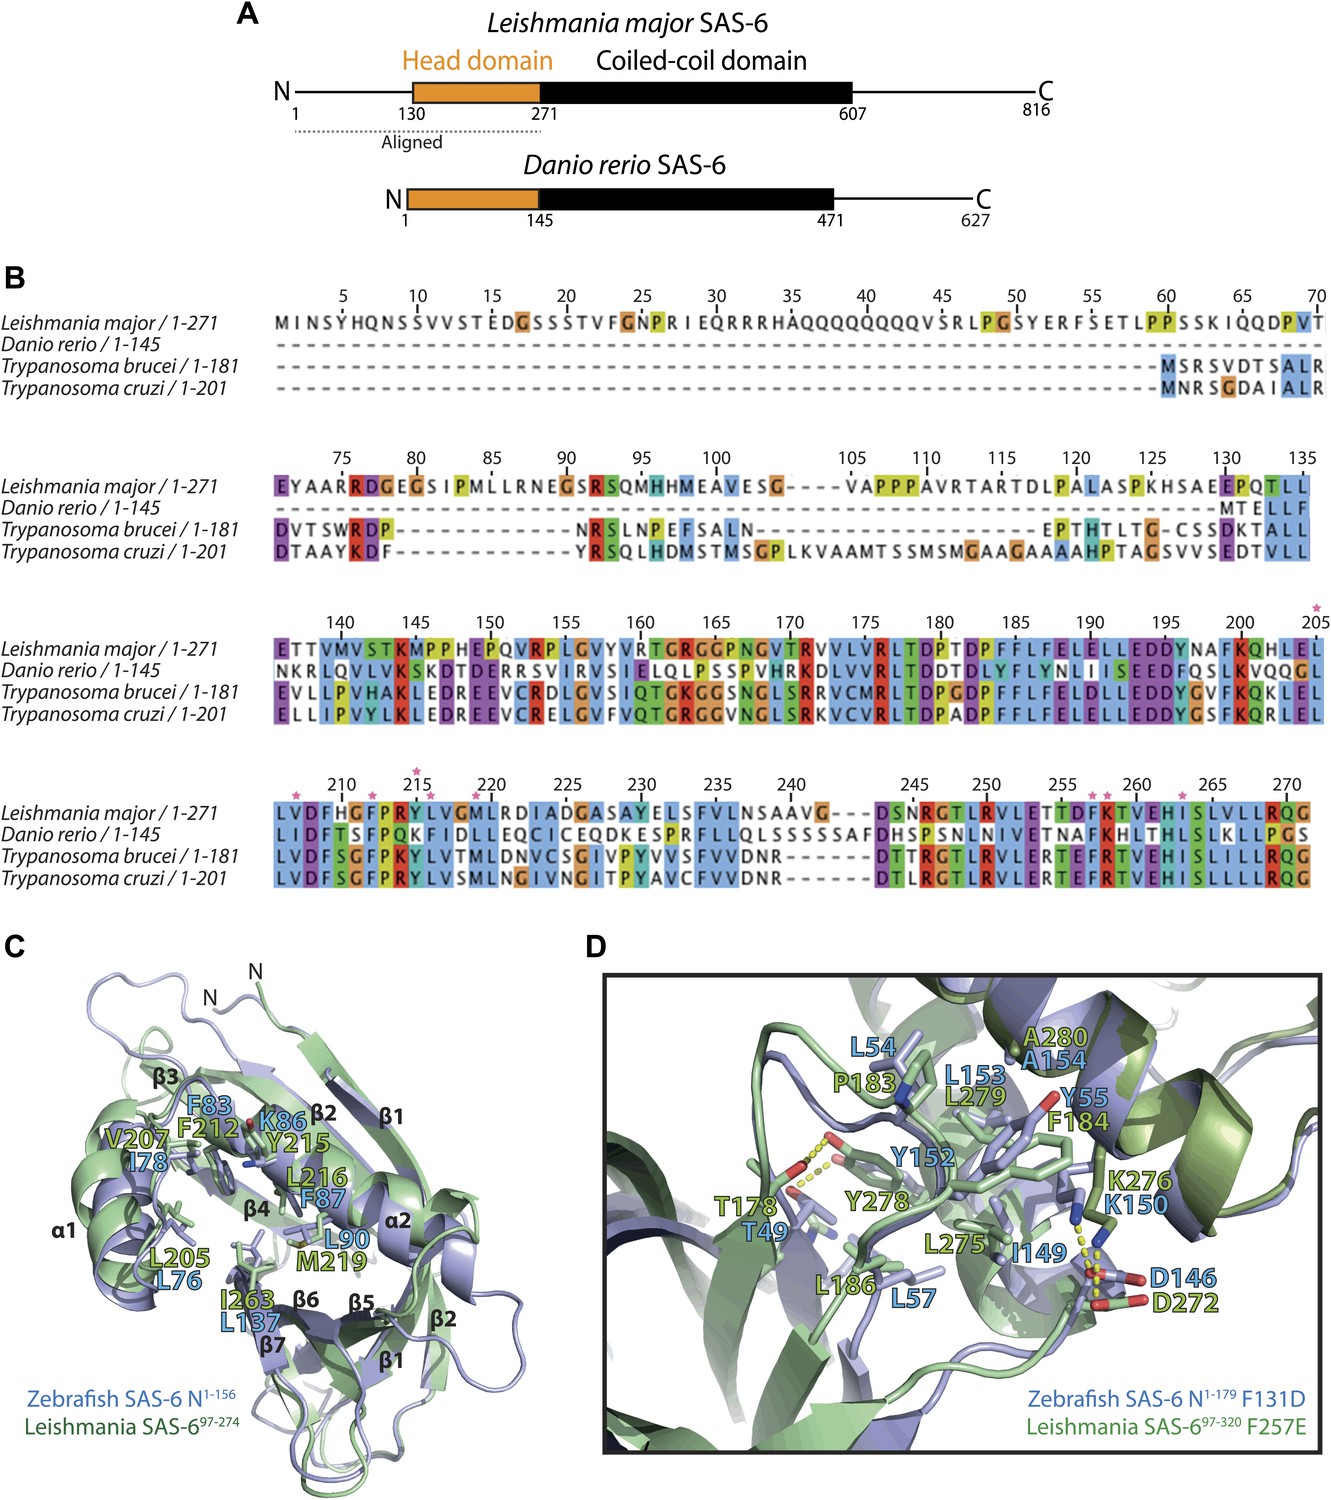
L. major SAS-6 and Danio rerio SAS-6 are highly similar.
(A) Schematic representation of Leishmania major and Danio rerio SAS-6. Both proteins show a similar overall architecture with an N-terminal head domain and a coiled-coil domain of comparable lengths. The bar indicates the aligned SAS-6 region shown in (B). (B) Multiple sequence alignment of the N-terminal head domains of SAS-6 from Trypanosoma brucei, Trypanosoma cruzi, Leishmania major, and Danio rerio. The numbering refers to L. major SAS-6. The alignment is colored according to the Clustal coloring scheme. Red stars indicate key residues of the interaction interface of the homo-dimer of this domain. (C) Overlay of the structures of L. major SAS-697–274 (green) and Danio rerio N-SAS-61–156 (blue). Face-on view onto the hydrophobic pocket into which a highly conserved phenylalanine (F257 in L. major, F131 in D. rerio SAS-6) is inserted in the homo-dimerized form of this domain. Residues of this pocket are labelled and are shown as sticks. (D) Detailed view of the interaction interface between N-terminal head domain and the coiled-coil stalk of SAS-6. Overlay of this interface from L. major SAS-697–320 F257E (green) with that from Danio rerio N-SAS-61–179 F131D (blue). Residues that make contact are labelled and are shown as sticks, dotted yellow lines indicate hydrogen bonds.
Figure 1—figure supplement 2
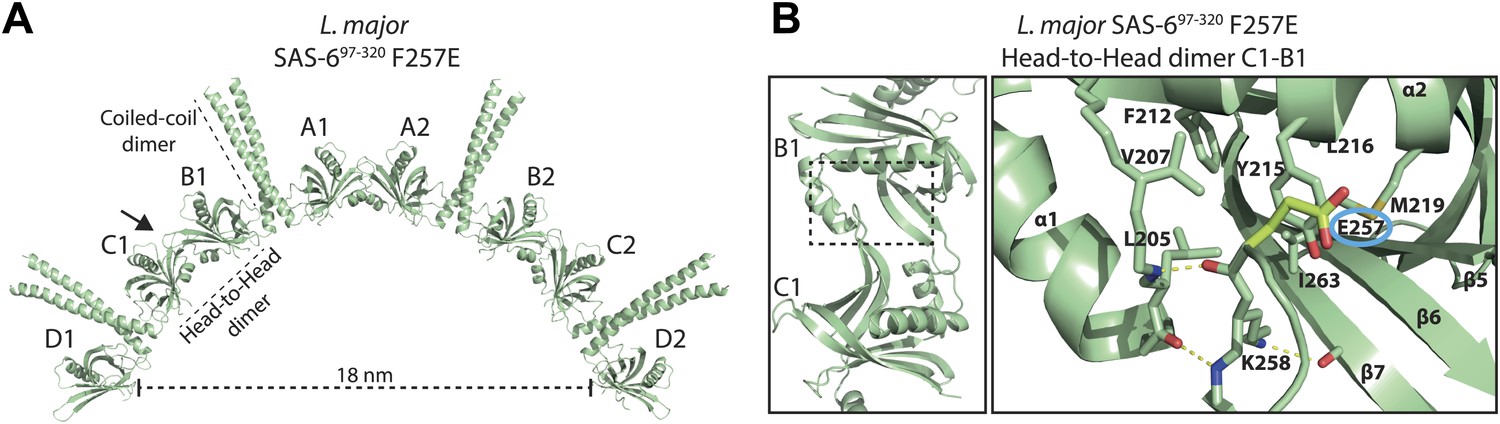
The closed Y215 conformation is observed in the low affinity head-to-head homo-dimer of the F257E mutant.
(A) Ribbon presentation of the SAS-6 octamer present in the L. major SAS-697–320 F257E crystal. The ASU of the crystal contained four SAS-6 monomers that are labelled from A–D. The arrow specifies the view direction shown as a close-up in (B). (B) Left: ribbon presentation of the B–C head-to-head homo-dimer in the L. major SAS-697–320 F257E crystal. Right: corresponding detailed view of the homo-dimer interface. The other head-to-head dimers in the crystal showed similar arrangements to the ones presented here. Interface residues are labelled and shown in sticks. Dotted yellow lines indicate hydrogen bonds. Highlighted in lemon and ringed in blue is the mutated E257 residue. Note that Y215 is swung into the hydrophobic pocket, whereas E257 points outwards. The remainder of the interface residues show similar side-chain orientations as observed in the wild-type SAS-697–274 crystal (Figure 1).
Figure 2 with 2 supplements
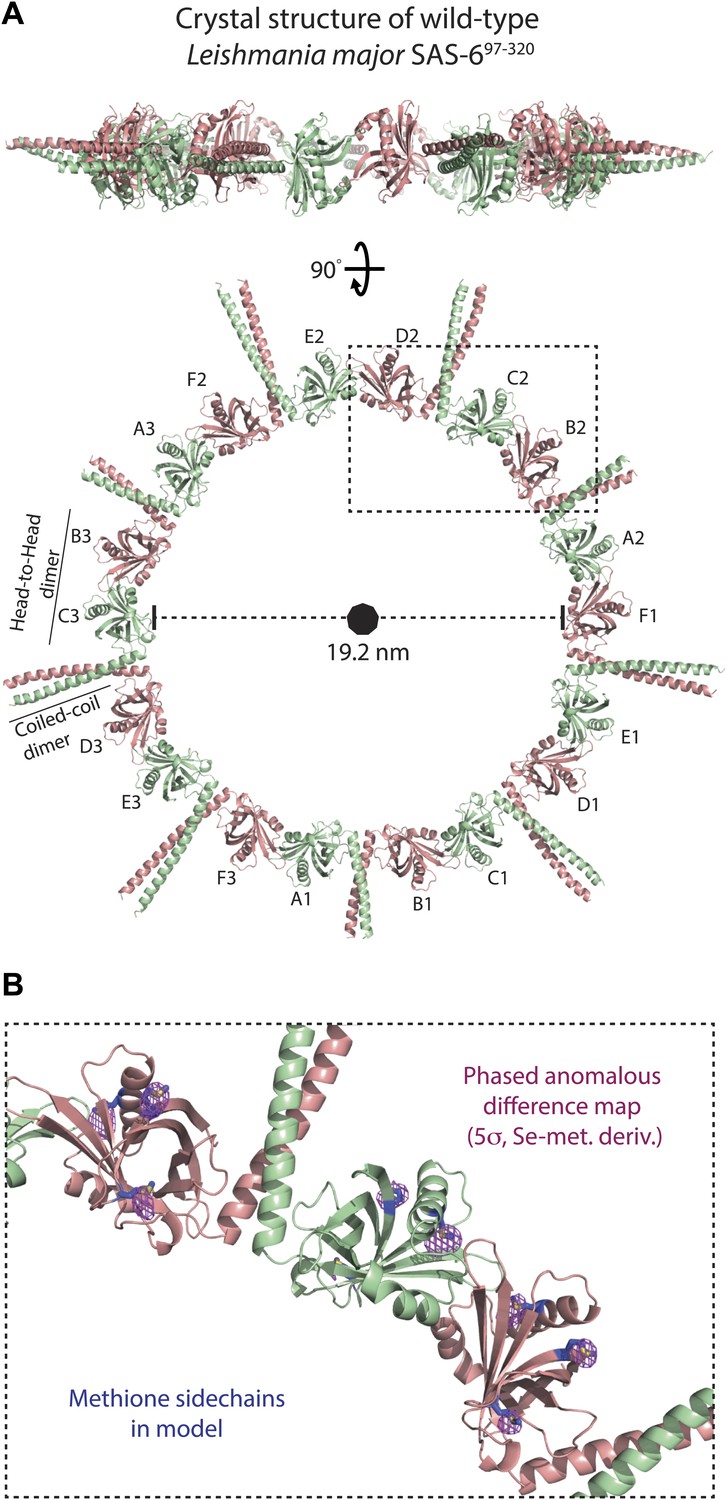
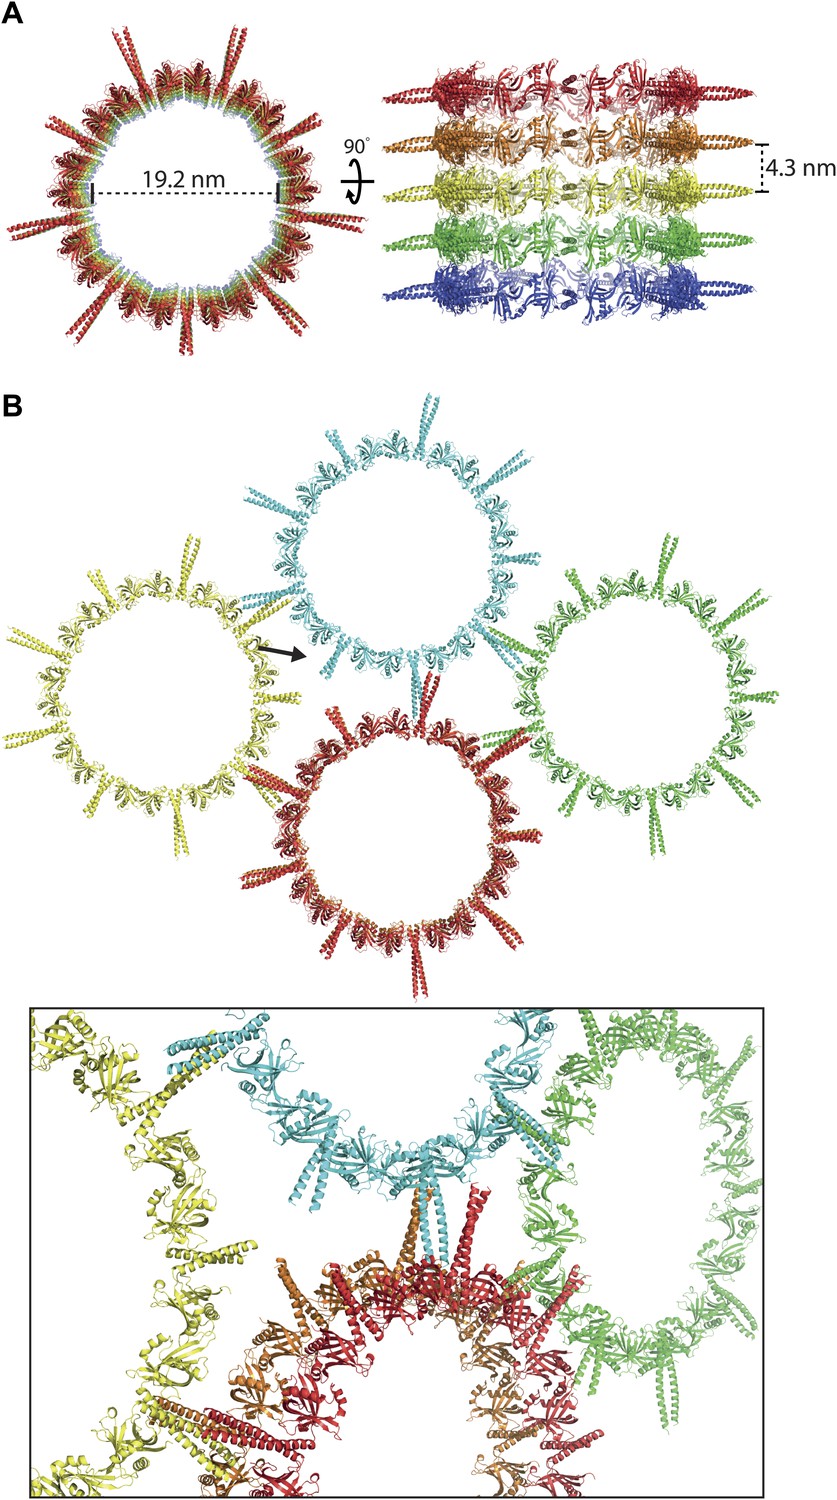
L. major SAS-697–320 crystallizes as a ninefold symmetric ring with dimensions similar to those of centriolar cartwheels observed in vivo.
(A) Ribbon presentation of the L. major SAS-697–320 structure. Shown is the ring assembly present in the unit cell of the L. major SAS-697–320 crystal. Protein chains are colored alternatingly in green and red to allow easier comparison with Figure 1. Top: side-view, bottom: face-on view of the L. major SAS-697–320 ring structure. The nonagon in the center of the ring indicates the (quasi-) ninefold symmetry axis. The ASU of the crystal contained six SAS-6 monomers that are labelled from A–F. No clear electron density could be seen for the distal part of the coiled-coil of the A–B dimer, probably due to the lack of stabilizing crystal packing interactions compared to the C–D and E–F dimer (Figure 2—figure supplement 1B). (B) Detailed view of the region boxed in (A). Shown in blue sticks are the methionine-side chains of the SAS-697–320 model. In magenta, iso-mesh representation of the phased anomalous difference map at a contour level of σ = 5 showing the selenium positions in the crystallized selenomethionine derivate of L. major SAS-697–320.
Figure 2—figure supplement 1
The crystal packing interactions observed in the wild-type L. major SAS-697–320 crystal.
(A) Stacking of the L. major SAS-697–320 rings in the crystal. Rings are stacked directly onto each other through interactions of the N-terminal domains of SAS-6. Left: face-on view, right: turned by 90° around the x-axis. (B) Lateral interactions of the L. major SAS-697–320 rings in the crystal. Top: face-on view, the arrow indicates the view direction shown at the bottom as a close-up. The coiled-coil stalks interact in an antiparallel way with each other. Their termini touch the head domains of adjacent rings.
Figure 2—figure supplement 2

The interfaces critical for ring formation in the wild-type L. major SAS-697–320 crystal are similar in orientation to those observed in the SAS-697–320 F257E and the SAS-697–274 crystals.
(A) Overlay of the wild-type L. major SAS-697–320 ring structure (green) with the two dimers present in the ASU of the L. major SAS-697–320 F257E crystal (A–B dimer in magenta, C–D dimer in red). The SAS-697–320 F257E A–B/C–D dimer superposed to wild-type L. major SAS-697–320 with an rmsd of 0.91 Å/1.62 Å in secondary structure matching with 330/319 selected pairs respectively. (B) Overlay of the wild-type L. major SAS-697–320 ring structure (green) with the B–C dimer present in the ASU of the L. major SAS-697–274 crystal (blue). Secondary structure matching of these two structures resulted in an rmsd of 0.77 Å (283 selected pairs).
Figure 3 with 2 supplements
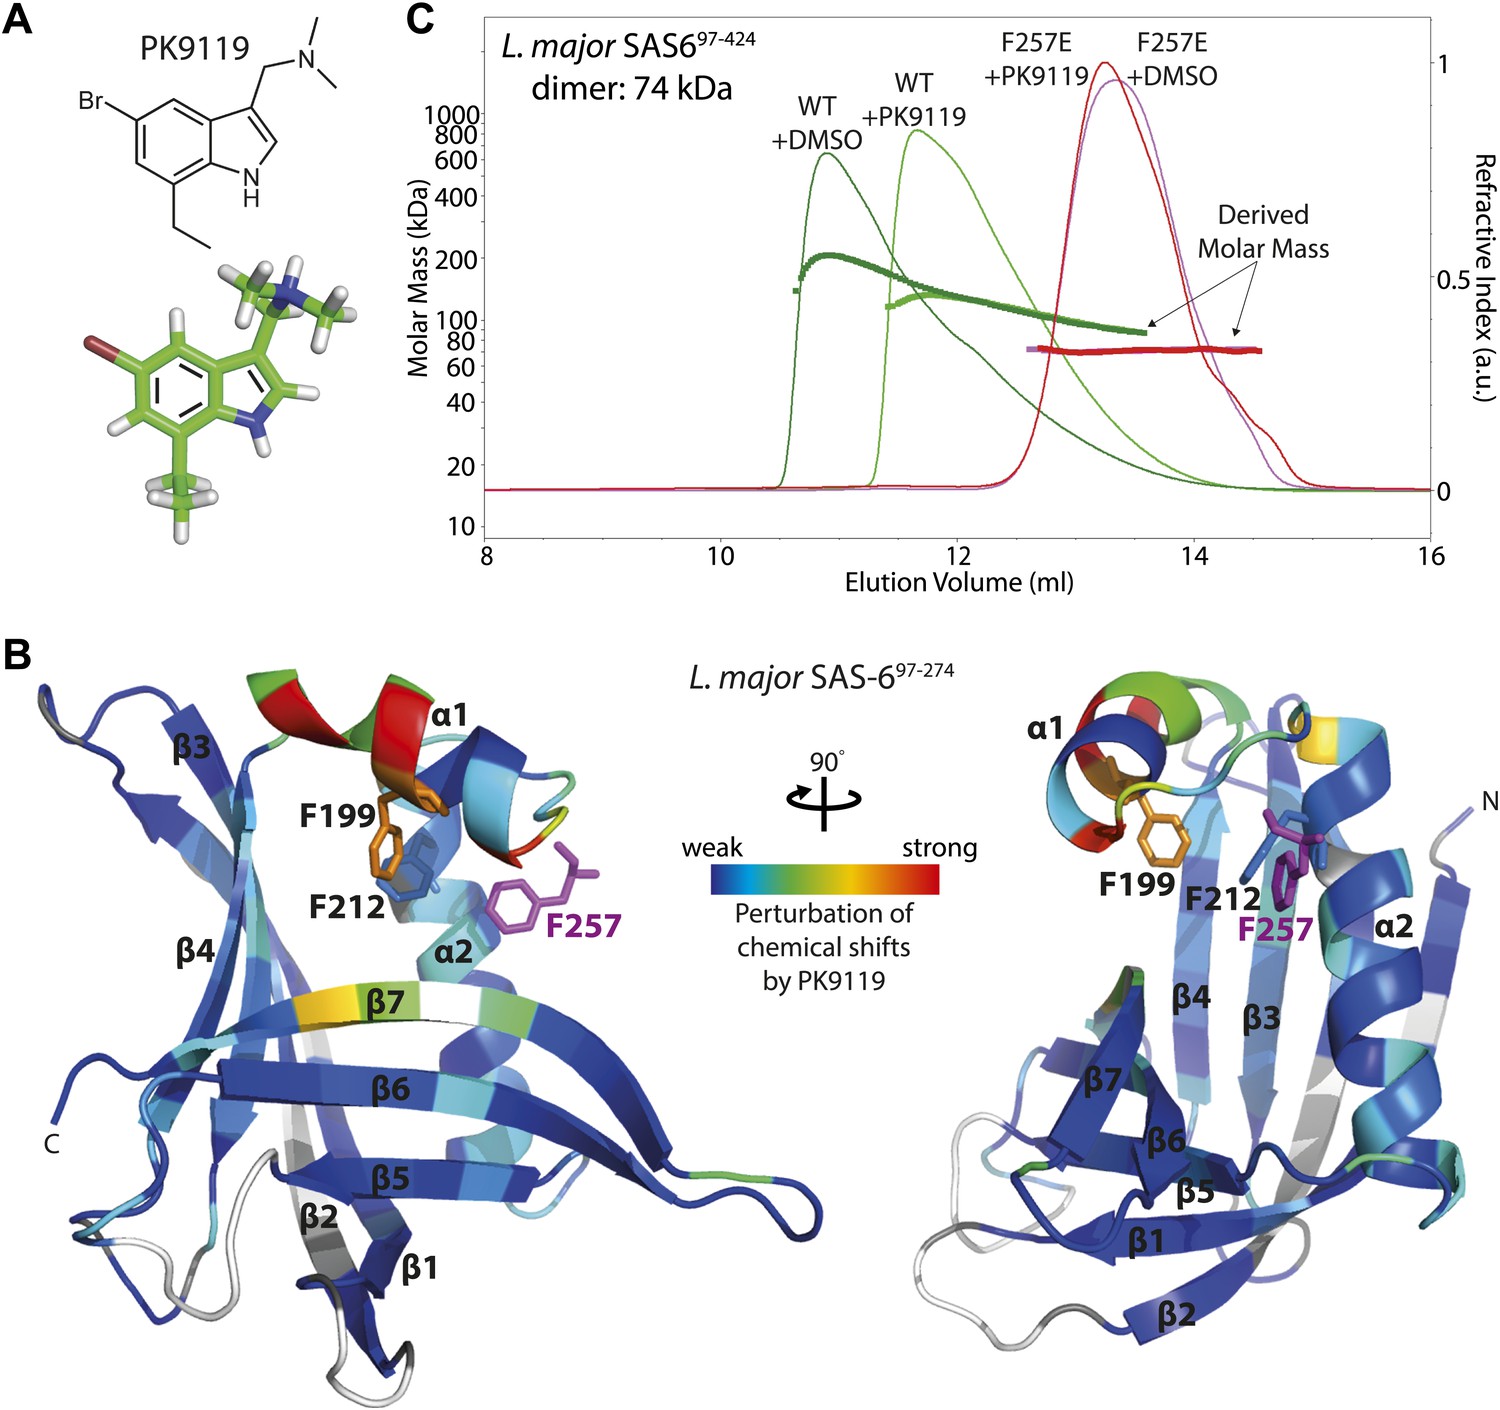
A small chemical compound can inhibit SAS-6 oligomerization.
(A) The chemical structure of compound PK9119 as a structure formula (top) or three-dimensional model (bottom). (B) Heat map of the chemical shift perturbations in the {1H-15N}-HSQC spectrum of 15N-labelled L. major SAS-697–274 F257E in the presence of 2 mM PK9119. Data are plotted onto the crystal structure of wild-type L. major SAS-697–274. Higher shift perturbation is depicted in warmer colors, whilst prolines (not observable in the HSQC) are colored grey, and unassigned/untraced residues are colored white. The magenta F257 is from the homo-dimer partner and is inserted into the hydrophobic pocket of the dimerization interface. Note that the chemical shift perturbations cluster close to this pocket. Side-chains are drawn for F199 and F212 that showed robust perturbations in (HB)CB(CGCD)HD correlation spectra in the presence of 1 mM PK9119 (Figure 3—figure supplement 1C). (C) SEC-MALS chromatogram of L. major SAS-697–424 showing the refractive index signal with the derived molar masses indicated by the thicker horizontal lines. L. major SAS-697–424 displayed a distribution of masses from that of the dimer up to >200 kDa consistent with a concentration driven self-association equilibrium. In the presence of 1 mM PK9119 the maximal mass was almost halved. The F257E mutant displayed a constant mass of 71 kDa in the absence and presence of PK9119 consistent with the mass of a dimer of L. major SAS-697–424. All samples were injected on SEC-MALS at 25 mg/ml (675 μM in monomer). Due to dilution during SEC the peak concentrations achieved were a factor of ∼10 lower than this (∼68 μM in monomer).
Figure 3—figure supplement 1

Chemical shift perturbation of SAS-6 by PK9119.
(A) {1H-15N}-HSQC overlay of 15N-labelled L. major SAS-697–274 F257E in the presence or absence of 1 mM or 2 mM PK9119. (B) Graphical representation of the chemical shift perturbations from the data in panel A, 2 mM PK9119. Perturbation is quantified as a weighted combination Δδ1H + (Δδ15N/5). The blue line indicates that the trajectory of the S170 correlation is not quantified, as its peak could not be traced in the presence of PK9119. (C) Overlay of (HB)CB(CGCD)HD spectra for 13C/15N labelled protein in the presence or absence of 1 mM PK9119, showing Cβ–Hδ correlations for Phe and Tyr side chain resonances. Cβ resonance frequencies of three unperturbed correlations (F184, F185 and Y230), indicated by a horizontal line, are unresolved to within the 0.2 ppm/point resolution of the Cβ assignment spectra, and are not assigned.
Figure 3—figure supplement 2

PK9119 affects the oligomerization of zebrafish SAS-6.
SEC-MALS chromatogram of Danio rerio SAS-61–326 showing the refractive index signal with the derived molar masses indicated by the thicker horizontal lines. Dr SAS-61–326 displayed a distribution of masses from that of the dimer up to ∼250 kDa consistent with a concentration driven self-association equilibrium. In the presence of 1 mM PK9119, the maximal observed mass was reduced to ∼160 kDa. The F131D mutant displayed a constant mass of 75 kDa in the absence and presence of PK9119 consistent with the mass of a Dr SAS-61–326 dimer. All samples were injected on SEC-MALS at 10 mg/ml (263 μM in monomer). Due to dilution during SEC, the peak concentrations were a factor of ∼10 lower than this (∼26 μM in monomer). The largest species seen for Dr SAS-61–326 are bigger than seen for L. major SAS-697–424 (Figure 3C), despite a threefold lower concentration in monomer. This observation is consistent with the weaker head-to-head dimerization KD for L. major SAS-6 seen by analytical ultracentrifugation when compared with measurements on D. rerio SAS-6 (van Breugel et al., 2011).
Tables
Table 1
Native dataset analysis and refinement statistics
| L. major SAS-697–274 WT | L. major SAS-697–320 F257E | L. major SAS-697–320 WT | |
|---|---|---|---|
| Beamline | Diamond I04 | ESRF ID29 | ESRF BM14 |
| Space Group | P43212 | C121 | H3 |
| Wavelength (Å) | 0.9794 | 0.90 | 0.97813 |
| Monomers in the asymmetric unit | 3 | 4 | 6 |
| Unit Cell dimensions (Å) | a = 84.25 b = 84.25 c = 239.94 α = 90.0 β = 90.0 γ = 90.0 | a = 108.9 b = 81.25 c = 133.1 α = 90.0 β = 91.5 γ = 90.0 | a = 482.7 b = 482.7 c = 43.13 α = 90.0 β = 90.0 γ = 120.0 |
| Resolution (Å) | 48.9–2.2 | 46.91–2.9/3.4 (anisotropy) | 66.9–3.5/4.2 (anisotropy) |
| Completeness (overall/inner/outer shell) | 99.9/98.9/100 | 99.9/99.1/99.9 | 100/99.1/100 |
| Rmerge (overall/inner/outer shell) | 0.144/0.064/1.505 | 0.152/0.032/2.570 | 0.335/0.074/3.061 |
| Rpim (overall/inner/outer shell) | 0.065/0.030/0.657 | 0.061/0.013/1.033 | 0.073/0.016/0.704 |
| Mean I/σI (overall/inner/outer shell) | 7.6/18.6/1.4 | 10.6/41.4/0.9 | 8.2/33.3/1.5 |
| Multiplicity (overall/inner/outer shell) | 5.9/5.5/6.0 | 7.2/6.7/7.1 | 22.3/21.9/19.8 |
| Number of reflections | 45,569 | 24,090 | 48,521 |
| Number of atoms | 3536 | 5653 | 8777 |
| Waters | 141 | 0 | 0 |
| Rwork/Rfree (% data used) | 20.8/24.5 (5.0%) | 23.7/25.6 (5.0%) | 22.4/24.2 (5.1%) |
| rmsd from ideal values: bond length/angles | 0.010/1.349 | 0.008/1.255 | 0.006/1.348 |
| Mean B value | 51.5 | 92.8 | 150.6 |
| Average Real-space correlation coefficient | 0.976 | 0.924 | 0.881 |
| Molprobity Score | 1.14 (100th percentile) | 1.33 (100th percentile) | 1.41 (100th percentile) |
Table 2
SeMet L. major SAS-697−274 WT dataset analysis
| Beamline | Diamond I03 | ||
| Space group | P43212 | ||
| Wavelength (Å) | 0.9794 (Peak) | 0.9796 (Inflection) | 0.9393 (Remote) |
| Unit Cell dimensions (Å) | a = 84.19 b = 84.19 c = 239.6 α = 90.0 β = 90.0 γ = 90.0 | a = 84.24 b = 84.24 c = 239.7 α = 90.0 β = 90.0 γ = 90.0 | a = 84.22 b = 84.22 c = 239.7 α = 90.0 β = 90.0 γ = 90.0 |
| Resolution (Å) | 68.9–2.3 | 68.9–2.3 | 68.9–2.3 |
| Completeness (overall/inner/outer shell) | 99.8/99.9/99.7 | 99.7/99.9/99.7 | 99.8/99.7/99.7 |
| Rmerge (overall/inner/outer shell) | 0.130/0.066/0.942 | 0.122/0.048/1.001 | 0.131/0.052/0.973 |
| Rpim (overall/inner/outer shell) | 0.066/0.036/0.467 | 0.062/0.026/0.497 | 0.066/0.028/0.486 |
| Mean I/sd(I) (overall/inner/outer shell) | 7.4/18.8/1.7 | 7.8/21.8/1.7 | 7.2/20.2/1.6 |
| Multiplicity (overall/inner/outer shell) | 4.8/4.1/4.9 | 4.7/4.1/4.9 | 4.7/4.0/4.8 |
| Se sites found/expected | 14/12 | ||
Table 3
SeMet L. major SAS-697−320 WT dataset analysis
| Beamline | ESRF BM14 |
| Space group | H3 |
| Wavelength (Å) | 0.97872 (Peak) |
| Unit Cell dimensions (Å) | a = 481.7 b = 481.7 c = 42.9 α = 90.0 β = 90.0 γ = 120.0 |
| Resolution (Å) | 48.2–4.0/5.4 (anisotropy) |
| Completeness (overall/inner/outer shell) | 100.0/98.8/100.0 |
| Rmerge (overall/inner/outer shell) | 0.194/0.054/2.118 |
| Rpim (overall/inner/outer shell) | 0.091/0.026/0.987 |
| Mean I/sd(I) (overall/inner/outer shell) | 3.8/13.7/0.9 |
| Multiplicity (overall/inner/outer shell) | 5.6/5.5/5.6 |
Download links
A two-part list of links to download the article, or parts of the article, in various formats.
Downloads (link to download the article as PDF)
Open citations (links to open the citations from this article in various online reference manager services)
Cite this article (links to download the citations from this article in formats compatible with various reference manager tools)
Structure of the SAS-6 cartwheel hub from Leishmania major
eLife 3:e01812.
https://doi.org/10.7554/eLife.01812


