Fluorescent sensors for activity and regulation of the nitrate transceptor CHL1/NRT1.1 and oligopeptide transporters
- Carnegie Institution for Science, United States
Figures
Figure 1
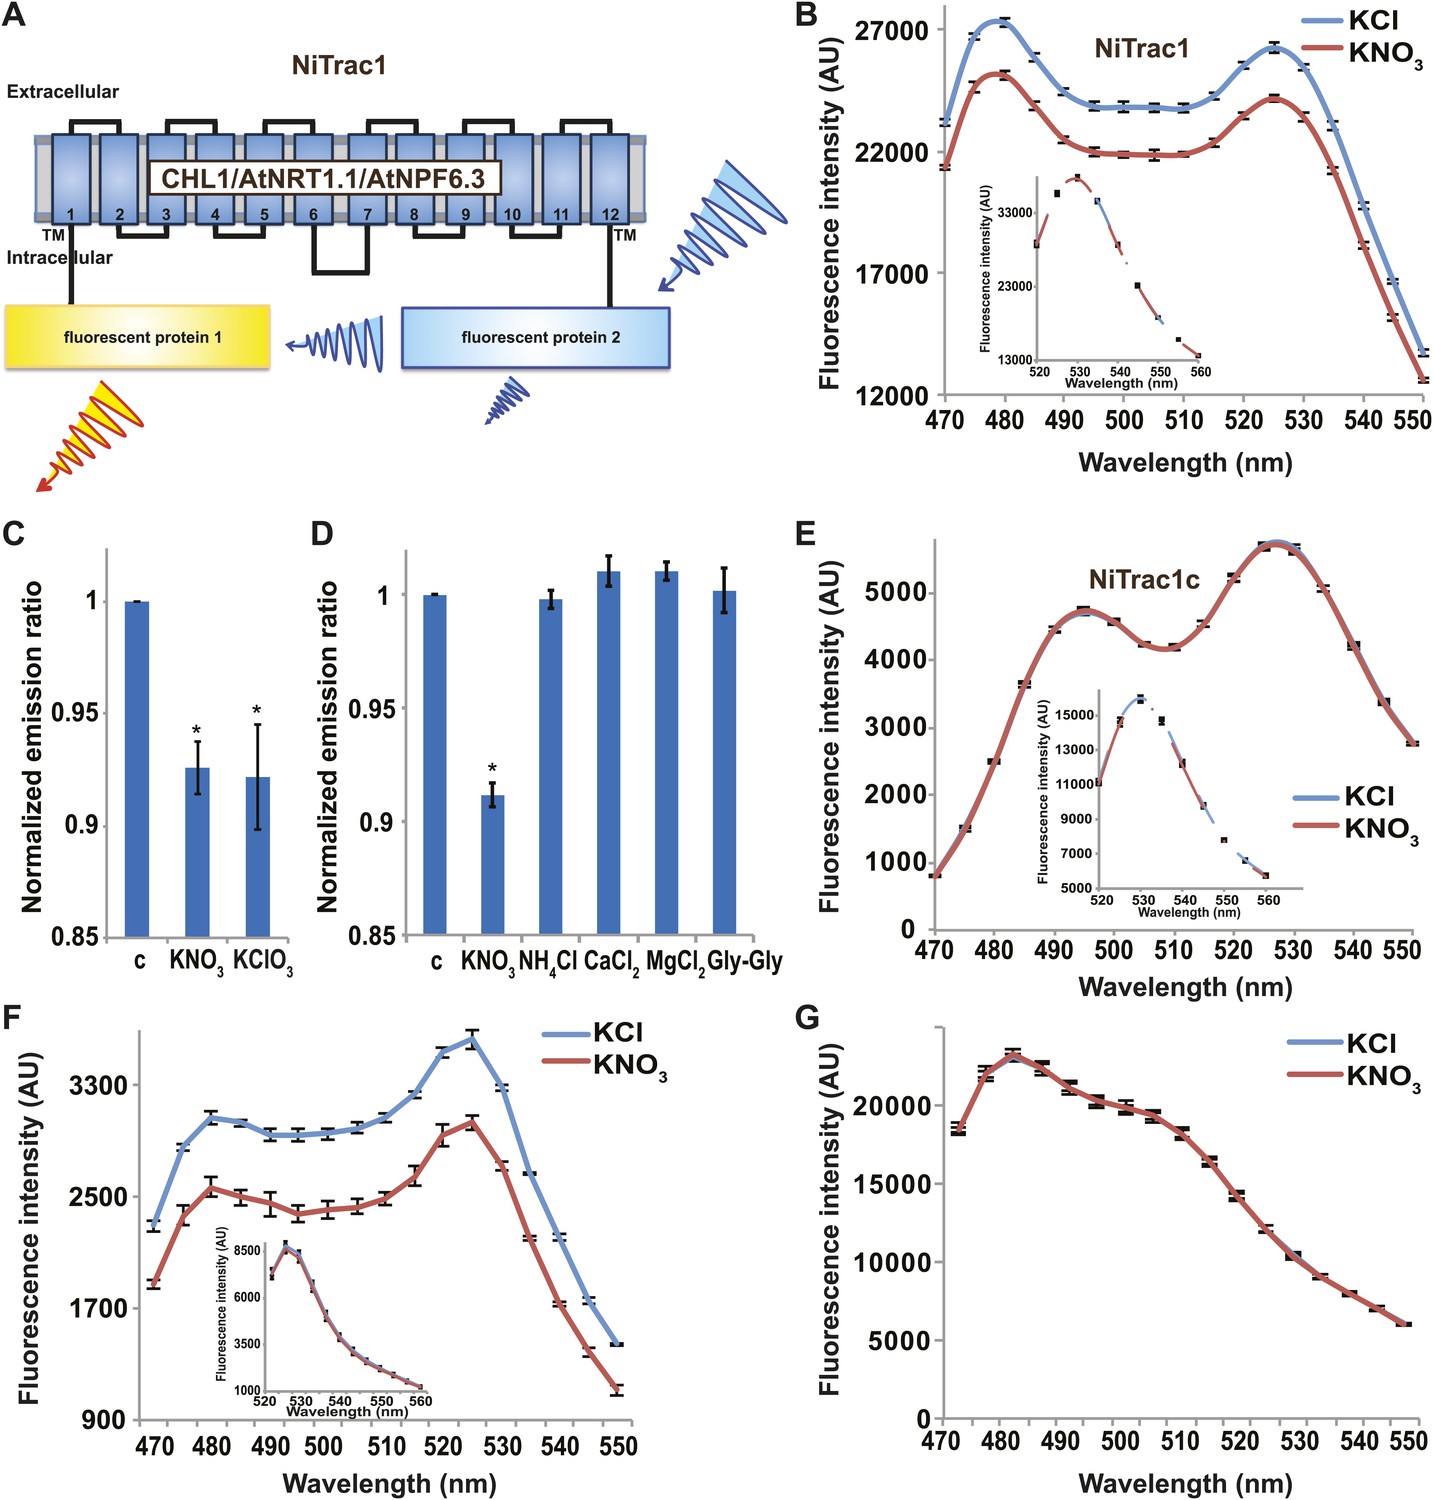
Design and development of NiTrac sensors.
(A) Schematic representation of the NiTrac1 sensor construct. Aphrodite, yellow; mCerulean, light blue; CHL1/NRT1.1/NPF6.3 dark blue; TM, transmembrane domain. (B) Emission spectra for NiTrac1 expressed in yeast cells; excitation at 428 nm: addition of 5 mM potassium nitrate (red; control 5 mM KCl, blue) lead to a reduction in fluorescence intensity of donor and acceptor emission, caused by donor quenching. Inset: emission of Aphrodite in NiTrac1 when excited at 505 nm. Aphrodite emission was unaffected. (C) Nitrate and its analog chlorate both trigger quenching at 5 mM concentrations. Nitrate-induced ratio change (peak fluorescence intensity of Aphrodite excited at 505 nm over emission spectrum at 485 nm obtained with excitation at 428 nm). Data are normalized to buffer-treated control c. (D) Substrate specificity: yeast cells expressing NiTrac1 were treated with the indicated compounds at 5 mM concentrations. Only nitrate and chlorate triggered responses that were significantly different from control c (*p<0.05, t test). Experiment performed as in Figure 1C. (E) Absence of quenching of NiTrac1 when mCerulean was exchanged for mTFP (excitation at 440 nm). Inset: emission of Aphrodite in NiTrac1 when excited at 505 nm. (F) Donor quenching is retained when mCerulean is exchanged for eCFP in NiTrac1 in response to addition of 5 mM potassium nitrate (red; control 5 mM KCl, blue; excitation at 428 nm). Inset: emission of Aphrodite in NiTrac1 when excited at 505 nm. (G) No detectable effect on the fluorescence properties of nitrate addition to yeast cells coexpressing a cytosolically localized free mCerulean and the CHL1 transceptor. Mean ± SD; n = 3.
Figure 2
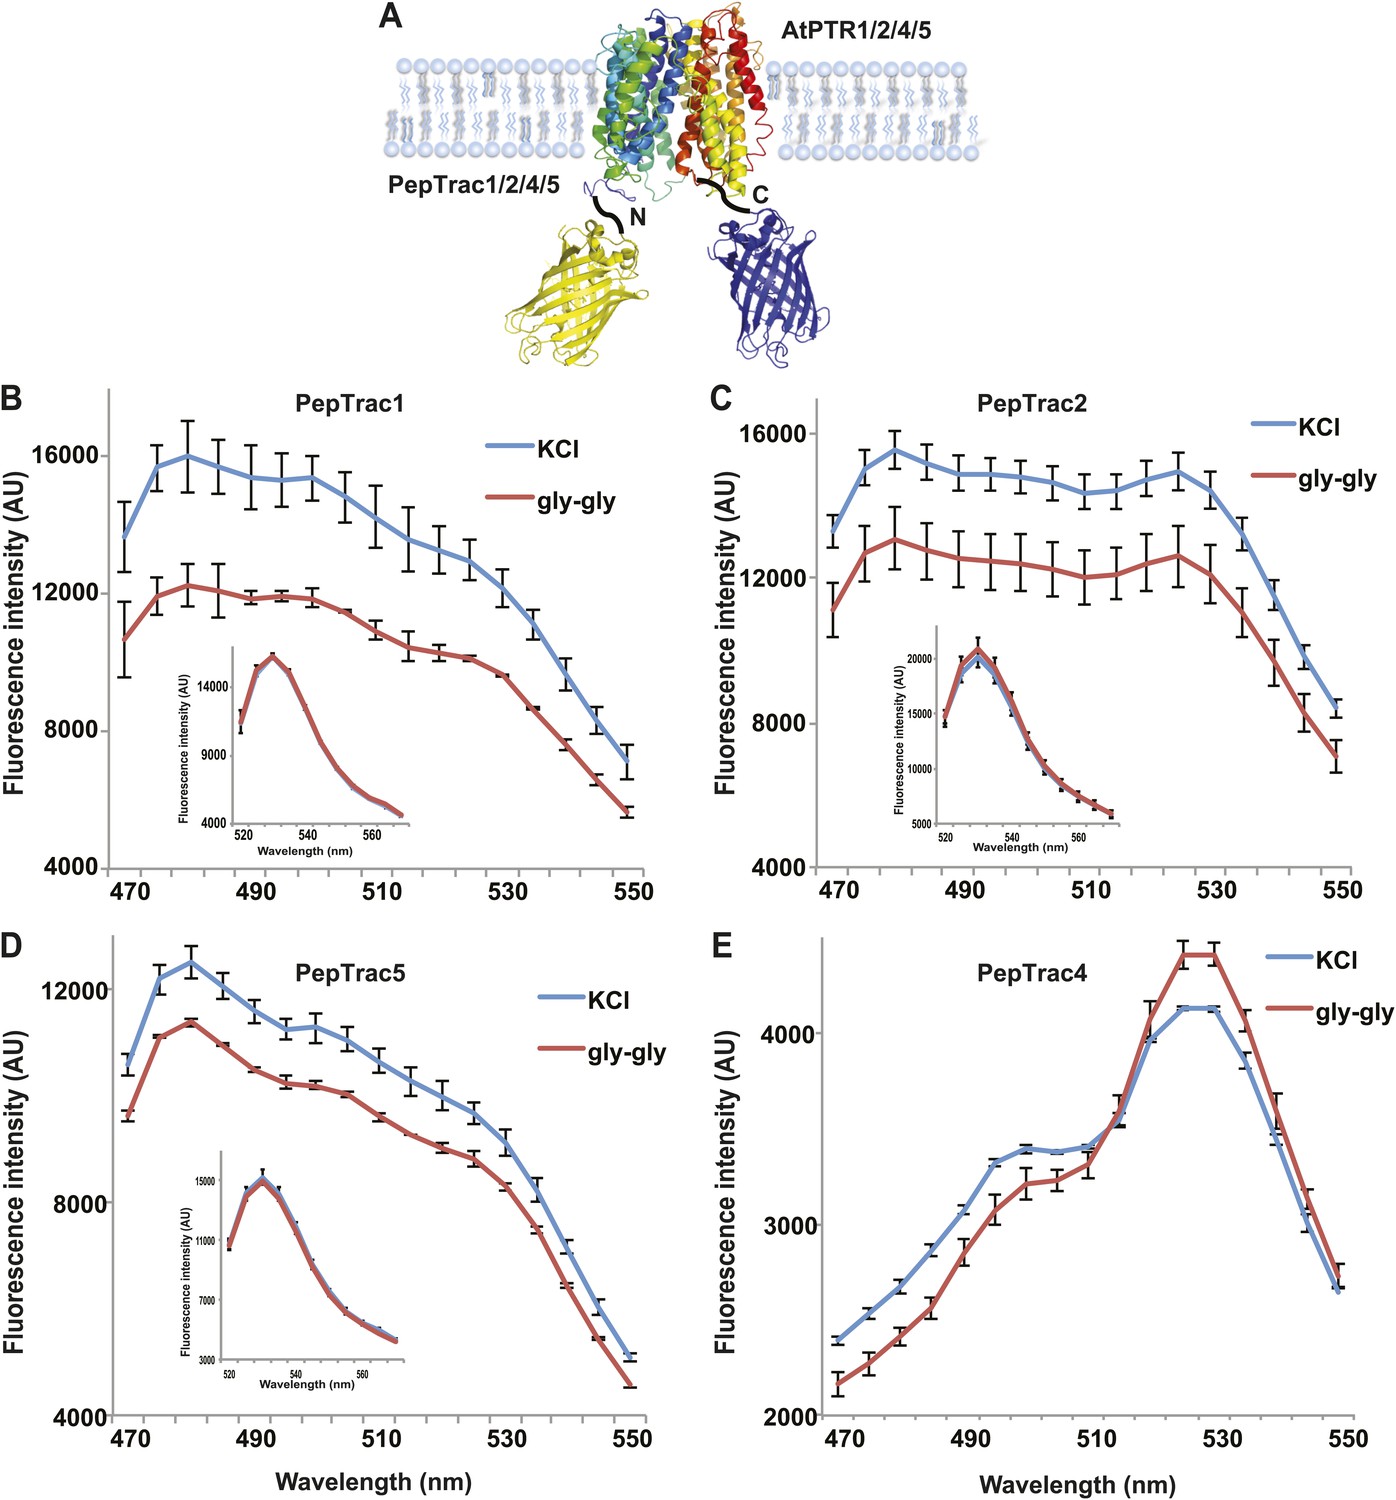
PepTrac sensors.
(A) Schematic representation of the PepTrac sensor constructs. AtPTR1, 2, 4, and 5 were used for PepTrac sensor creation. Three-dimensional model of AFP-PTRs-mCerulean chimeric protein based on the crystal structure of bacteria peptide transporters (‘Materials and methods’). PTR1 is shown in rainbow cartoon; AFP in yellow; mCerulean in blue. (B–D) Donor quenching of PepTrac1, 2, and 5 expressed in yeast in response to addition of 0.5 mM diglycine (red; control 5 mM KCl, blue; excitation at 428 nm). Inset: emission of Aphrodite in PepTrac1, 2, and 5 when excited at 505 nm. (E) FRET ratio change for PepTrac4 (red; control 5 mM KCl, blue; excitation at 428 nm). Mean ± SD; n = 3.
Figure 3
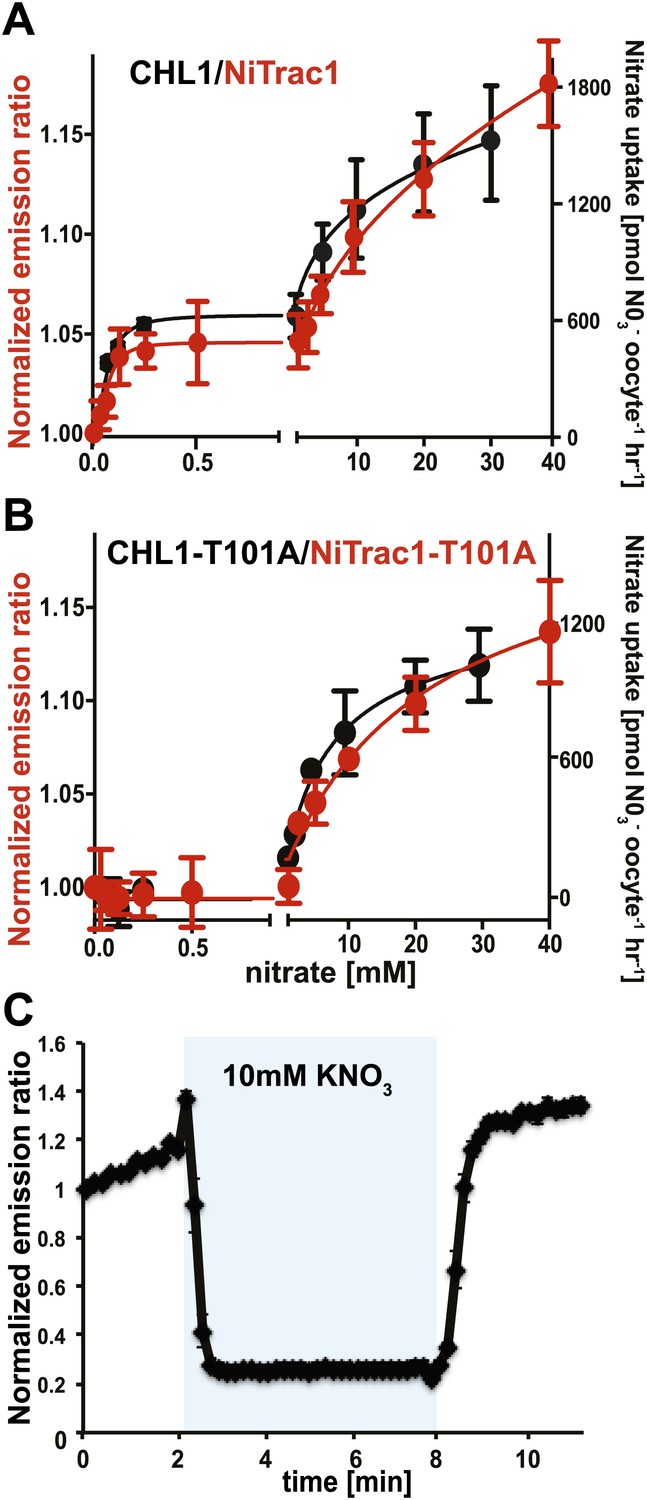
Biphasic kinetics of the NiTrac1 response.
(A) Biphasic nitrate uptake kinetics of the fluorescence response of NiTrac1 (red) and biphasic nitrate uptake transport kinetics of CHL1/NRT1.1 (Black). (B) Monophasic nitrate uptake kinetics of the fluorescence response of NiTrac1-T101A (red) and monophasic low-affinity transport kinetics of CHL1/NRT1.1-T101A (Black, oocyte uptake data from (Liu and Tsay, 2003). The Kms of NiTrac1 for nitrate are ∼75.1 ± 21 μM and 3.8 ± 2.6 mM; for NiTrac1-T101A is 3.5 ± 3.7 mM. Excitation and emission as Figure 1C. The amount of decreased fluorescence intensity by addition of indicated nitrate concentration in Figure 3A,B were normalized to water-treated control (0) (mean ± SD; n = 3). (C) Analysis of the NiTrac1 response in individual yeast cells trapped in a Cellasic microfluidic plate. Cells were initially perfused with 50 mM MES buffer pH 5.5, followed by a square pulse of 10 mM KNO3 in MES buffer for 6 min (blue frame). Data were normalized to the initial value (mean ± SD; n = 3).
Figure 4
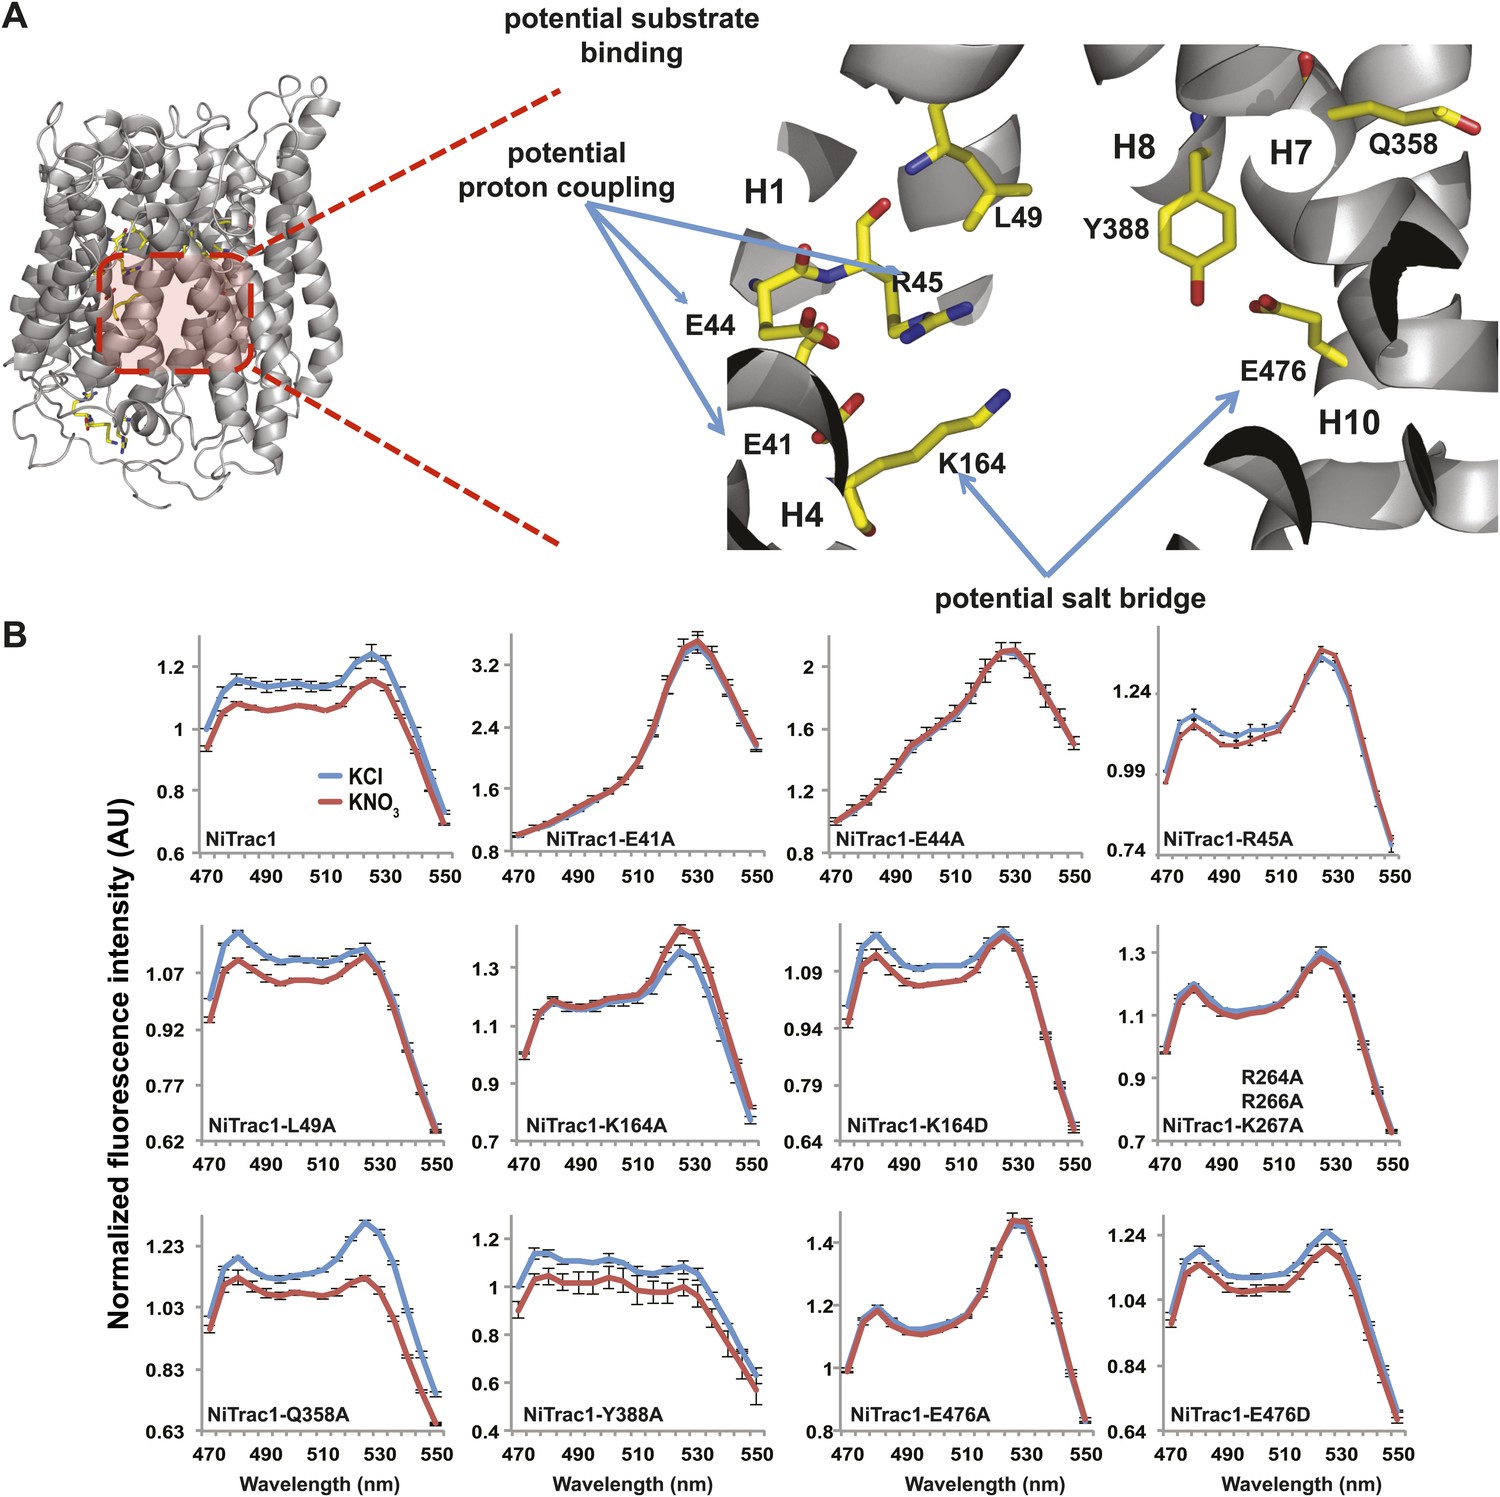
Response of NiTrac1 mutants to nitrate addition.
(A) Three-dimensional model of CHL1 protein based on the crystal structures of bacteria (‘Materials and methods’). Red square, potential substrate binding pocket. Right panel, enlarged potential substrate binding pocket. (B). Fluorescence response of NiTrac1 mutants expressed in yeast in response to addition of 10 mM potassium nitrate (red; control 10 mM KCl, blue; excitation at 428 nm). To compare the differences in fluorescence intensity between wild type and mutants of CHL1 as well as the differences after addition of nitrate, all data from wild type and mutants were normalized to the intensity of KCl-treated controls at 470 nm. Mean ± SD; n = 3.
Figure 5
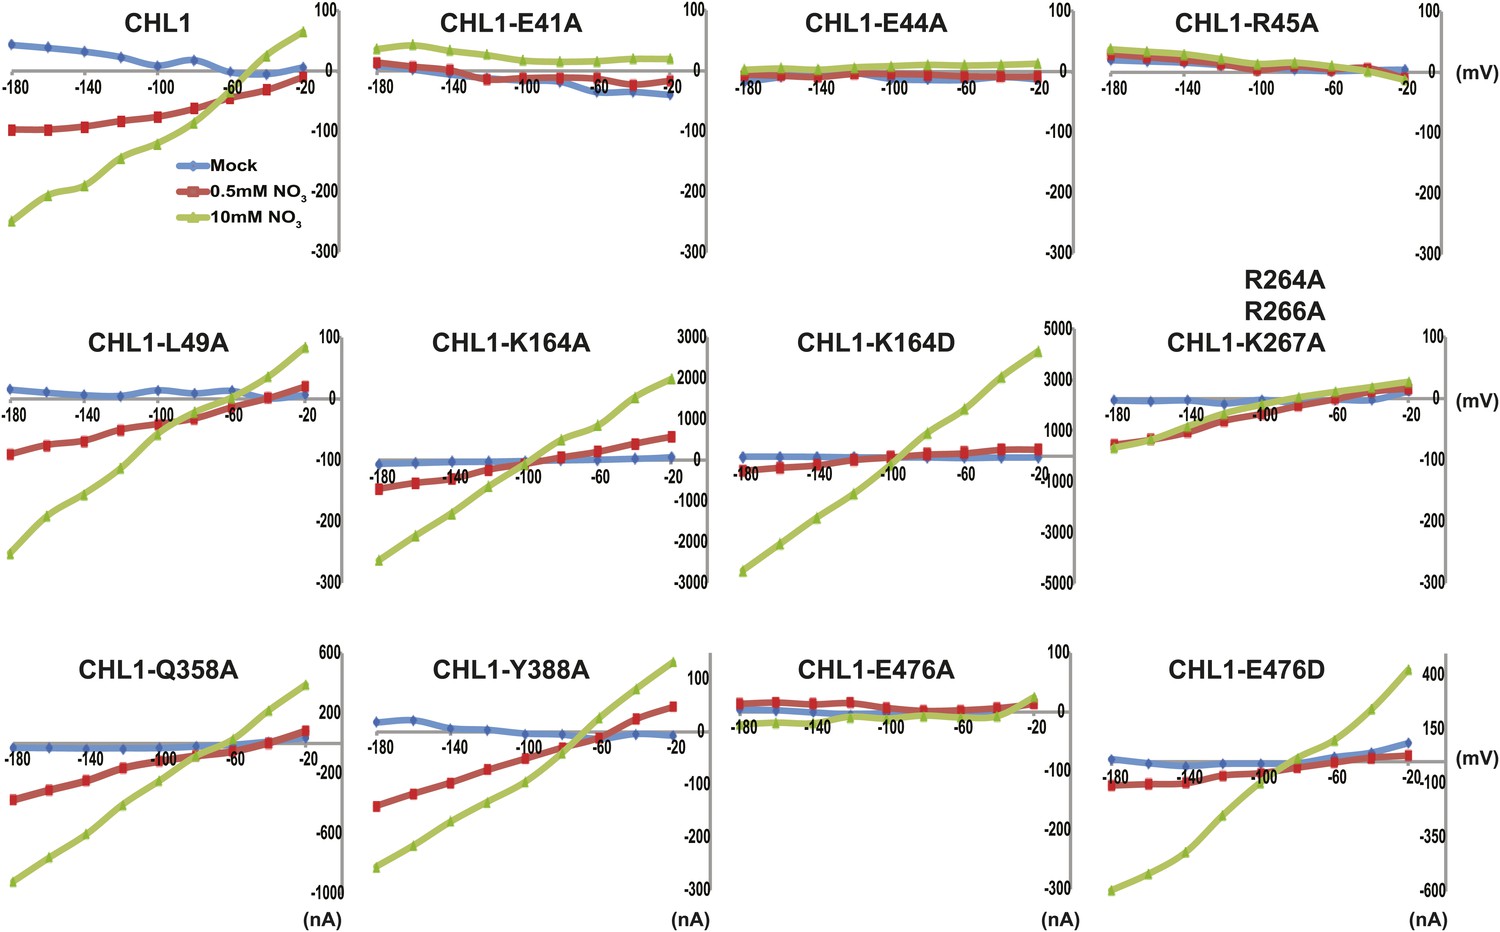
Current and voltage curve of CHL1/NRT1.1 mutants using TEVC.
Oocytes were voltage clamped at −40 mV and stepped into a test voltage between −20 and −180 mV for 300 ms, in −20-mV increments. The currents (I) shown here are the difference between the currents flowing at +300 ms in the cRNA-injected CHL1 mutants and water-injected control of the indicated substrates. The curves presented here were recorded from a single oocyte. Similar results were obtained using another two different batches of oocytes.
Figure 6
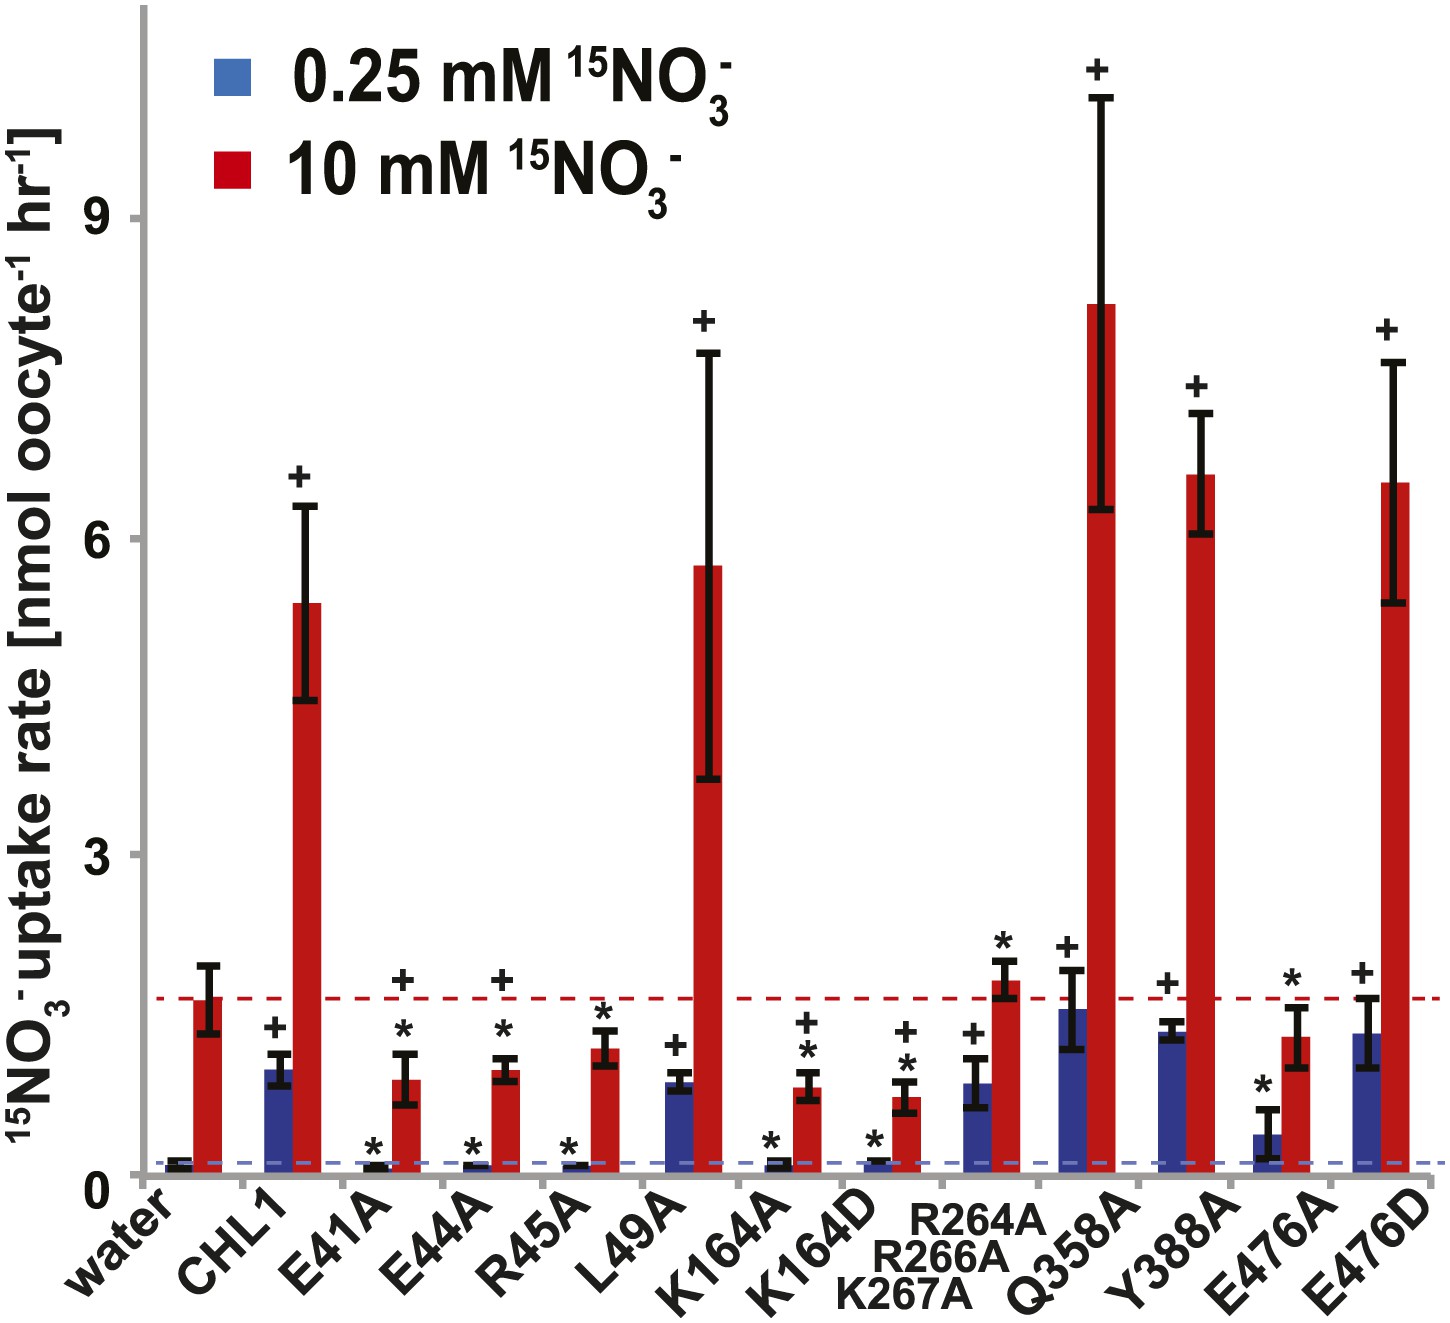
15NO3− uptake activity of various CHL1 mutants in oocytes.
The injected oocytes with various cRNA of CHL1 mutants were incubated with 0.25 mM and 10 mM K15NO3 buffer at pH 5.5 for about 1.5∼2 hr, and their 15N content was determined as described in ‘Materials and methods’. The values are mean ± SD (n = 5∼6 for all three experiments). Data are normalized to the 0.25 mM treated CHL1-injected oocytes. +, significant difference (p<0.05, t test) compared with water-injected oocytes. An asterisk indicates a significant difference (p<0.05, t test) compared with the CHL1-injected oocytes. Similar results were obtained using another two batches of oocytes.
Figure 7
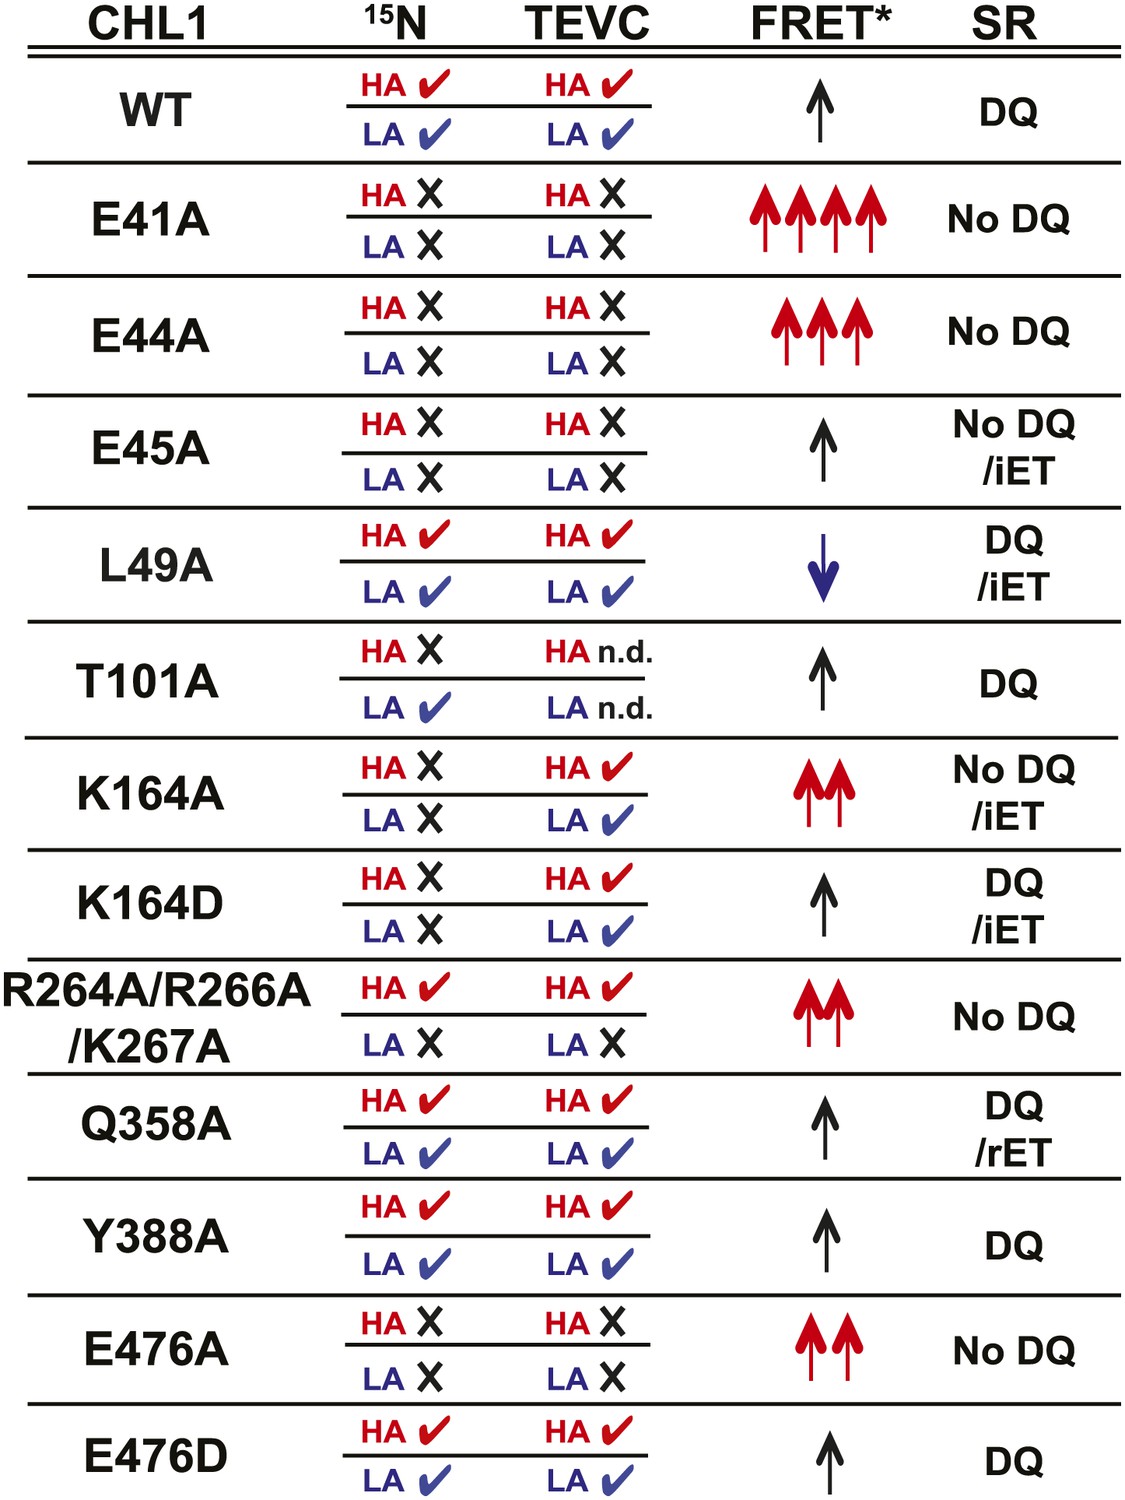
Summary of nitrate uptake and TEVC measurements for CHL1 mutants and relative fluorescence emission and change in apparent energy transfer efficiency of NiTrac1 mutants in presence and absence of nitrate.
CHL1 column: wild type and various mutants of CHL1. 15N column: nitrate uptake measured in oocytes using 15NO3− (checkmark ✓ indicates transport activity detected, whereas × indicates no significant, or dramatically reduced, uptake activity; red HA: measured at low nitrate concentration to analyze high-affinity component; blue LA: measured at high nitrate concentration to analyze low-affinity component). TEVC column: effect of mutations on current voltage relationships measured by two-electrode voltage clamping; checkmark ✓ indicates nitrate-induced current observed, whereas × indicates no significant, or dramatically reduced, current induced by nitrate; red HA and blue LA as defined above. FRET* column: crude classification of the apparent energy transfer efficiency observed in NiTrac and NiTrac mutants in the absence of substrate; multiple arrows (↑) indicate a relative higher energy transfer efficiency. Blue arrows, reduced apparent energy transfer; red arrows, increased apparent energy transfer. SR column: type of response of NiTrac or mutants to substrate addition: DQ, donor quenching; iET, increased energy transfer; rET, reduced energy transfer.
Figure 8
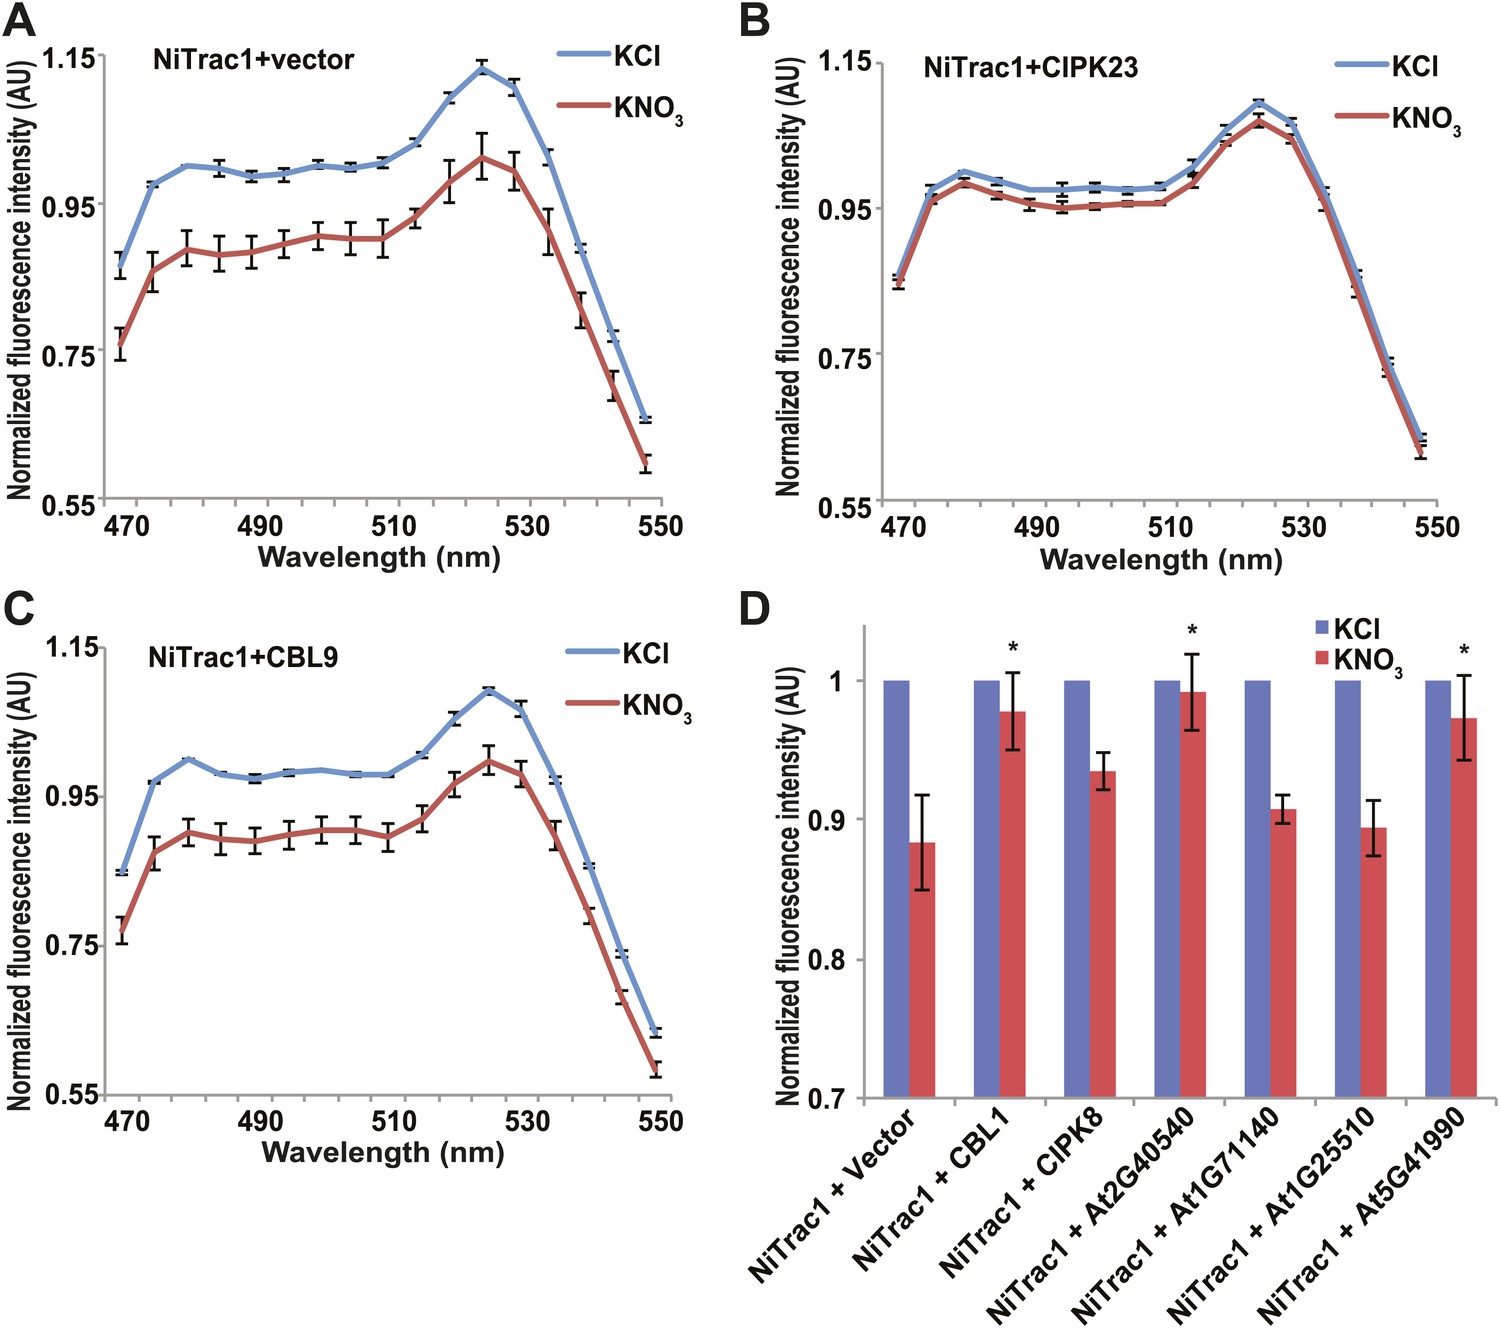
Effects of the fluorescence response of NiTrac1 by interacting proteins.
Known interactors or regulators, such as CIPK8, CIPK23, CBL1, and CBL9 as well as other interactors identified in a large-scale membrane protein interaction screen were co-expressed with NiTrac1 in yeast cells. (A) Donor quenching response of NiTrac1 with vector as control. (B) and (C) Fluorescence response of NiTrac1 in CIPK23 and CBL9 coexpressing yeast, respectively. (D) The fluorescence response indicates that CIPK23, CBL1, At2g40540, and At5g41990 affect the conformation NiTrac1, whereas no detectable change is observed for CBL9, CIPK8, At1g71140, and At1g25510. Experiment performed as in Figure 1C. (A–C) Nitrate-induced ratio change (peak fluorescence intensity of Aphrodite excited at 505 nm over emission spectrum obtained with excitation at 428 nm). Data are normalized to KCl-treated control at 470 nm. An asterisk indicates a significant difference (p<0.05, t test) compared with the KNO3-treated control. Mean ± SD; n = 3.
Download links
A two-part list of links to download the article, or parts of the article, in various formats.
Downloads (link to download the article as PDF)
Open citations (links to open the citations from this article in various online reference manager services)
Cite this article (links to download the citations from this article in formats compatible with various reference manager tools)
Fluorescent sensors for activity and regulation of the nitrate transceptor CHL1/NRT1.1 and oligopeptide transporters
eLife 3:e01917.
https://doi.org/10.7554/eLife.01917


