T cell-intrinsic role of IL-6 signaling in primary and memory responses
- Yale University School of Medicine, United States
- Max Planck Institute for Neurological Research, Germany
- Yale School of Public Health, United States
- Howard Hughes Medical Institute, Yale University School of Medicine, United States
Figures
Figure 1 with 6 supplements

Impairment of both Th1 and Th17 responses in IL-6RαT-KO mice.
(A) Expression of the IL-6Rα chain by CD4+ and CD8+ T cells from WT and IL-6RαT-KO mice was examined by flow cytometry in naive mice (upper panels) and in mice immunized with OVA plus LPS in IFA (lower panels). (B) CD4+ and CD8+ T cells purified from WT and IL-6RαT-KO mice were either left untreated (shaded histogram) or stimulated with recombinant IL-6 for 20 min (open histogram) and expression of phosphorylated STAT3 (Y705) was assessed by flow cytometry. (C) CD4+ T cells were purified from the popliteal and inguinal lymph nodes of WT and IL-6RαT-KO mice 7 days following immunization in the footpads with OVA and LPS emulsified in IFA. Proliferation was assessed by [3H]-thymidine incorporation following coculture of purified CD4+ T cells with irradiated splenocytes presenting titrating doses of OVA for approximately 72–84 hr. (D) Supernatants of CD4+ T cells from immunized mice were collected approximately 84 hr after restimulation with antigen in vitro. The production of IFN-γ and IL-17 by CD4+ T cells was examined by ELISA. (E) Proliferation and cytokine expression were measured by CFSE-labeling and intracellular cytokine staining, respectively, 72 hr after in vitro restimulation. Stimulations were performed as described in (C). (F) Day 7 following immunization with 2W peptide and LPS emulsified in IFA, the percentages of antigen-specific T cells were determined by 2W:I-Ab tetramer staining. Gated on total CD4+ cells. (G) Total cell numbers and absolute numbers of 2W:I-Ab tetramer positive CD4+ T cells in the draining lymph nodes of WT and IL-6RαT-KO mice after the immunization. Data are representative of three independent experiments. Line graphs and bar graphs represent mean ± SEM; for all panels: p≤0.05.
Figure 1—figure supplement 1

Phosphorylation of STAT3 in IL6Rα-deficient CD4+ T cells after stimulation through gp130-containing receptors.
Isolated CD4+ T cells from IL-6Rα-deficient mice and wild-type controls were stimulated in vitro with α-CD3e and α-CD28 mAbs and the indicated cytokines. Phosphorylation of STAT3 was measured 1 hr later by Western blot analysis. Detection of β-actin was used as loading control. sIL-6Rα, soluble IL-6R α chain; OSM, oncostatin M; CNTF, ciliary neurotrophic factor. Shown is a representative experiment reflecting the results from one mouse per genotype out of two independent experiments using a total of four mice per genotype.
Figure 1—figure supplement 2
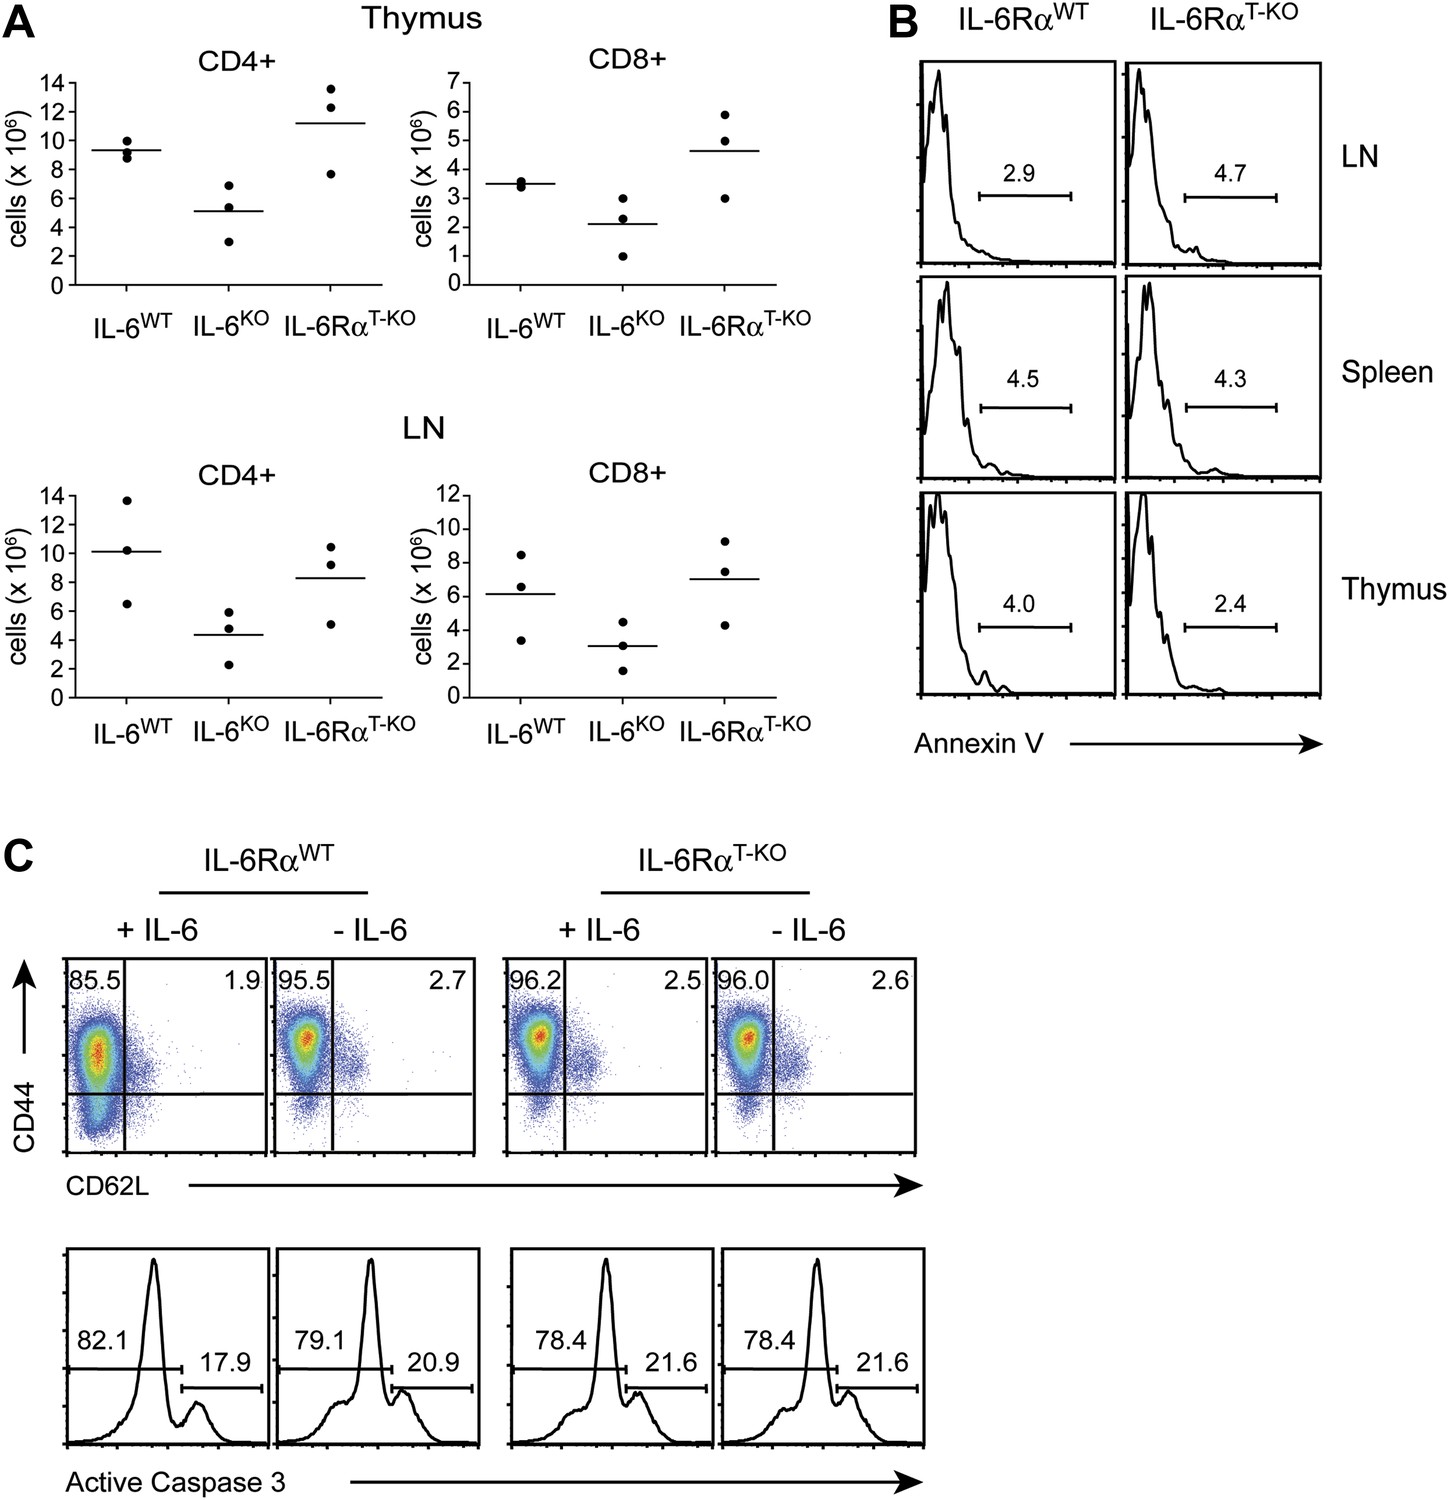
T cell homeostasis is unaffected when IL-6 signaling is abrogated specifically in T cells.
(A) Total numbers of CD4+ and CD8+ T cells in the thymus and lymph nodes of WT, IL-6RαT-KO and complete IL-6-deficient mice were assayed by flow cytometry. (B) CD4+ T cells from the thymus, spleen, and lymph nodes of WT and IL-6RαT-KO mice were stained for annexin V. (C) CD4+ T cells purified from the spleen of WT and IL-6RαT-KO mice were stimulated with plate-bound α-CD3 and α-CD28 plus or minus recombinant IL-6 for 72 hr and analyzed for expression of CD44, CD62L, and active Caspase-3.
Figure 1—figure supplement 3
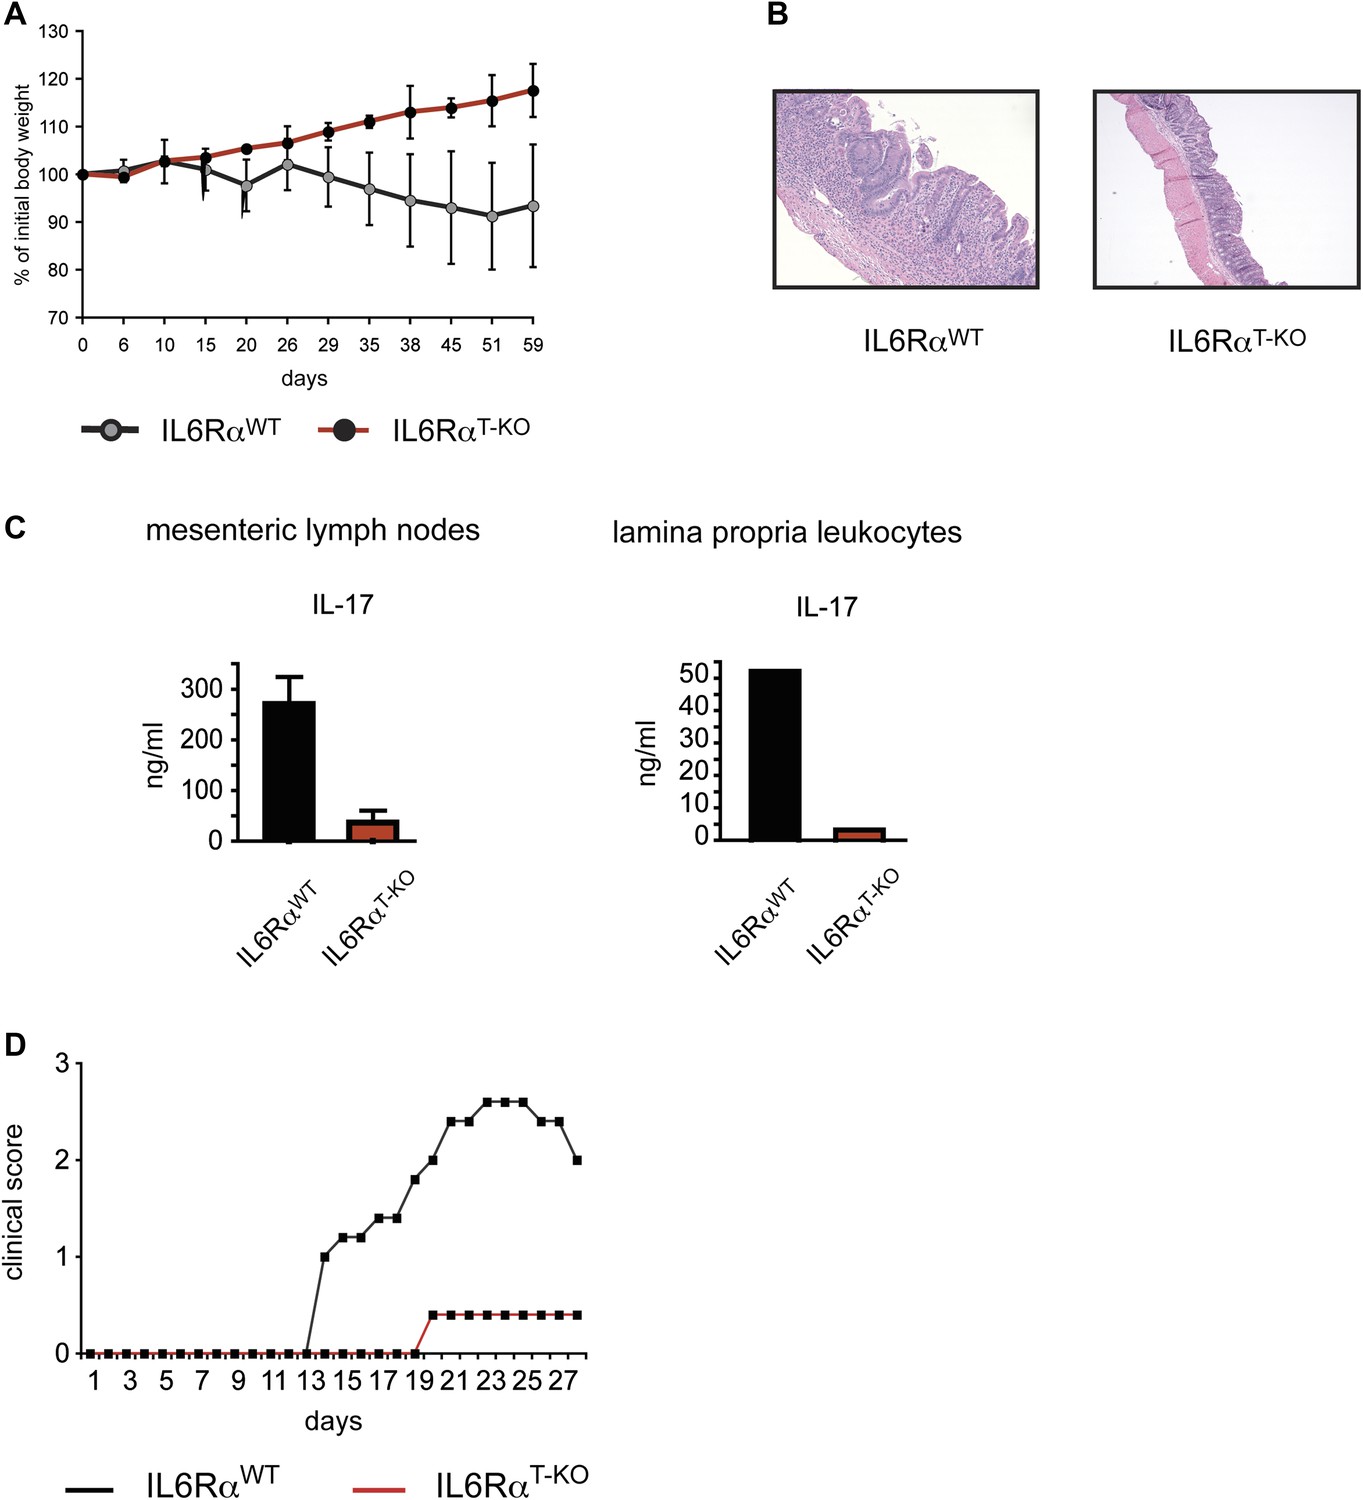
IL-6Rα-deficient CD4+ CD45RBhi T cells fail to induce Colitis and IL-6RαT-KO mice are resistant to EAE.
(A) RAG2 KO mice were injected intraperitoneally with 5 × 10⁵ CD4+ CD45RBhi cells purified from WT or IL-6RαT-KO mice. Mice were monitored for weight loss. (B) Histological sections of the middle colon of RAG2 KO mice that received WT or IL-6Rα-deficient CD4+ CD45RBhi cells 8 weeks before. (C) Mesenteric lymph node and lamina propria cells isolated from RAG2 KO recipient mice were stimulated with α-CD3 in vitro and supernatants were assayed for IL-17 production by ELISA. (D) WT and IL-6RαT-KO mice were immunized with MOG35-55 peptide in CFA plus pertussis toxin to induce EAE. Mice were monitored weekly for disease progression.
Figure 1—figure supplement 4
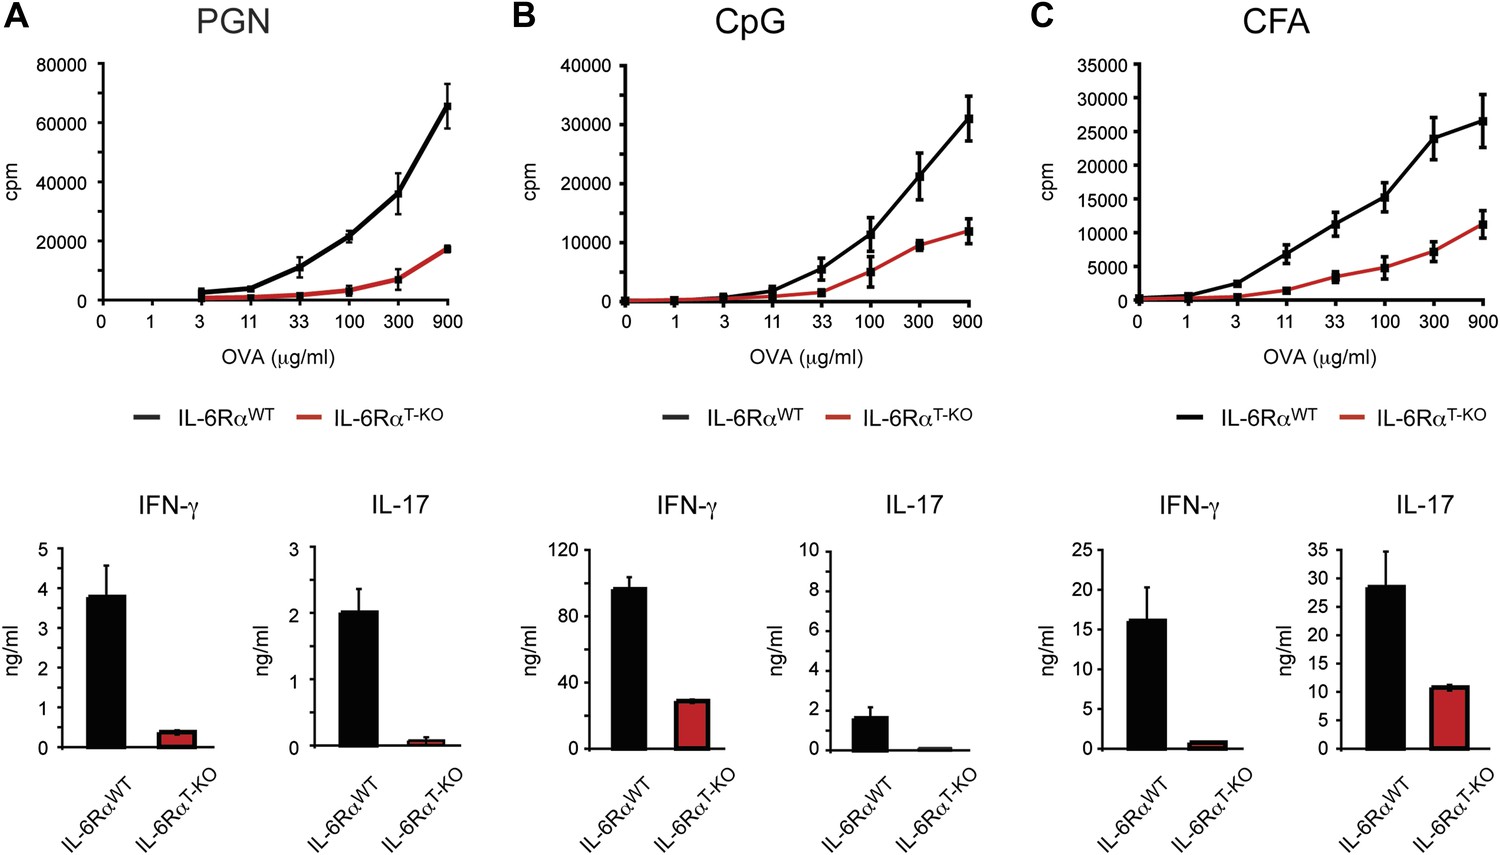
IL-6RαT-KO mice show impaired CD4+ T cell responses.
(A–C) WT and IL-6RαT-KO mice were immunized with OVA and PGN (A) or CpG DNA (B) emulsified in IFA, or OVA emulsified in CFA (C). 7 days later, purified CD4+ T cells were cultured with irradiated splenocytes and titrating doses of OVA for 72 hr. Proliferation and cytokine production were measured by [3H]-thymidine incorporation and ELISA, respectively.
Figure 1—figure supplement 5
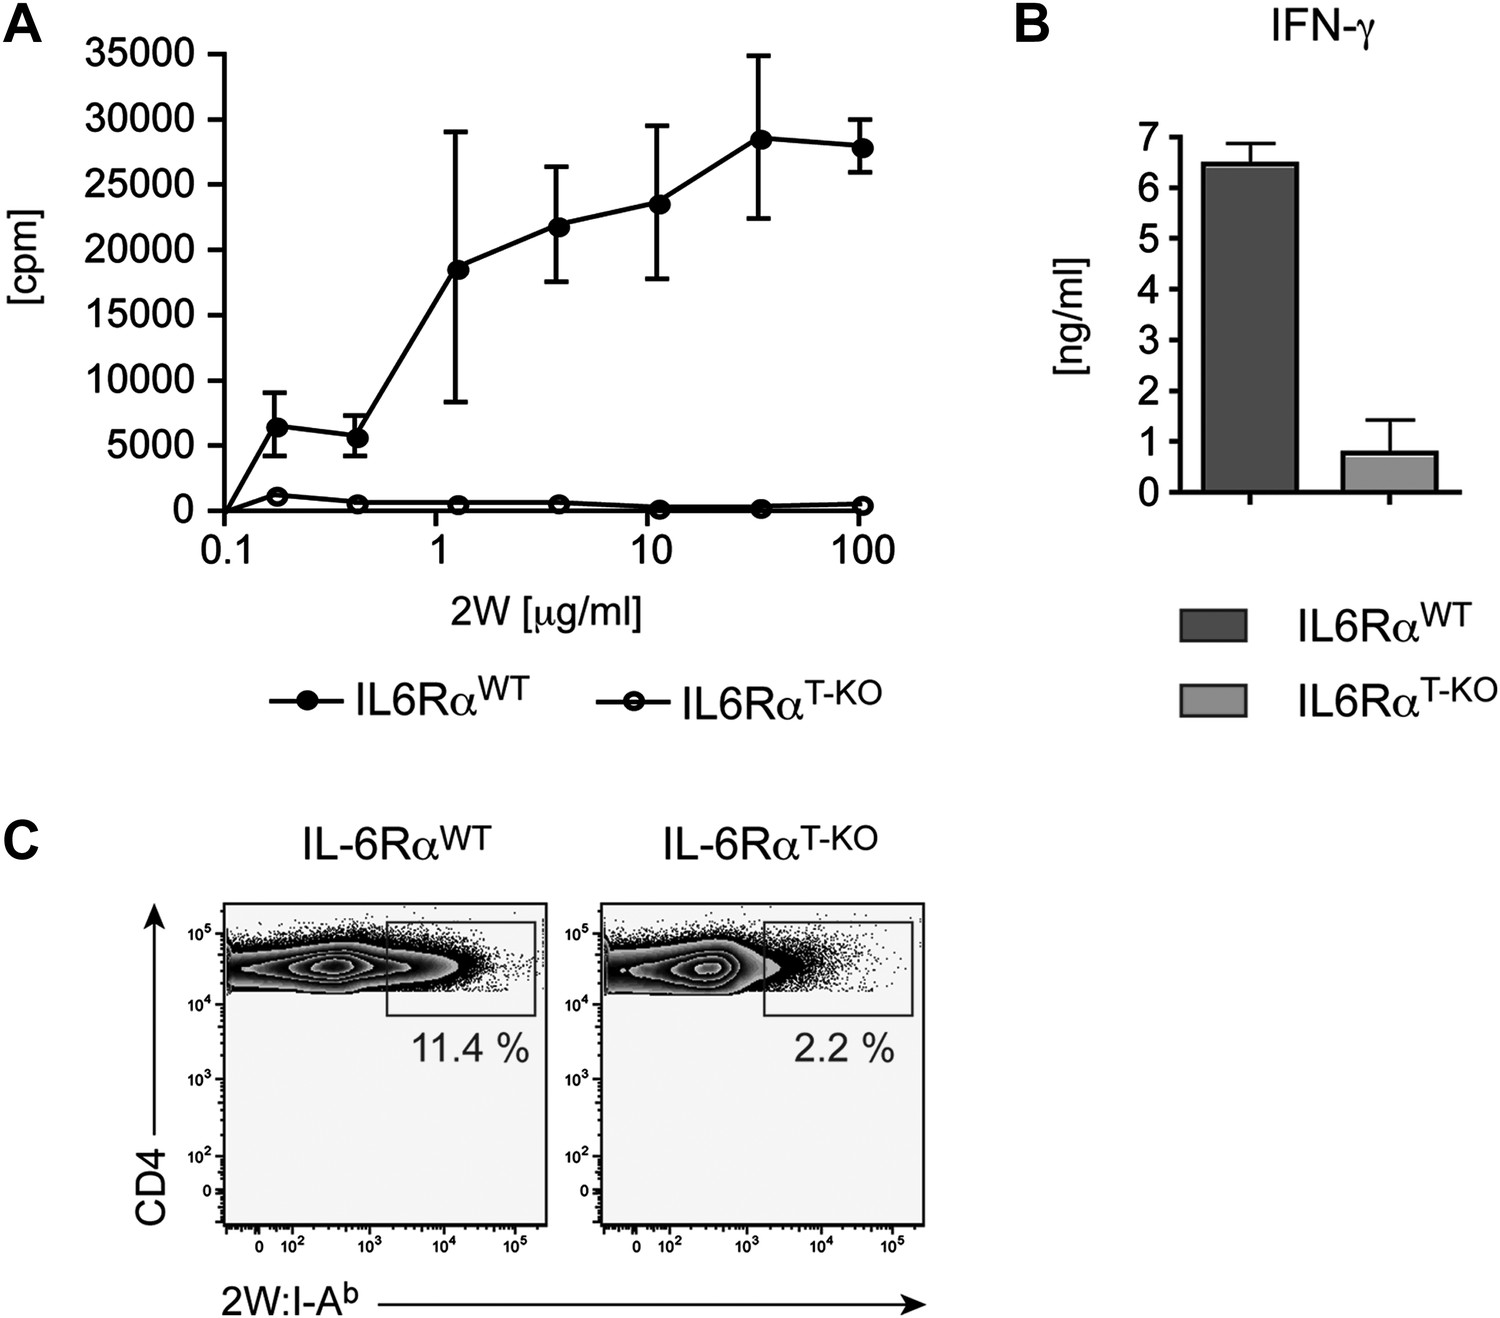
Defective CD4+ T cell response in IL-6RαT-KO mice immunized with 2W peptide plus LPS in IFA.
CD4+ T cells from immunized IL-6RαT-KO and control mice were isolated and restimulated in vitro. Proliferation (A), IFN-γ production (B), and frequency of 2W:I-Ab+ CD4+ T cells (C) were determined by [3H]-thymidine incorporation, ELISA, and flow cytometry, respectively. Representative experiments are shown.
Figure 1—figure supplement 6
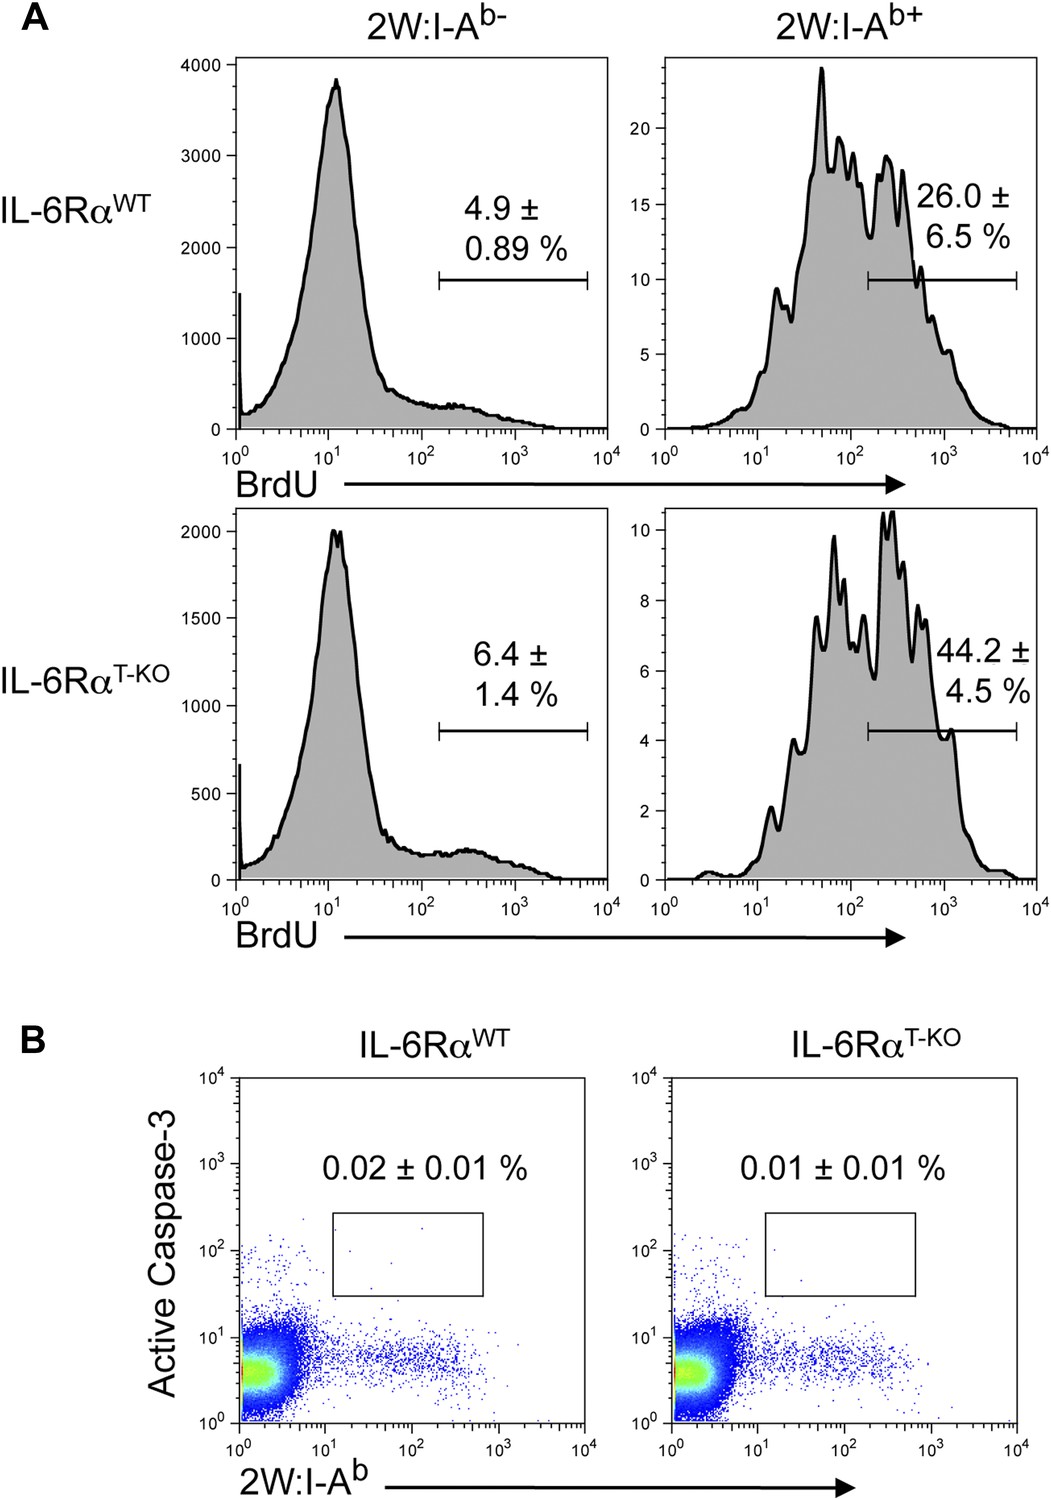
BrdU and active Caspase-3 staining in the presence or absence of T cell-intrinsic IL-6 signaling.
(A) WT and IL-6RαT-KO mice were immunized with 2W peptide and LPS emulsified in IFA. Mice were injected with 1–2 mg/mouse of BrdU i.p. daily from day 4 to day 7. Draining lymph nodes were harvested on day 7 and single cell suspensions were stained for antibodies against BrdU and active Caspase-3, gated on CD4+ T cells (B). Data are representative of two independent experiments showing mean ± SEM.
Figure 2 with 4 supplements
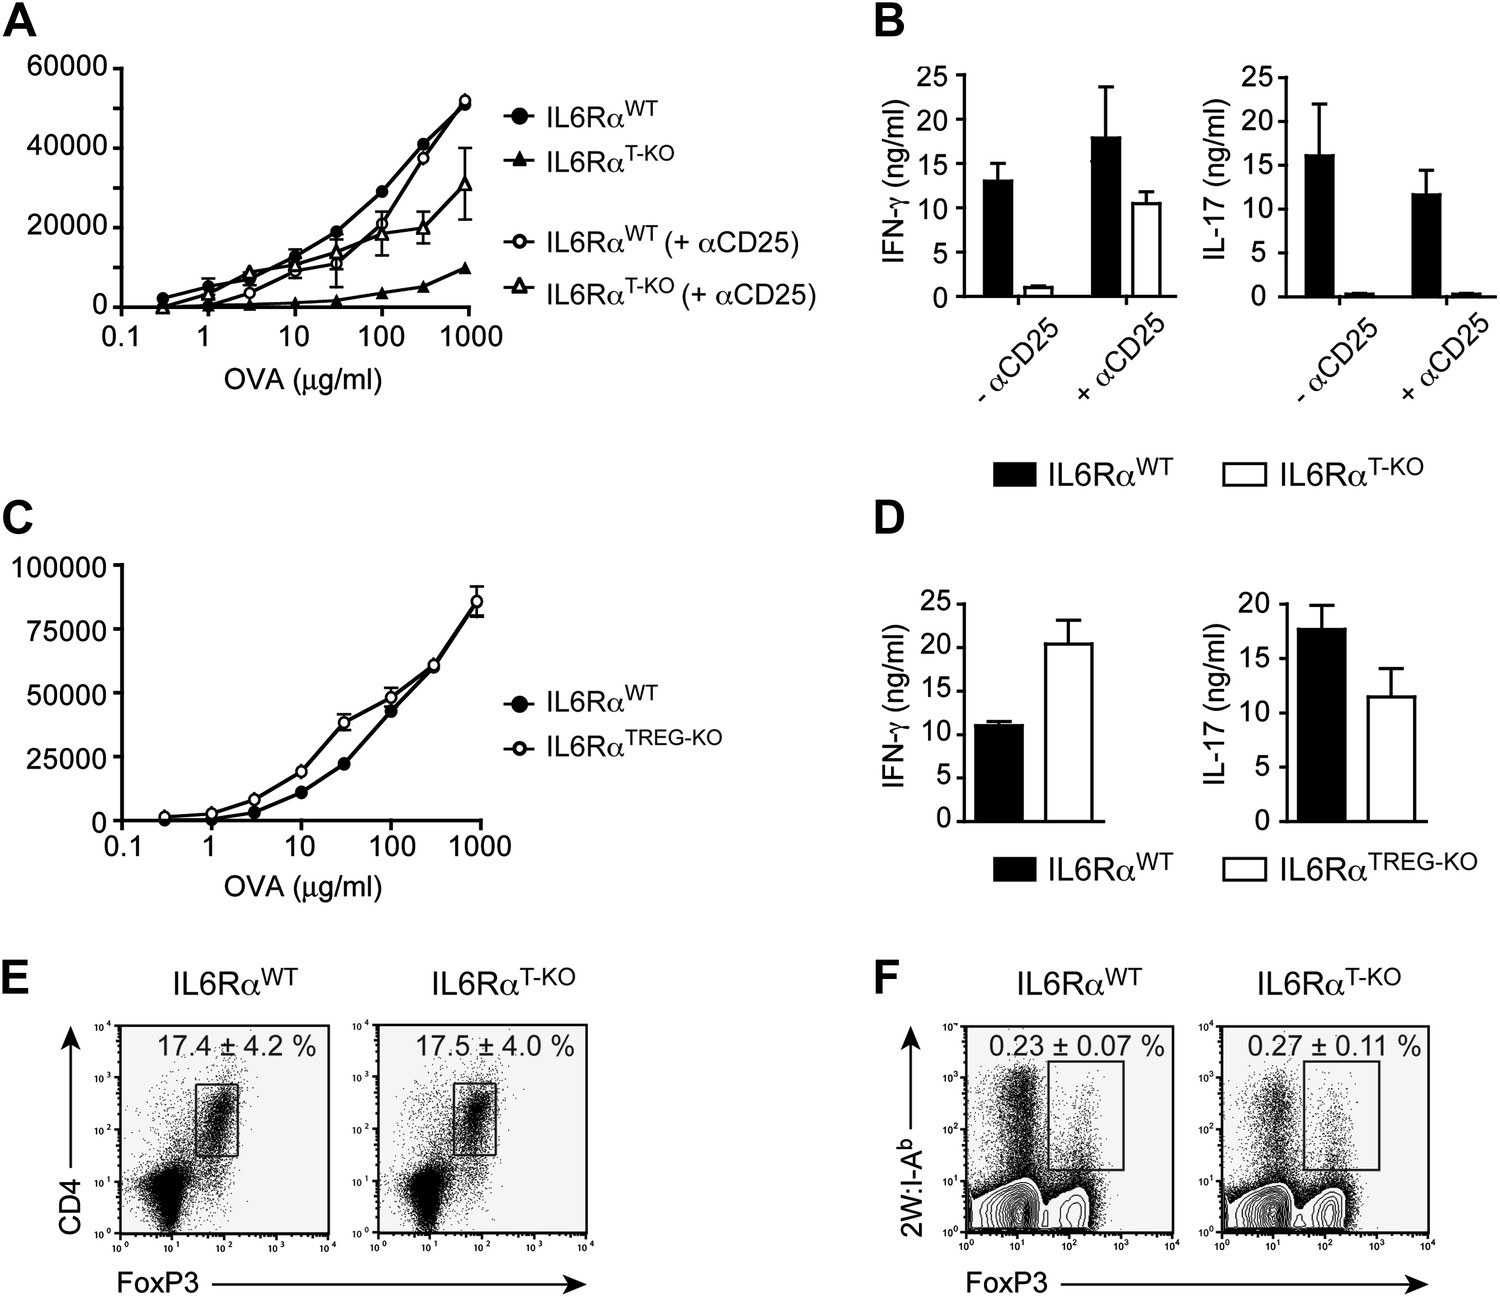
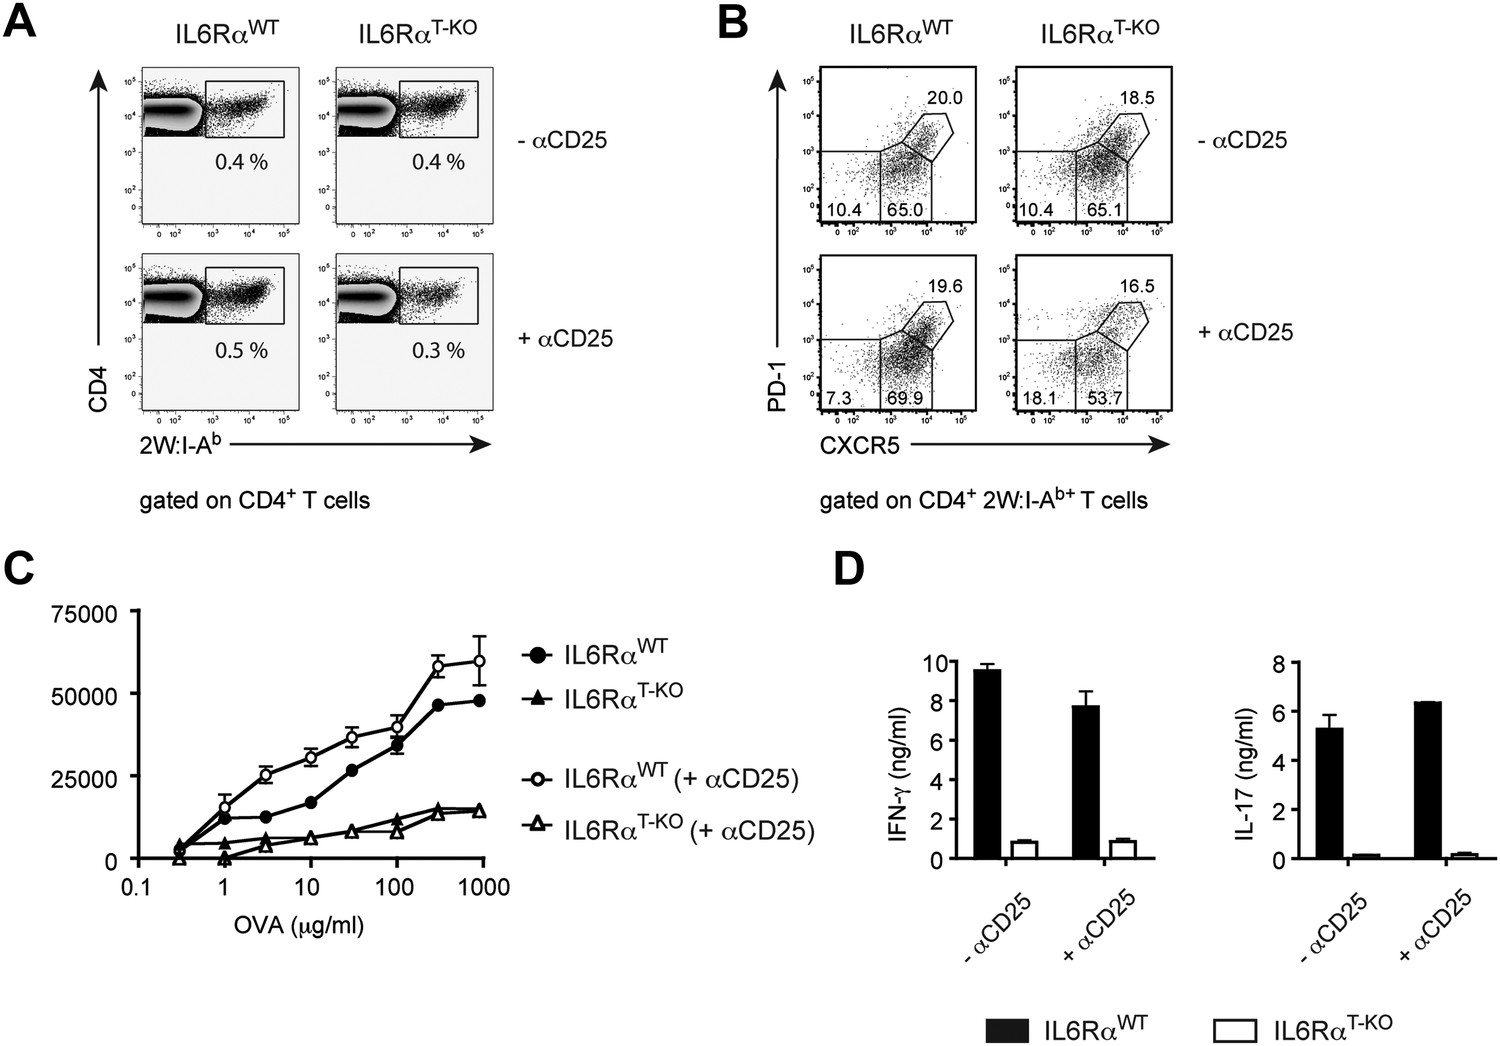
IL-6 signaling in responder T cells is required to overcome suppression by Tregs.
(A and B) WT and IL-6RαT-KO mice received a single intravenous injection of α-CD25 monoclonal antibody 3 days prior to immunization to transiently deplete Tregs. Mice were immunized in the footpads with OVA and LPS emulsified in IFA and 7 days following immunization, purified CD4+ T cells were restimulated as in Figure 1C. Proliferation (A) and cytokine production (B) were measured by [3H]-thymidine incorporation and ELISA, respectively, 72–84 hr following restimulation. (C and D) WT and IL-6RαTREG-KO mice were immunized with OVA and LPS emulsified in IFA and purified CD4+ T cells were restimulated 7 days following immunization as in Figure 1C. Proliferation (C) and production of IFN-γ and IL-17 (D) were measured as before. (E) Percentages of Foxp3+ CD4+ T cells in the draining lymph nodes of WT and IL-6RαT-KO mice 7 days following immunization with OVA and LPS in IFA. (F) WT and IL-6RαT-KO mice were immunized with 2W peptide and LPS emulsified in IFA and 7 days after immunization cells isolated from the draining lymph nodes were stained with 2W:I-Ab tetramer to determine percentages of CD4+ Foxp3+ 2W:I-Ab+ cells. Gated on total CD4+ cells. Data are representative of at least three independent experiments. Line graphs and bar graphs represent mean ± STD.
Figure 2—figure supplement 1
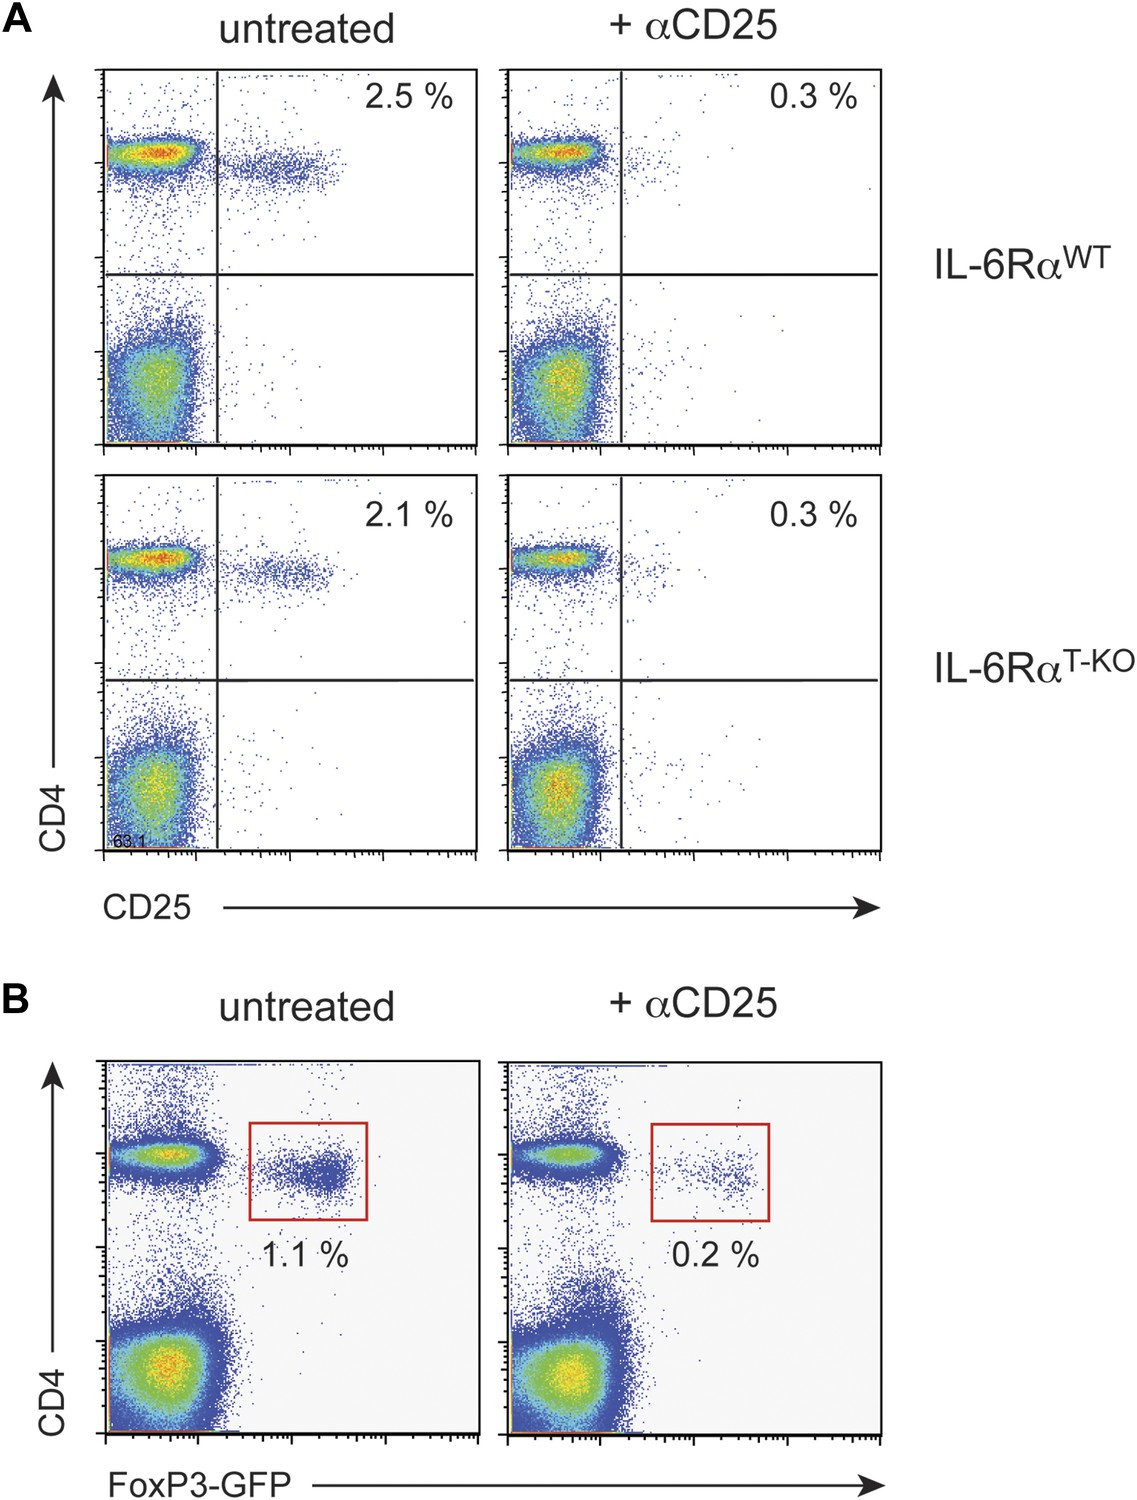
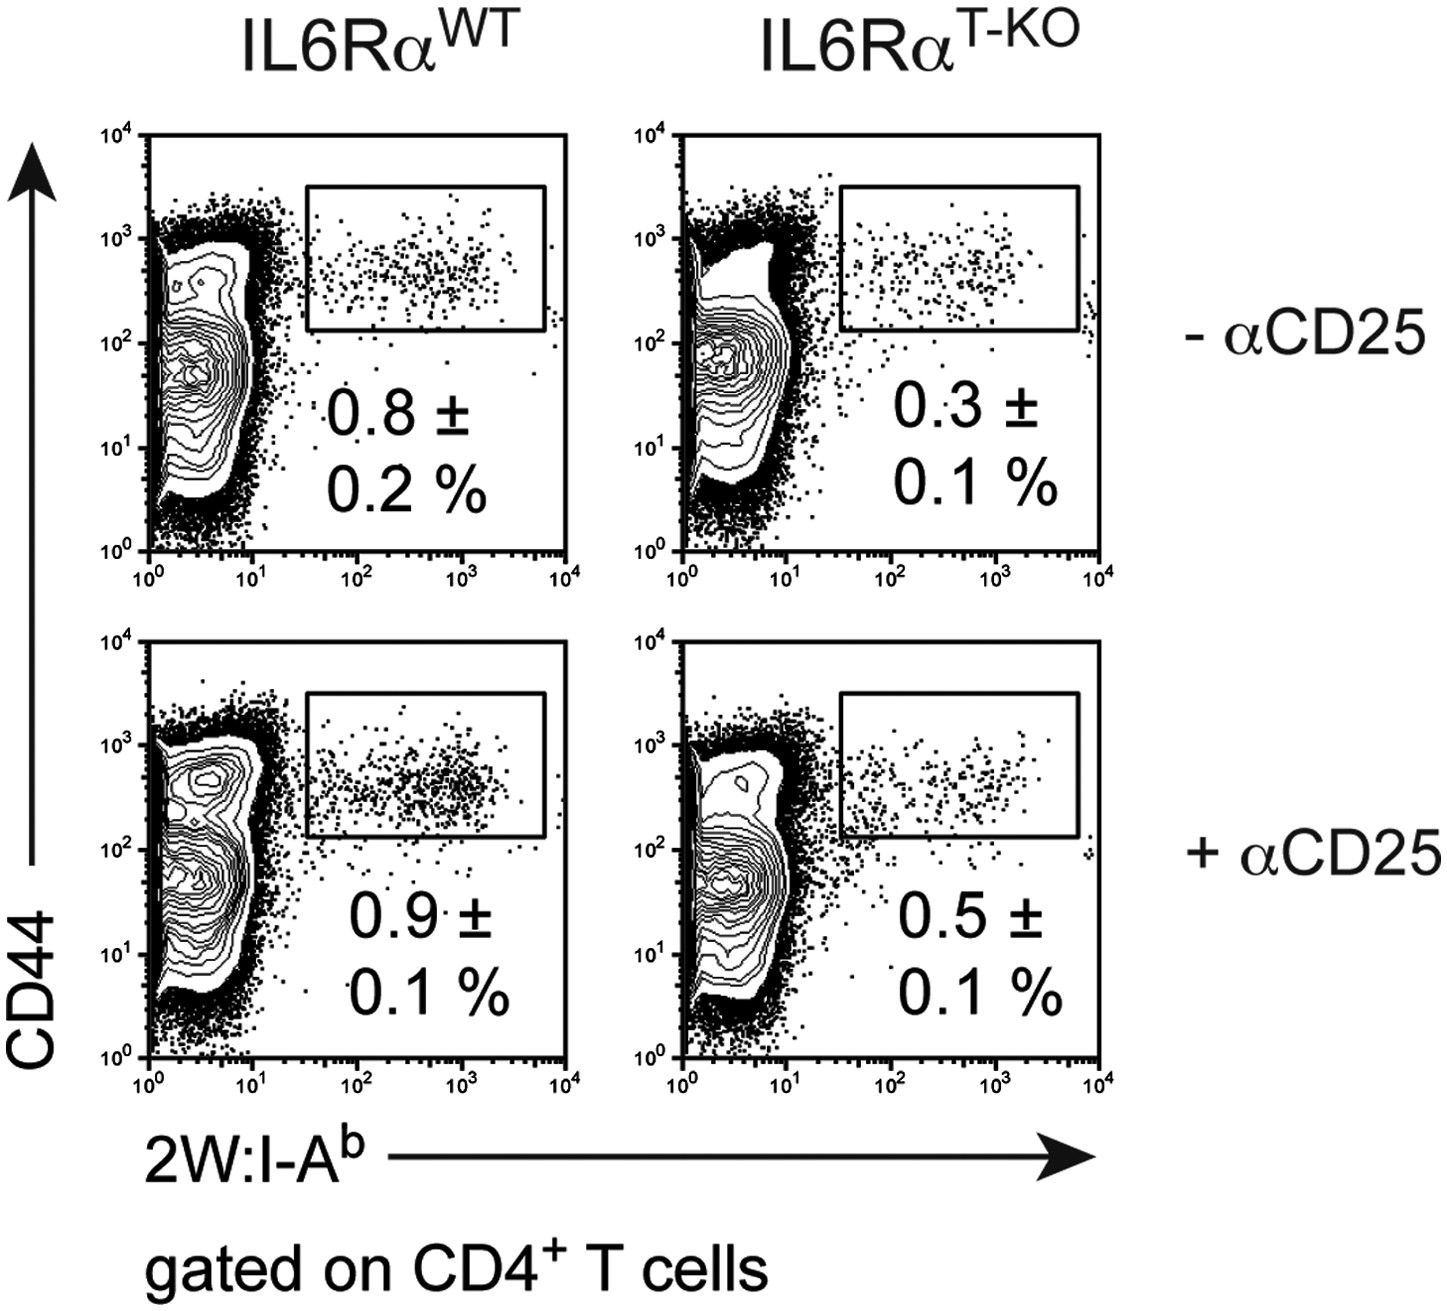
Treg depletion efficiency with α-CD25 treatment.
WT and IL-6RαT-KO mice were either left untreated or injected with α-CD25 monoclonal antibody (PC61) by the intravenous route. To confirm Treg depletion, peripheral blood leukocytes were examined for expression of CD4, CD25 and Foxp3 3 days later using an α-CD25 monoclonal antibody directed against a different epitope (A). We also verified the successful depletion of Tregs after PC61 treatment in FoxP3-GFP mice (B).
Figure 2—figure supplement 2
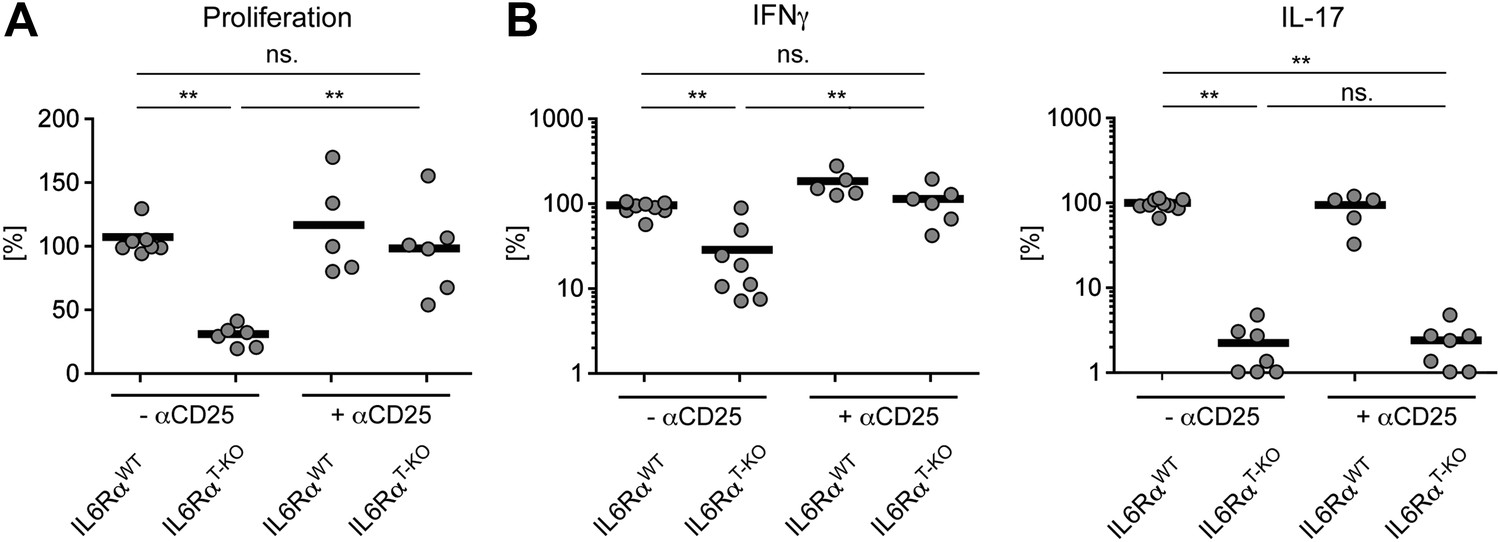
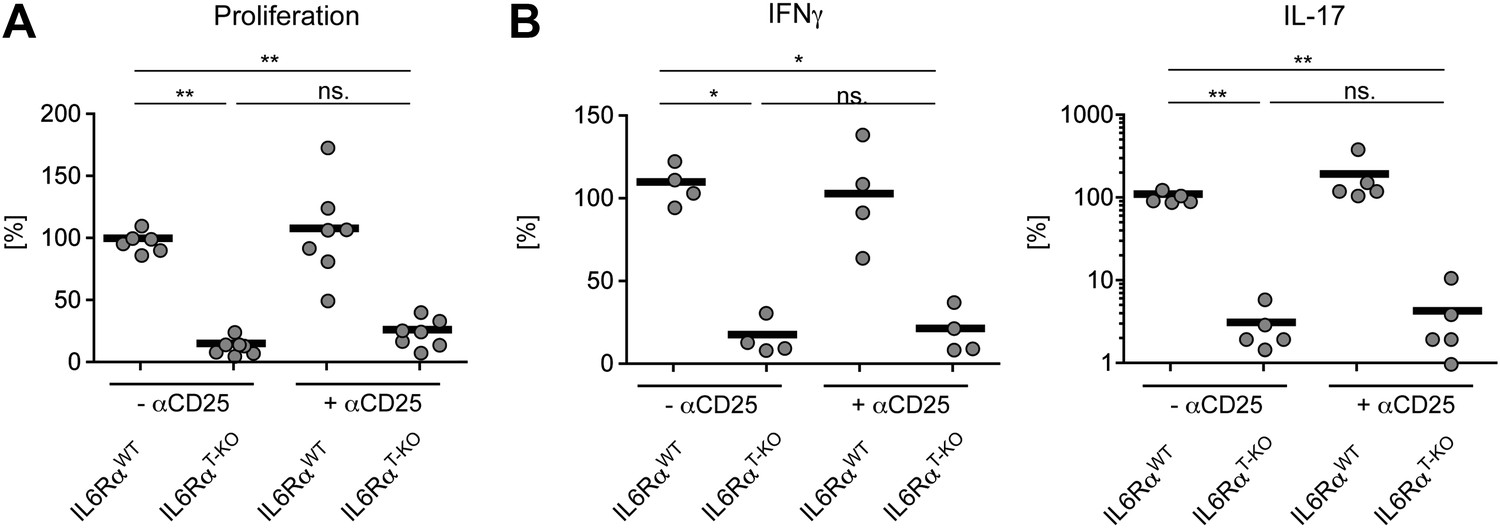
Statistical representation of the CD4+ T cell response in the presence or absence of Tregs.
(A and B) Statistical representation of the CD4+ T cell response following immunization with OVA + LPS in IFA. When indicated, Tregs were transiently depleted by administrating an α-CD25 antibody 3 days prior to the immunization. CD4+ T cells were isolated from the draining lymph nodes 7 days after the immunization and re-stimulated with 900 µg/ml OVA in vitro in the presence of irradiated splenocytes. Proliferation was measured 3 days later by [3H]-thymidine incorporation (A) and cytokine secretion of CD4+ T cells was measured by ELISA (B). Shown are the combined data of at least three independent experiments. Each dot represents one mouse and the experiments were normalized to the first replicate of triplicates of the wild-type mice. *p≤0.05; **p≤0.005; ns, not significant.
Figure 2—figure supplement 3
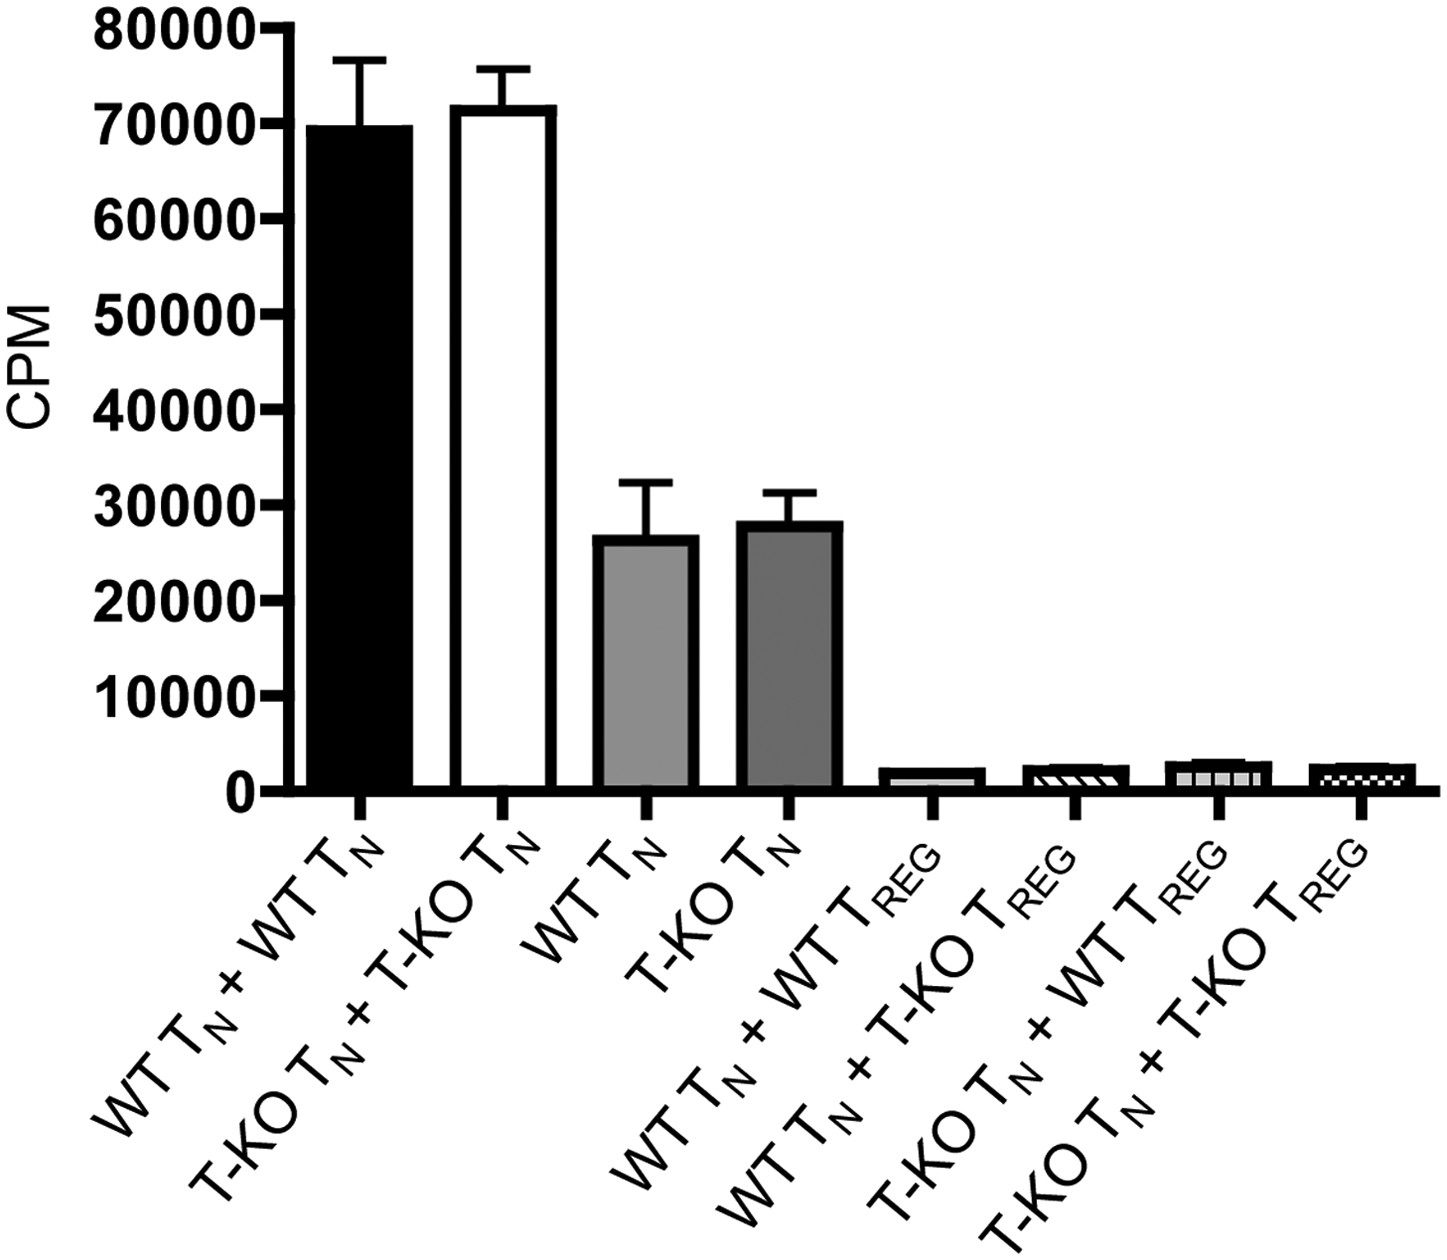
Suppression of T cell proliferation by WT and IL-6RαT-KO regulatory cells.
Purified CD4+CD25- responder T cells from WT or IL-6RαT-KO mice were incubated at a 1:1 ratio with WT or IL-6RαT-KO CD4+CD25+ regulatory T cells for 3 days with soluble anti-CD3 and anti-CD28. [3H]-thymidine was added for the last 15–17 hr of culture to assess the proliferative capacity of the cells. The data are representative of two independent experiments. Bar graph represents mean ± SEM.
Figure 2—figure supplement 4
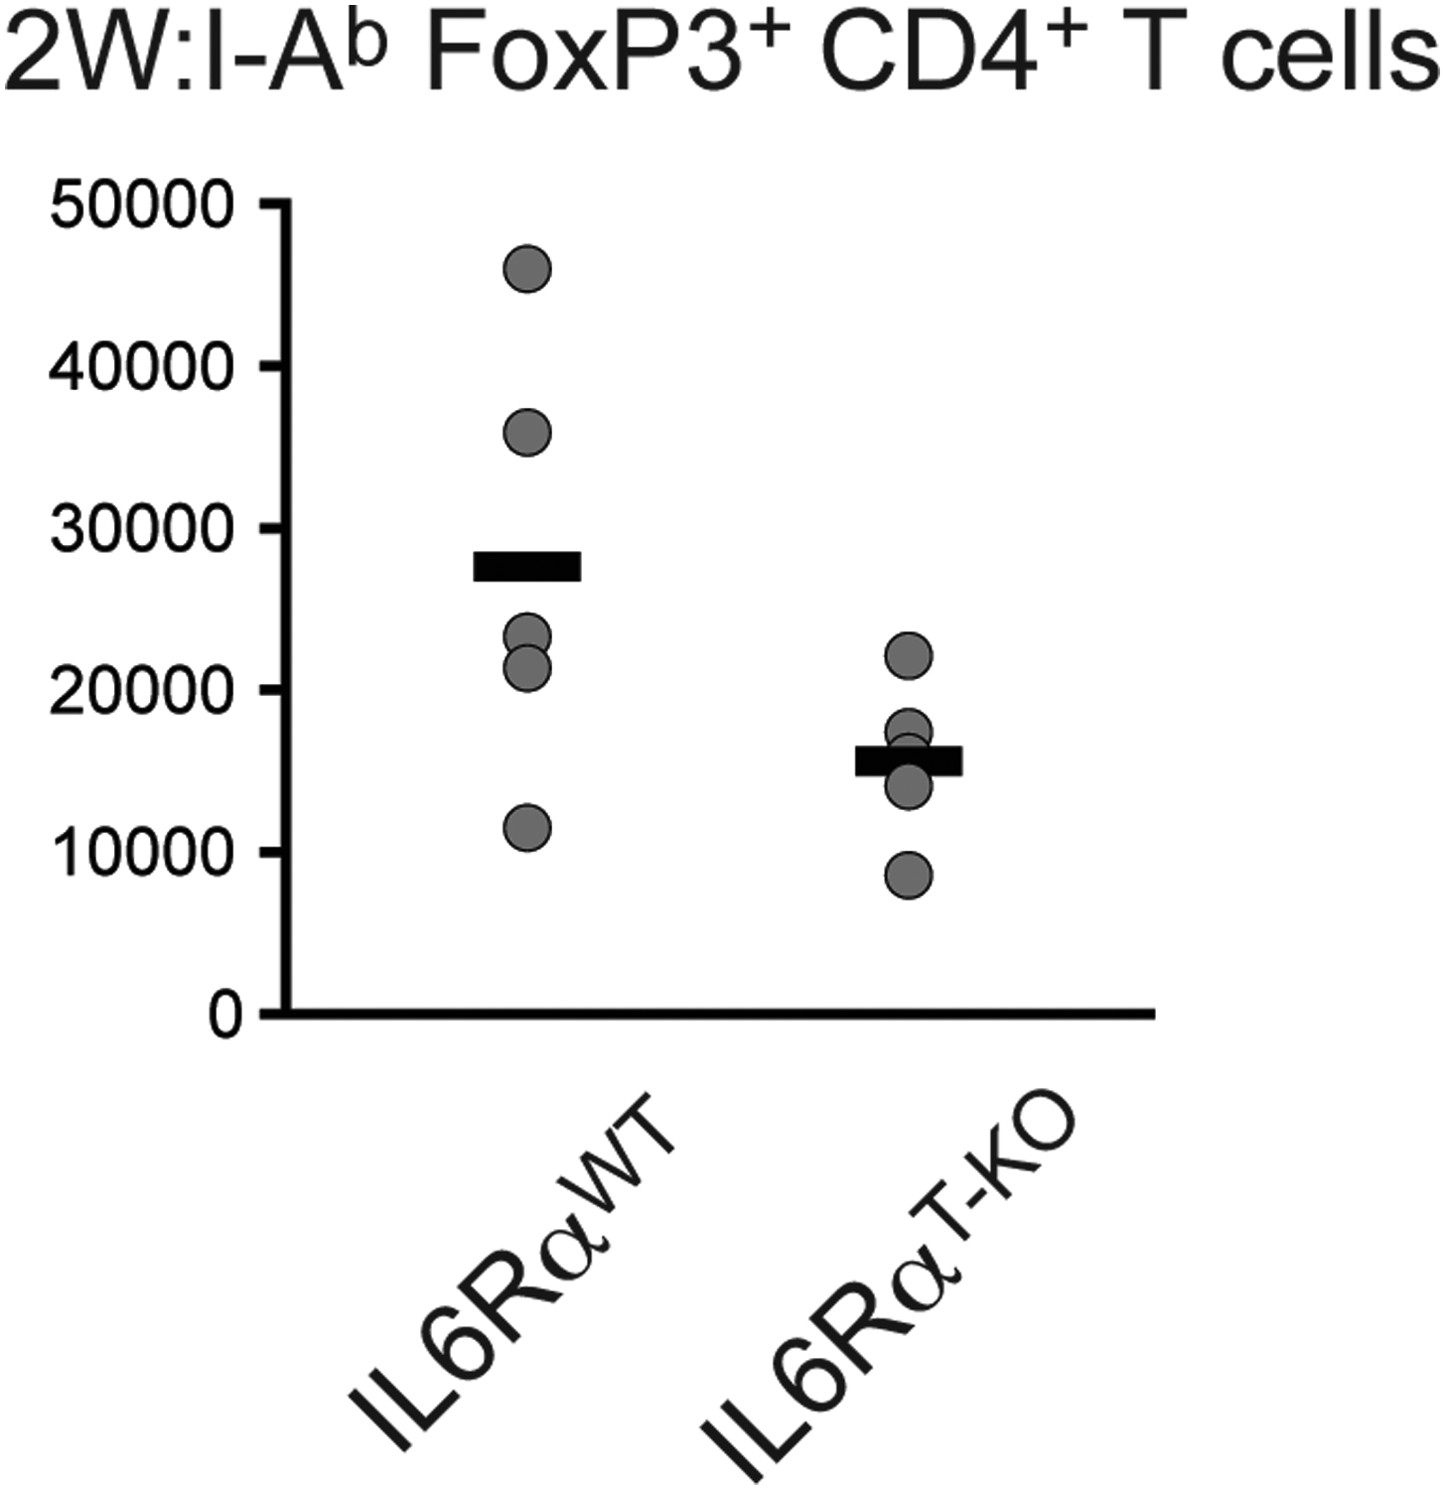
Absolute cell numbers of antigen-specific Foxp3+ Tregs in IL-6RαT-KO and control mice.
Mice were immunized with 2W peptide plus LPS in IFA. 7 days later the absolute numbers of Tregs were calculated within the draining lymph nodes using flow cytometry; p≤0.005.
Figure 3
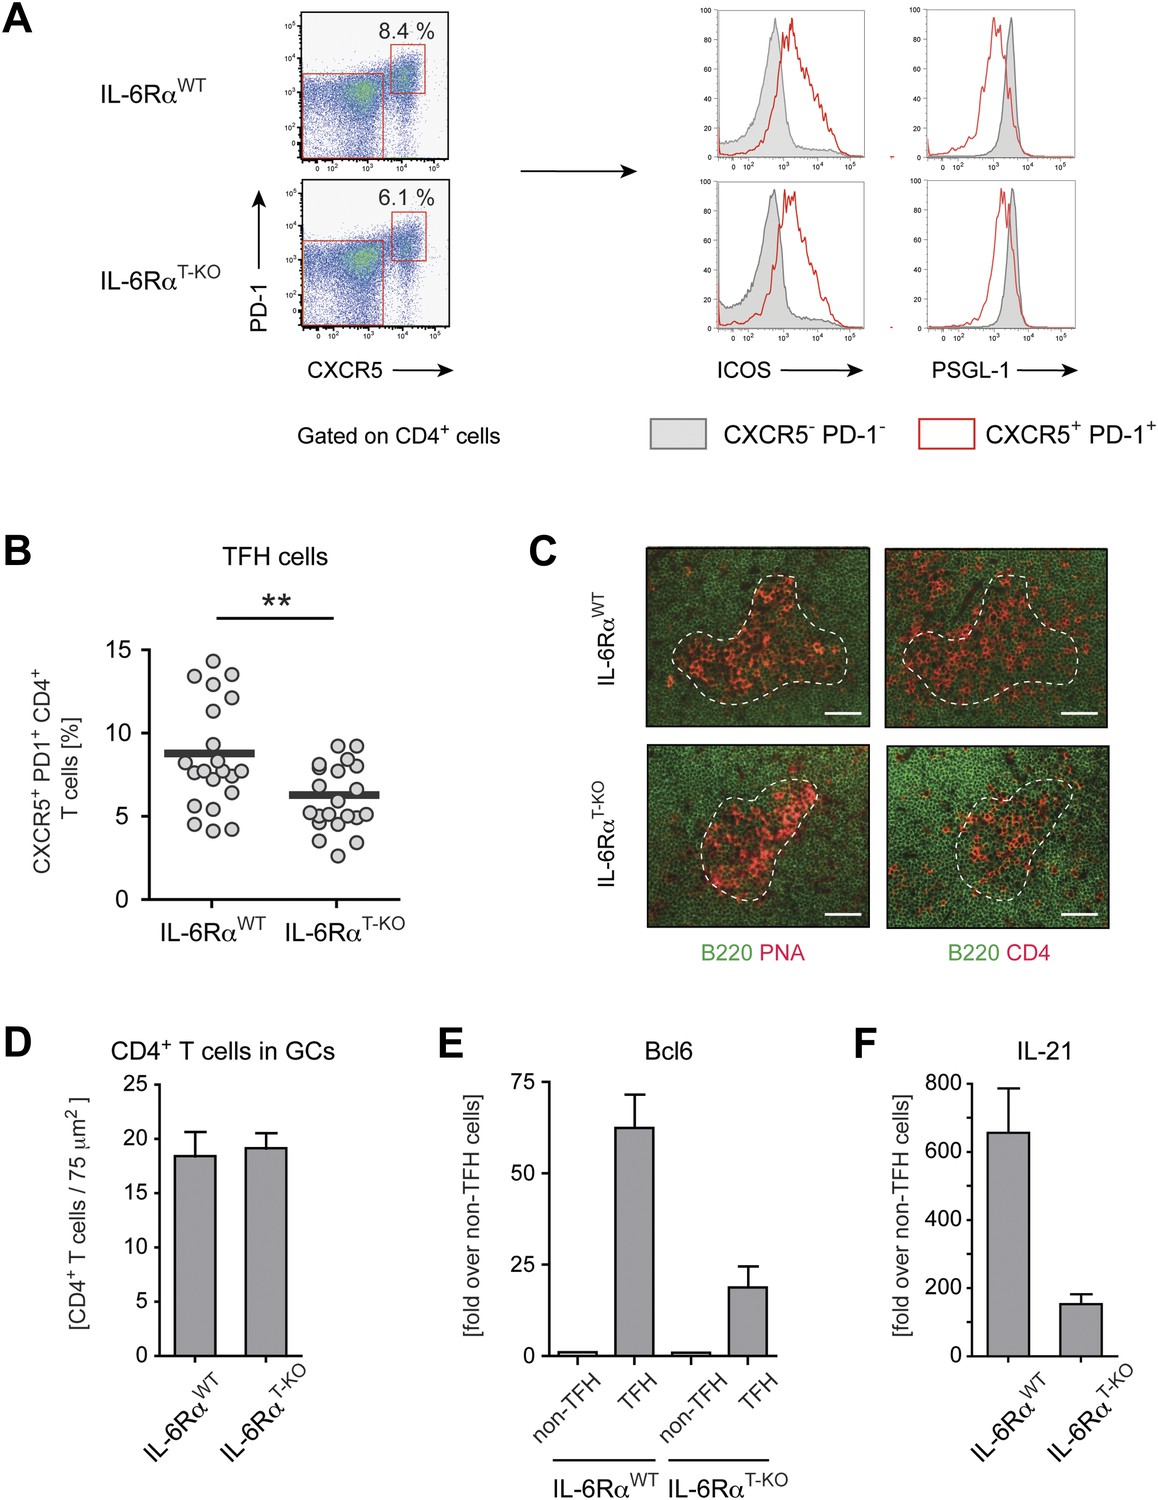
Tfh cells generated in the absence of IL-6 signaling have reduced expression of Bcl-6 and IL-21.
(A) Frequency of CXCR5hi PD-1hi CD4+ Tfh cells in draining lymph nodes of WT and IL-6RαT-KO mice 7 days following immunization with OVA and LPS in IFA (left panels). Additional surface markers expressed by Tfh cells from IL-6RαT-KO and control mice (right panels). (B) Statistical representation of the frequency of Tfh cells in IL-6RαT-KO and control mice. Shown are the combined results of multiple experiments, each closed circle represents one mouse, p≤0.005. (C) GC structure in the lymph nodes of IL-6RαT-KO and control mice of immunized mice. Adjacent tissue sections were stained for PNA (red) and B220 (green), or CD4 (red) and B220 (green). The dashed line demarcates the approximate border of the GC and was used to identify the GC location in the stainings with mAbs again B220 and CD4 (in addition to a marked decrease of B220 signal at the site of the GCs). Representative images are shown. (D) Number of CD4+ T cells within the GCs per 75 µm2. (E and F) Quantitative PCR measuring the expression of Bcl-6 (E) and IL-21 (F) in sorted CXCR5hi PD-1hi CD4+ Tfh and CXCR5low PD-1low CD4+ non-Tfh cells from immunized IL-6RαT-KO and control mice. Data show fold-induction over non-Tfh cells. A representative out of three independent experiments is shown.
Figure 4 with 1 supplement
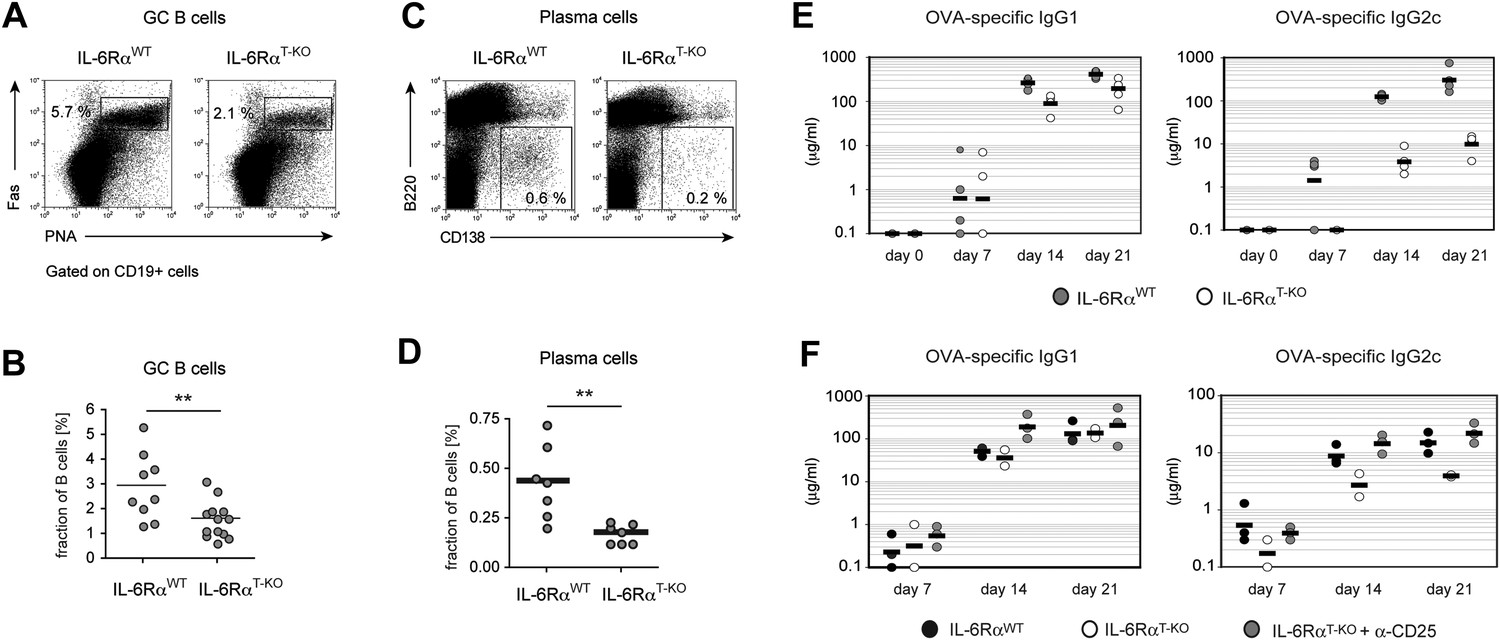
B cell responses are impaired in IL-6RαT-KO mice.
(A) Percentage of PNA+ Fas+ CD19+ GC B cells in the draining lymph nodes of WT and IL-6RαT-KO mice 7 days after immunization with OVA and LPS in IFA. (B) Statistical representation of the results shown in (A). Shown are the combined results of multiple experiments, each closed circle represents one mouse, p≤0.005. (C) Frequencies of CD138hiB220neg plasma cells in the draining lymph nodes of WT and IL-6RαT-KO mice on day 7 following immunization with OVA and LPS in IFA. (D) Statistical representation of the results shown in (C). Shown are the combined results of multiple experiments, each closed circle represents one mouse, p≤0.005. (E) Antibody response in WT and IL-6RαT-KO mice in the presence of an intact Treg compartment (E) or following the transient depletion of Tregs (F). Mice were immunized with OVA and LPS in IFA and the antigen-specific antibody titers in the serum were measured by ELISA. Tregs were depleted 3 days prior to the immunization. Representative experiments of at least three are shown.
Figure 4—figure supplement 1
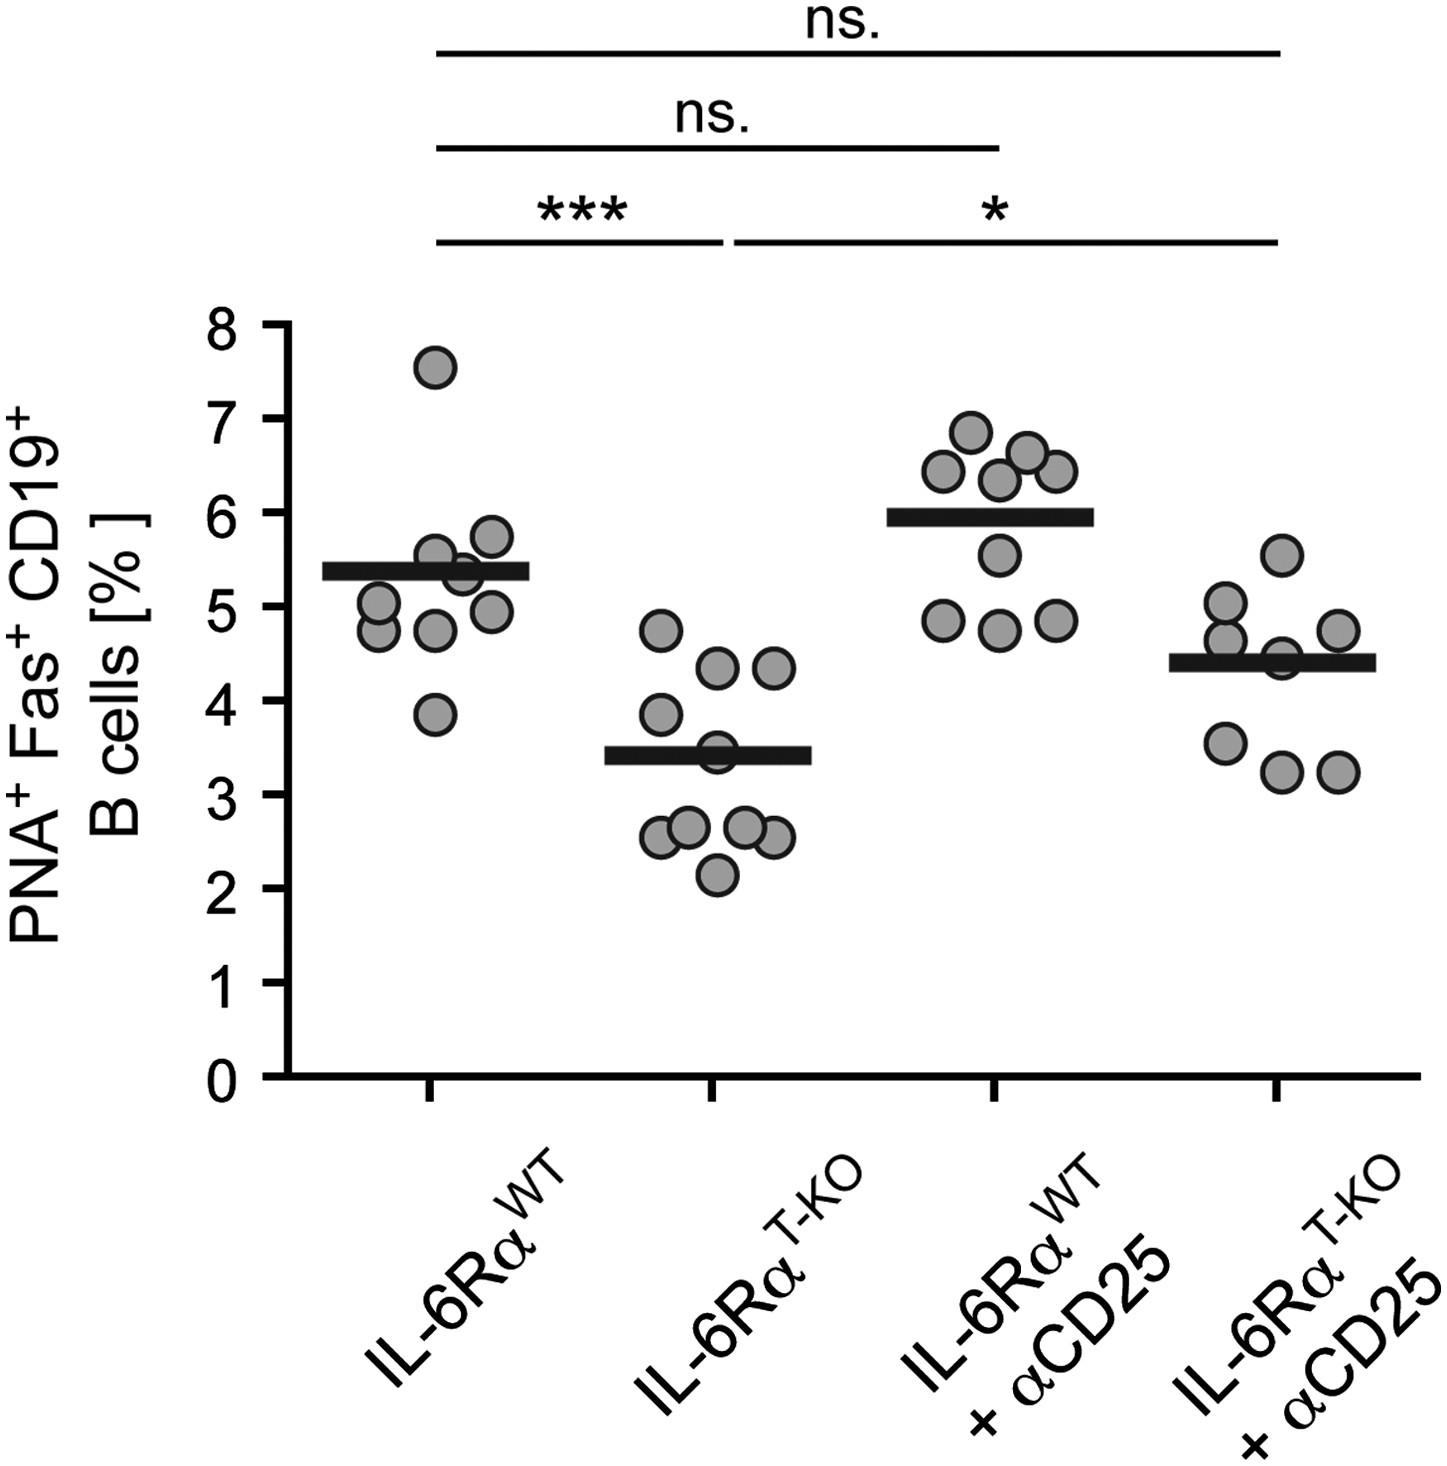
Size of the GC compartment in IL-6RαT-KO and control mice in the presence or absence of Tregs.
Tregs were transiently depleted 3 days prior to immunization with OVA plus LPS in IFA. The frequency of PNA+ Fas+ CD19+ GC B cells in the draining lymph nodes was determined 14 days later by flow cytometry. Shown are the combined data of three independent experiments, each dot represents one mouse; *p≤0.05, ***p≤0.0005, ns = not significant (p>0.05).
Figure 5 with 2 supplements
IL-6 signaling in T cells is dispensible for phenotypic, but required for functional differentiation of memory CD4+ T cells.
(A and B) Generation of memory CD4+ T cells. WT and IL-6RαT-KO mice, with or without Treg depletion, were immunized once with 2W peptide and LPS in IFA. The frequency of all antigen-specific 2W:I-Ab+ CD4+ memory T cells (A) or individual subsets of 2W:I-Ab+ CD4+ memory T cells (B) in the draining lymph nodes was measured 60 days later by flow cytometry. 2W:I-Ab+ CXCR5−PD-1− represent Th1 effector memory cells, CXCR5intPD-1− represent Th1 central memory cells, and CXCR5hi PD-1+ represent Tfh cells. Data are representative of at least three independent experiments. (C and D) Expansion and cytokine secretion of memory CD4+ T cells. WT and IL-6RαT-KO mice, with or without Treg depletion, were immunized with OVA and LPS in IFA. 60 days later, mice that were previously depleted of Tregs were depleted for a second time prior to re-immunization with OVA and LPS in IFA. 7 days after the second immunization, purified CD4+ T cells were restimulated and proliferation (C) and cytokine production (D) were measured by [3H]-thymidine incorporation and ELISA, respectively. Line graph and bar graph represent mean ± SEM.
Figure 5—figure supplement 1
Statistical representation of the CD4+ T cell memory response following immunization with OVA + LPS in IFA.
(A and B) Statistical representation of the CD4+ T cell response following immunization with OVA + LPS in IFA. Mice were immunized again at least 30 days after the primary immunization. When indicated, Tregs were transiently depleted by administrating an α-CD25 antibody 3 days prior to both the primary and secondary immunization. CD4+ T cells were isolated from the draining lymph nodes 7 days after the secondary immunization and re-stimulated with 900 µg/ml OVA in vitro in the presence of irradiated splenocytes. Proliferation was measured 3 days later by [3H]-thymidine incorporation (A) and cytokine secretion of CD4+ T cells was measured by ELISA (B). Shown are the combined data of three independent experiments. Each dot represents one mouse and the experiments were normalized to the first replicate of triplicates of the wild-type mice. *p≤0.05; **p≤0.005; ns, not significant.
Figure 5—figure supplement 2
Frequency of antigen-specific 2W:I-Ab+ CD4+ memory T cells in IL-6RαT-KO and control mice after the secondary immune response in the presence or absence of Tregs.
IL-6RαT-KO and control mice were immunized with 2W peptide plus LPS in IFA twice, 30–60 days apart. In some mice, Tregs were transiently depleted using an α-CD25 antibody 3 days prior to the primary immunization and again 3 days prior to secondary immunization (lower panels). The frequency of 2W:I-Ab+ CD44+ CD4+ T ells was determined 7 days after the secondary immunization by flow cytometry. Numbers represent the mean ± SEM.
Figure 6 with 2 supplements
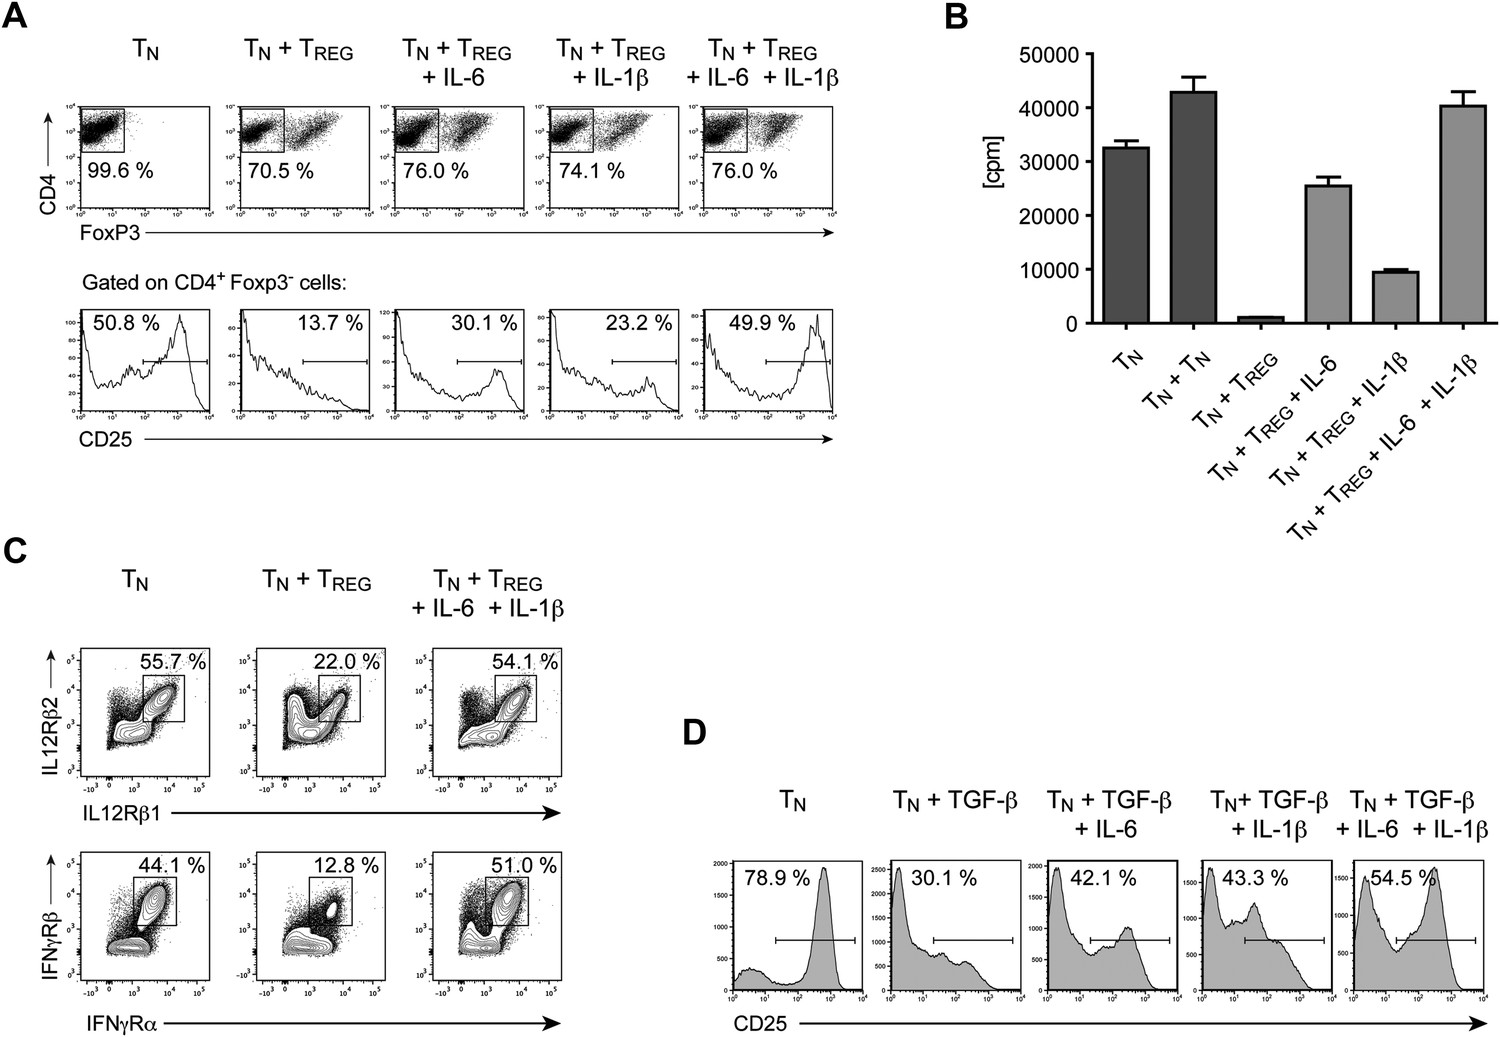
IL-6, together with IL-1β, overcomes Treg-mediated suppression by maintaining T cell responsiveness to IL-2 and other cytokines.
(A) Purified CD4+ Foxp3- responder T cells (TN) were either cultured alone or at a 1:1 ratio with CD4+ Foxp3+ cells and α-CD3 and α-CD28, with or without the indicated cytokines. CD25 expression by CD4+ Foxp3− cells was examined on day 3 by flow cytometry. (B) Proliferation of responder T cells in the presence of Tregs and indicated cytokines following stimulation with soluble α-CD3 and α-CD28. Data are representative of at least three independent experiments. (C) Purified CD4+ Foxp3− responder T cells (TN) were either cultured alone or at a 1:1 ratio with CD4+ Foxp3+ cells and stimulated as in (A). The expression of the indicated cytokine receptors was measured by flow cytometry. (D) Purified CD4+ T cells were stimulated with α-CD3 and α-CD28 in the presence or absence of the indicated cytokines. Expression of CD25 by CD4+ T cells was assessed on day 4 of culture.
Figure 6—figure supplement 1
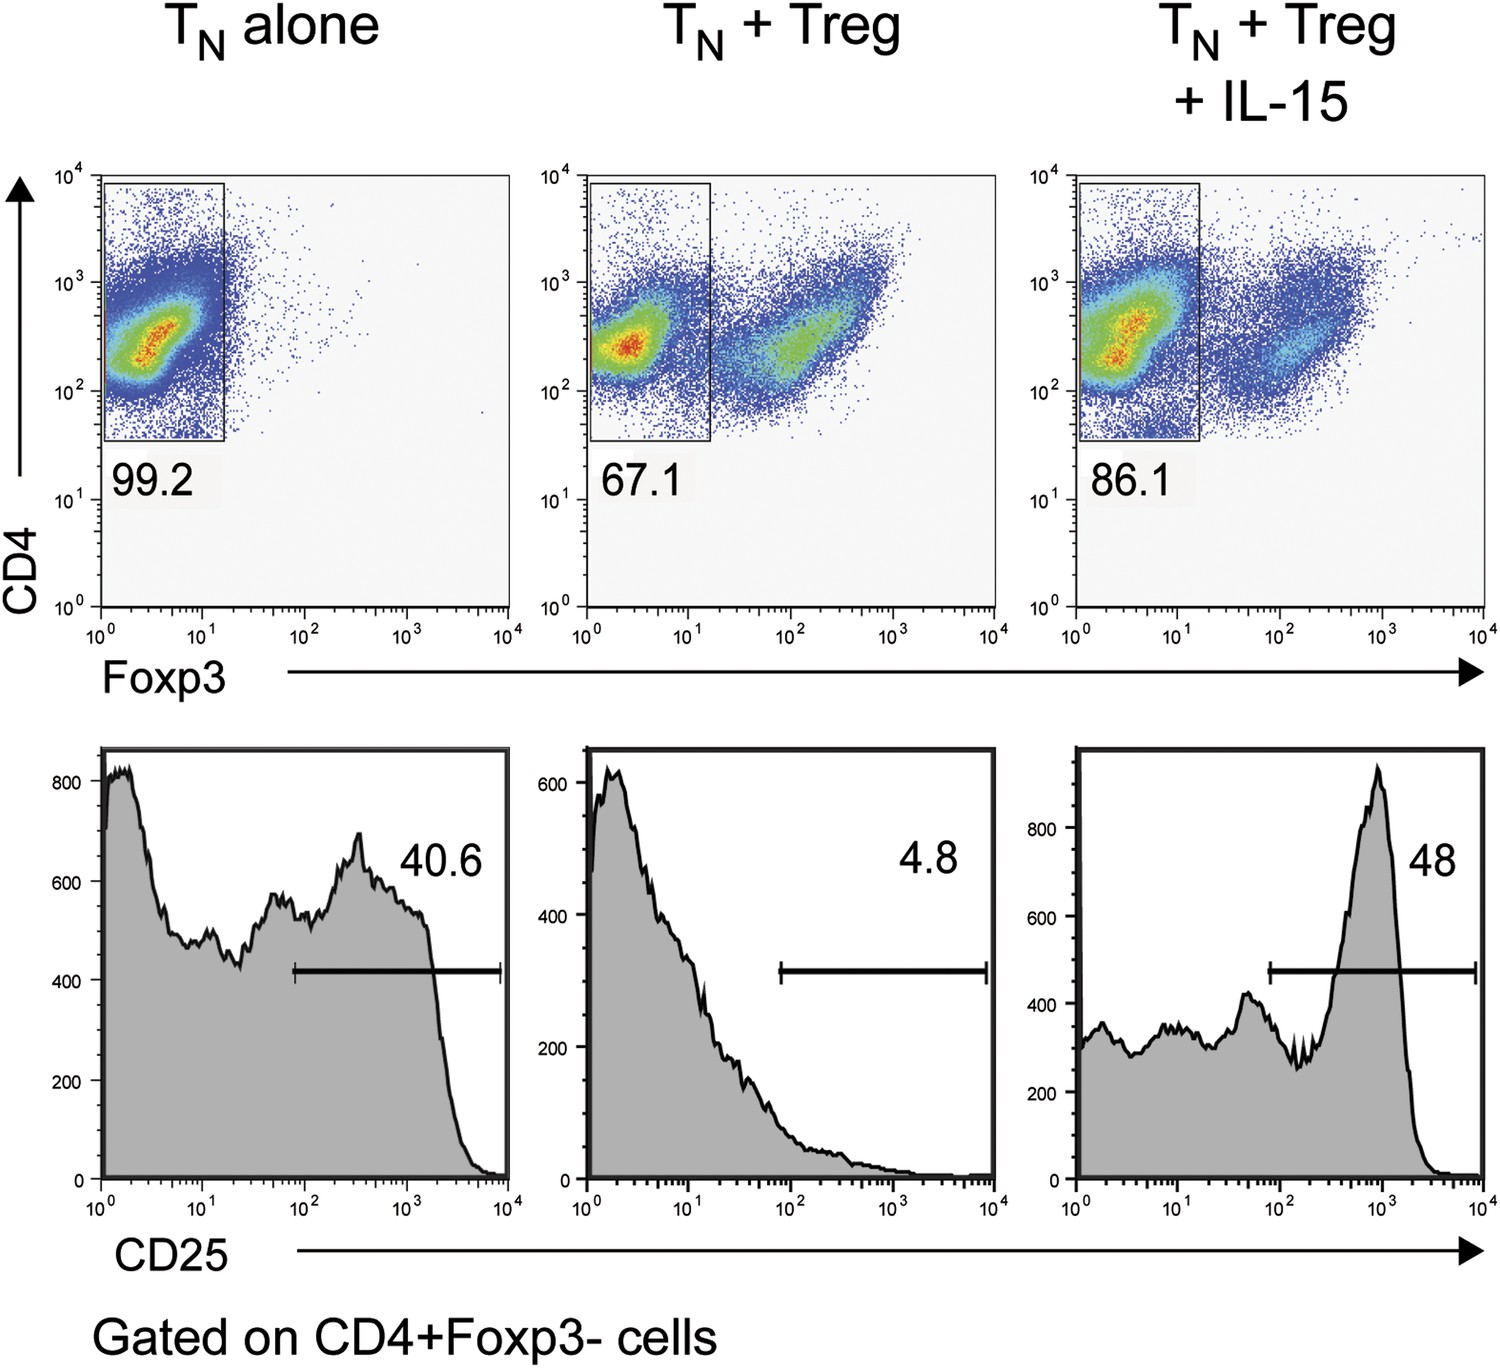
IL-15 overcomes Treg-mediated inhibition of CD25 in responder CD4+ T cells.
Purified CD4+ Foxp3− cells were either cultured alone or at a 1:1 ratio with CD4+ Foxp3+ cells and α-CD3 and α-CD28 with or without recombinant IL-15. CD25 expression by CD4+ Foxp3− cells was examined on day 3.
Figure 6—figure supplement 2
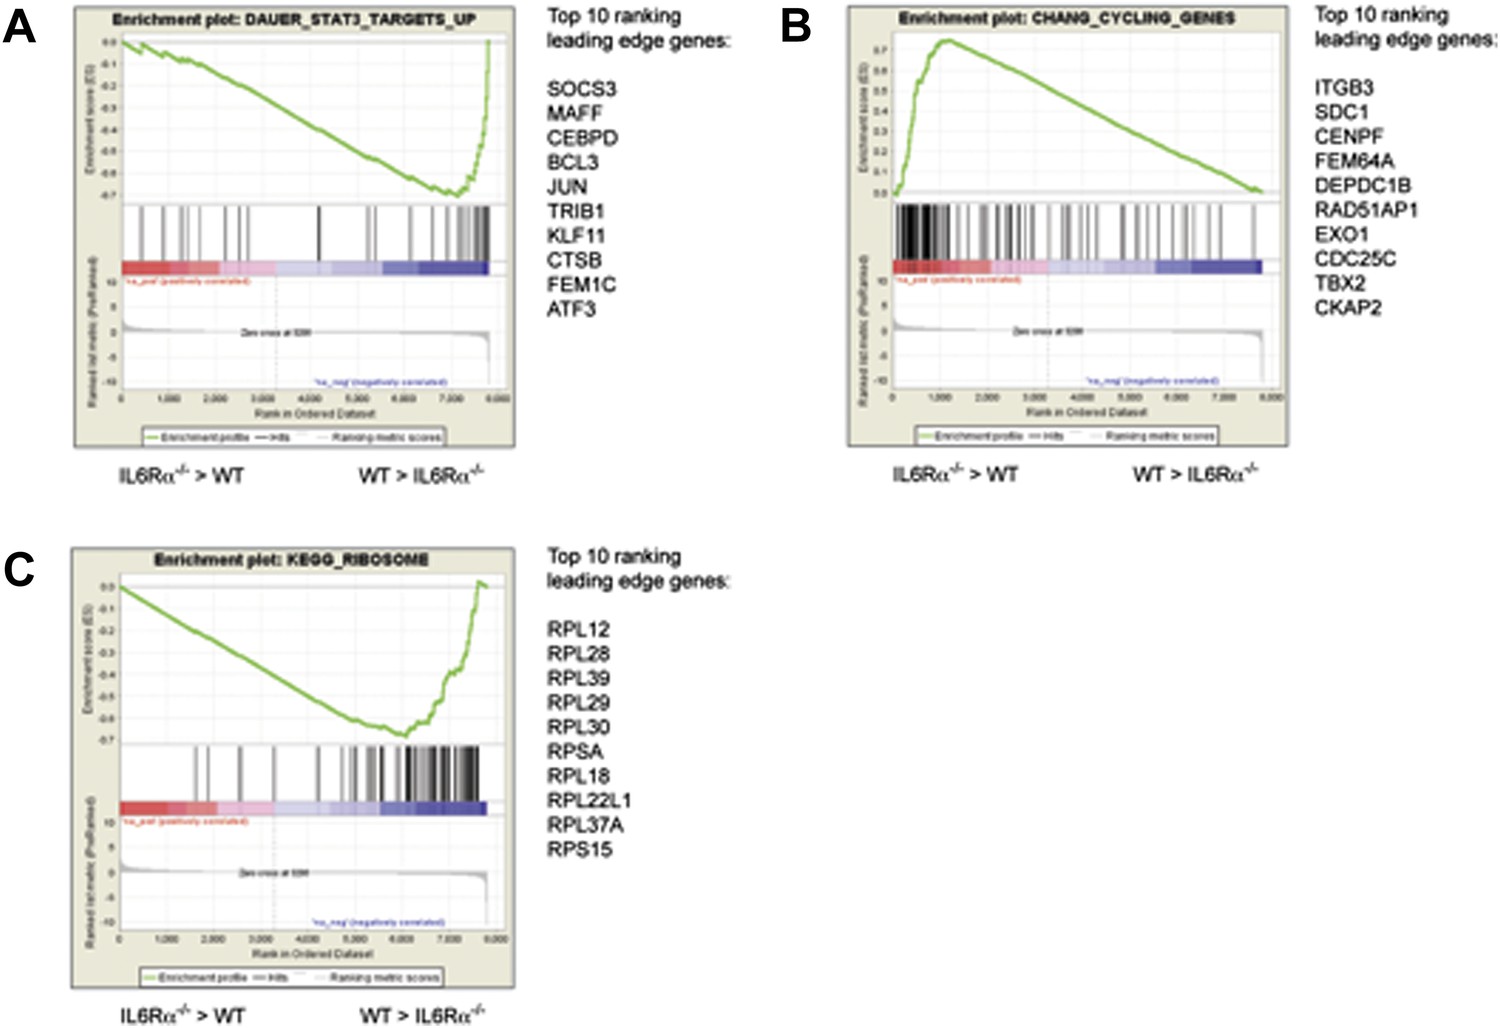
Pathway analysis of the differentially expressed genes in antigen-specific CD4+ T cells of IL-6RαT-KO mice.
Differences in the gene expression of antigen-specific CD4+ T cells from immunized IL-6RαT-KO mice and wild-type controls were dissected by gene-set enrichment analysis (GSEA). Relative differences in the gene expression in IL-6Rα-deficient CD4+ T cells and wild-type controls were used to rank the genes against known gene-sets. Shown are the enrichment plots for gene sets reflecting STAT3-dependent genes (A), cell cycle genes (B), and ribosomal genes (C). The enrichment profile is depicted as a green graph and the distribution of the ranked genes is shown as black lines below the graph. Genes that are more highly expressed in IL-6Rα-deficient CD4+ T cells cluster towards the left side of the graphs while genes that are more highly expressed in wild-type cells cluster towards the right side of the graph. The top 10 genes of the leading edge are listed to the right of each panel. Data are derived from the pooled samples of three independent experiments representing a total of 15–20 mice per genotype.
Download links
A two-part list of links to download the article, or parts of the article, in various formats.
Downloads (link to download the article as PDF)
Open citations (links to open the citations from this article in various online reference manager services)
Cite this article (links to download the citations from this article in formats compatible with various reference manager tools)
T cell-intrinsic role of IL-6 signaling in primary and memory responses
eLife 3:e01949.
https://doi.org/10.7554/eLife.01949


