Structural basis of GSK-3 inhibition by N-terminal phosphorylation and by the Wnt receptor LRP6
- Stanford University, United States
Figures
Figure 1

Inhibitory activities of pS9 and LRP6 a-motif peptides.
(A and B) 32P incorporation into the peIF2b substrate over time for GSK-3β 26-383, inhibited by the S9 peptide (Ki = 60 ± 11 μM) (A) or the LRP6 a-motif peptide (Ki = 1.4 ± 0.2 μM). The number of replicates is either two or four for each inhibitor concentration, except for the 15 µM LrpA peptide timecourse, where there is only one measurement. (C) Determination of steady-state kinetic constants for GSK-3β 26-383, GSK-3β 26-383F93A, GSK-3β 26-383F93G, GSK-3β 1-383, and GSK-3β 1-383pS9. Error bars represent the standard error of the mean. The number of replicates for each concentration is between 2 and 4 for all the concentration points, except for the 1 µM point of GSK-3 26-383, the 80 µM point of GSK-3β 26-383F93A, and the 50 and 80 µM points of GSK-3β 26-383F93G, which have only one measurement.
Figure 2

Inhibitory peptide binding to GSK-3.
(A) Overall structure of GSK-3 bound to inhibitory peptides. The superimposed LRP6 c-motif (pink sticks), e-motif (light green sticks) and pS9 auto-inhibitory N-terminal peptide (light blue sticks) bind to the same substrate-binding pocket between the C-loop (yellow) and activation loop (red). A molecule of ADP binds to the deep cleft located between the N-terminal (white) and C-terminal (grey) lobes, and the Axin helix (purple) binds at the C-lobe. The glycine-rich loop (cyan) and αC-helix are also indicated. The inset shows the protein sequences of the peptide residues that are visible in the structures. The P+4 phosphorylated residues are indicated in orange. The loop between the N-terminal peptides and the first β strand of the N-terminal lobe is partially disordered (dotted line). Oxygen atoms are shown in red, nitrogen in blue, phosphorus in orange, and sulfur in yellow. (B) Surface representation of the substrate-binding pocket between the C-loop (yellow) and activation loop (red) of GSK-3. The inhibitory peptides, pS9 auto-inhibitory N-terminal peptide (light blue sticks), LRP6 c-motif (pink sticks) and e-motif (light green sticks) are superimposed, and the residues of the peptides are labeled according to the primed substrate numbering, with the phospho-serine or threonine at the P+4 position. Side chains of GSK-3 residues F93, Y216 and I217, which interact with the peptides, are also depicted as sticks. (C) Peptide inhibitor-free structure near the C-loop and activation loop. A molecule of glycerol is bound to three basic residues that interact with the phosphate at the substrate P+4 site. Hydrogen bonds are shown as dashed lines. (D–F) Interactions between GSK-3 and inhibitory peptides. The structural water molecules that interact between the carbonyl groups of Y216 and the P+1 proline residues of LRP6 c-motif and e-motif peptides are depicted as red spheres.
Figure 3
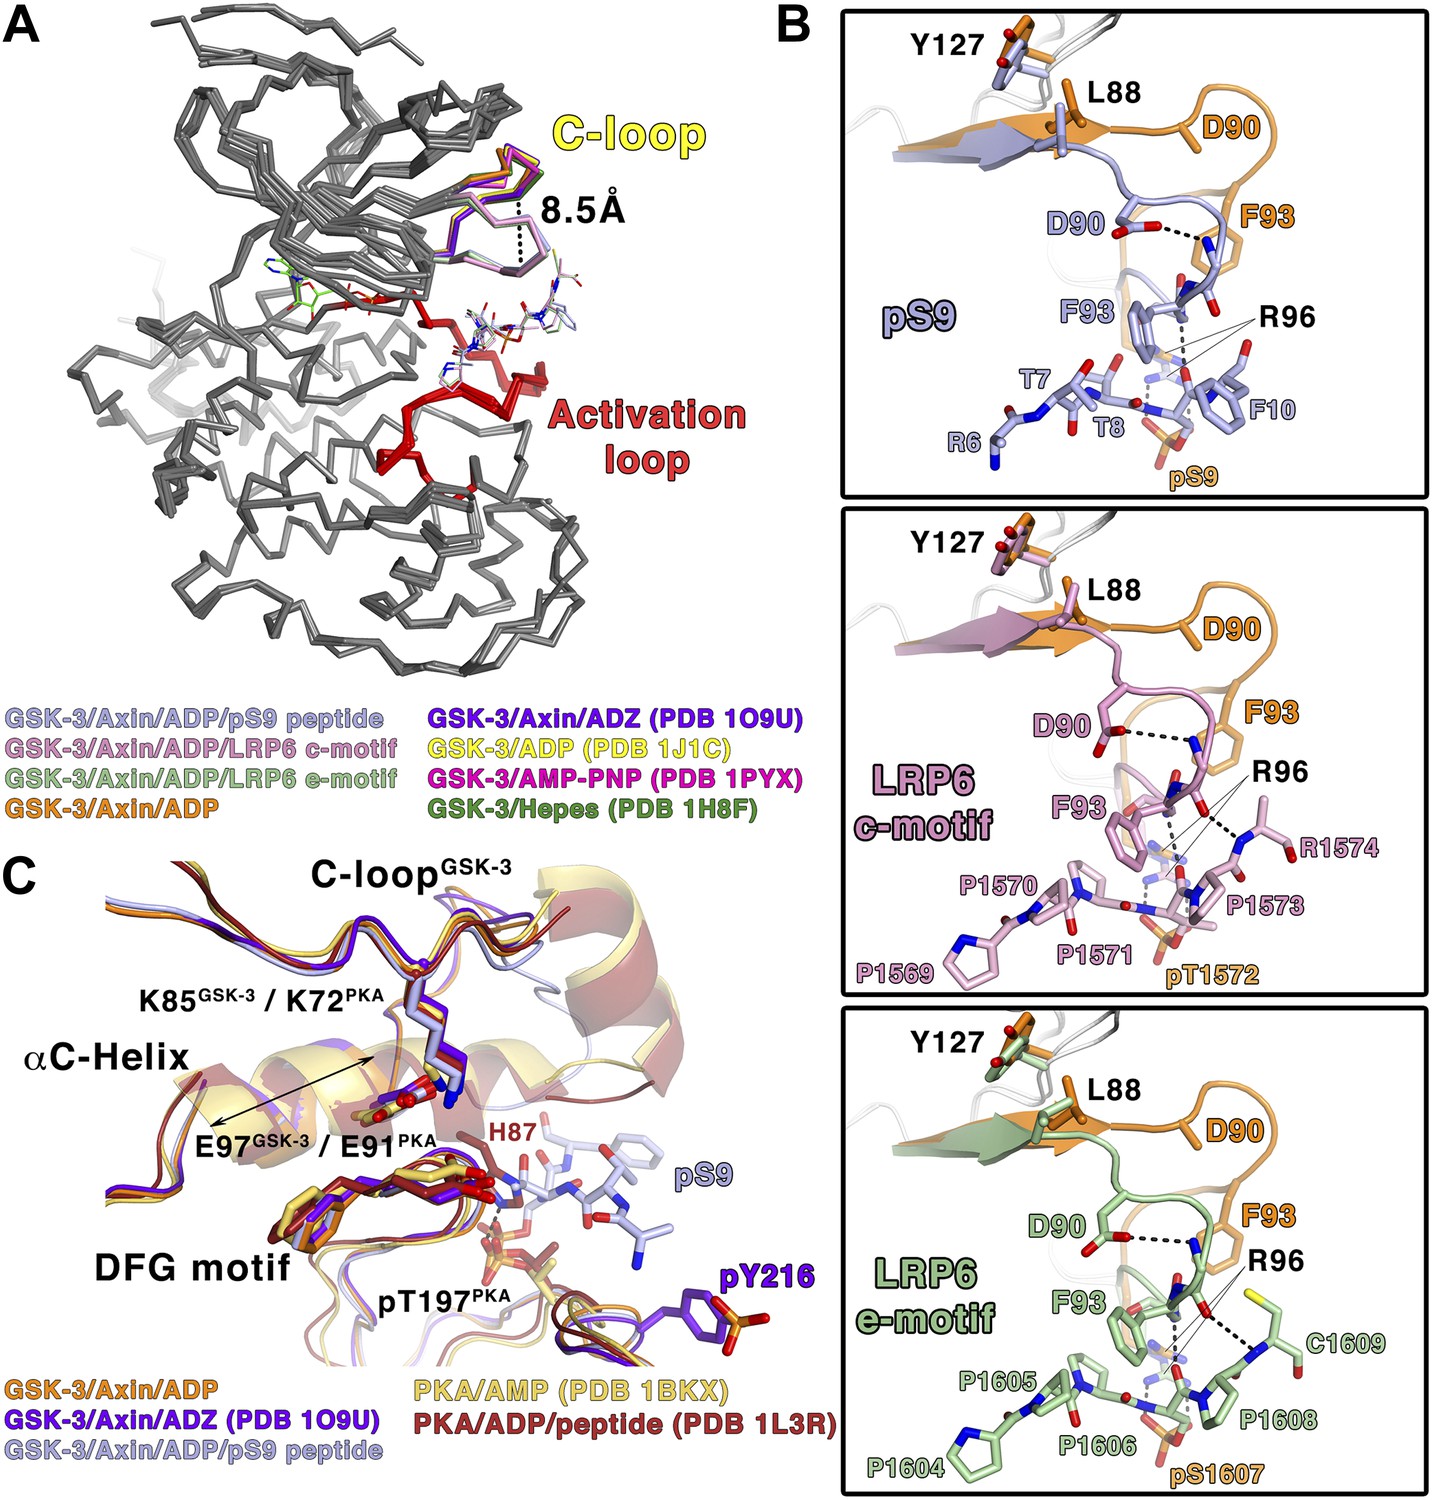
Conformational changes in GSK-3 upon inhibitor peptide binding.
(A) Superposition of α-carbon traces of GSK-3 structures. The maximum deviation between the structures is at the C-loop region, which is color coded according to the key at the bottom of the panel. The dashed line indicates the maximum distance (8.5 Å) between the α-carbon of residue Phe93 seen in peptide substrate-bound and peptide-free structures. The activation loops (red) align very well, indicating that there is no conformational change at the activation loop upon peptide substrate binding. (B) Changes of the C-loop upon peptide substrate binding. Superposition of the peptide substrate-free GSK-3 (inhibitor-free; Table 2) (orange) and the GSK-3/pS9 peptide (top panel), LRP6 c-motif (middle panel), or LRP6 e-motif (bottom panel) complexes. Hydrogen bonds between the backbones of the P+4 and P+5 residues of the peptides and the backbone of the C-loop from R92 to K94 are shown as dashed lines; only the main-chain atoms of R92 and K94 are depicted. The change in the C-loop upon peptide binding alters the positions of the preceding β strands (broad arrows). R96 adopts a conformation to accommodate the P+4 substrate phosphate. (C) Superposition of GSK-3 and active PKA structures. The catalytic residues, including K85, E97 and the DFG motif, of the peptide-free GSK-3 (orange), peptide-free GSK-3 with phosphorylated Y216 (purple) or peptide-bound GSK-3 (light blue) adopt similar conformations as those of the active PKA structures (gold/brown). The double-headed arrow indicates the shorter length of the αC-helix of GSK-3 relative to that of PKA. The hydrogen bond between phosphorylated T197 (pT197) and H87 is shown as dashed line; only H87 of the PKA/peptide complex is depicted for clarity. pT197 of PKA places a phosphate group in the space equivalent to that occupied by the substrate phosphate in GSK-3.
Figure 4
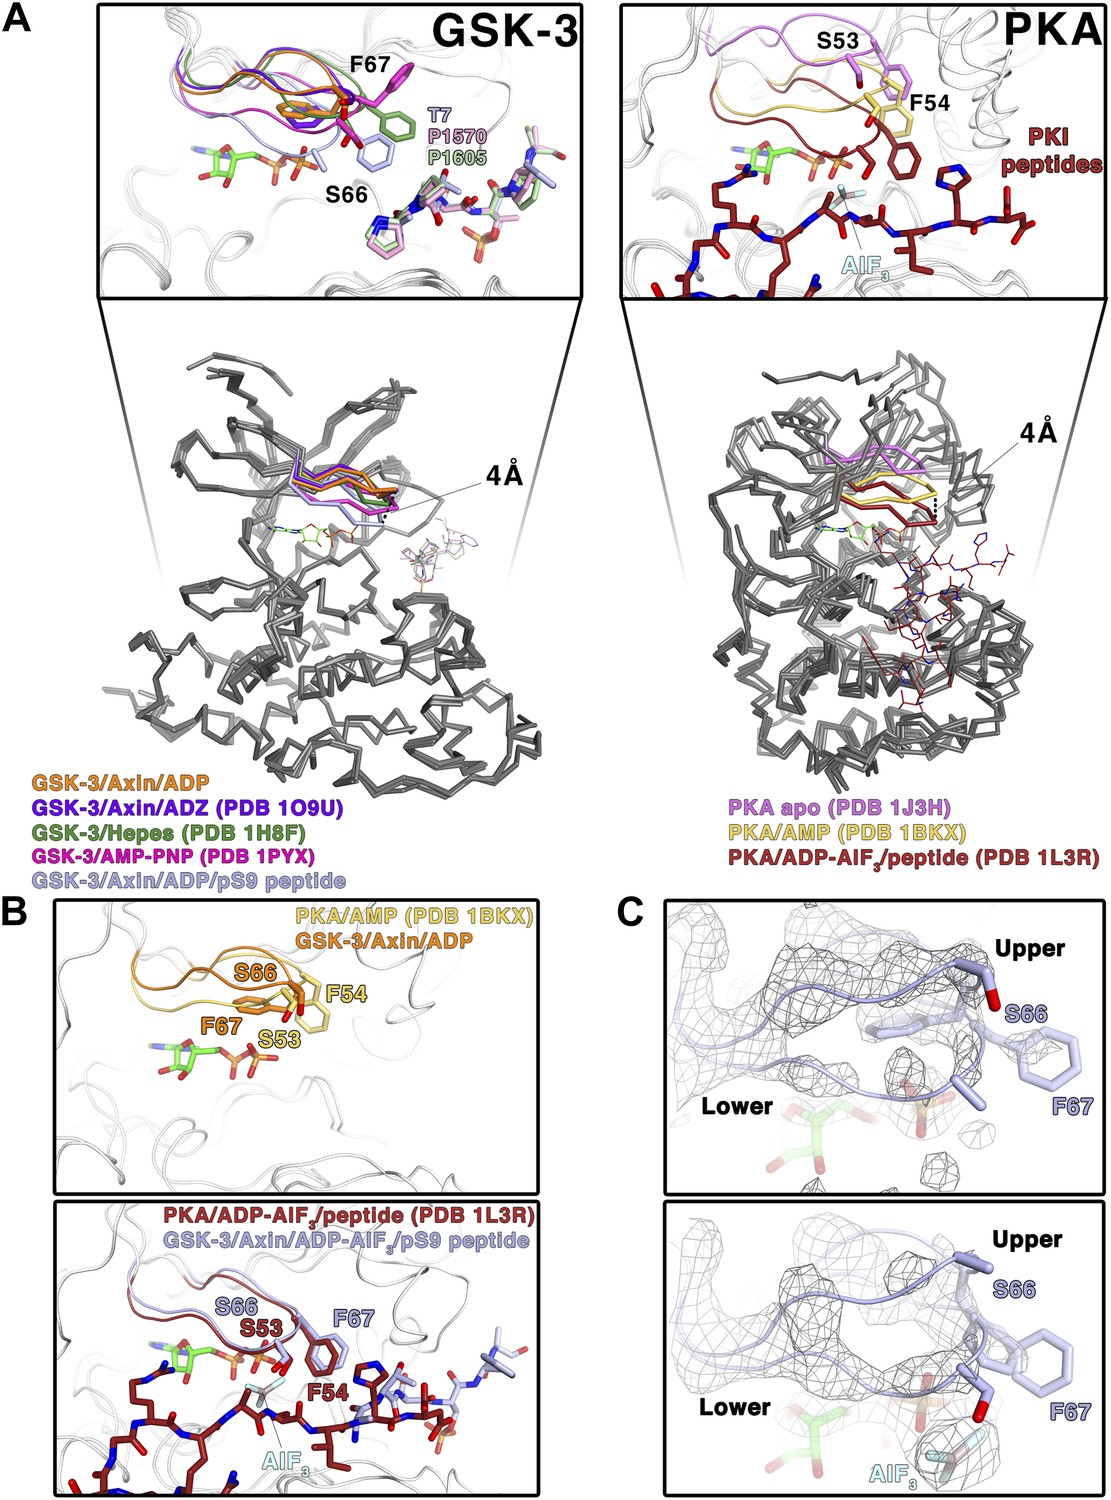
Conformational change of the glycine-rich loop upon inhibitor peptide binding.
(A) Left panel: superposition of α-carbon traces of five selected GSK-3 structures. The dashed line indicates the maximum deviation at the glycine-rich loops among the currently solved GSK-3 structures (4 Å at the α-carbon of residue S66 between the peptide-free (orange/purple) and the peptide-bound (light blue) GSK-3). Some GSK-3 structures show an intermediate position of the glycine-rich loop (green/pink) due to interaction with another GSK-3 molecule in the crystal lattice (not shown in the figure for clarity, please refer to PDB 1H8F/1PYX). The inset shows the close-up of the glycine-rich loops of the five selected GSK-3 structures. Upon peptide binding, F67 packs against the T7 or P1570/P1605 at the P+2 residue of the pS9 or LRP6 peptides. Right panel: superposition of α-carbon traces of three selected PKA structures. The glycine-rich loop of the nucleotide-free PKA (light purple) is at the ‘highest’ position, due to the open conformation of the inactive kinase structure. In the nucleotide-bound state (gold), the glycine-rich loop moves toward the C-terminal lobe, and it moves further down by 4 Å upon binding to a peptide in its substrate-binding site (brown). The inset shows the close-up of the glycine-rich loops of the three selected PKA structures. The equivalent residues of GSK-3 S66 and F67, PKA S53 and F54, are depicted as sticks. The ADP and AlF3 molecules are also shown. (B) Close-up comparisons of the glycine-rich loops in the nucleotide-bound state (upper panel) and nucleotide/peptide-bound transition state (lower panel) of GSK-3 and PKA. (C) Comparisons of the electron density (gray mesh, 2Fo-Fc map contoured at 0.8 σ) of the glycine-rich loops in the ADP-bound state (upper panel) and ADP–AlF3 transition state (lower panel). The upper and lower conformations of the glycine-rich loops are indicated. GSK-3 S66 and F67 are depicted as sticks, and the ADP and AlF3 molecules are also shown.
Figure 5
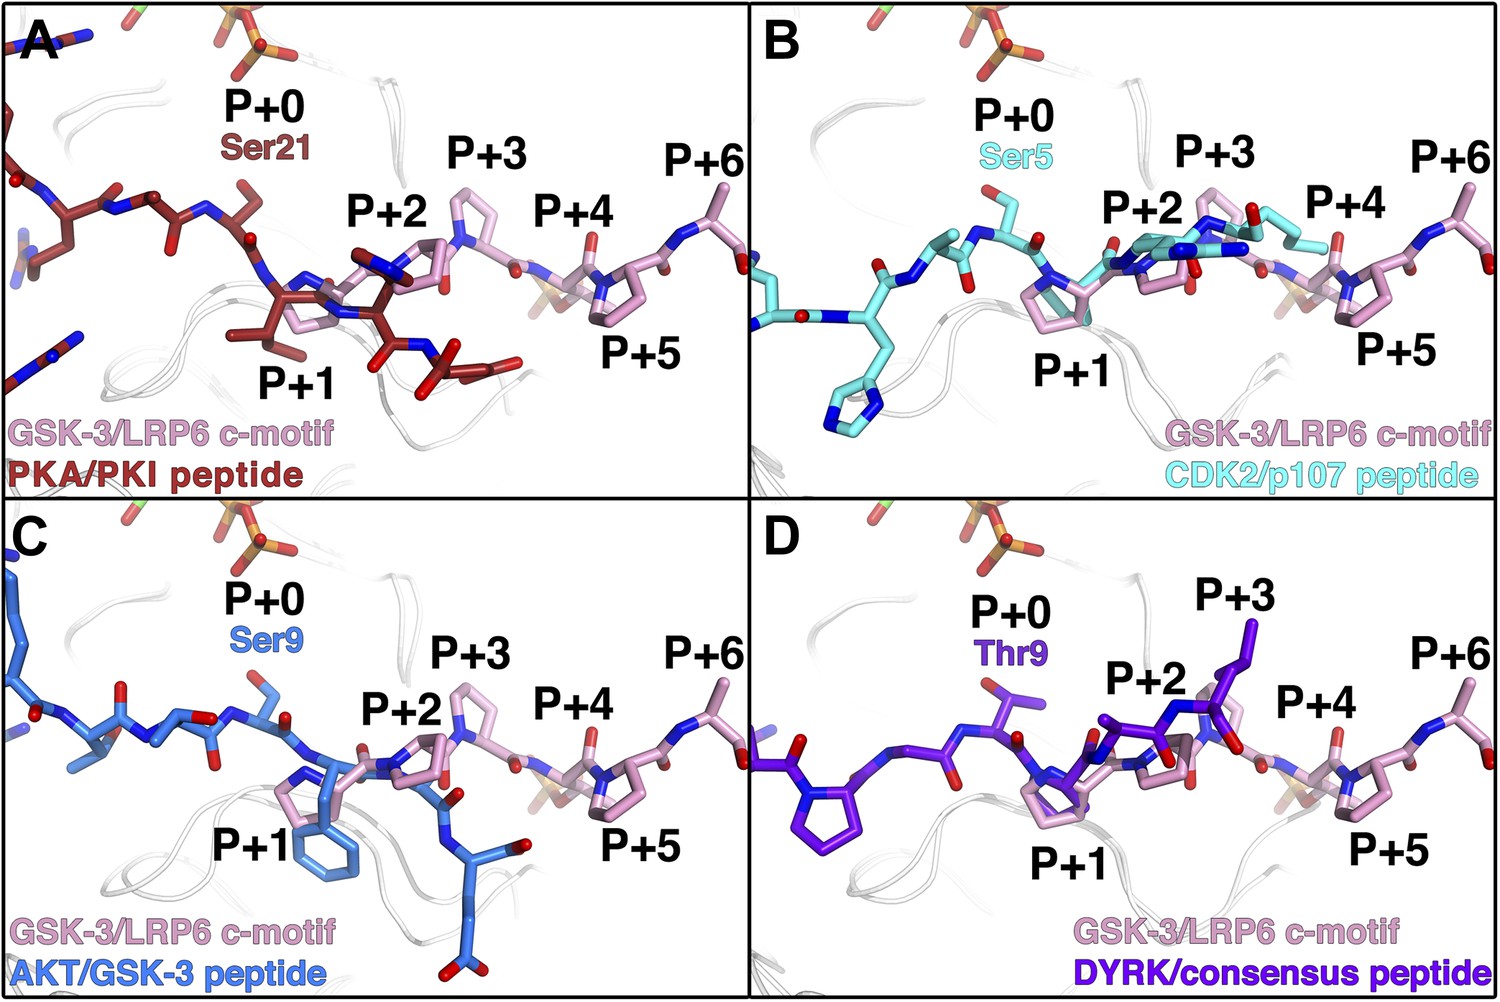
Comparison of GSK-3 inhibitory peptide orientation with other kinase: peptide complexes.
Superposition of the GSK-3/LRP6 c-motif structure with the (A) PKA:PKI peptide (PDB 1L3R); (B) CDK2:p107 peptide (PDB 1QMZ); (C) AKT:GSK-3 peptide (PDB 3CQU); and (D) DYRK:consensus peptide (PDB 2WO6) substrate complexes. The β-phosphate of the ADP molecule in the catalytic site of GSK-3 is shown at the top of each panel, with phosphorus in orange and oxygen in red.
Figure 6
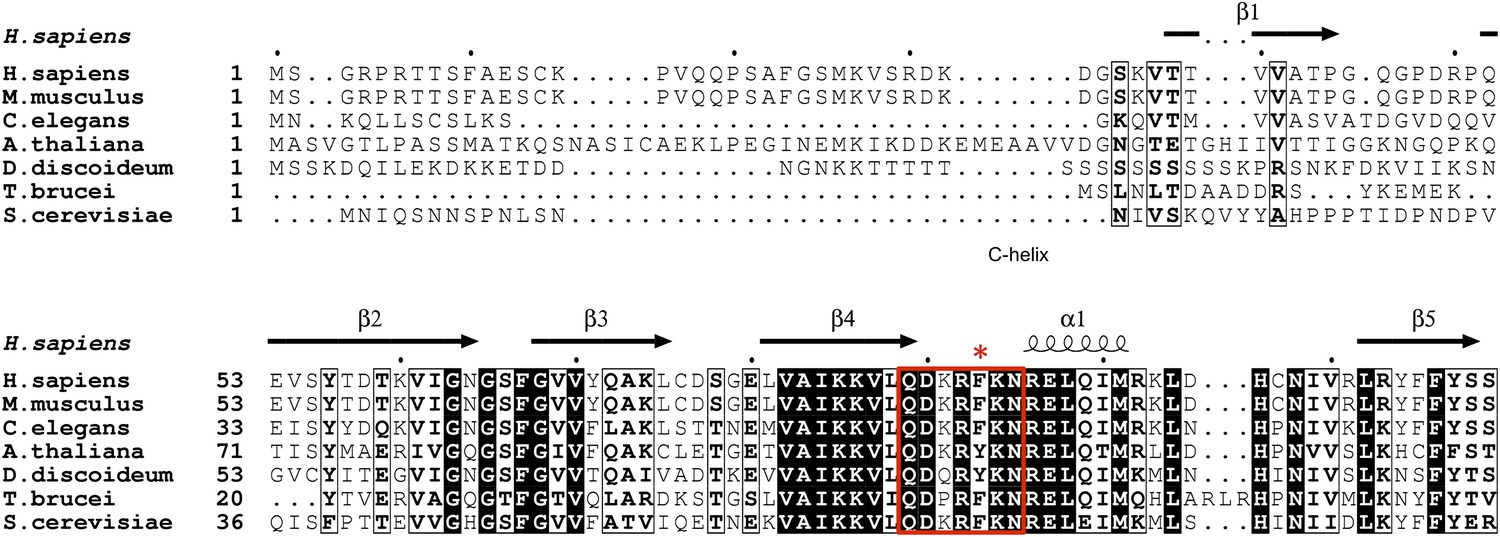
GSK-3 sequence alignments near the C-loop.
White letters on black background indicates identical residues, and bold letters denote similar residues. Secondary structure elements are shown above the alignment. The C-loop is marked in the red box, with Phe93 indicated by the asterisk.
Figure 7
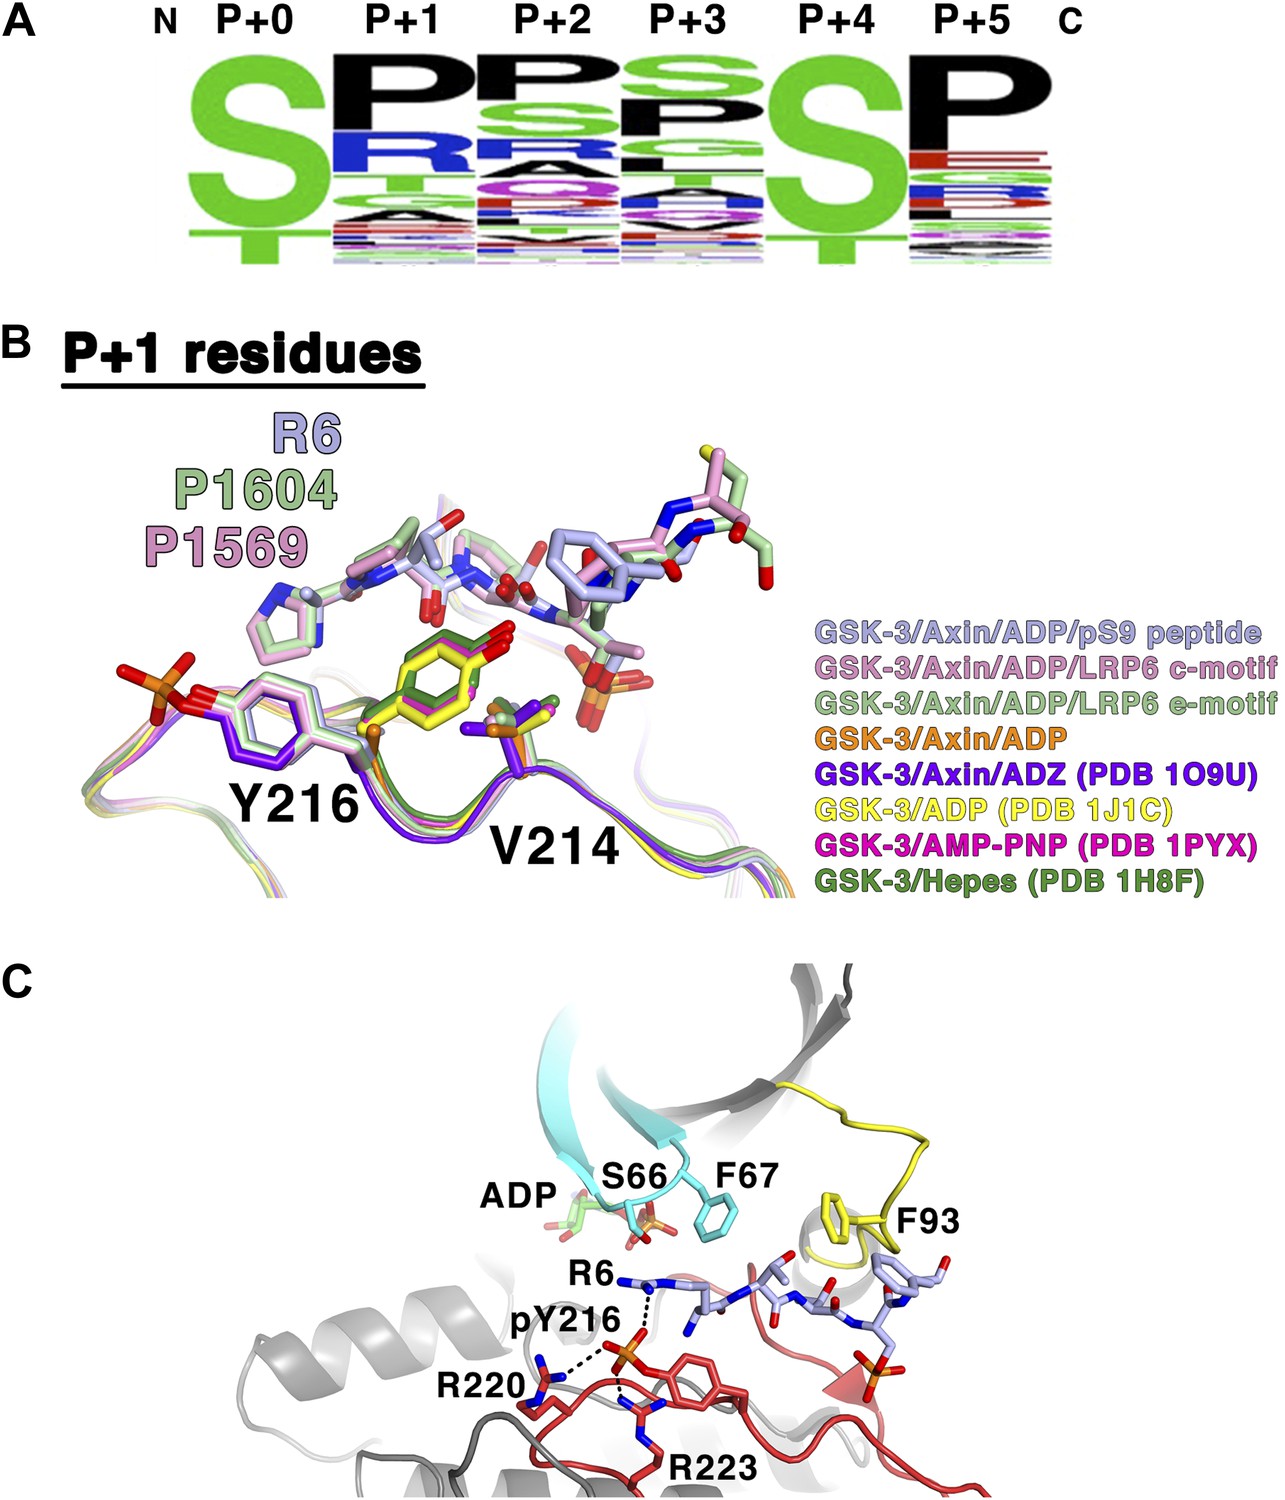
GSK-3 substrate specificity.
(A) Amino acid frequency logo diagram for each of the positions P+0 through P+5 for the 75 GSK-3 substrates listed in Table 3. The diagram was created using WebLogo (Crooks et al., 2004). (B) Conformational change of Y216 upon peptide binding. In the absence of peptide and Y216 phosphorylation, the ring of Y216 packs against V214. In the presence of peptide, Y216 points outward, away from the peptide, and adopts an identical conformation to that seen when it is phosphorylated (purple, GSK-3/Axin/ADZ structure; PDB 1O9U [Dajani et al., 2003]). The ring of Y216 packs against the P+1 residue in each of the peptide complexes. (C) Model of basic P+1 residue interaction with phosphorylated Y216. The phosphate group of phosphorylated Y216 could interact with the positively charged moiety of arginine at P+1 of the peptide substrate. As seen in PDB 1O9U, Arg220 and Arg223 would also chelate the phosphate group. Also shown are peptide-binding residues on the glycine-rich loop (cyan), C-loop (yellow) and activation loop (red).
Videos
Video 1
Conformational changes in GSK-3 associated with peptide substrate binding.
The video shows the ADP and Axin-bound enzyme changing between the inhibitor-free and pS9-bound states. Key structural elements are colored as in Figure 2A.
Tables
Table 1
Kinetic parameters for GSK-3β variants
| KM (µM) | kcat (s−1, × 10−2) | kcat/kM (M−1•s−1, × 103) | |
|---|---|---|---|
| GSK-3β 26-383 | 8.5 ± 3.8 | 7.9 ± 1.2 | 9.3 ± 4.4 |
| GSK-3β 26-383F93A | 39.1 ± 13.8 | 5.1 ± 0.6 | 1.3 ± 0.5 |
| GSK-3β 26-383F93G | 21.3 ± 14.2 | 2.3 ± 0.4 | 1.1 ± 0.8 |
| GSK-3β 1-383 | 27.8 ± 15.7 | 15.6 ± 3.6 | 5.6 ± 3.4 |
| GSK-3β 1-383pS9 | 21.7 ± 9.0 | 2.7 ± 0.4 | 1.2 ± 0.5 |
Table 2
X-ray crystallography data collection and refinement statistics
| Inhibitor-free | pS9 | pS9-AlF3 | LRP6 c-motif | LRP6 e-motif | |
|---|---|---|---|---|---|
| PDB code | 4NM0 | 4NM3 | 4NU1 | 4NM5 | 4NM7 |
| Data collection* | |||||
| Space group | P6122 | P6122 | P6122 | P6122 | P6122 |
| Unit cell lengths a, c (Å) | 81.3, 280.8 | 81.0, 281.1 | 81.0, 280.5 | 81.7, 280.9 | 82.0, 280.3 |
| Beamline | SSRL 11-1 | SSRL 11-1 | APS 23-ID-B | SSRL 12-2 | SSRL 12-2 |
| Wavelength (Å) | 1.033 | 1.033 | 1.033 | 1.00 | 1.00 |
| Resolution range (Å) | 39.1–2.50 | 39.0–2.10 | 46.8–2.50 | 39.2–2.30 | 39.4–2.30 |
| (last shell) | (2.60–2.50) | (2.16–2.10) | (2.60–2.50) | (2.38–2.30) | (2.38–2.30) |
| Unique reflections | 20,069 | 33,093 | 19,922 | 25,685 | 25,932 |
| CC1/2† | 0.999 (0.726) | 1.00 (0.673) | 0.999 (0.814) | 0.999 (0.459) | 1.00 (0.485) |
| Rmerge‡ | 0.106 (1.74) | 0.100 (4.88) | 0.303 (6.772) | 0.141 (3.63) | 0.136 (4.31) |
| <I>/<σI> | 18.4 (1.2) | 24.5 (0.8) | 13.0 (0.7) | 18.9 (1.0) | 17.8 (0.9) |
| Completeness (%) | 100 (99.9) | 99.9 (99.7) | 100 (100) | 99.7 (99.6) | 100 (100) |
| Multiplicity | 9.6 (9.9) | 18.6 (17.9) | 21.0 (21.6) | 18.9 (18.1) | 18.7 (18.2) |
| Refinement | |||||
| No. reflections work/test set | 19,958/979 | 32,924/1658 | 19,823/974 | 25,608/1283 | 25,838/1292 |
| Rwork/Rfree§ | 0.191/0.240 | 0.194/0.242 | 0.191/0.245 | 0.183/0.232 | 0.183/0.234 |
| Number of atoms | |||||
| GSK-3 | 2780 | 2885 | 2862 | 2850 | 2858 |
| Axin | 165 | 153 | 149 | 155 | 155 |
| LrpC/E peptide | – | – | – | 44 | 44 |
| ADP | 27 | 27 | 27 | 27 | 27 |
| Mg2+ | 2 | 2 | 2 | 2 | 2 |
| Cl− | 1 | 1 | – | 1 | 1 |
| Glycerol | 30 | 24 | 12 | 24 | 18 |
| DTT | 8 | 8 | – | – | 8 |
| AlF3 | – | – | 4 | – | – |
| NO3− | – | – | 4 | – | – |
| Water | 164 | 197 | 98 | 121 | 106 |
| B-factors (Å2) | |||||
| GSK-3 | 52.6 | 55.0 | 75.1 | 69.7 | 69.7 |
| Axin | 59.5 | 54.0 | 78.1 | 75.2 | 77.8 |
| LrpC/E peptide | – | – | – | 101 | 100 |
| ADP | 65.3 | 50.3 | 57.5 | 72.2 | 56.5 |
| Mg2+ | 88.5 | 53.8 | 57.6 | 86.4 | 69.6 |
| Cl− | 77.1 | 71.1 | – | 90.9 | 96.8 |
| Glycerol | 65.2 | 79.4 | 93.1 | 94.6 | 97.2 |
| DTT | 99.3 | 102 | – | – | 131 |
| AlF3 | – | – | 83.6 | – | – |
| NO3− | – | – | 100.8 | – | – |
| Water | 46.4 | 52.3 | 61.1 | 64.3 | 64.6 |
| Rmsd | |||||
| Bond lengths (Å) | 0.003 | 0.005 | 0.003 | 0.002 | 0.004 |
| Bond angles (°) | 0.63 | 0.91 | 0.63 | 0.63 | 0.76 |
| Ramachandran plot (%)¶ | |||||
| Favored regions | 96.5 | 96.9 | 96.1 | 95.6 | 95.8 |
| Additional allowed regions | 3.5 | 3.1 | 3.9 | 3.9 | 4.2 |
| Outliers | 0 | 0 | 0.5 | 0.5 | 0 |
-
*
Values in parentheses are for highest-resolution shell. Rmsd, root mean square deviation.
-
†
As defined in Aimless (Evans and Murshudov, 2013).
-
‡
Rmerge = ΣhΣI|II(h)–< I(h) > |/ΣhΣI(h), where II(h) is the Ith measurement of reflection h, and < I(h) > is the weighted mean of all measurements of h.
-
§
R = Σh|Fobs(h)–Fcalc(h)|/Σh|Fobs(h)|. Rwork and Rfree were calculated using the working and test reflection sets, respectively.
-
¶
As defined in MolProbity (Chen et al., 2010).
Table 3
Confirmed GSK-3 biological targets (adapted from Sutherland, 2011)
| Protein | P+0 residue | P+0 to P+5 sequence | UniprotKB # |
|---|---|---|---|
| APC | 1501 | SCSSSL | (P25054) |
| ATP-citrate lyase | 447 | TPAPSR | (P53396) |
| 451 | SRTASF | ||
| Axin | 317 | SANDSE | (O15169) |
| 321 | SEQQSL | ||
| BCL-3 | 398 | SPSSSP | (P20749) |
| 402 | SPSQSP | ||
| β-catenin | 33 | SGIHSG | (P35222) |
| 37 | SGATTT | ||
| 41 | TTAPSL | ||
| C/EBPα | 226 | TPPPTP | (P49715) |
| 230 | TPVPSP | ||
| C/EBPβ | 223 | SLSTSS | (P17676) |
| 227 | SSSSSP | ||
| 231 | SPPGTP | ||
| Ci155 (Gli3) | 861 | SRRSSG | (P10071) |
| 873 | SRRSSE | ||
| 903 | SRRSSE | ||
| CLASP2 | 533 | SRESSR | (O71522) |
| 537 | SRDTSP | ||
| CRMP2 | 514 | TPASSA | (Q16555) |
| 518 | SAKTSP | ||
| CRMP4 | 514 | TPAGSA | (Q14195) |
| 518 | SARGSP | ||
| CREB | 129 | SRRPSY | (P16220) |
| CRY2 | 554 | SGPASP | (Q49AN0) |
| Cytidine triphosphate synthetase | 571 | SGSSSP | (P17812) |
| Dynamin I | 776 | TSSPTP | (Q05193) |
| eIF2B | 540 | SRGGSP | (Q13144) |
| FAK | 722 | SPRSSE | (Q05397) |
| Glycogen Synthase | 641 | SVPPSP | (P13807) |
| 645 | SPSLSR | ||
| 649 | SRHSSP | ||
| 653 | SPHQSE | ||
| Heat shock factor 1 | 303 | SPPQSP | (Q00613) |
| HIF1α | 551 | STQDTD | (Q16665) |
| hnRNP D | 83 | SPRHSE | (Q14103) |
| IRS1 | 337 | SRPASV | (P35568) |
| c-jun | 239 | TPPLSP | (P05412) |
| MAP1B | 1396 | SPLRSP | (P46821) |
| Mcl1 | 159 | SLPSTP | (Q07820) |
| Mdm2 | 242 | SDQFSV | (Q00987) |
| 256 | SEDYSL | ||
| MLK3 | 789 | SPLPSP | (Q16584) |
| c-myc | 58 | TPPLSP | (P01106) |
| Myocardin | 451 | STSSSP | (Q8IZQ8) |
| 455 | SPPISP | ||
| 459 | SPASSD | ||
| 626 | STFLSP | ||
| 630 | SPQCSP | ||
| 634 | SPQHSP | ||
| NDRG1 | 342 | SRSHTS | (Q92597) |
| p130Rb | 948 | SHQNSP | (Q08999) |
| 962 | SRDSSP | ||
| 982 | SAPPTP | ||
| p53 | 33 | SPLPSQ | (P04637) |
| PITK | 1007 | SKTVSF | (O15084) |
| Polycystin-2 | 76 | SPPLSS | (Q13563) |
| Presenilin-1 | 397 | SATASG | (P49768) |
| 353 | STPESR | ||
| PP1 G-subunit | 38 | SPQPSR | |
| 42 | SRRGSE | ||
| PTEN | 362 | STSVTP | (P60484) |
| 366 | TPVDSD | ||
| Snail | 96 | SGKGSQ | (O95863) |
| 100 | SQPPSP | ||
| SREBP1a | 426 | TPPPSD | (P36956) |
| 430 | SDAGSP | ||
| Tau | 525 | SRSRTP | (P10693) |
| 548 | TPPKSP | ||
| 713 | SPVVSG | ||
| 717 | SGDTSP | ||
| TSC2 | 1379 | SQPLSK | (P49815) |
| 1383 | SKSSSS | ||
| VDAC | 51 | TTKVTG | (P21796) |
| von Hippel-Lindau | 68 | SREPSQ | (P40337) |
-
Numbers listed are residue numbers of the P+0 residue of the human proteins, with sequences representing the P+0 through P+5 residues for each target sequence. UniprotKB accession numbers are listed to the right.
Download links
A two-part list of links to download the article, or parts of the article, in various formats.
Downloads (link to download the article as PDF)
Open citations (links to open the citations from this article in various online reference manager services)
Cite this article (links to download the citations from this article in formats compatible with various reference manager tools)
Structural basis of GSK-3 inhibition by N-terminal phosphorylation and by the Wnt receptor LRP6
eLife 3:e01998.
https://doi.org/10.7554/eLife.01998


