Transport of soluble proteins through the Golgi occurs by diffusion via continuities across cisternae
- Fondazione IFOM, Istituto FIRC di Oncologia Molecolare (IFOM-IEO Campus), Italy
- Consorzio Mario Negri Sud, Italy
- Institute of Protein Biochemistry, Consiglio Nazionale Delle Ricerche (CNR-IBP), Italy
- Telethon Institute for Genetics and Medicine (TIGEM), Italy
- Center for Anatomy and Cell Biology, Medical University of Vienna, Austria
- FEI Company, Netherlands
- Saarland University, Germany
Figures
Figure 1 with 1 supplement
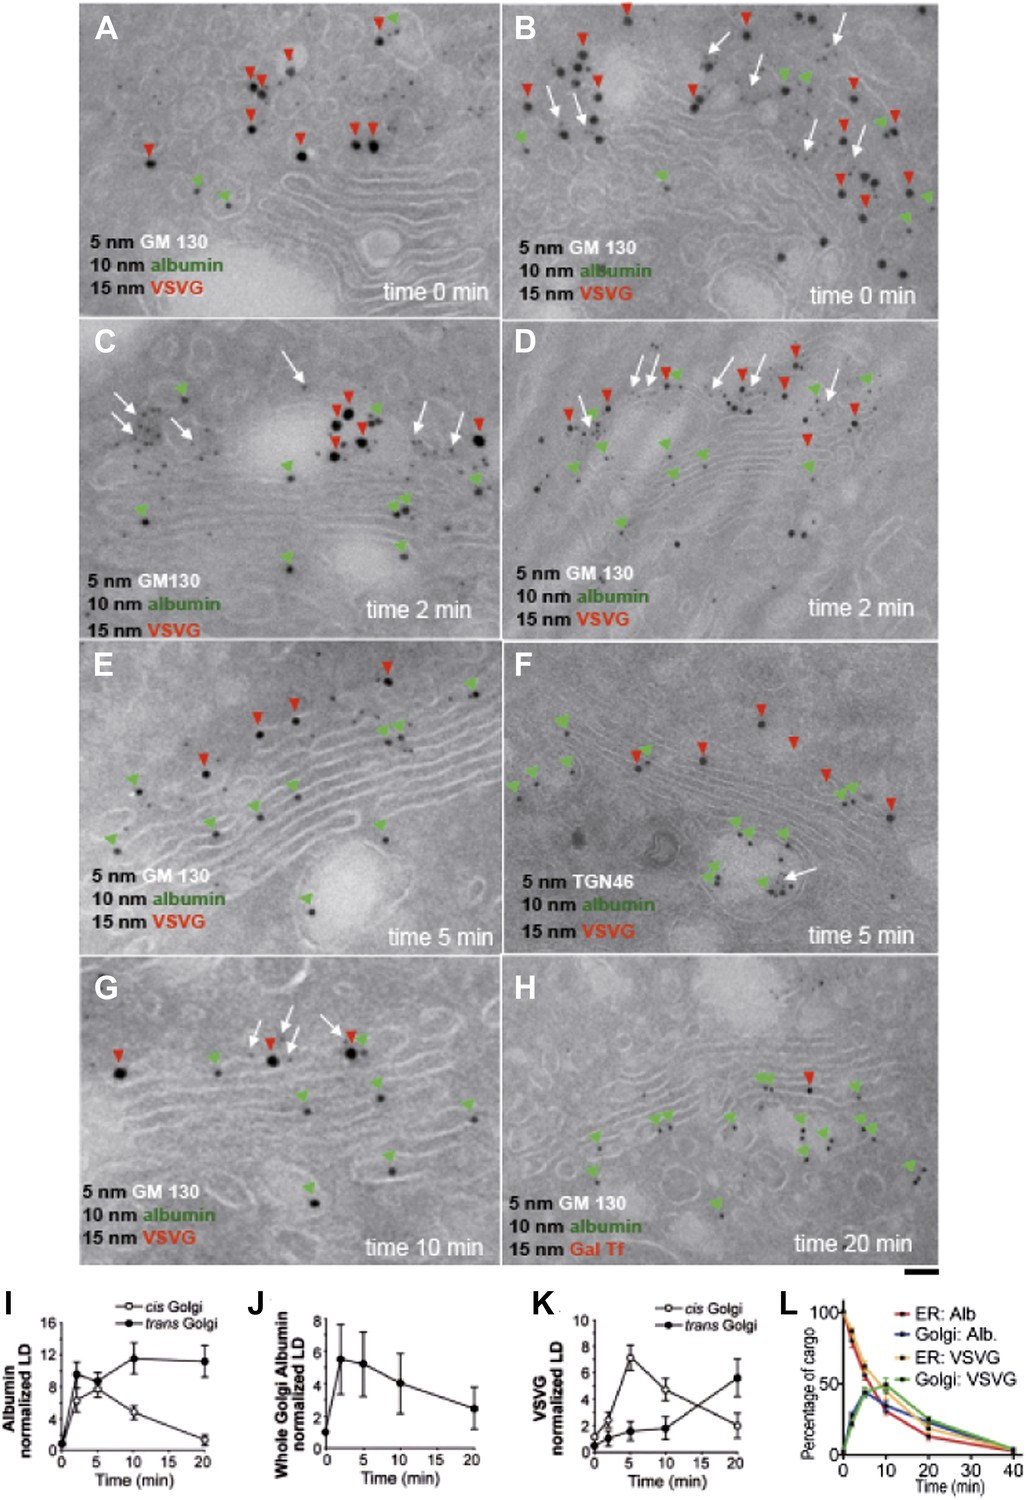
Kinetic patterns of synchronized transport of albumin and VSVG through the Golgi stack.
VSV-infected HepG2 cells were synchronized according to the CHX/32-15°C protocol ('Materials and methods'). Following release of the 15°C block, the cells were examined by immuno-EM (A–H) at the indicated times. Panels (I–K) show quantification of immuno-EM values as labeling density (LD) normalized to the density in the ER, to avoid labeling variability across samples. (L) The amount of albumin or VSVG in indicated compartments were normalized to that present at time 0 in the ER and expressed as percentage. Values are mean ± SD from 30 stacks per time point, in three independent experiments for immuno-EM. Bar: 60 nm (A), 50 nm (B, C, E, G), 100 nm (D, H), 80 nm (F).
Figure 1—figure supplement 1
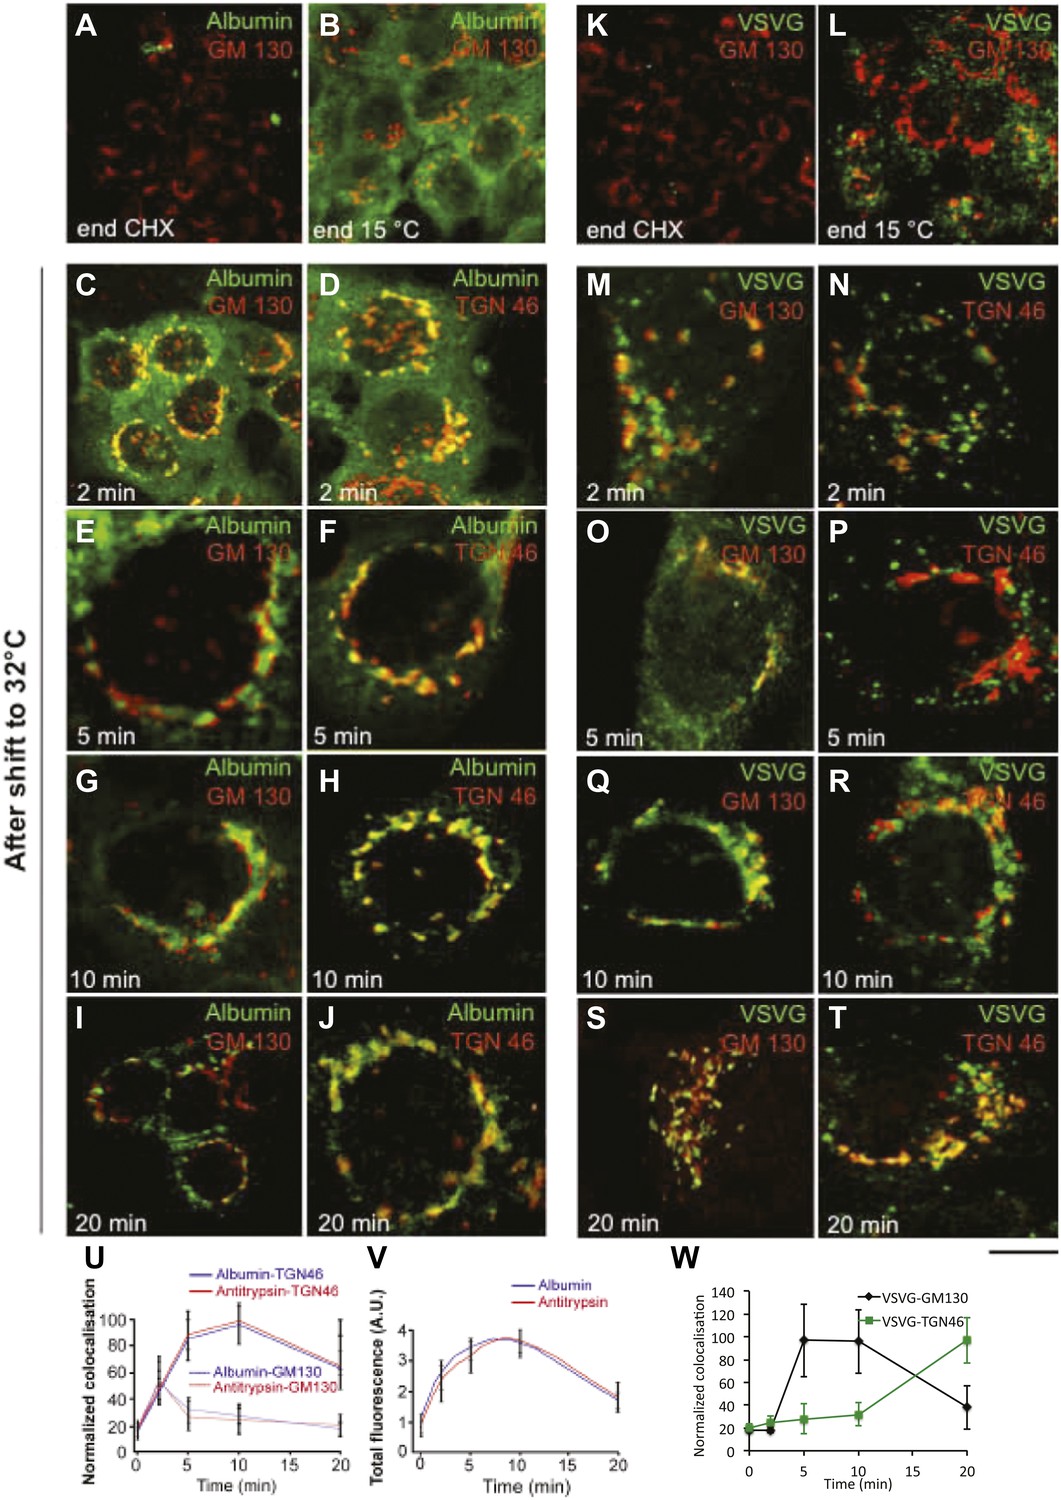
Kinetic patterns of synchronised transport of albumin and VSVG through the Golgi stack as determined by immunofluorescence.
VSV-infected cells were synchronised according to the CHX/32-15°C protocol ('Materials and methods'). Briefly, the cells were treated with CHX for 3 hr, to clear the secretory pathway of all cargo. Following CHX washout, the cells were incubated at 15°C for 2 hr, to block newly synthesised protein in the IC. The 15°C block was then released by shifting the cells to 32°C for the indicated times (0, 2, 5, 10 and 20 min). The cells were fixed and labeled for the cargo proteins albumin (A–J) and VSVG (K–T) and the Golgi markers GM130 and TGN46 as indicated. (U–W) Quantification of co-localization of albumin, antitrypsin (U) and VSVG (W) with Golgi markers as indicated. (V) Total fluorescence of albumin and antitrypsin in the Golgi complex, expressed as arbitrary units (AU). Values are mean ±SD of 10 co-localization measurements per time point for immunofluorescence. Bar: 20 μm (A, K), 10 μm (B, C, L), 4 μm (E–J, M–T), 8 μm (D).
Figure 2
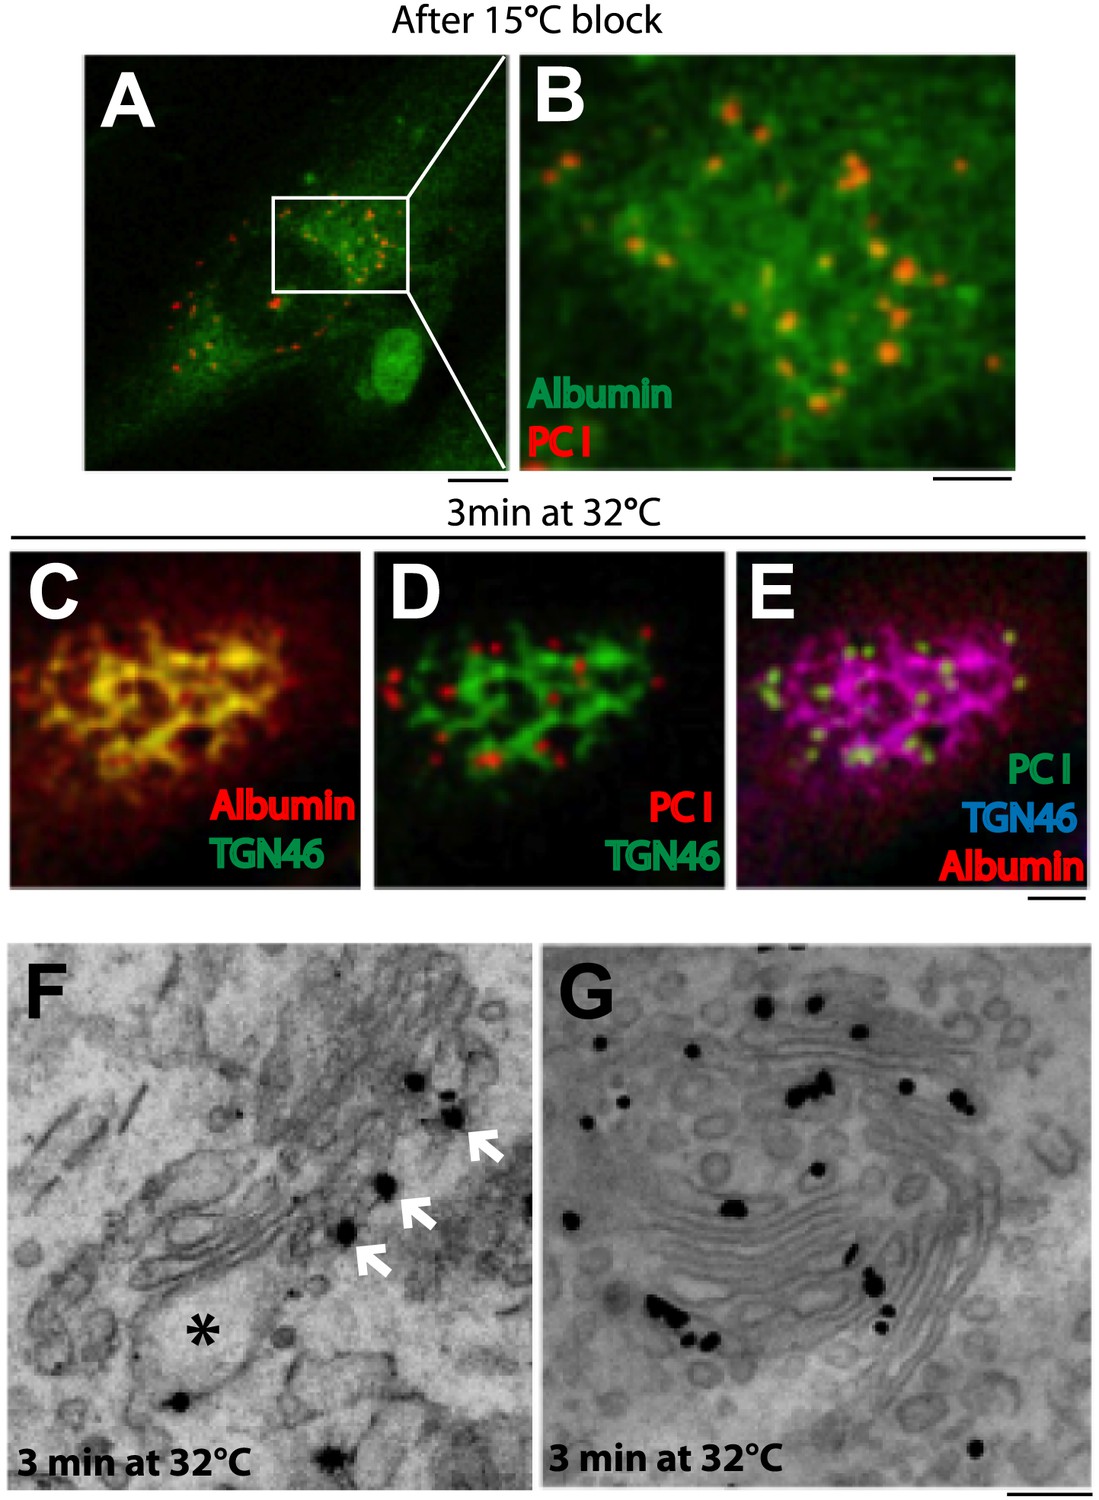
Kinetic patterns of synchronized transport of albumin and PC-I through the Golgi stack.
Human fibroblast cells were microinjected in the nucleus with cDNA for albumin and incubated for 2 hr before further treatments. Transport was synchronized according to the CHX/32-15°C protocol and the cells were examined by immunofluorescence and immuno-EM. (A) Immunofluorescence localization of albumin and PC at the end of the 15°C block. The area in (A) indicated by white rectangle is enlarged in (B) (C–E). Co-localization between albumin (C) or PC (D) or of both cargoes (E) with TGN46, 3 min after release of the block. (F–G). Localization of PC (F) and albumin (G) 3 min after release of the 15°C block by immuno-EM. PC (indicated by *) localizes selectively to the cis-cisterna. The cis-side of the Golgi is revealed by the presence of GM130 labeled by immuno-nanogold technique (indicated by white arrows) (F). Albumin labeled by immuno-nanogold technique (black dots) shows a diffuse localization throughout the Golgi complex (G). Bars: 5 μm (A), 2 μm (B–E), 125 nm (E and F).
Figure 3 with 2 supplements
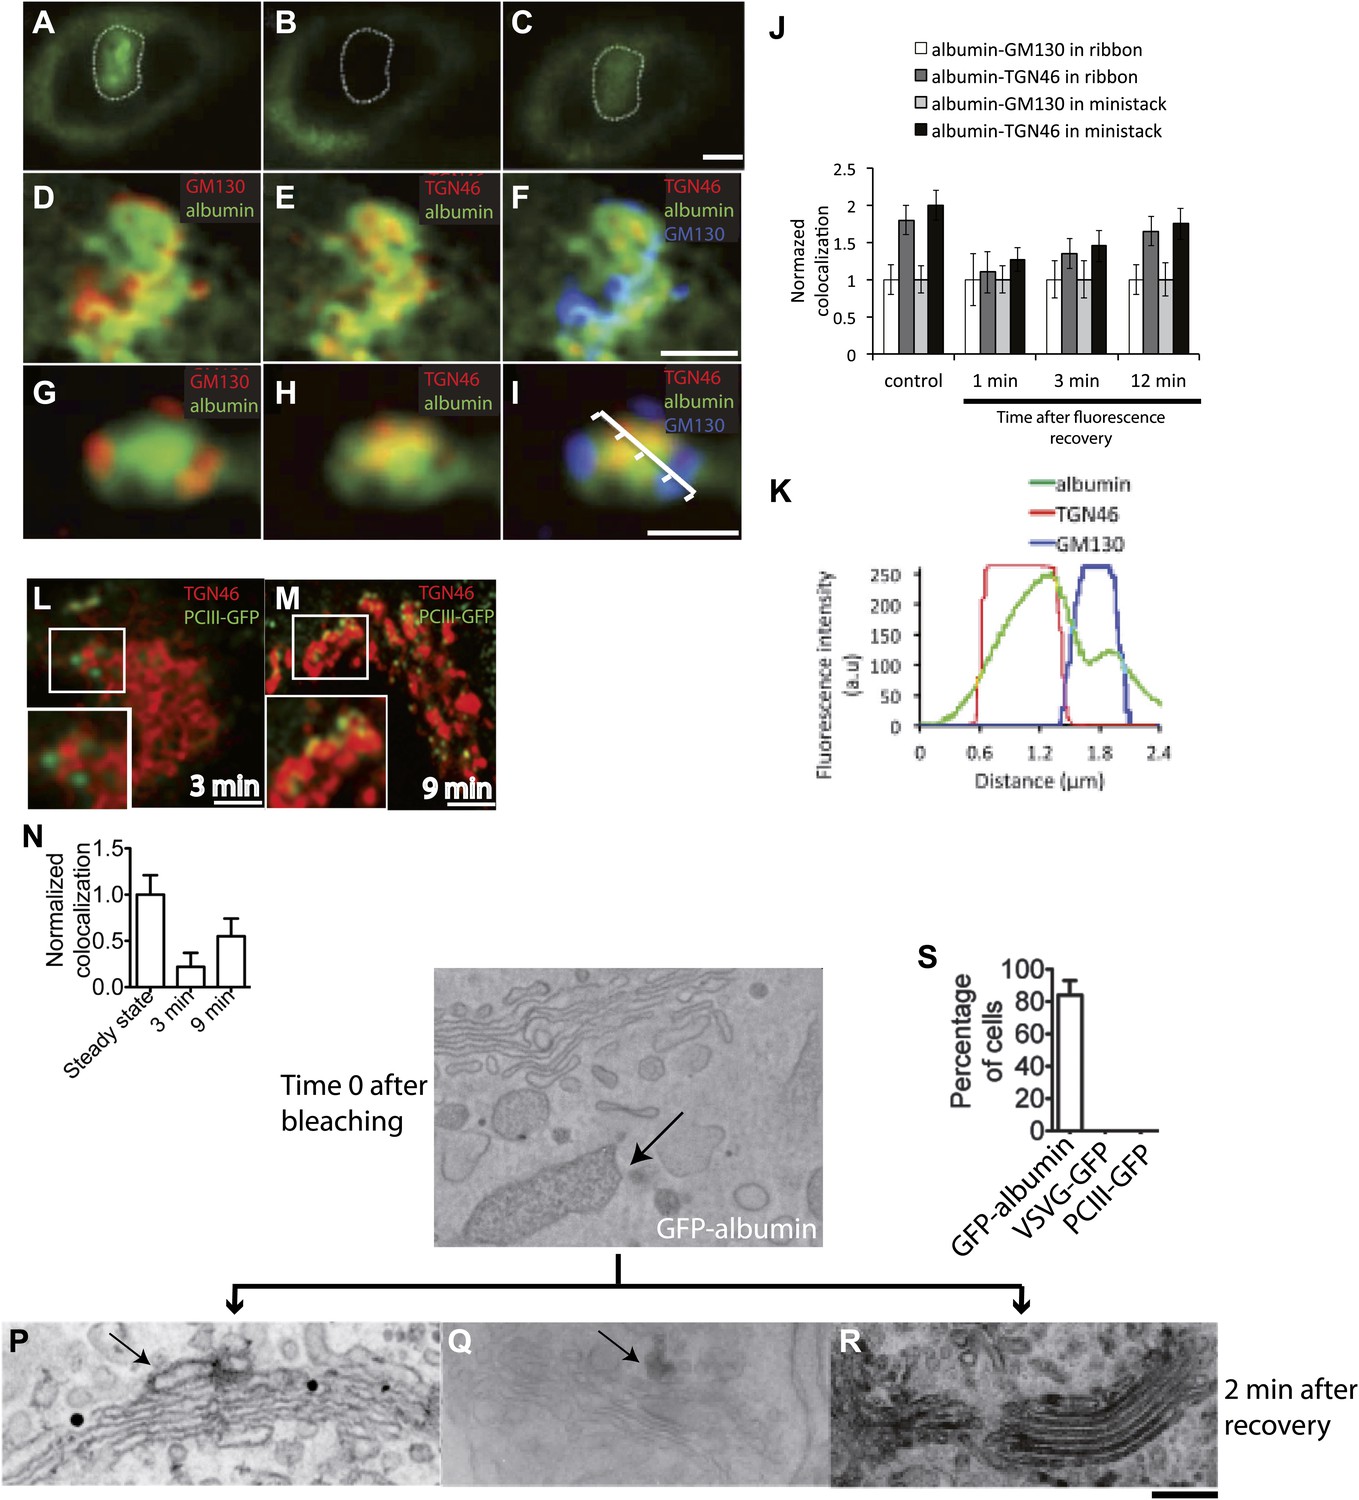
Kinetic patterns of transport of GFP-albumin, VSVG-GFP and PC-III-GFP through the Golgi stack under steady-state conditions.
HeLa cells were transfected with GFP-albumin (A–K) or PC-III-GFP (L–N). After 16 hr of transfection, the Golgi area was bleached, and entry of these cargoes from the unbleached periphery (ER) into the Golgi area was monitored by FRAP. The cells were then fixed at different time points, stained for GM130 and TGN46, and re-localized for analysis of co-localization of the GFP-tagged cargoes with these Golgi markers. (A–C) Bleaching of the Golgi area, as delineated by the dotted line, with post-bleaching recovery for 1 min (C). (D–F) Detail of the same Golgi area shown in (C), showing co-localization of GFP-albumin (green) with GM130 (D, red), or TGN46 (E, red) or both (F: GM130, blue; TGN46, red). (G–I) Similar experiments carried out on a nocodazole-induced Golgi ministack ('Materials and methods'), with 1-min post-bleaching co-localization of GFP-albumin (green) with GM130 (G, red) or TGN46 (H, red) or both (GM130, blue and TGN46, red) (I). (J) Quantification of the degree of co-localization of GFP-albumin with GM130 and TGN46 at different time points after bleaching, as illustrated in (A–F). These data are expressed by normalizing the degree of co-localization of GFP-albumin in the TGN46 area to that of albumin in the GM130 area (set to 1). (K) Line scan along the arrow across the Golgi ministack shown in (I). The fluorescence intensities from representative points along the distance were plotted. (L and M) Cells were transfected with PC-III-GFP. The Golgi area (within the dotted line) was bleached, and the time course of entry of PC-III-GFP to the TGN was monitored. The cells were fixed and stained for TGN46 at 3 min (L) and 9 min (M) post-bleach, and the overlap between PC-III-GFP with TGN46 was examined. (N) Quantification of data in (L and M), expressed as mean ± SD from at least three independent experiments. (O–S) To ascertain the earlier observations of rapid filling of the Golgi stack by GFP-albumin (A–F), we resorted to electron microscopy. HeLa cells were transfected with GFP-albumin (O and R) or VSVG-GFP (P) or PC-III-GFP (Q). The Golgi localized fluorescence was bleached as before (time 0; O) and entry of cargo into the Golgi area monitored by FRAP and the cells fixed 2 min after recovery. The GFP fluorescence was then converted to a signal visible at the EM by photooxidation (see 'Photooxidation' under 'Materials and methods' section) using Diaminobenzidine (DAB). The DAB product is indicated by arrows. At time 0 the DAB product is present only in the ER with Golgi devoid of staining (O). After 2 min of fluorescence recovery, both VSVG-GFP (P) and PC-III-GFP (Q) are restricted to the cis-side of the Golgi, while GFP-albumin (R) is present throughout the Golgi. In the case of VSVG-GFP, DAB precipitate is visible outside of the Golgi cisternae because GFP is attached to the cytosolic tail of VSVG. In addition, nanogold labeling for Mannosidase II was done in (P) that marks the medial-part of the Golgi. The time 0 image shown is from cells expressing GFP-albumin; similar staining was obtained from both VSVG-GFP and PC-III-GFP expressing cells at time 0. (S) The percentage of cells that showed DAB product throughout the Golgi 2 min after recovery was calculated and presented as mean ± SD. Bar: 2 μm (A–M), 220 nm (O–R).
Figure 3—figure supplement 1
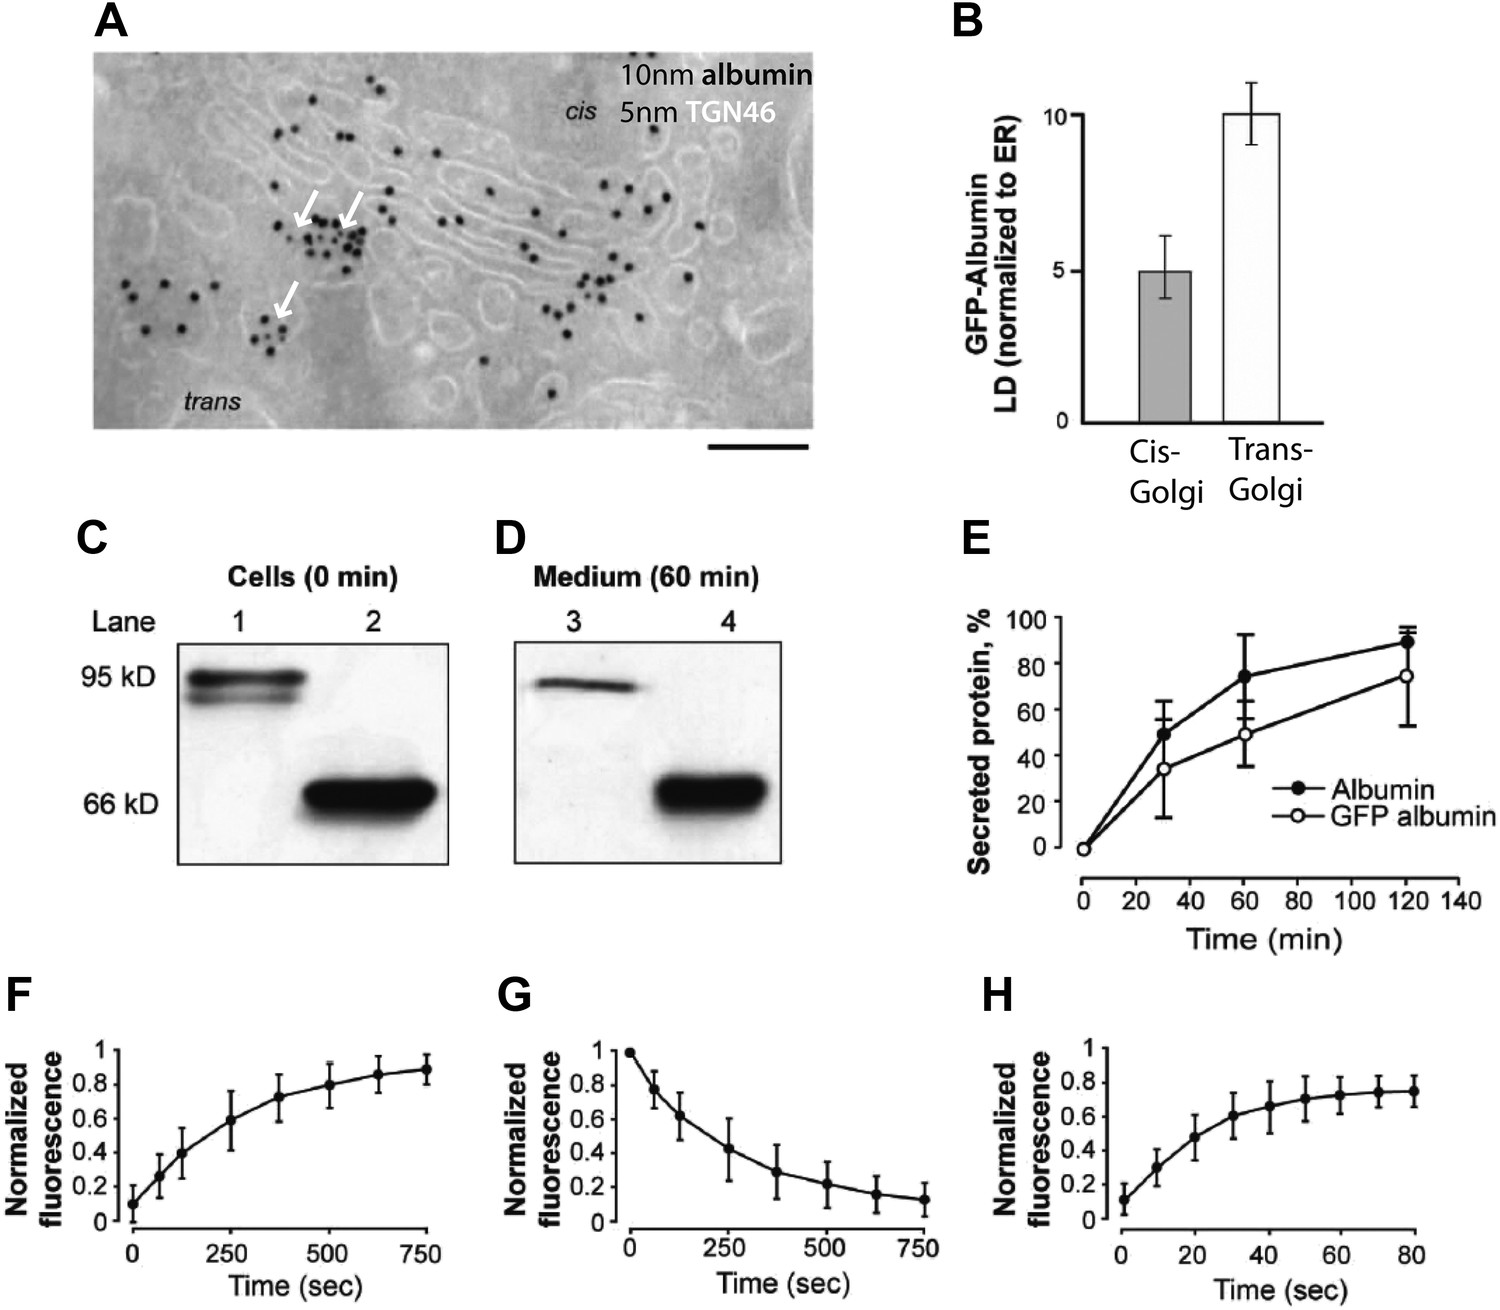
Localization, transport behavior, and dynamics of GFP-albumin at steady-state.
(A and B) Intra-Golgi distribution of GFP-albumin at steady-state. HeLa cells were transfected with GFP-albumin, kept for 24 hr at 37°C, and then fixed and labeled for immuno-EM with an antibody against GFP (10 nm gold) and TGN 46 (5 nm gold; green arrows) (A). The albumin distribution depicted in (A) was quantified and the steady-state GFP-albumin in the cis-Golgi and trans-Golgi is shown as labeling density (LD) normalized to that of the ER (B). (C–E) Kinetics of secretion of GFP-albumin. HeLa cells expressing GFP-albumin (lanes 1, 3) and HepG2 cells (lanes 2, 4) were washed with serum free media and incubated at 37°C for indicated times in serum free media. The cell lysate immediately after wash (C) and media after 60 min of incubation (D) were resolved by SDS-PAGE and probed with anti-albumin antibody. Quantification of the secreted protein (as % total) shows that albumin and GFP-albumin are released into the medium with similar kinetics (E). The minor low-molecular-weight form of GFP-albumin in the intracellular pool (C, lower band in lane 1) is probably a misfolded form of the protein undergoing degradation, and it is not secreted (D, lane 3). (F–H) Dynamics of GFP-albumin at steady-state. HeLa cells were transfected with GFP-albumin and examined using the FRAP approach ('Materials and methods'). (F) Entry of GFP-albumin into the Golgi area. The fluorescence in the whole Golgi area was bleached, and the recovery of fluorescence into the bleached area was monitored. (G) Exit of GFP-albumin from the Golgi area. The fluorescence of the whole cell less the Golgi area was bleached, and the loss of GFP-albumin from the Golgi area was monitored. (H) Diffusion of GFP-albumin along the Golgi ribbon. The fluorescence of a part of the Golgi area was bleached, and the recovery of fluorescence into the bleached region was monitored. The data expressed are in mean ±S.D from three independent experiments (E) or five independent experiments (F–H). Bar: 130 nm (A).
Figure 3—figure supplement 2
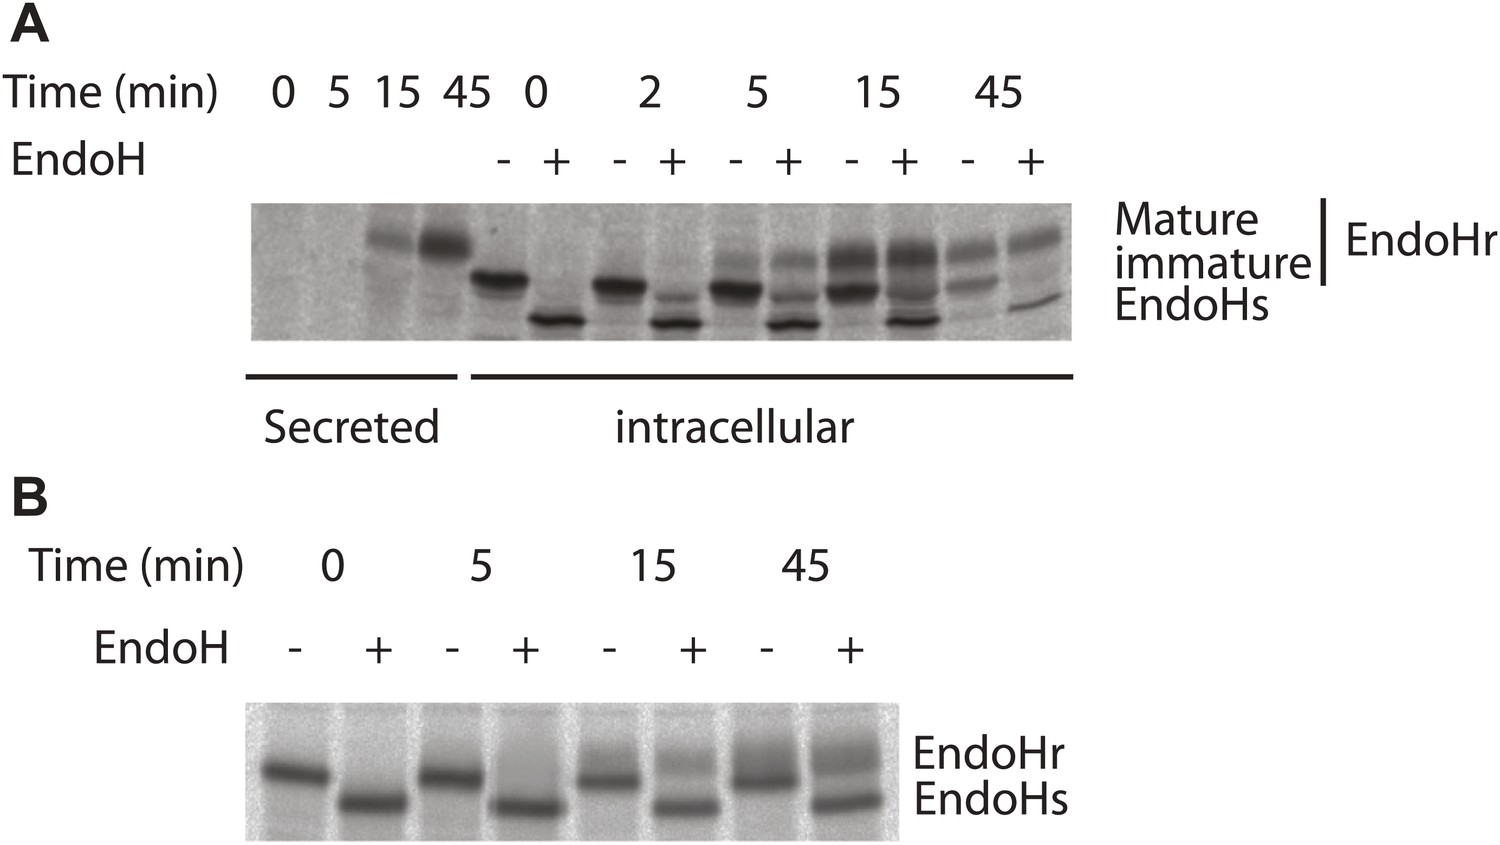
Kinetics of antitrypsin processing by Golgi enzymes reflects its fast kinetics of transport.
Transport of antitrypsin (A) and VSVG (B) along the secretory pathway was monitored by radioactive pulse chase assay. HepG2 cells infected with VSV was pulsed with radioactive aminoacids (35S-methionine and cysteine) for 5 min and then chased for indicated times in cold media. At the end of the chase period the cells were lysed and VSVG or antitrypsin were immunoprecipitated and subjected to Endoglycosidase H digestion as indicated and resolved by SDS-PAGE followed by autoradiography. EndoHr–Endoglycodisase resistant, EndoHs–Endoglycosidase sensitive, immature–EndoHr form of antitrypsin that was not processed by trans-Golgi resident enzymes and mature–EndoHr form of antitrypsin processed by trans-Golgi resident enzymes. It is important to note here that the quantities of antitrypsin and VSVG present are very similar suggesting that the difference in the transport behavior of these proteins is not due to differences in their abundance. In addition, as mentioned in the text, the transport behaviors of antitrypsin and albumin are similar, reiterating further that the differences in the transport behavior between soluble secretory cargoes (albumin and antitrypsin) and VSVG/PC is possibly not due to the differences in their abundance.
Figure 4

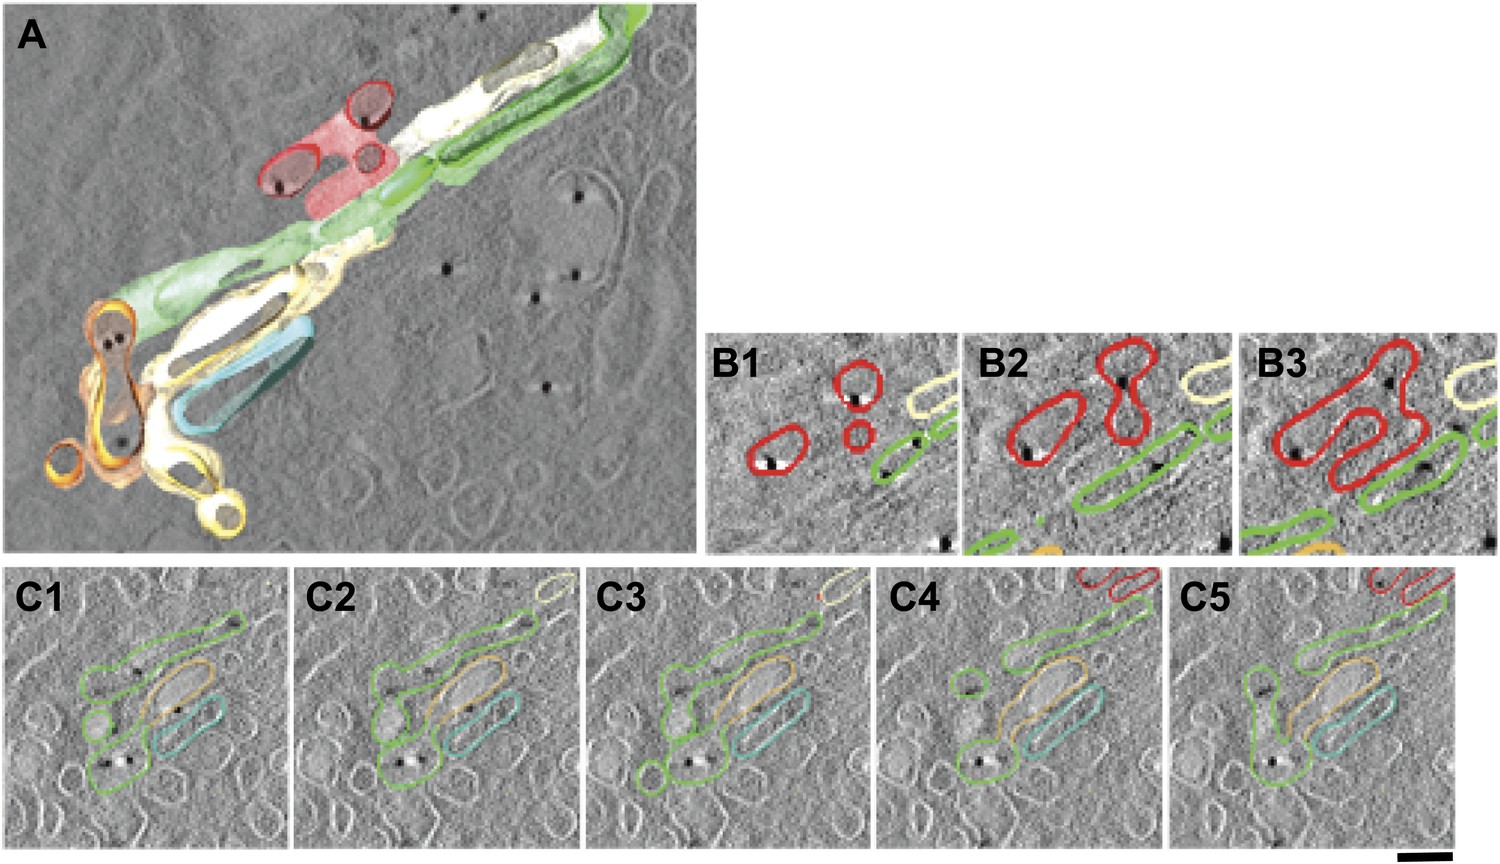
EM tomography facilitates the visualization of convoluted intercisternal tubules.
HepG2 cells were high-pressure frozen and prepared for EM tomography ('Materials and methods'). (A and B) Tomographic model of a stack from a 200-nm-thick section containing an intercisternal connection. Detail of A shown in B; note the complexity of the convoluted connection (follow the arrow to identify the continuity). (C) A gallery of tomographic digital slices (panels 1–12) used to construct the model in (A and B) shows a convoluted intercisternal connection, with the small arrow following the connection, and the arrowheads showing the two cisternae that are connected. Note the complexity of the connection, which would be nearly impossible to detect in traditional thin sections. See Video 1 for facilitated visualization of the continuity. Bar: 150 nm.
Figure 5 with 4 supplements

Albumin distribution in Golgi cisternae, vesicles and tubules in HepG2 cells.
(A–D) Albumin and VSVG distribution in the ER, Golgi stack and TGN (A and B, immuno-EM; C and D, immunofluorescence). White arrows in (A and B) indicate TGN46 labeling. For quantification see (G–J). (E) Albumin distribution in cisternae, vesicles (50–60 nm wide round profiles near the Golgi stack; arrows) and tubules (tubular–ovoid profiles; arrowheads), by immuno-EM. (F) Albumin present in a connected cis-trans vertical tubule, as visualized by the immuno-nanogold technique. Arrowhead indicates albumin and white arrows highlight the intercisternal connection. For quantification see (K). (G and H) Quantification of labeling density (LD) of albumin and VSVG by immuno-EM, normalized to ER labeling. (I and J) Quantification of co-localization (as described in 'Materials and methods') of the cargoes with GM130 (cis-Golgi) and TGN46 (TGN) markers by immunofluorescence, normalized to their co-localization with GM130. (K) Quantification of distribution of albumin in cisternae, peri-Golgi vesicles and tubules expressed as LD. Bars: 120 nm (A), 210 nm (B), 7.5 μm (C and D), 250 nm (E and F).
Figure 5—figure supplement 1
Distribution of cargoes in COPI vesicles.
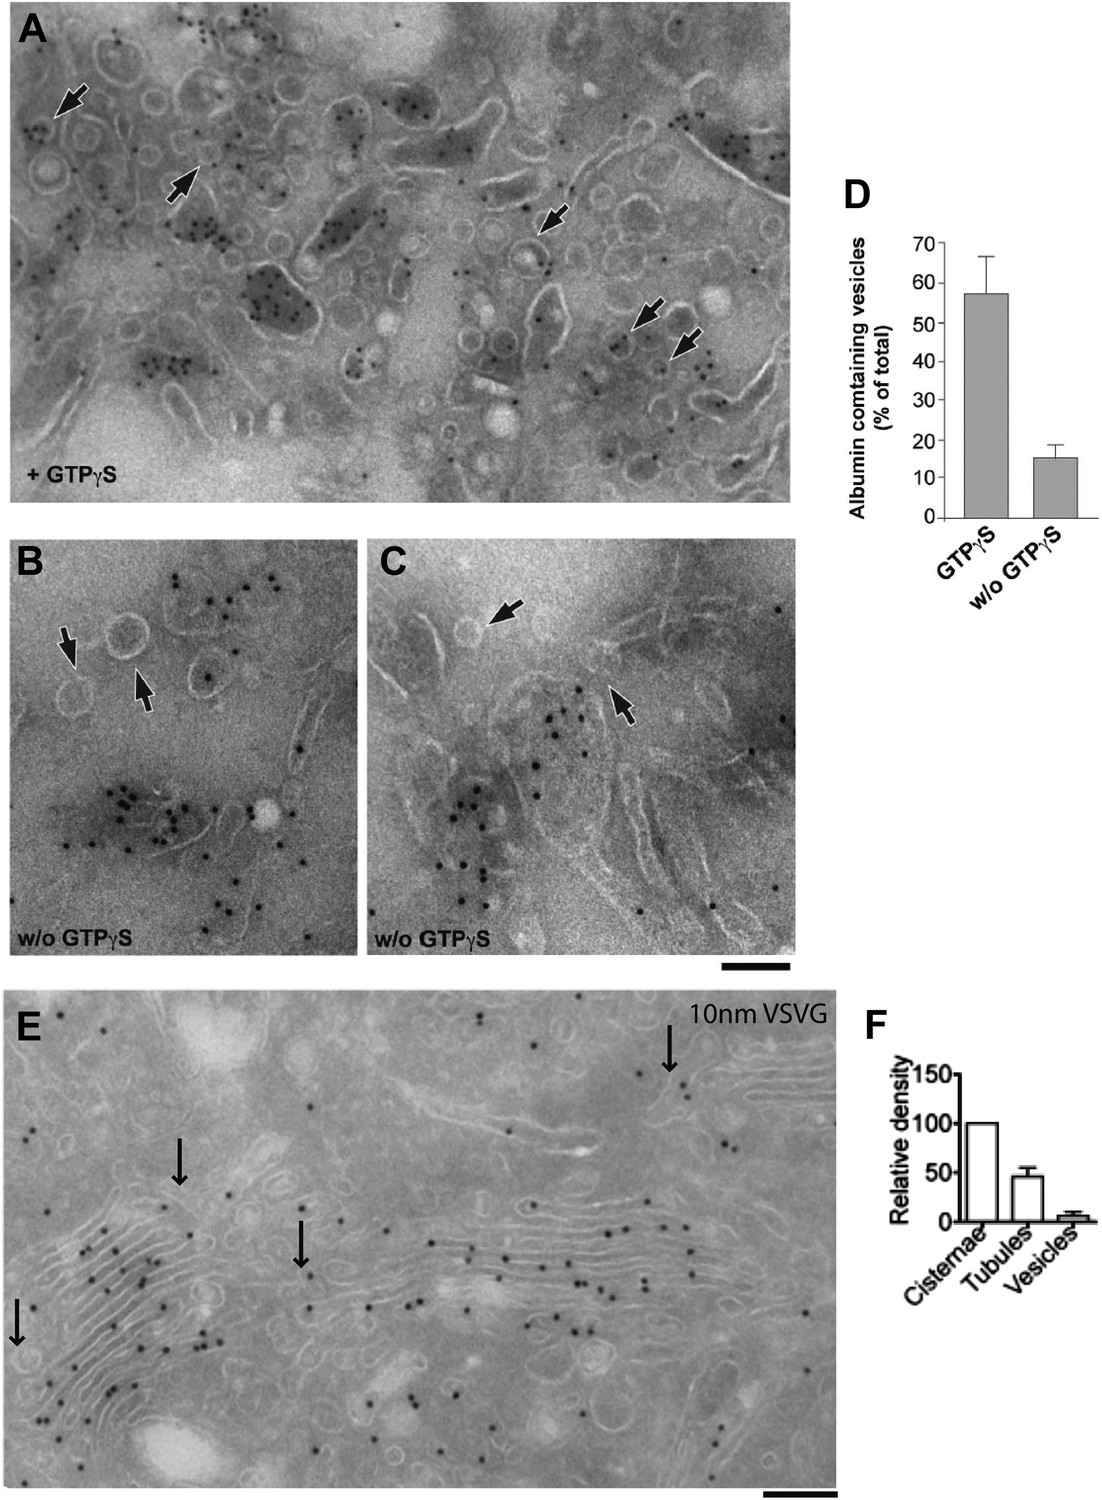
(A–D) As noted in the main text, Golgi vesicles appear depleted of albumin in vivo, while vesicles prepared in vitro have been reported to contain albumin (Malhotra et al., 1989). We sought to resolve this discrepancy between in vivo and in vitro data by examining the conditions of the in vitro preparation. COPI vesicles were purified exactly as described by Rothman et al. (Malhotra et al., 1989). Their study used the non-hydrolysable GTP analogue GTPγS to increase the yield of vesicles in vitro. It was later shown, however, that GTPγS also affects the sorting of cargo into vesicles (Lanoix et al., 1999). We thus examined the effects of GTPγS, and we show here that while COPI-coated vesicles that are formed in the presence of GTPγS contained significant levels of albumin, those that are formed in the absence of GTPγS were depleted of albumin, in line with our in vivo data. The exclusion of soluble proteins from vesicles has been reported before (e.g., of proinsulin from KDEL-receptor-containing vesicles; [Orci et al., 1997]); however, the mechanism of exclusion remains unclear. Experimental details: Golgi membranes were isolated from rat liver ('Materials and methods') and treated with (A) or without (B and C) GTPγS, as described by Rothman and colleagues (Malhotra et al., 1989). The Golgi membranes were then pelleted, and processed for cryoimmuno-EM and labeled with an anti-albumin antibody. After GTPγS treatment, albumin can be seen in COPI vesicular profiles (round, 50–60 nm in diameter) (A, arrows), while in the absence of GTPγS, the vesicles (less numerous) were not labeled for albumin (B and C; arrows). In both cases, albumin was concentrated in large pleomorphic structures, which were probably cisternal remnants. (D) Quantification of the percentage of vesicles containing albumin from (A) and (B) expressed as mean ± SD (n = 3). (E–F) VSV-infected HepG2 cells at steady-state were labeled with antibody against VSVG according to cryo-immuno EM protocol ('Materials and methods'). (E) Lack of VSVG labeling within elongated tubule-like (arrow) and round vesicle-like (arrowhead) profiles. (F) Morphometric analysis shows that VSVG labeling density (mean ± SD; n = 30 stacks) is significantly less in tubules and vesicles than in cisternae. Bar: 120 nm (A and E); 90 nm (B and C).
Figure 5—figure supplement 2
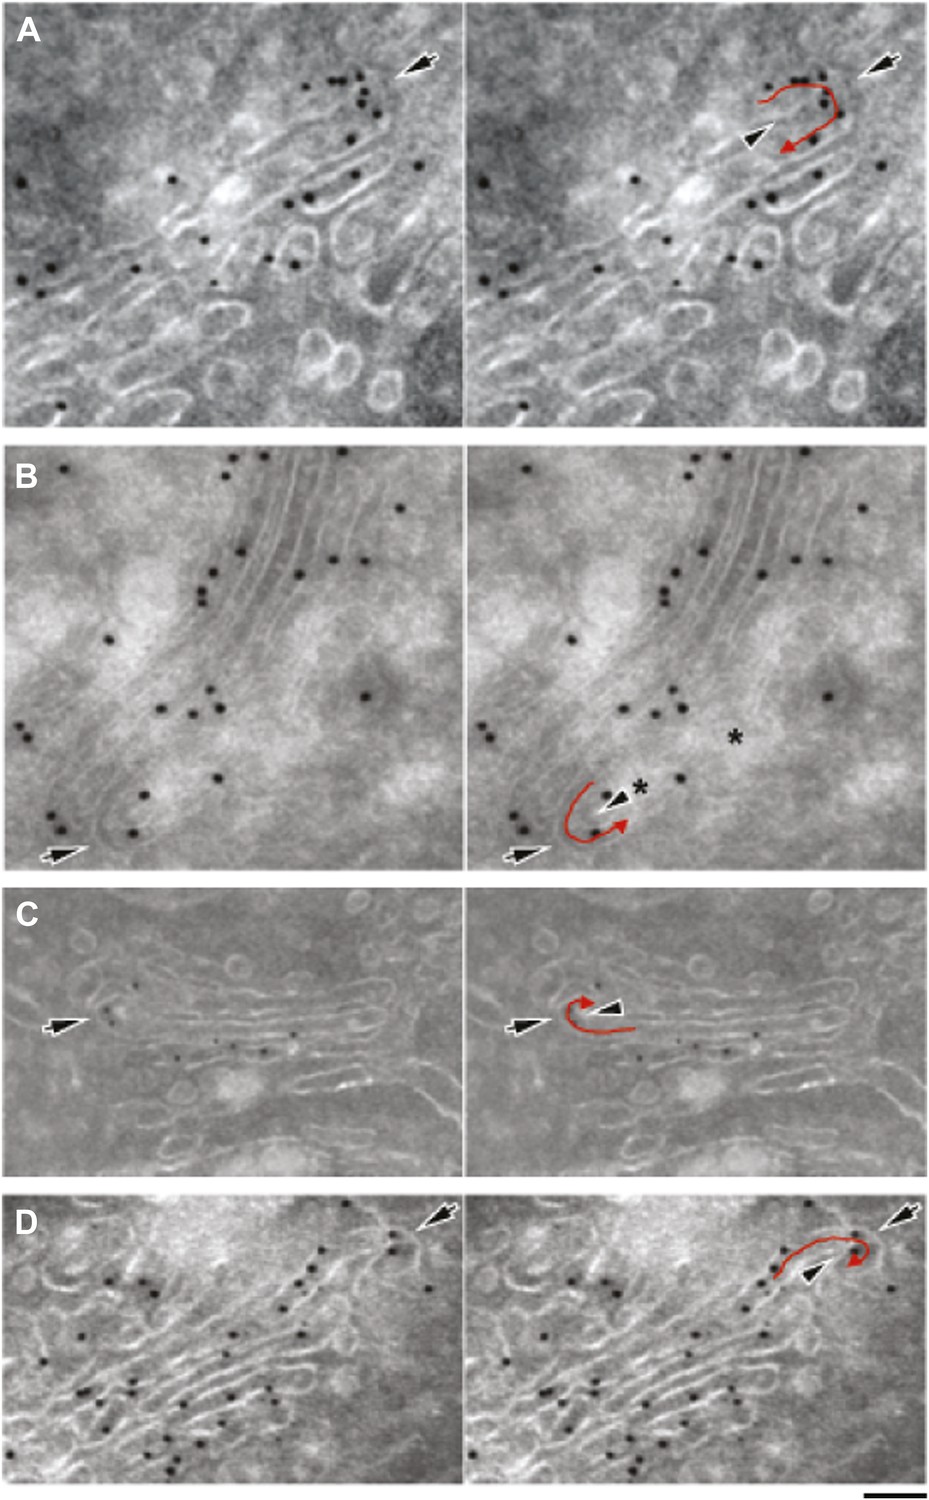
Gallery of cryo-immuno-gold EM images indicating the presence of albumin in intercisternal tubules.
HepG2 cells were labeled for albumin according to the cryo-immuno EM protocol ('Materials and methods'). Black arrows in all images indicate the convex sides of the intercisternal tubules; black arrowheads indicate the concave sides, and red arrows indicate the luminal continuities generated by the connections. (A) The concave part of the bent membrane appears to be clearly continuous across two successive cisternae. Moreover, the position of the albumin-associated gold particles distributed along the bend (please note that albumin is inside a tubule here, even if part of the convex tubular membrane is not clearly visualized), as well as the general disposition of the cisterna are clearly consistent with the presence of a connecting albumin-filled tubule. The external (convex) membrane of the tubule (black arrow) cannot be easily seen, probably due to its oblique orientation with respect to the plane of the section. (B) Here, the tubular loop is clearly visible, but its continuity with the cisternae in the stack is not visible probably due to the brighter areas (asterisks) caused by heterogeneous UA-methylcellulose deposition. (C) Here, the tubular loop exhibits a convex membrane (black arrow) connected to the lower cisterna in the stack. The membrane on the concave side of the tubular bridge (black arrowhead) and its connection to the upper cisterna in the stack are less evident, probably due to their oblique orientation with respect to the section plane. (D) The bent membrane is well preserved and the ‘connecting’ tubule makes a complete (180°) turn from the level of the ‘upper’ cisterna to the level of the ‘lower’ one. However, after the bend there is a gap between the bent membrane and the rest of the ‘lower’ cisterna. This gap almost certainly represents a perforation of the connected cisterna, as indicated by the following considerations: (A) perforations in HepG2 cisternae are very common, and they look very similar to this image; several examples of these perforations can be found in the tomography in Figure 4; (B) the bent tubule, if it is not connected to the cisterna, would have to be open ended. These open-ended tubules are nearly never observed in Golgi tomographies. In addition, it is very hard to imagine a tubule turning downward and backward 180° and pointing precisely to the rim of the cisterna. Bars: 75 nm (A), 110 nm (B), 130 nm (C), 100 nm (D).
Figure 5—figure supplement 3
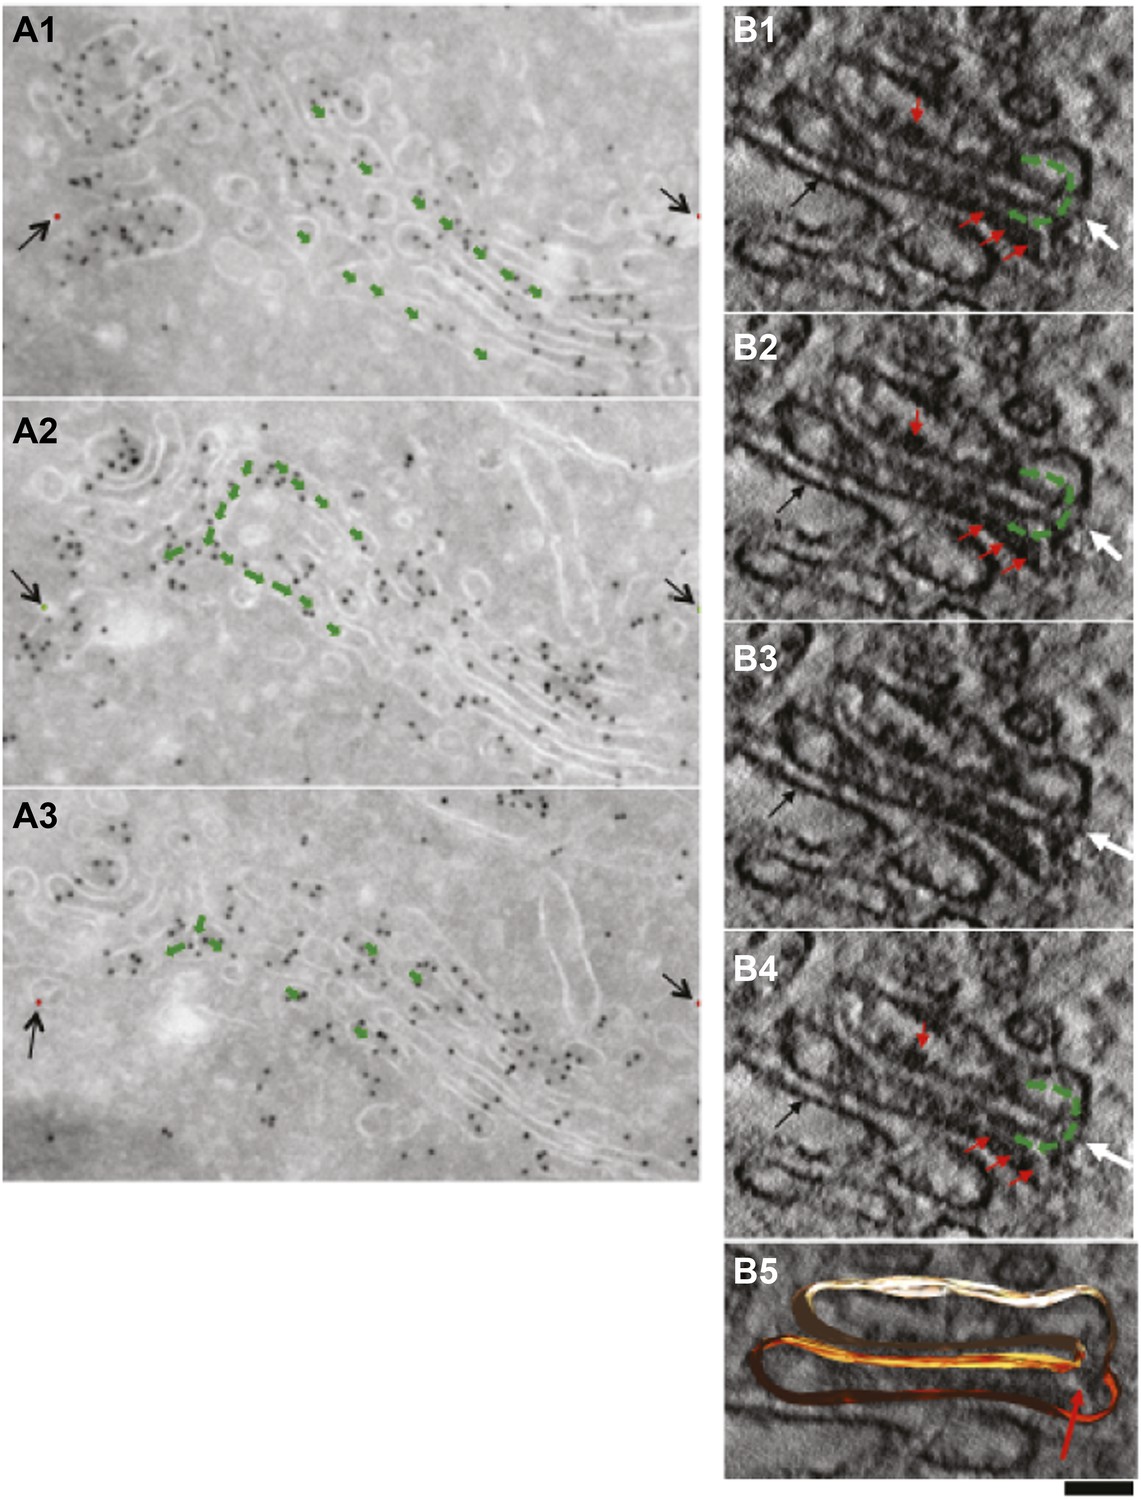
Presence of albumin in intercisternal tubules revealed by serial sectioning followed by cryo-immuno-gold EM and DAB photooxidation followed by tomography.
(A) Serial sectioning by cryo-immuno EM indicates the presence of albumin in intercisternal tubules. HepG2 cells were labeled for albumin according to the cryo-immuno EM protocol ('Materials and methods'). Each image contains the green arrows showing that two cisternae that are not connected in sections 1 and 3 (A1 and A3) are connected in section 2 (A2). A tubular hairpin (or loop) that joins these two cisternae located at different levels of the stack is visible in panel A2. The gold particles distributed over the tubular connection indicate the presence of albumin in the lumen. Black arrows indicate fiducial marks used for alignment of serial sections. (B1–B4) Gallery of tomographic virtual sections of a Golgi stack with GFP-albumin in intercisternal tubules, as revealed by DAB photooxidation. HeLa cells were transfected with GFP-albumin and 24 hr later subjected to photooxidation procedure, embedded in resin and prepared for EM tomography ('Materials and methods'). White arrows show the intercisternal connection (the connection is filled with green arrows) across two consecutive cisternae. The interpretation here is complicated by the membrane damage induced by the photooxidation procedure, and by the presence of the dark patches of oxidized DAB (red arrows). Nevertheless, the image strongly suggest the presence of a tubule (white arrow) connecting cisternae located at different levels of the Golgi stack, as can be visualized in sequential digital slices extracted from the tomogram (panels B1–B4). Dark patches of oxidized DAB product indicate the presence of GFP-albumin within the tubular bridge and the connected cisternae. Precipitates of DAB are visible also in other cisternae (black arrow). (B5) 3D model of the connected cisternae and of the tubular bridge indicated by red arrow. Bars: 150 nm (A); 80 nm (B).
Figure 5—figure supplement 4
Presence of albumin in intercisternal tubules revealed by cryo-immuno EM followed by tomography.
(A–C) HepG2 cells were labeled for albumin according to the cryo-immuno EM protocol ('Materials and methods'). Here, thick sections (200 nm) were used instead of the usual thin (70 nm) sections. The Golgi profiles showing albumin labeling were subjected tomographic reconstruction ('Materials and methods') (A). (B and C) Serial sections from the tomogram shown in (A) that demonstrates the complicated nature of intercisternal connections that contain albumin. Bar: 90 nm.
Figure 6 with 2 supplements
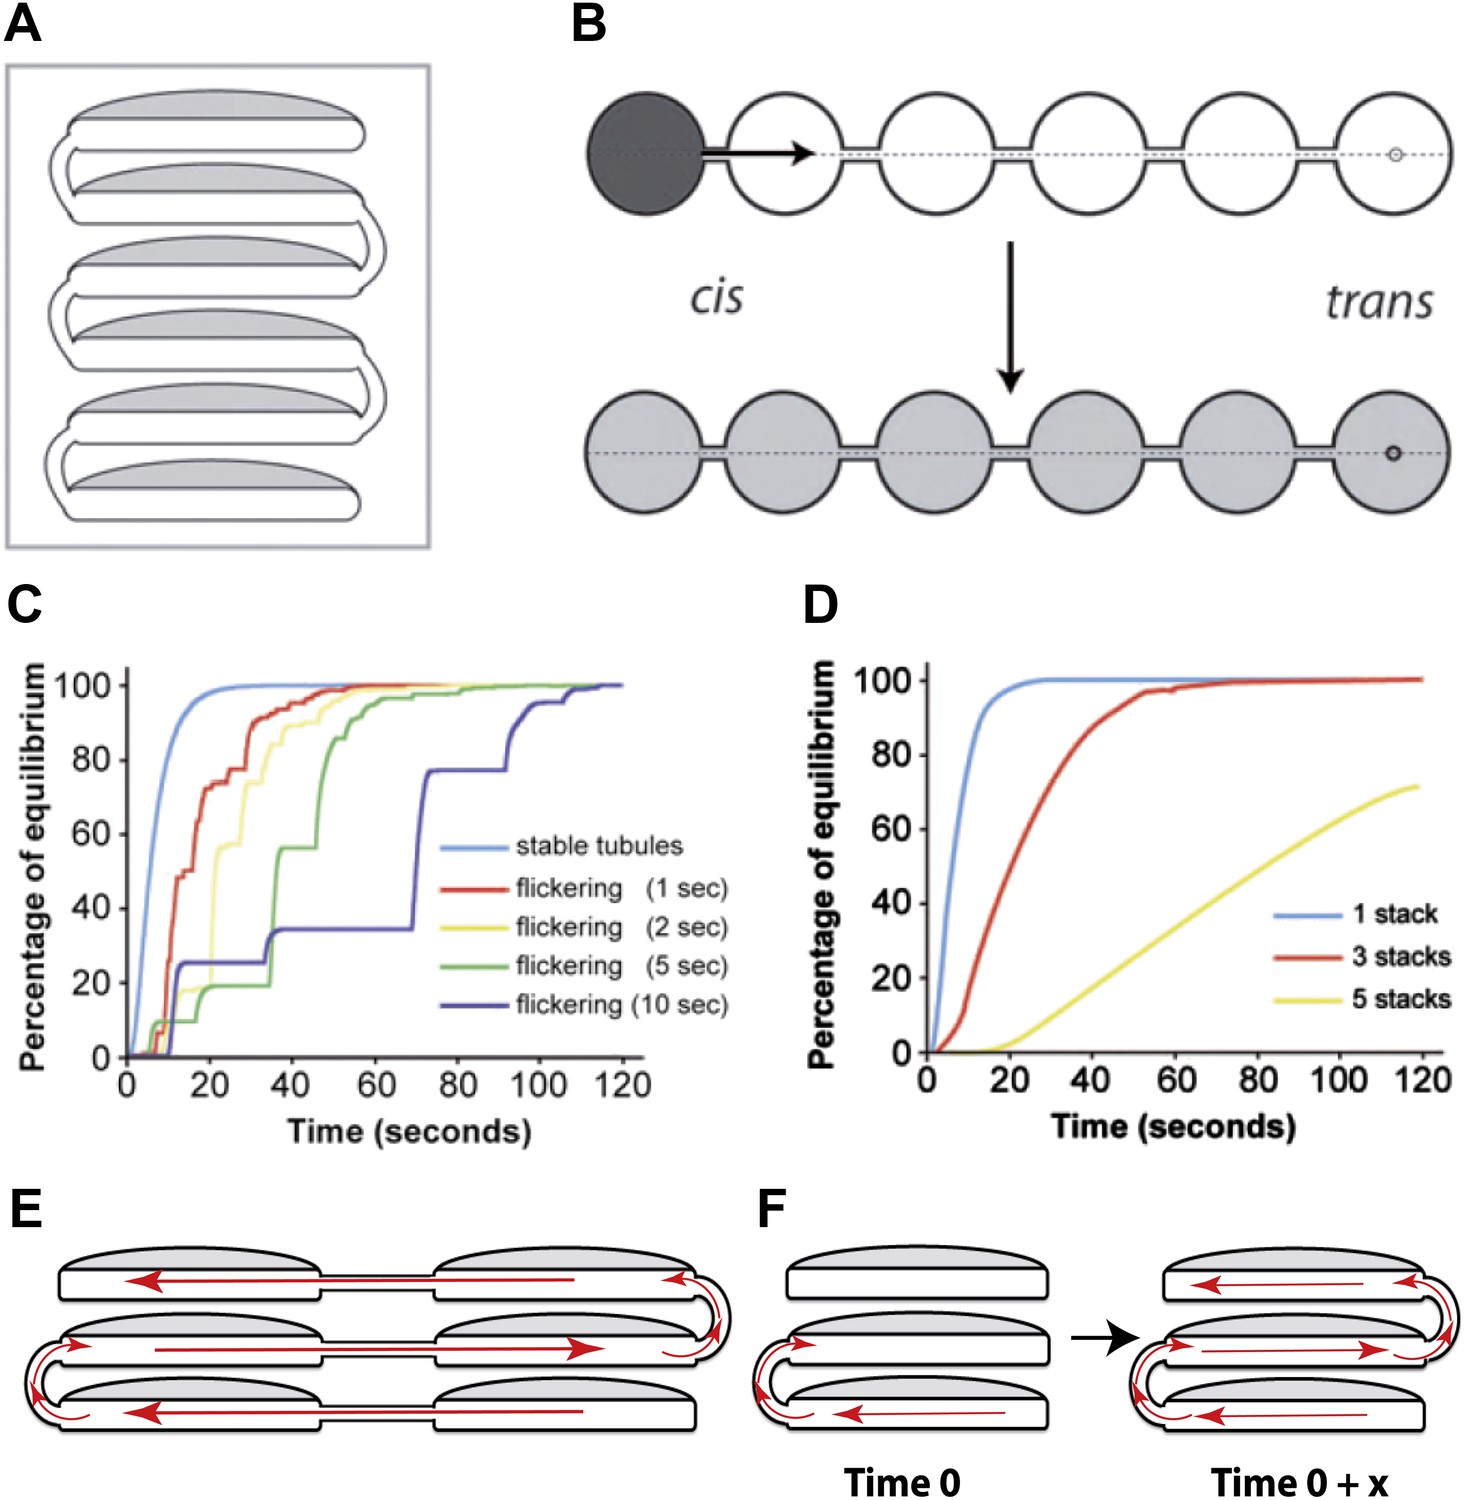
Computational simulations of intra-Golgi transport of albumin by diffusion via intercisternal tubules.
(A) The Golgi stack was modeled as a system of six circular cisternae connected in series by five (one per pair of cisternae) vertical cylindrical tubules. (B) The same stack drawn in a ‘distended’ disposition. The size of the cisternae was set to 1.5 μm diameter and 30 nm thickness, and the diameter and length of the tubules to 30 nm and 100 nm, respectively. The simulations started with the first cisterna (cis) filled with albumin (black shading) and all of the others empty (no shading). Albumin was then allowed to diffuse through the connections until it asymptotically reached equilibrium (gray shading in all cisternae). The variations with time in the albumin concentrations in the other cisternae were calculated for the center of the cisternae (see below). For wider tubule diameters of 60 nm and 120 nm, the 90% threshold of equilibrium was reached after 7.8 s and 6.8 s compared to 14.9 s for the 30 nm diameter. For shorter and longer tubules of 30 nm diameter with 50 nm and 150 nm lengths, the 90% threshold of equilibrium was reached after 11.4 s and 19.1 s. When assuming a system composed only of four circular cisternae, the 90% threshold of equilibrium in the fourth cisternae was reached after 3.4 s (60 nm diameter, 100 nm length) and 3.0 s (120 nm diameter, 100 nm length) compared to 6.4 s for the 30 nm diameter tubules. For shorter and longer tubules of 30 nm diameter with 50 nm and 150 nm lengths, the 90% thresholds of equilibrium were reached after 5.0 s and 8.4 s. (C and D) Time-courses of the equilibration process with different Golgi configurations and with stable or transient (flickering) intercisternal tubular connections. (C) One stack of six cisternae connected by one stable tubule per pair of adjacent cisternae (five connections in all), or by one transient tubule per pair of adjacent cisternae. The tubules were set to be open for 50% of their time, with equal average open and closed times as indicated. In these simulations, the individual tubules opened and closed randomly. (D) Simulation of diffusion based albumin transport in Golgi ribbons of one (blue), three (red), or five (yellow) stacks (each with 6 cisternae). The ribbons were completely connected horizontally by tubules joining adjacent cisternae. The total number of connections was five in all cases. For instance, the three-stack ribbon had one or two connections per stack. Nevertheless, complete equilibration was reached in less than 60 s. (E) Possible diffusion route of a soluble cargo through the Golgi ribbon with three stacks where the longitudinal tubules connecting the isolated stacks compensate for the vertical connectivity gaps. (F) Diffusion of a soluble cargo across a stack through transient intercisternal tubules.
Figure 6—figure supplement 1
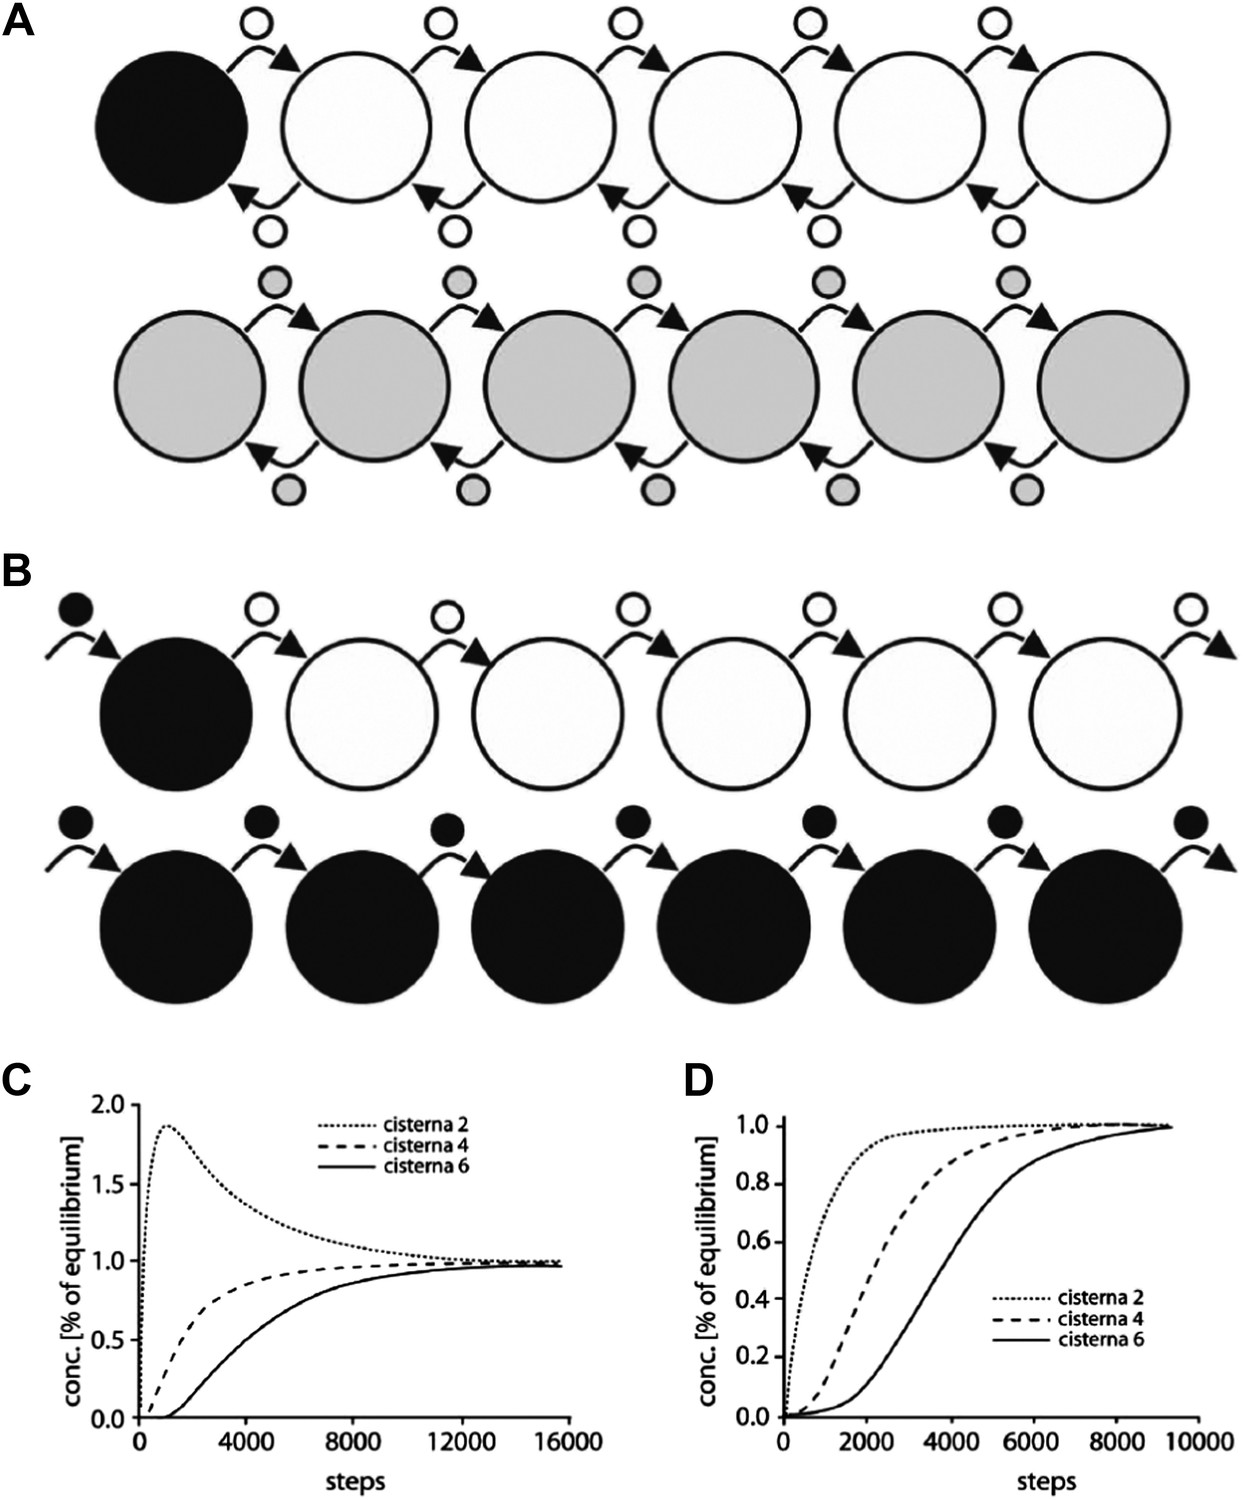
Computational simulation of the intra-Golgi equilibration of albumin argues against the classic vesicular transport model.
To simulate albumin transport as mediated by vesicles traveling between adjacent cisternae, the geometry of the Golgi cisternae was set to the same parameters as in the standard configuration used for the diffusion model (see Figure 6). Each stack contained 4 to 6 cisternae, each with a diameter of 1.5 microns and a thickness of 30 nm. The vesicles were spherical, with a diameter of 50–70 nm. The simulations started with only the first cisterna filled with albumin (black), and all the others empty (white). Albumin transport is considered to proceed stepwise, where each step is defined as one vesicle detaching from each cisterna and fusing with an adjacent one. The albumin concentration in the vesicles is always assumed to be the same as in the cisterna from where they originated. The albumin concentration in the various cisternae is expressed as a function of the numbers of steps (per cisterna, as defined above). Two scenarios were considered. (A) In the first, cargo is exchanged between the neighboring cisternae by anterograde as well as retrograde vesicles. This means that the first and last cisternae exchange one vesicle each at every step, while the other cisternae exchange two vesicles. This is required for the cisternal volumes to be kept constant. In this simulation, 50% and 90% equilibrium were reached after 3948 and 8846 steps per cisterna, respectively (for comparison, 282 and 933 steps are required for 50% and 90% equilibrium across only two cisternae). For larger vesicles with diameters of 60 nm and 70 nm 90% equilibrium is reached with fewer steps (5119 and 3224, respectively). However, experimental observations indicate a range of vesicle diameter from 50 nm to 70 nm, so for our calculations described below we considered the vesicle diameter to be 60 nm. (B) The second scenario represents the steady-state situation where only anterograde transport vesicles are considered. Here, in each step, one vesicle detaches from each cisterna and fuses with the next one. The volume constancy of the system is maintained by a vesicle coming into the first cisterna at each step (containing the same albumin concentration as the first cisterna), and by an identical vesicle exiting the last cisterna. Here, 50% and 90% equilibrium are reached after 3785 and 6474 steps using 50 nm diameter vesicles (compared to 563 and 1865 steps for only two cisternae). (C and D) Changes in albumin concentration in cisternae 2, 4, and 6, expressed as fractions of the concentrations in the same cisterna at equilibrium, as a function of the number of steps, for the scenarios in A and B, respectively. All these simulations were performed using the MATLAB software and the script Skript3_Golgi_vesicular_transport.m is provided as supporting material.
Based on the above numbers, the model (scenario ‘a’ is considered here and the results are similar also with scenario ‘b’) predicts that close to 5119 vesicle budding/fusion steps per cisterna are required for 90% equilibration of albumin across the stack, considering 60 nm diameter vesicle, 6 cisternae per stack and the concentration of albumin in vesicles as same as that of the cisterna. Our own observations indicate that the concentration of albumin in the vesicles is 20% of that present in cisterna (see Figure 5), so approximately 25,000 steps per cisterna are needed for 90% equilibration of albumin across the stack. Since such equilibration happens in less than 2 min (we consider 2 min here, for simplicity), each cisterna has to bud (and fuse with) close to 12,500 vesicles per min or about 200 per s. Based on these numbers one can calculate the turnover of a cisternal rim assuming that: (A) the diameter of an ‘ideal’ cisterna in the mammalian Golgi to be 1500 nm, and therefore the perimeter of the cisterna to be approximately 4700 nm, and, (B) vesicles are formed from the whole perimeter (or rim) of the cisterna, then a maximum of 78 vesicles of 60 nm diameter (4700/60) can bud from the rim of each cisterna at any given time. Thus, the budding (and fusing) of 78 vesicles can be considered one event of turnover of the cisternal rim. Thus, a rim, in order to produce 12,500 vesicles per min, has to turnover (12,500/78) 160 times per min i.e., once every 400 ms, or in other words, the rim turns over 2.5 times per second. On varying the diameter of the vesicle from 50 to 70 nm this value ranges from 4 to 2 times per second for a stack with 6 cisternae (see Table 2 for the results of these calculations). Since the typical Golgi of the HeLa cells that we used for live imaging studies contained 4 cisternae, we also simulated vesicle-mediated transport across such a Golgi. Based on the results of this simulation described earlier, the calculated turnover rate of cisternal rims varies between 2 and 1 times per second for a stack with 4 cisternae (see Table 2). Thus for a range of parameters used for the simulation (variations in number of cisterna, vesicle diameter and bidirectional or unidirectional vesicle transport), the calculated turnover time of a cisternal rim ranges between 250 and 1000 ms (see Table 2) i.e., turnover of the cisternal rims ranges from 4 to 1 times per second.
Regardless of the mode of intra-Golgi transport, if we match these numbers with published observations about the Golgi, we can then ask whether this vesicle-based turnover rates are possible/realistic or else. Actually, there are a few experimental observations, which, in the light of these calculations, indicate that a role of vesicles in albumin transport is not tenable:
1) One is qualitative and is about the images of budding/fusing vesicles in Golgi stacks observed by electron microscopy. Thus, if each cisternal rim generates 200 vesicles (and fuses with 200 vesicles) per second then one would expect to see signs of this enormous budding and fusion activity at the cisternae. This is, however, clearly not the case. The Golgi cisternae look rather 'quiet', with fairly rare images of budding or fusion.
2) Another observation is quantitative and is based on the association-dissociation rate of the Arf/COPI complex at the Golgi in living cells. The life cycle of a COPI-dependent vesicle is schematically comprised of the following steps: exchange of GDP/GTP on Arf, association of Arf-GTP and COPI with the membrane of cisternal rims, budding, fission, and uncoating of the vesicle (which is initiated by GTP hydrolysis on Arf and the consequent dissociation of Arf from the vesicle membrane), and then docking and fusion of the vesicle with the next cisterna. At the uncoating stage, Arf and COPI are shed from the vesicle and become cytosolic. Thus, the on- and off-rate of Arf/COPI at the Golgi (or at least of the portion of Arf/COPI that is involved in forming vesicles at the rims) should reflect the overall turnover of the vesicles. Hence, if the rimmal membrane turns over (i.e., turns into vesicles and fuses with an equivalent number of vesicles) 2.5 times per second, then the portion of Arf/COPI coat that is located at the rims should cycle, i.e., detach from (and attach to) the rim membrane at the same rate, namely, 2.5 times per second. As noted, these considerations are valid only for the fraction of Arf and COPI that participate in vesicle formation at the rim, rather than for the total Golgi Arf and COPI pool; however, the available evidence indicates that a sizable fraction of the Golgi-associated Arf/COPI is located at the cisternal rims (Oprins et al., 1993; Weidman, 1995). Hence, a substantial portion of the Golgi-associated Arf/COPI pool would be predicted by the vesicular model of albumin transport to associate with and detach from the rimmal membrane 2.5 times per second. Hence, the vesicular model of albumin transport predicts that a substantial portion of Golgi-associated Arf/COPI pool would associate with and detach from the rimmal membrane 2.5 times per second.
The rate of association/dissociation of Arf and COPI with/from the Golgi complex has been measured in living cells by FRAP and FLIP video microscopy (Presley et al., 2002), and its value has been used as a descriptor of the molecular process of Arf and COPI binding to, and dissociating from, the Golgi membrane (Presley et al., 2002). It turns out that the Arf/COPI dissociation/association rate at the Golgi is mono-exponential with a half time of 15 s for Arf and 35 s for COPI, and that similar values apply to the dissociation of Arf/COPI in the presence of BFA (Presley et al., 2002). These rates are orders of magnitude slower than those predicted by the vesicular model of albumin transport (notably, the process underlying these slow rates remains unclear [Presley et al., 2002]). Hence, the major fast cycling subpopulation predicted by the vesicular model of albumin transport is not detected. We conclude that this subpopulation of Arf and COPI does not exist, and that the vesicular model of albumin transport is incompatible with the available data.
These data and arguments rule out, or at least strongly militate against, the possibility that Golgi vesicles turn over fast enough to mediate the rapid intra-Golgi transport of albumin. A further consideration that argues against a vesicular turnover rate as fast as that predicted by the vesicular model of albumin transport is based on the comparison between this predicted rate and the rate that is experimentally observed for the formation of other coated (e.g, clathrin- or COPII-coated) vesicles, in other cellular locations. The rates of formation of these vesicles (Thor et al., 2009) (Steinman et al., 1976) and even of synaptic vesicles at one of the fastest brain synapses (Fernandez-Alfonso and Ryan, 2006), are order of magnitudes lower than those predicted by the vesicular model of albumin transport. Such a difference, while formally possible, would be quite surprising.
Given the above considerations, we conclude that the most parsimonious interpretation of the data is that the bulk of the trafficking of albumin through the Golgi is mediated not by the vesicles but by intercisternal tubules.
Figure 6—figure supplement 2
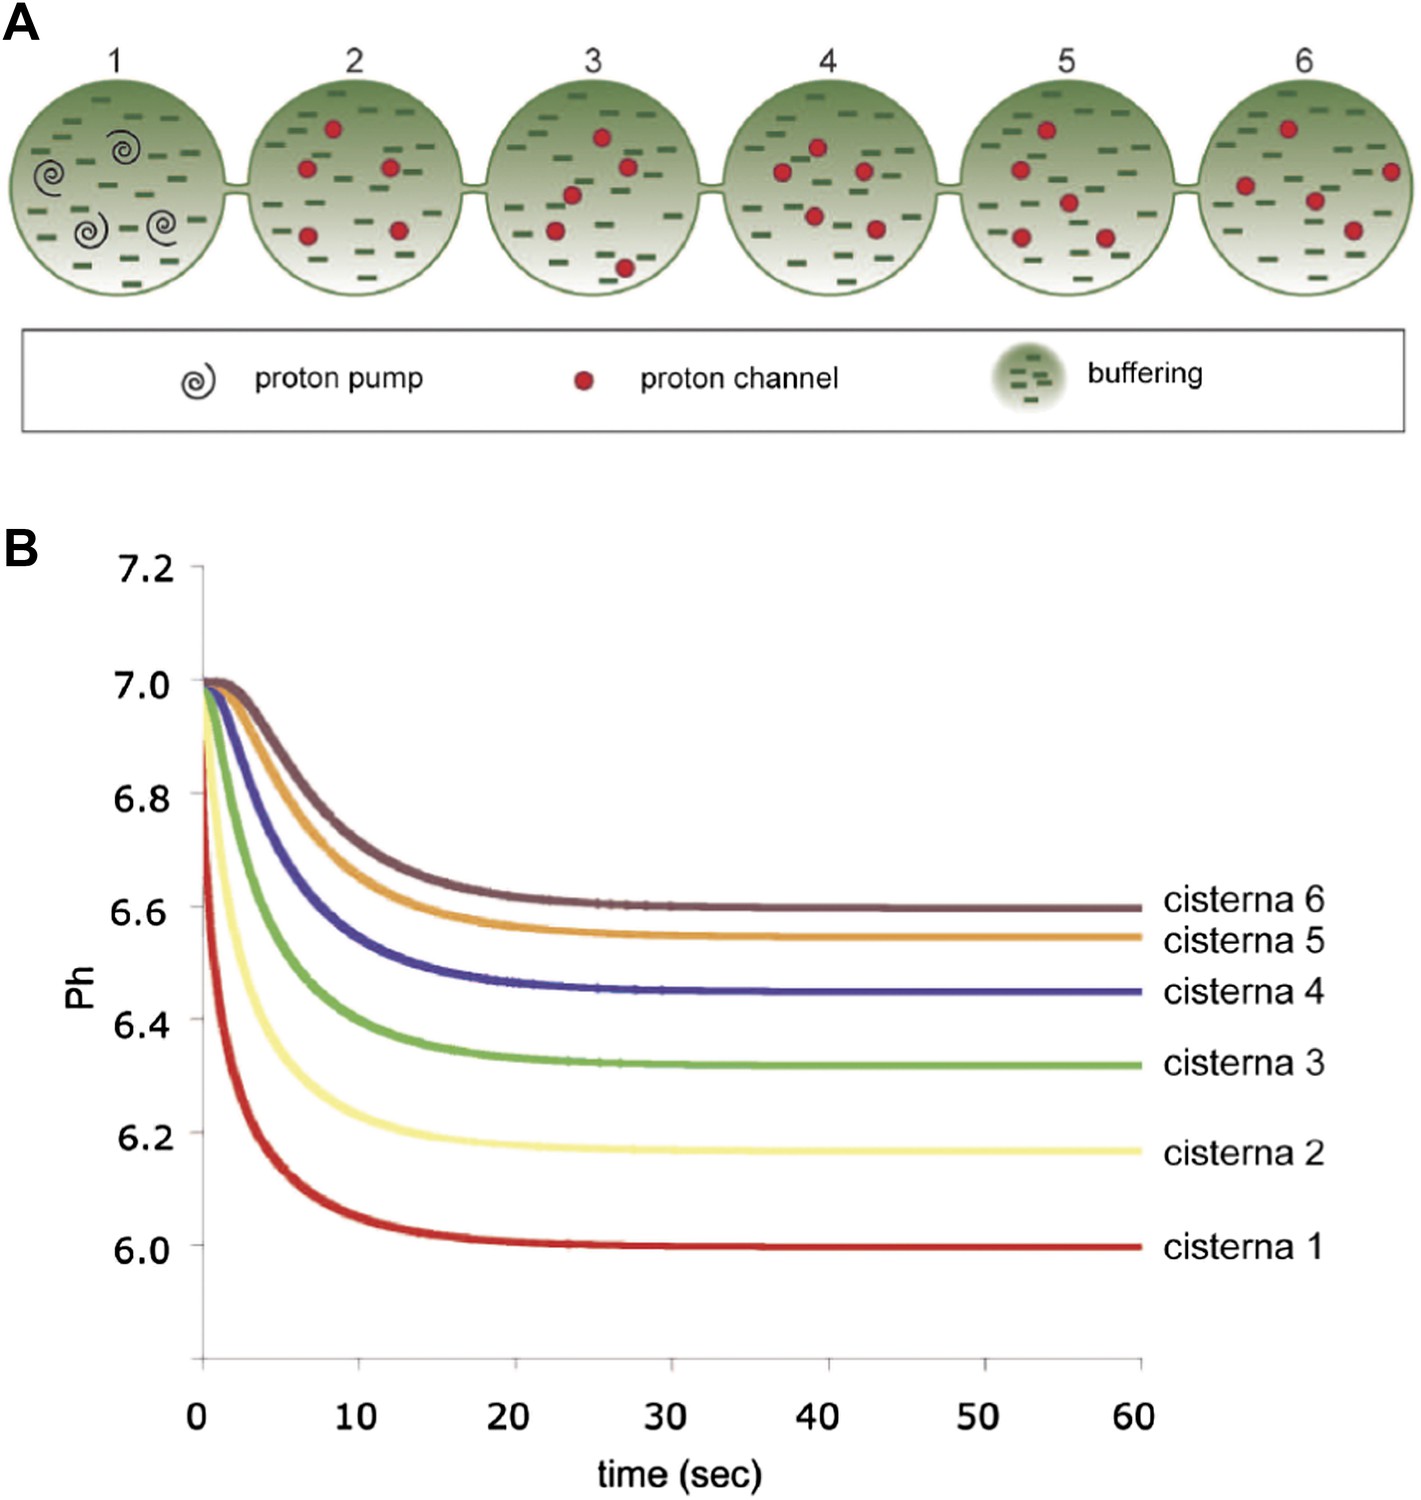
Computer-simulated model of the formation of a pH gradient between continuous cis- and trans-Golgi cisternae.
(A) The model is based on three proton-handling components in the stack (the size and geometry of which are as defined in the legend to Figure 6): proton pumps located in the trans-most cisterna (cisterna 1: swirls), proton channels located in all of the other cisternae (cisternae 2–6: red circles), and a proton buffering system (made up of proteins and/or lipids; dashes) that decreases the diffusion coefficient of protons moving through the system. For modeling, the initial luminal pH was set to be identical to the cytosolic pH (set at 7.0). When the pumps start working (activity of pumps: 10 protons/s in total; modeled on four pumps), the proton concentration in the lumen of the trans-most cisterna (cisterna 1) starts increasing locally. Protons then start diffusing towards the cis-Golgi pole (cisterna 6). Their diffusion is slowed down by the proton buffering system (proteins and lipids). The diffusion coefficient for protons here is set to 10 µm2/s (for comparison: diffusion coefficient for protons in bulk water is 9.3 × 103 µm2/s [Pines et al., 1988]). Moreover, as the protons move, they encounter the proton channels present in cisternae 2 to 6, through which they can leak out into the extra-luminal space, resulting in a pH gradient across the Golgi stack. The rate of leakage is assumed to be linearly dependent on the difference between the proton concentrations in the lumen and in the cytosol (zero leakage for an internal pH of 7.0, and a leakage of 1.4 protons/s/channel for an internal pH of 6.0; the model assumes two channels per cisterna). The energy needed to generate the gradient comes from the ATP consumed by the proton pumps. The steepness and shape of the gradient depend on the interplay among these three defined proton-handling mechanisms. (B) Time-course of generation of steady-state pH in the cisternae according to this model (final pH of cisternae 1 to 6: 6.00, 6.17, 6.32, 6.45, 6.55, 6.60). (Assuming a diffusion coefficient of 100 µm2/s would result in a proton pump rate of 100 protons/s and a leakage rate of 14 protons/s at an internal pH of 6.0, and the time scale in the Figure would range from 0 to 6 s. The final pH values would not change.)
Videos
Video 1
A tomographic reconstruction of the Golgi stack shown in Figure 4.
Scripts used to simulate the transport of albumin across the Golgi stack (Supplement to Figure 6):
Tables
Table 1
Simulated intra-Golgi transport of albumin by diffusion, via intercisternal continuities, occurs in the timescale of seconds
| Length of tubule (nm) | Diameter of tubule (nm) | Number of cisterna | Time needed for 90% equilibration (s) |
|---|---|---|---|
| 100 | 30 | 6 | 14.9 |
| 100 | 60 | 6 | 7.8 |
| 100 | 120 | 6 | 6.8 |
| 50 | 30 | 6 | 11.4 |
| 150 | 30 | 6 | 19.1 |
| 100 | 30 | 4 | 6.4 |
| 100 | 60 | 4 | 3.4 |
| 100 | 120 | 4 | 3.0 |
| 50 | 30 | 4 | 5.0 |
| 150 | 30 | 4 | 8.4 |
-
The size and geometry of the Golgi stack used for the simulations is defined in the legend to Figure 6. The variable parameters used for the simulation are: length of tubules (from 50 to 150 nm), diameter of tubules (from 30 to 120 nm), and number of cisternae (between 4 and 6). The tubules here refer to the intercisternal tubules connecting two cisternae of a Golgi stack. The time needed for 90% equilibration of albumin across the Golgi stack under varying combinations of the indicated parameters was computed. As can be seen from the data, equilibration across the cisternae happens in seconds across all the conditions.
Table 2
Simulated intra-Golgi transport of albumin mediated by vesicles, predicts extremely fast turnover of cisternal rims
| Vesicle diameter (nm) | 50 | 60 | 70 | |||
| Number of cisternae | 4 | 6 | 4 | 6 | 4 | 6 |
| Steps for 90% equilibration | 19,617 | 44,230 | 11,352 | 25,595 | 7149 | 16,120 |
| Rim turnover time (s) | 0.576 | 0.255 | 0.829 | 0.368 | 1.129 | 0.500 |
-
The size and geometry of the Golgi stack and vesicles used for the simulations are defined in the legend to Figure 6—figure supplement 1. The variable parameters used for the simulation are: diameter of vesicles (from 50 to 70 nm) and number of cisternae (between 4 and 6). Albumin transport is considered to proceed stepwise, where each step is defined as one vesicle detaching from each cisterna and fusing with an adjacent one. For the calculations presented here, the albumin concentration in the vesicles is considered to be 20% of that present in the cisterna (see Figure 5 and also legend to Figure 6—figure supplement 1). The number of steps required to achieve 90% equilibration of albumin across the stack was computed and the time required for a single turnover event of the cisternal rim (rim turnover time) was calculated as described in the legend to Figure 6—figure supplement 1. The rim turnover time varied from 0.25 to 1.12 s or in other words, the rim turns over from 4 to 1 times per second, depending on the condition used for the simulation. The results presented here are for the scenario 'a' (discussed in Figure 6—figure supplement 1) and the results are very similar even in the case of scenario 'b'.
Additional files
-
Supplementary file 1
Diffusion of albumin across the Golgi stack stable intercisternal tubules.
- https://doi.org/10.7554/eLife.02009.021
-
Supplementary file 2
Diffusion of albumin across the Golgi stack via flickering intercisternal tubules.
- https://doi.org/10.7554/eLife.02009.022
-
Supplementary file 3
Transport of albumin across the Golgi stack by vesicles.
- https://doi.org/10.7554/eLife.02009.023
Download links
A two-part list of links to download the article, or parts of the article, in various formats.
Downloads (link to download the article as PDF)
Open citations (links to open the citations from this article in various online reference manager services)
Cite this article (links to download the citations from this article in formats compatible with various reference manager tools)
Transport of soluble proteins through the Golgi occurs by diffusion via continuities across cisternae
eLife 3:e02009.
https://doi.org/10.7554/eLife.02009


