The translational landscape of the splicing factor SRSF1 and its role in mitosis
- University of Edinburgh, United Kingdom
- Pfizer/University of Granada/Andalusian Regional Government, Spain
- Universitat Pompeu Fabra, Spain
- Catalan Institution for Research and Advanced Studies (ICREA), Spain
Figures
Figure 1 with 2 supplements
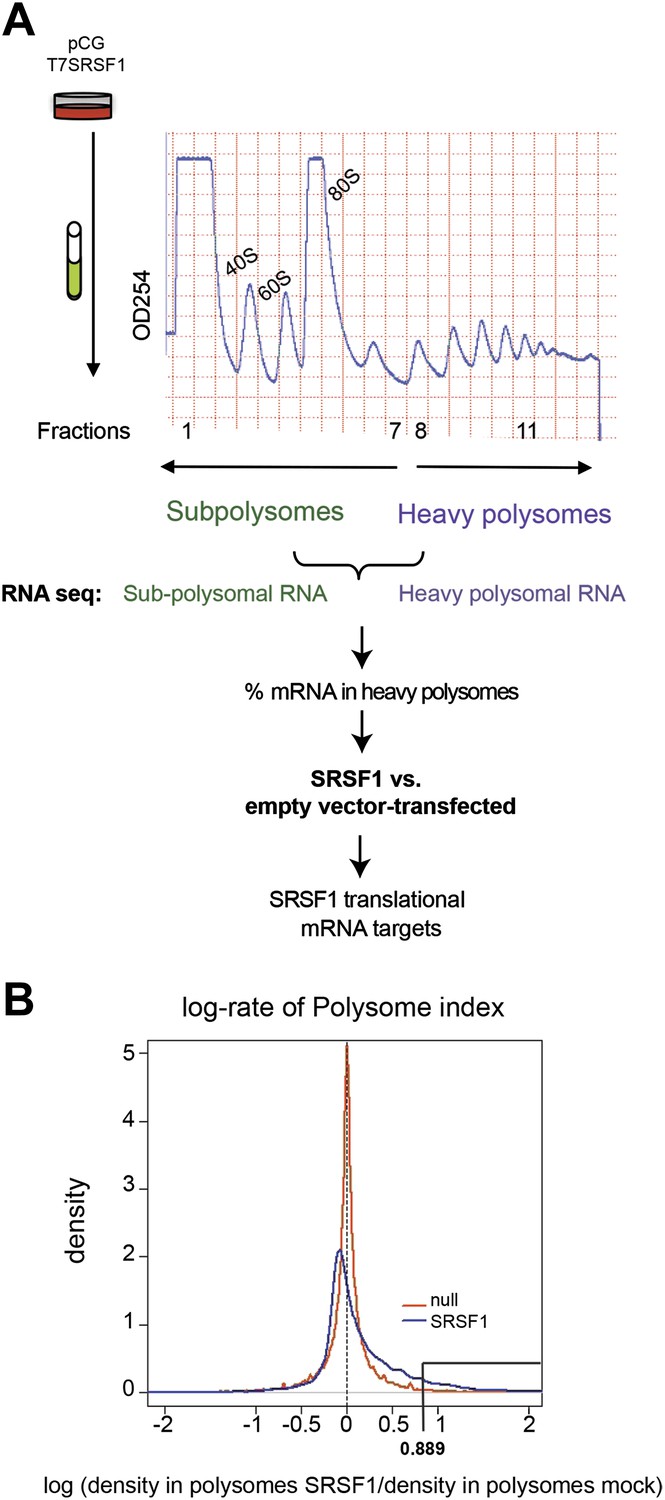
Identification of SRSF1 mRNA translational targets.
(A) Experimental approach to identify SRSF1 mRNA translational targets. A characteristic fractionation profile of empty vector (pCG) and SRSF1 transfected-HEK 293T cells (Figure 1—figure supplement 1) is depicted. Absorbance at 254 nm was monitored. (B) A plot showing the distribution of mRNAs from RNA-seq analysis according to the polysome shift ratio (PSR). The null distribution (comparing two control subsamples) is symmetric and sharply centered at 0. The PSR of SRSF1 versus empty vector shows an enrichment over the null distribution. The mRNAs with a p<0.01 (PSR>0.889) were considered SRSF1 translational targets (Supplementary file 1).
Figure 1—figure supplement 1
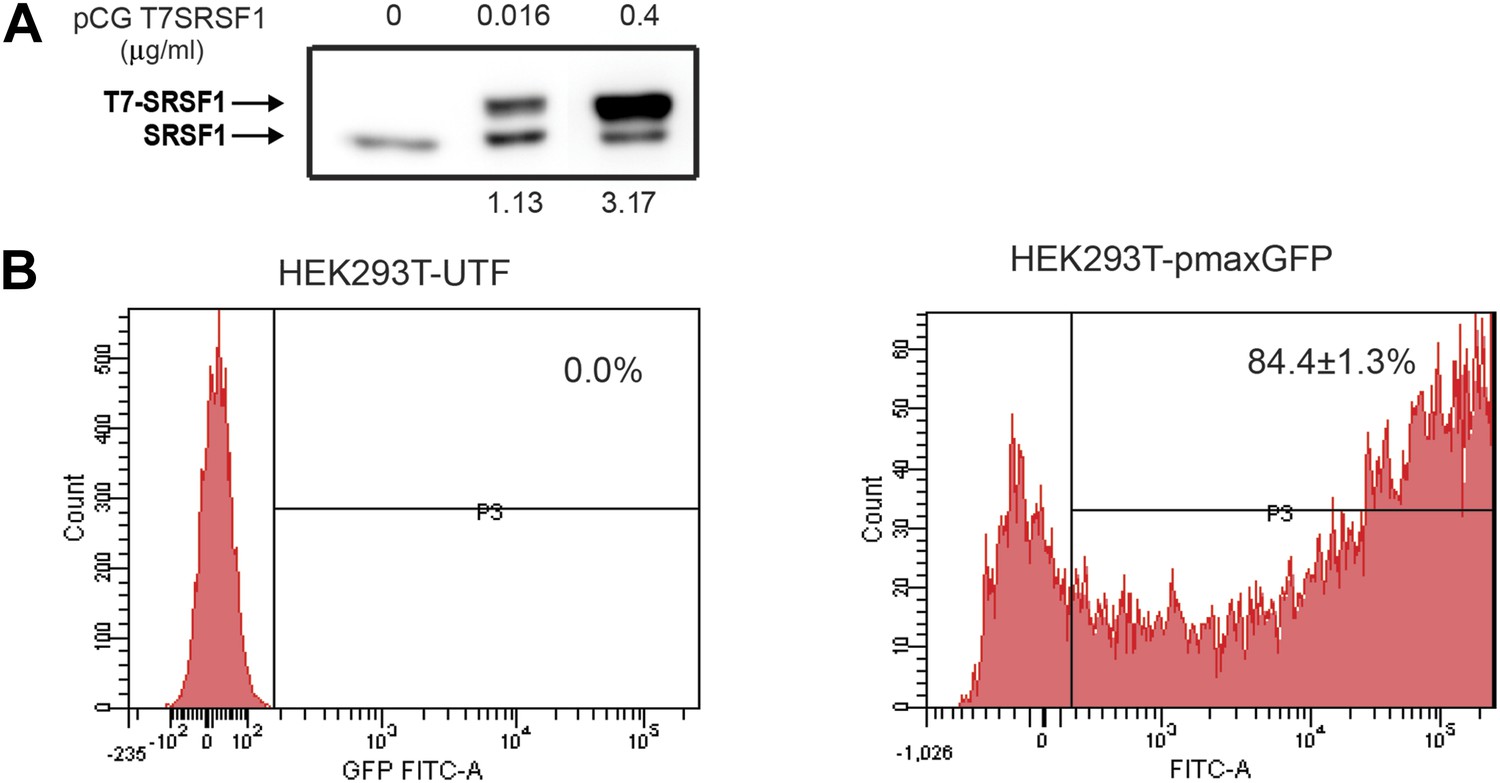
Optimization of SRSF1 transient transfection for polysomal shift analysis.
(A) Western blot analysis showing the levels of overexpressed T7-epitope tagged SRSF1 protein (upper band) compared to the levels of the endogenous SRSF1 protein (lower band). A quantitation of the intensity of the bands is shown below. (B) Evaluation of transfection efficiency in HEK 293T cells by flow cytometric analysis of GFP expression shows that 84.4±1.3% of cells transiently transfected with the pmaxGFP plasmid (right panel) are GFP positive.
Figure 1—figure supplement 2
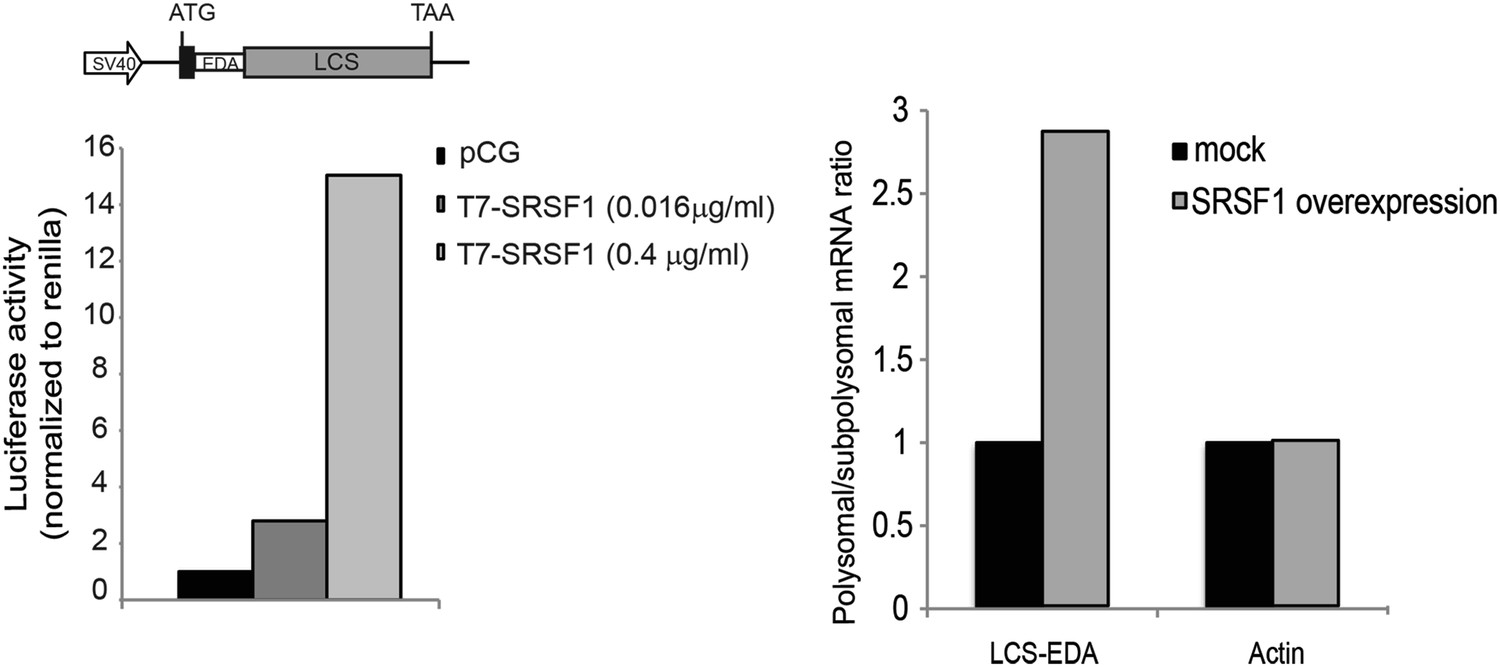
Luciferase reporter containing an SRSF1 binding site.
The fold activation of luciferase activity in SRSF1-transfected cells is plotted relative to empty vector (pCG) control, whose values were set to 1. Two different concentrations of pCGT7-SRSF1 plasmid were used (0.016 and 0.4 μg/ml) (left panel). RT-qPCR showing the polysome to subpolysome ratio for the luciferase reporter mRNA and actin mRNA upon SRSF1 overexpresion (0.4 μg/ml). The polysome to subpolysome ratio is relative to cells transfected with empty vector (pCG) (right panel). EDA: SRSF1-binding site derived from the fibronectin EDA exonic splicing; LCS: firefly luciferase ORF; SV40: simian virus 40 promoter.
Figure 2 with 2 supplements
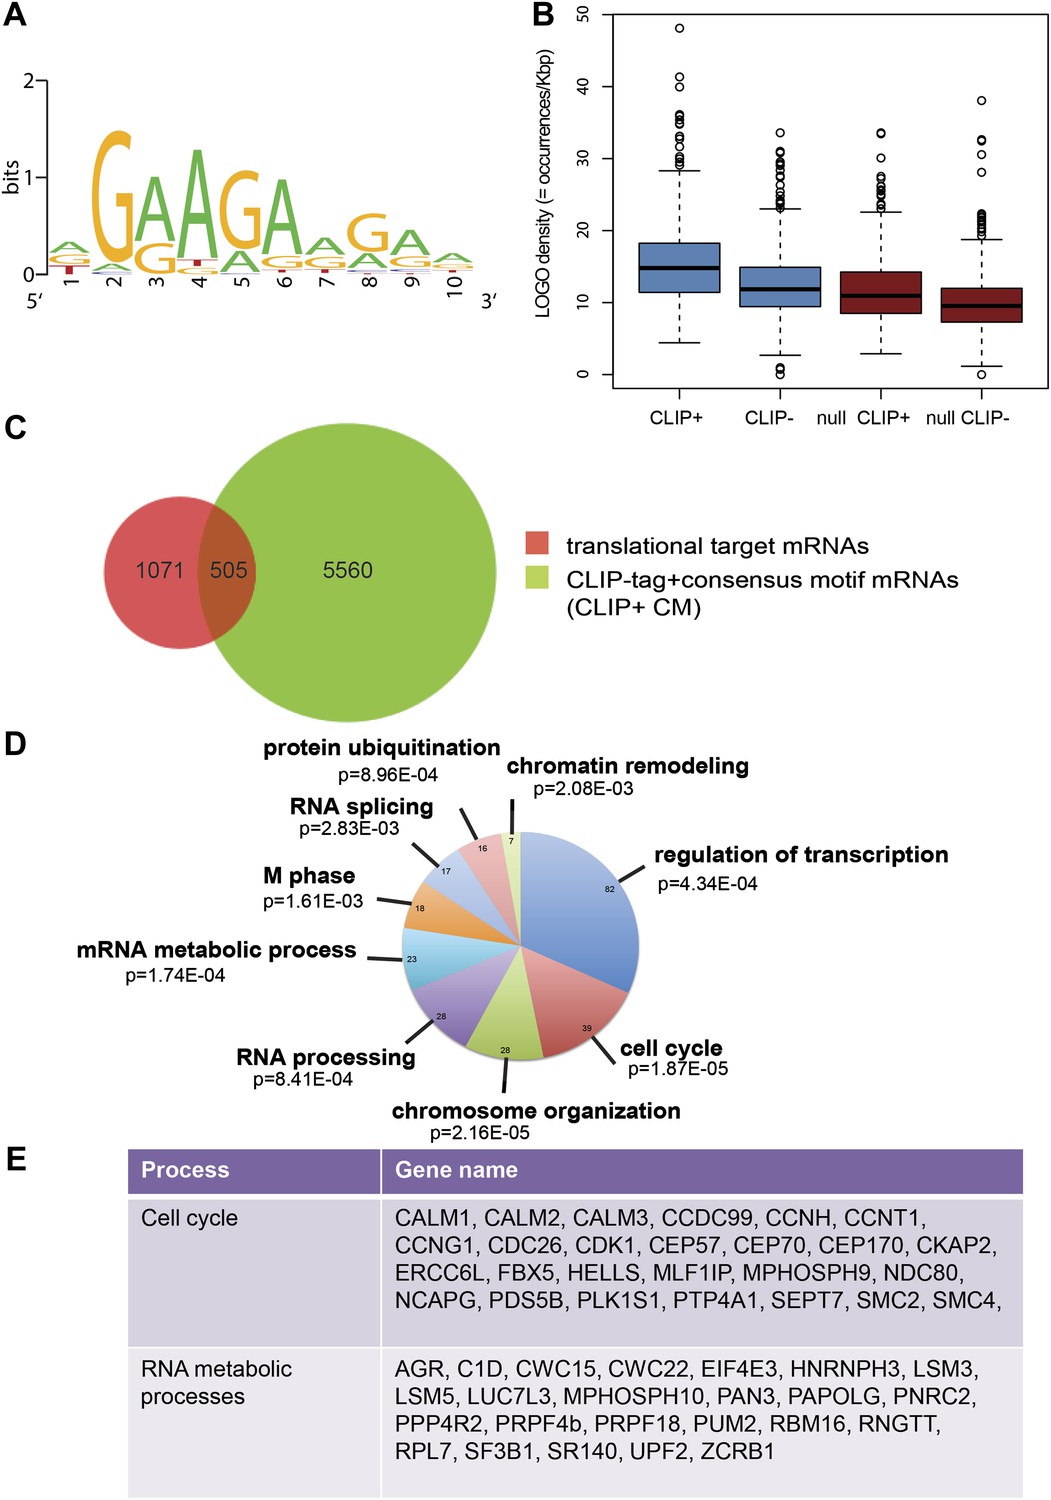
SRSF1 translational targets.
(A) Motif identified on putative direct translational targets using 5-mers enrichment in combination with MEME algorithm (width = 10, sites = 508/508, E value = 1.5E-308, IC = 7.9 bits). Over-represented k-mers were obtained by double comparison CLIP+ versus CLIP− translational targets and CLIP+ translational targets versus null CLIP+. (B) Box plot showing the density of consensus motif (translational targets CLIP+ > translational targets CLIP− > null CLIP+ > null CLIP+). (C) Venn diagram showing the overlap (505 mRNAs) between translational targets (1576 mRNAs with p<0.01) and CLIP-tag mRNAs containing the consensus motif (CLIP+ CM) (6065) (Fisher’s exact test: OR 1.1686; p<2.2E-16. (D) The most representative classes of Gene Ontology terms enriched in direct translational targets (with CLIP-tag and consensus motif [CLIP+ CM]) relative to all the mRNAs detected in HEK 293T by RNA-seq. The number of genes observed in each category is indicated in the pie chart. Modified Fisher’s exact p value, EASE score is given for each category. In all cases, the Benjamini–Hochberg-corrected EASE score was <0.1. (E) Table giving the gene names of SRSF1 translational targets related to cell cycle and RNA processing pathways.
Figure 2—figure supplement 1
Analysis of SRSF1 translational targets.
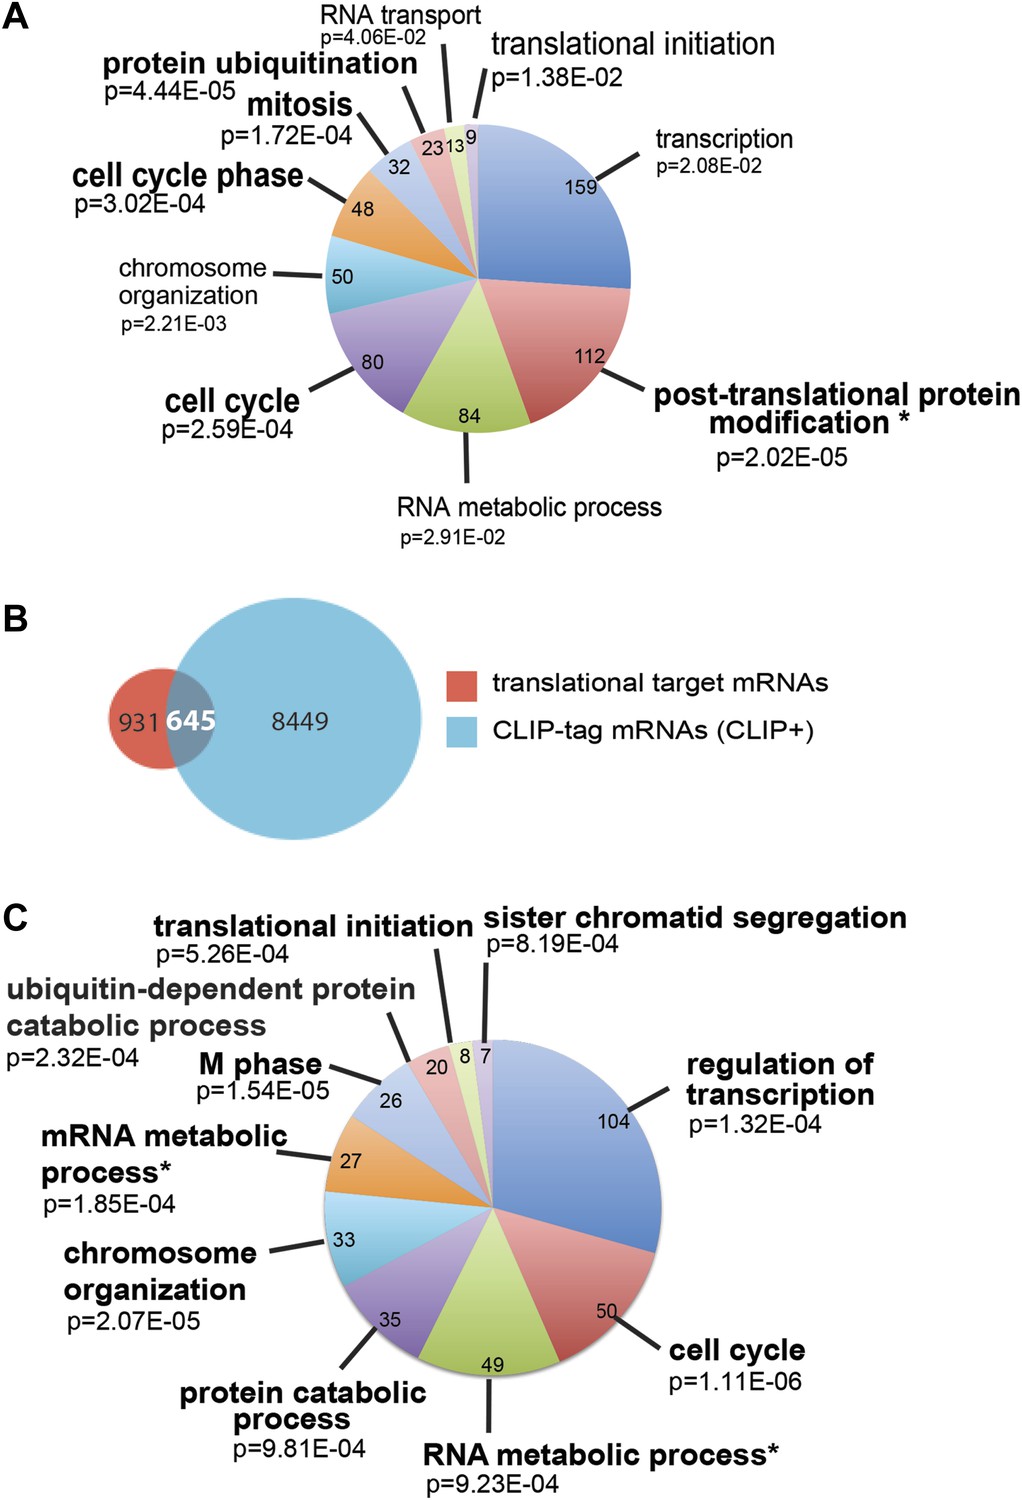
(A and C) The most representative classes of Gene Ontology terms enriched in translational targets (PSR>0.889536; p<0.01) (A) and in the subset of CLIP+ translational target mRNAs (C) relative to all the mRNAs detected in HEK 293T by RNA-seq. The number of genes observed in each category is indicated in the pie chart. Modified Fisher’s exact p value, EASE score is given for each category. The asterisks indicate a Benjamini–Hochberg-corrected EASE score <0.05. (B) Venn diagram showing the overlap (645 mRNAs) between translational target mRNAs identified in the polysomal shift analysis (1576) with mRNAs shown to be bound directly by SRSF1 in a CLIP experiment (9094) (Sanford et al., 2009).
Figure 2—figure supplement 2
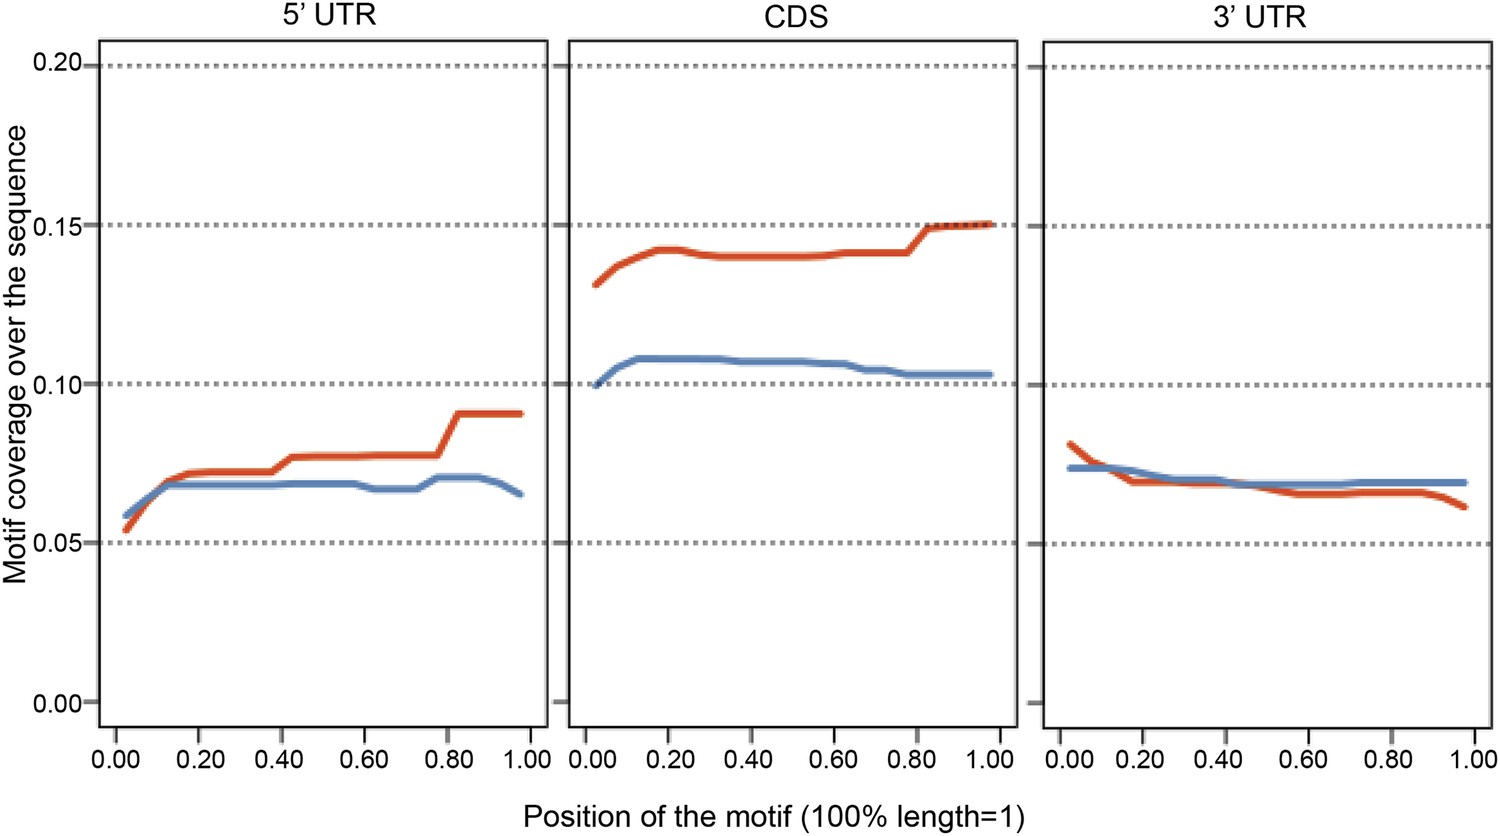
The positional bias of the SRSF1 consensus motif in the 5′UTR, protein coding sequence (CDS), and 3′UTR of SRSF1 translational mRNA targets (red) was compared to the null population (blue, PSR∼0).
One transcript per gene (with the longest 5′UTR) was kept for the analysis. The x axis represents the position of the motif, with each region's length normalized to 1. The y axis represents the density of coverage of motifs over the sequence.
Figure 3
Validation of SRSF1 translational targets.
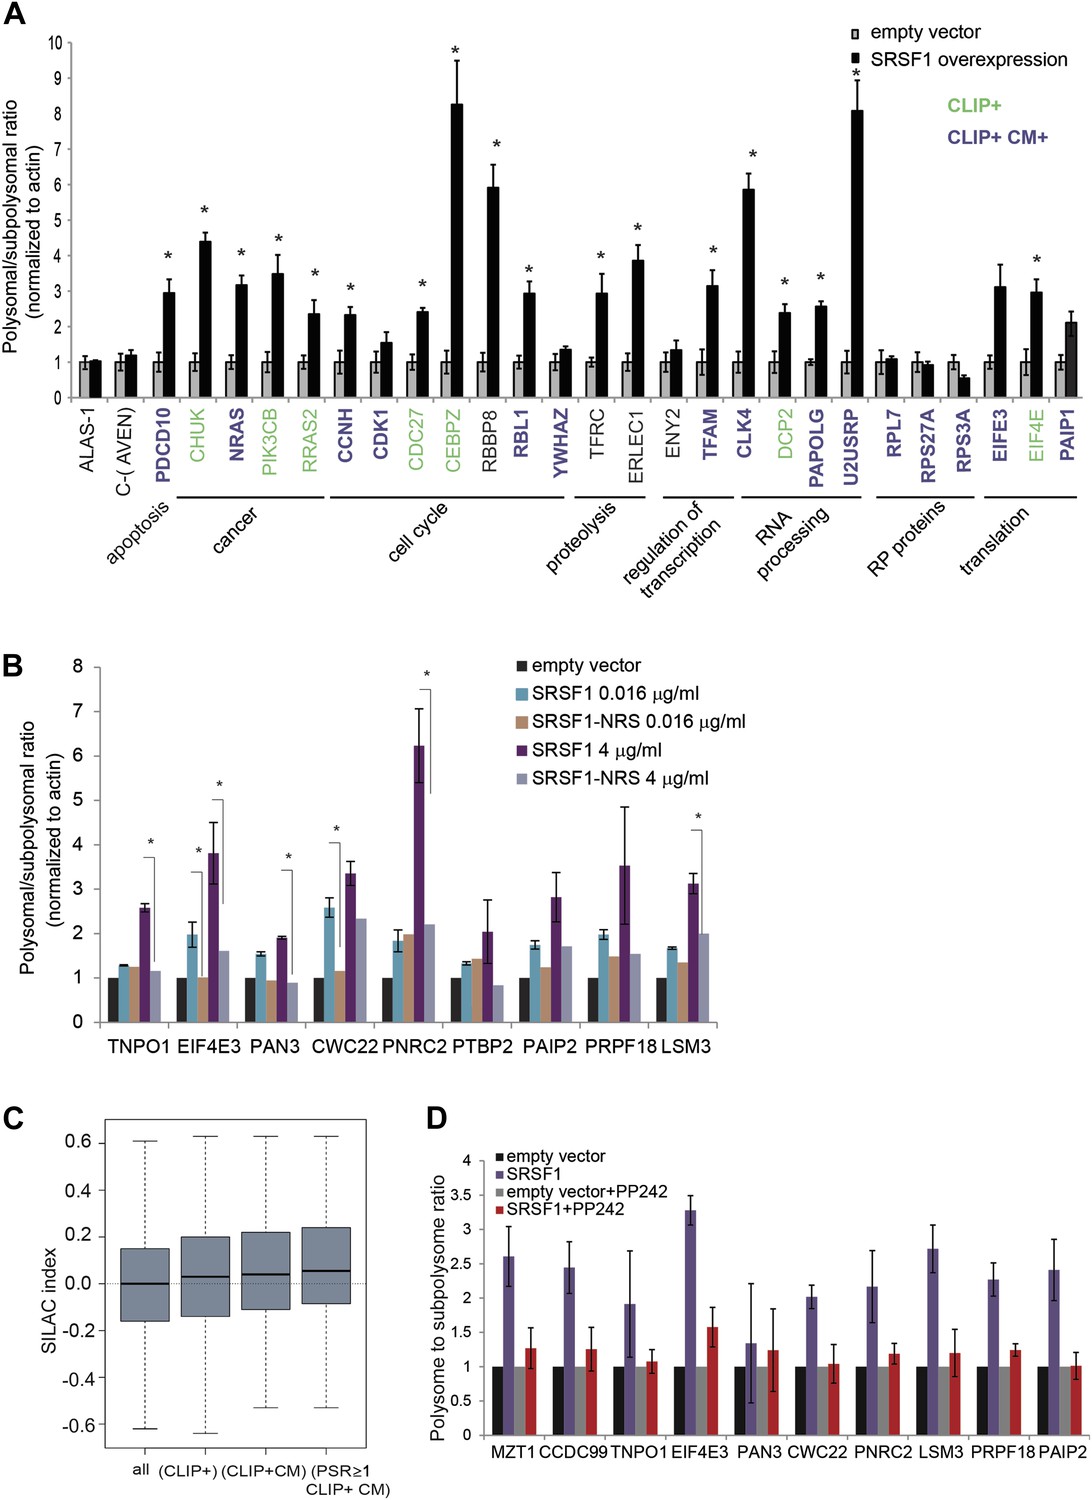
(A) RT-qPCR validation confirms an increased polysome to subpolysome ratio for selected SRSF1 translational targets upon SRSF1 overexpression (CLIP+: green; CLIP+ and harboring an SRSF1 consensus motif (CLIP+ CM+): purple). The polysome to subpolysome ratio is relative to cells transfected with empty vector (pCG) and normalized to actin. Plotted data are the average of three biological replicates. The asterisks indicate statistical significance (p<0.05) Error bars, Gene Ontology terms and cancer relationship are indicated. (B) RT-qPCR validation of SRSF1 translational targets involved in RNA metabolic processes. The polysome to subpolysome ratio as measured by RT-qPCR in empty vector-transfected cells compared to cells overexpressing SRSF1 is indicated. Two different concentrations of pCGT7-SRSF1 plasmid were used. A mutant version of SRSF1 that is constitutively nuclear and does not activate translation was also included (SRSF1-NRS). (C) Box plot showing the values of the stable isotope labeling by amino acids in cell culture (SILAC) index, defined as log2 SRSF1 ratio/empty vector ratio. ‘All’ refers to mRNAs encoding for all the proteins found by SILAC (2471 mRNAs); ‘CLIP+’ refers to the SRSF1 translational targets (PSR>0.889536; p<0.01) harboring CLIP-tag (125 mRNAs); ‘CLIP+CM’ is for direct translational targets (105 mRNAs); ‘PSR≥1, CLIP+CM’ refers to direct translational targets with a PSR≥1 (72 mRNAs) (p = 0.002487). (D) PP242-mediated mTOR inhibition suppresses SRSF1-dependent activation of translation of a subset of mRNA targets. Control and SRSF1-overexpressing cells were treated with PP242 for 90 min. The polysome to subpolysome ratio was measured by RT-qPCR in empty vector-transfected cells compared to cells overexpressing SRSF1 treated with or without PP242. mTOR inhibition was validated by Western blotting (data not shown).
Figure 4
Coupling of alternative splicing and translational regulation.
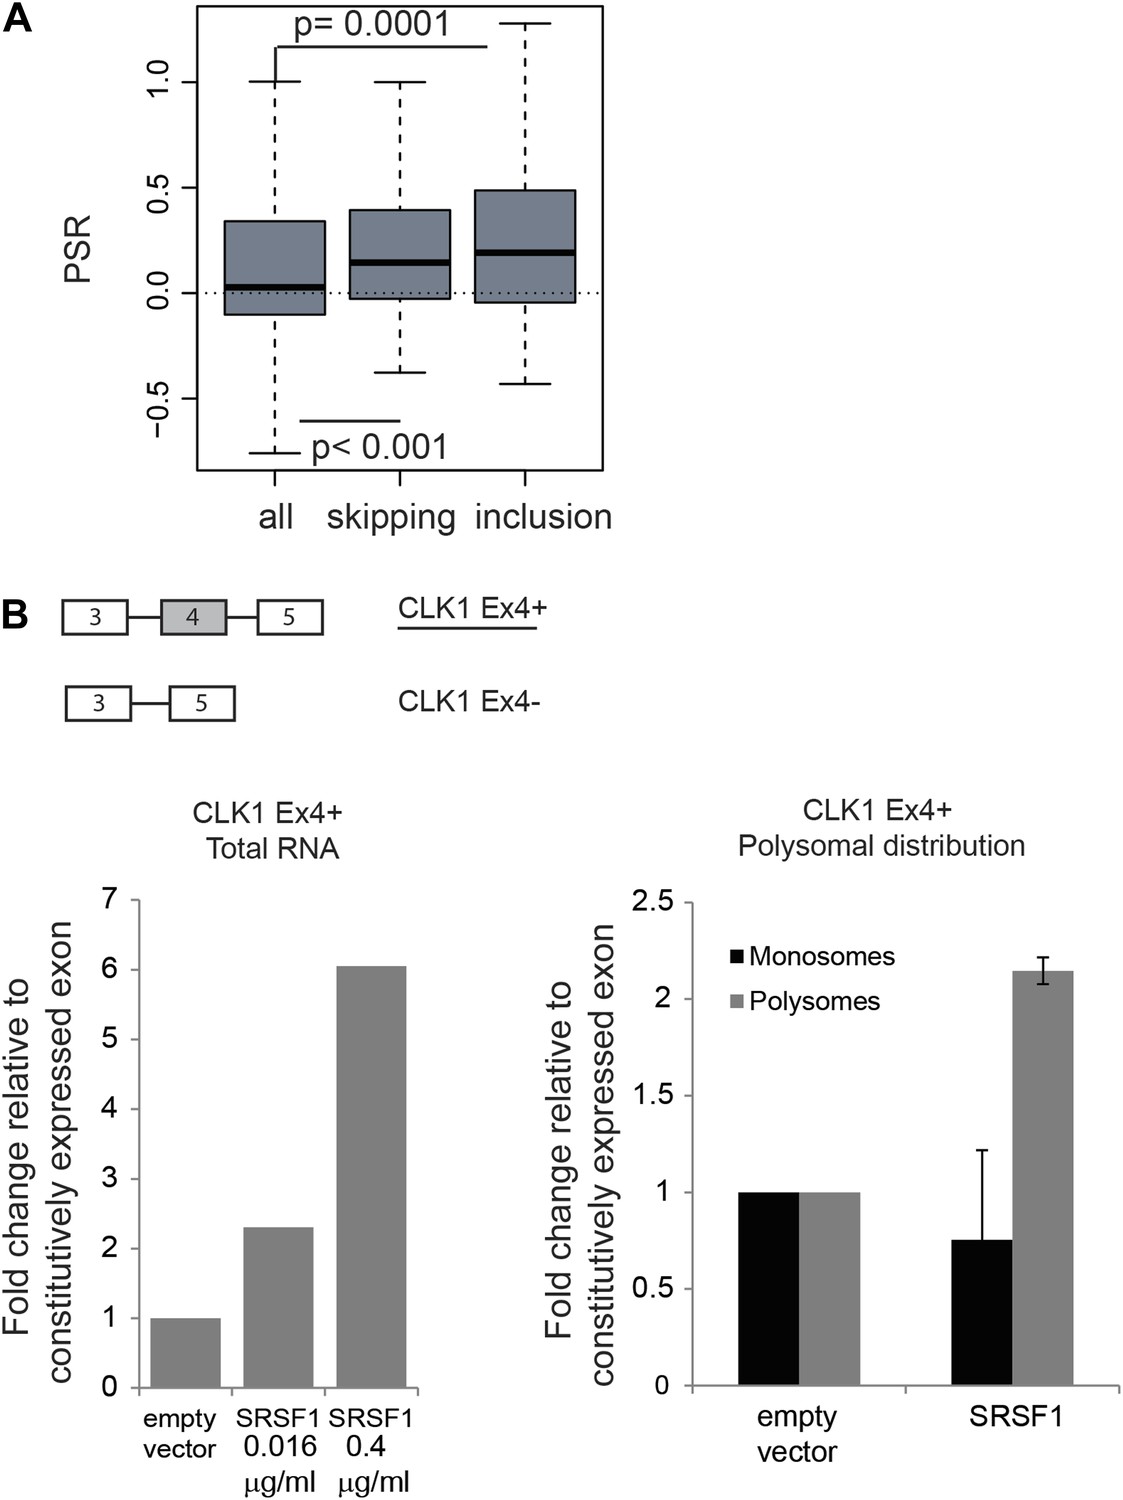
(A) Correlation between SRSF1-induced changes in alternative splicing with polysomal distribution of those isoforms. Changes in alternative splicing induced by SRSF1 overexpression were determined by an exon-junction array. PSR: polysome shift ratio. (B) RT-qPCR analysis of the effect of SRSF1 on CLK1 alternative splicing and preferential polysomal association. The exon-intron structure of both isoforms is indicated (not to scale) and the CLK1 isoform that is an SRSF1 direct translational target is underlined. SRSF1-induced changes in CLK1 alternative splicing were determined and normalized to exon 7 (constitutive exon) levels (left panel). Two different concentrations of pCGT7-SRSF1 plasmid were used. Polysomal distribution of CLK1 mRNA isoforms upon SRSF1 overexpression normalized to exon 7 (constitutive exon) levels (right panel).
Figure 5 with 1 supplement

SRSF1 translational targets involved in cell division.
(A) List of cell cycle proteins regulated by SRSF1 at the translational level (left panel). The cartoon depicting their involvement in chromosome segregation during mitosis was adapted from Kitagawa and Hieter (2001). APC stands for (Anaphase-promoting complex) (B) Validation of cell cycle translational targets. The polysome to subpolysome ratio for a subset of cell cycle-related mRNAs was measured by RT-qPCR in empty vector-transfected cells compared to cells overexpressing SRSF1 or depleted of SRSF1. Two different concentrations of pCGT7-SRSF1 plasmid were used. A mutant version of SRSF1 that is constitutively nuclear and does not activate translation was also included (SRSF1-NRS). The asterisks indicate statistical significance (p<0.05). (C) Western blot validation of selected cell cycle SRSF1 translational targets in empty vector or SRSF1-transfected cells. β-Actin was used as a loading control. (D) Western blot validation of selected cell cycle SRSF1 translational targets in control or SRSF1-depleted cells in an asynchronous (A) or mitotic population (M). Tubulin was used as a loading control.
Figure 5—figure supplement 1
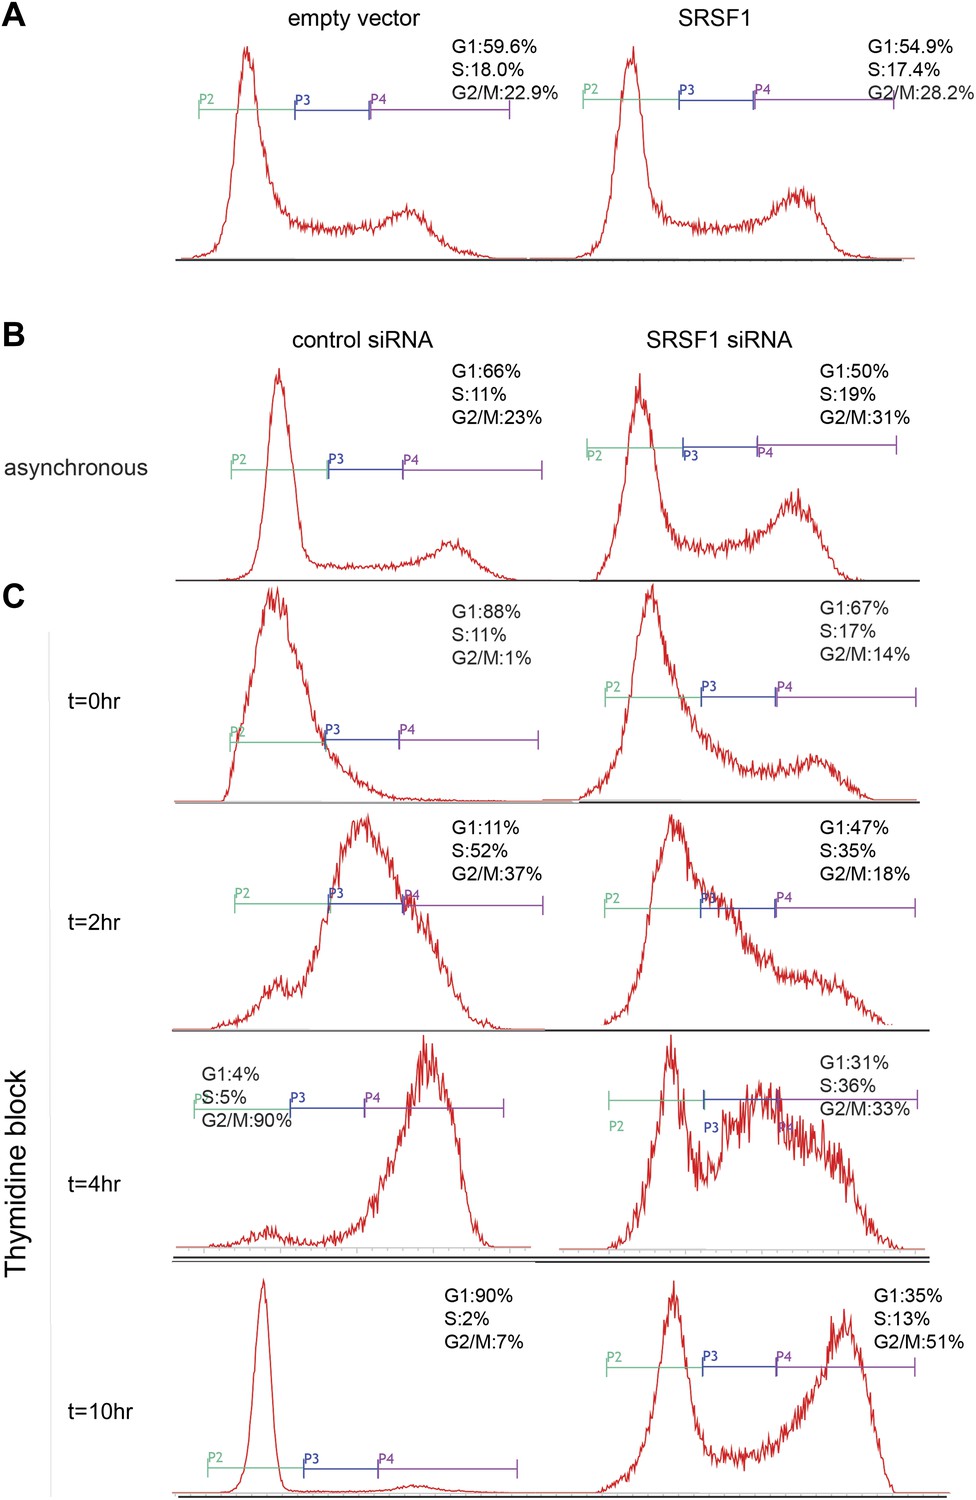
Cell cycle defects following SRSF1 knockdown. (A) Cell cycle distributions of asynchronous control and SRSF1-overexpressing cells were monitored by flow cytometry. (B and C) Cell cycle distributions for control and SRSF1-depleted cells were monitored by flow cytometry in asynchronous cells (B) and in cell cultures synchronized with a double thymidine block following release for 0–10 hr (C).
Figure 6
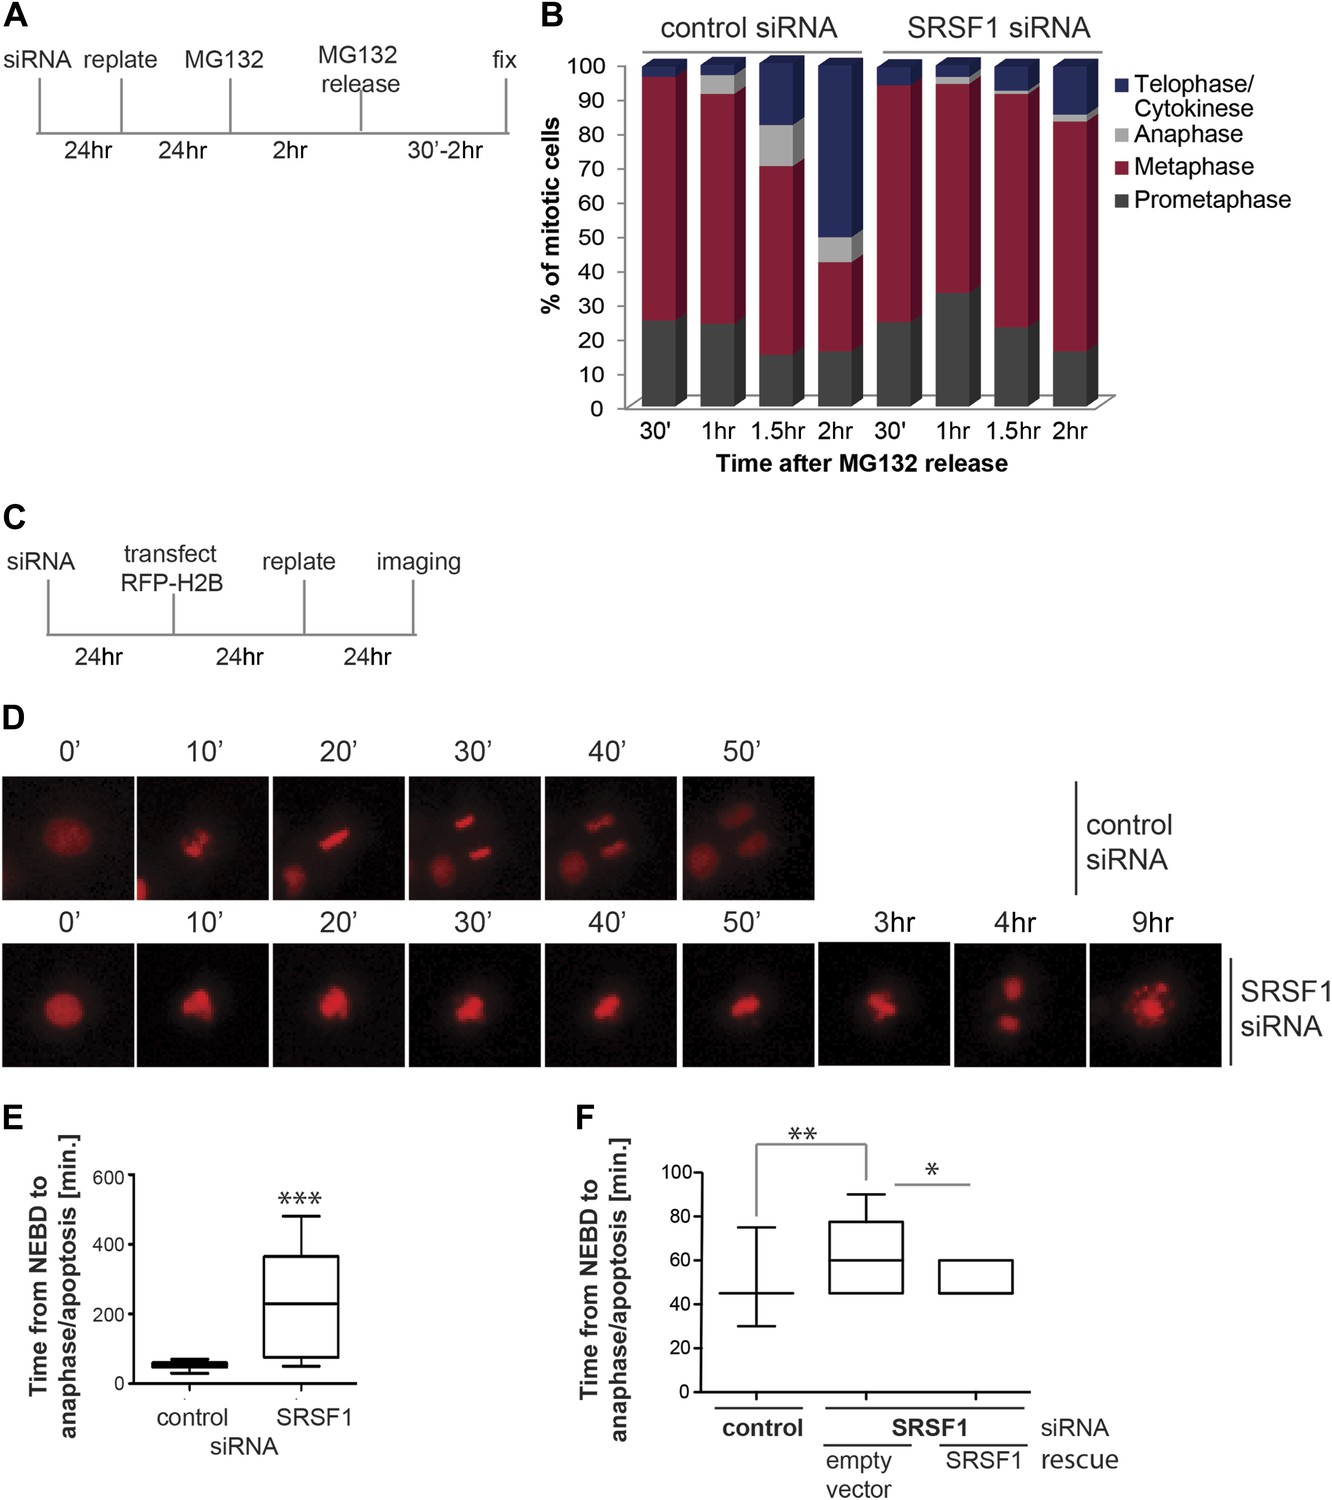
SRSF1 is required for cell cycle progression.
(A) and (C) Schematic representation of the protocols used to assess mitotic progression. (B) HeLa cells were treated as in (A) and the number of cells at different stages of mitosis was determined by classification of images of fixed cells stained for DNA, tubulin, and pericentrin. (D) HeLa cells were treated as in (C) and time-lapse imaging of mCherry-H2B was performed. Images were captured every 15 min over 24 hr at three different positions. Representative images of cells transfected with control siRNA and SRSF1 siRNA are shown. (E) The graph indicates the elapsed time (minutes) from nuclear envelope breakdown (NEBD) or chromatin condensation to the onset of anaphase/telophase or to mitotic cell death. (F) HT1080 cells stably expressing GFP-CENPA were transfected with control or SRSF1-specific siRNA, and 24 hr later cells were retransfected with either empty vector or SRSF1. The next day cells were seeded in six-well plates and time-lapse imaging of GFP-CENPA was performed as in (C). The graph indicates the elapsed time (minutes) from nuclear envelope breakdown (NEBD) or chromatin condensation to the onset of anaphase/telophase or to mitotic cell death. Scale bar is 10 μm. The asterisks indicate statistical significance (*p<0.05, **p<0.01, ***p<0.001).
Figure 7 with 1 supplement
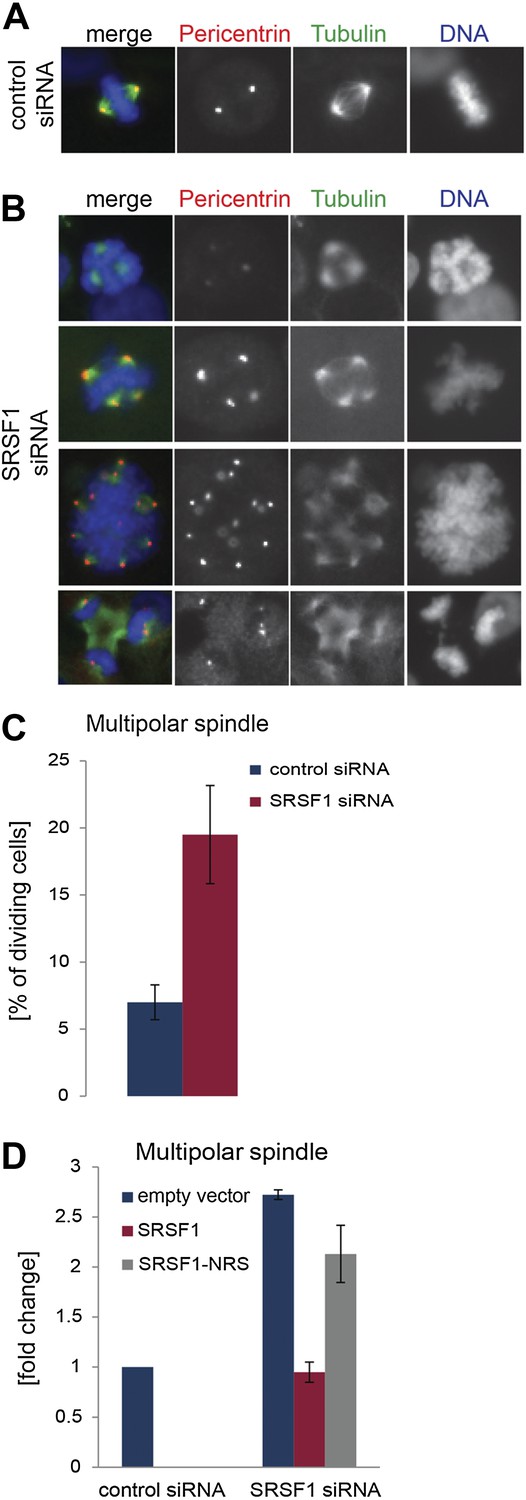
SRSF1 is required for bipolar spindle formation.
(A and B) HeLa cells were transfected with control or SRSF1-specific siRNA and 48 hr later stained for DNA (blue), tubulin (green), and pericentrin (red). Representative images for cells transfected with control or SRSF1-siRNAs (A and B, respectively) are shown. (B) Images show the formation of multipolar spindles upon SRSF1 depletion. (C) Quantitation of the multipolar spindle phenotype observed in (B) upon SRSF1 depletion. (D) HeLa cells were treated as in (A and B) and 24 hr later transfected with either wild-type SRSF1 or its nuclear-retained version (SRSF1-NRS). The next day cells were fixed and stained for DNA, tubulin, and pericentrin and the appearance of multipolar spindle was quantified. Scale bar is 5 μm.
Figure 7—figure supplement 1
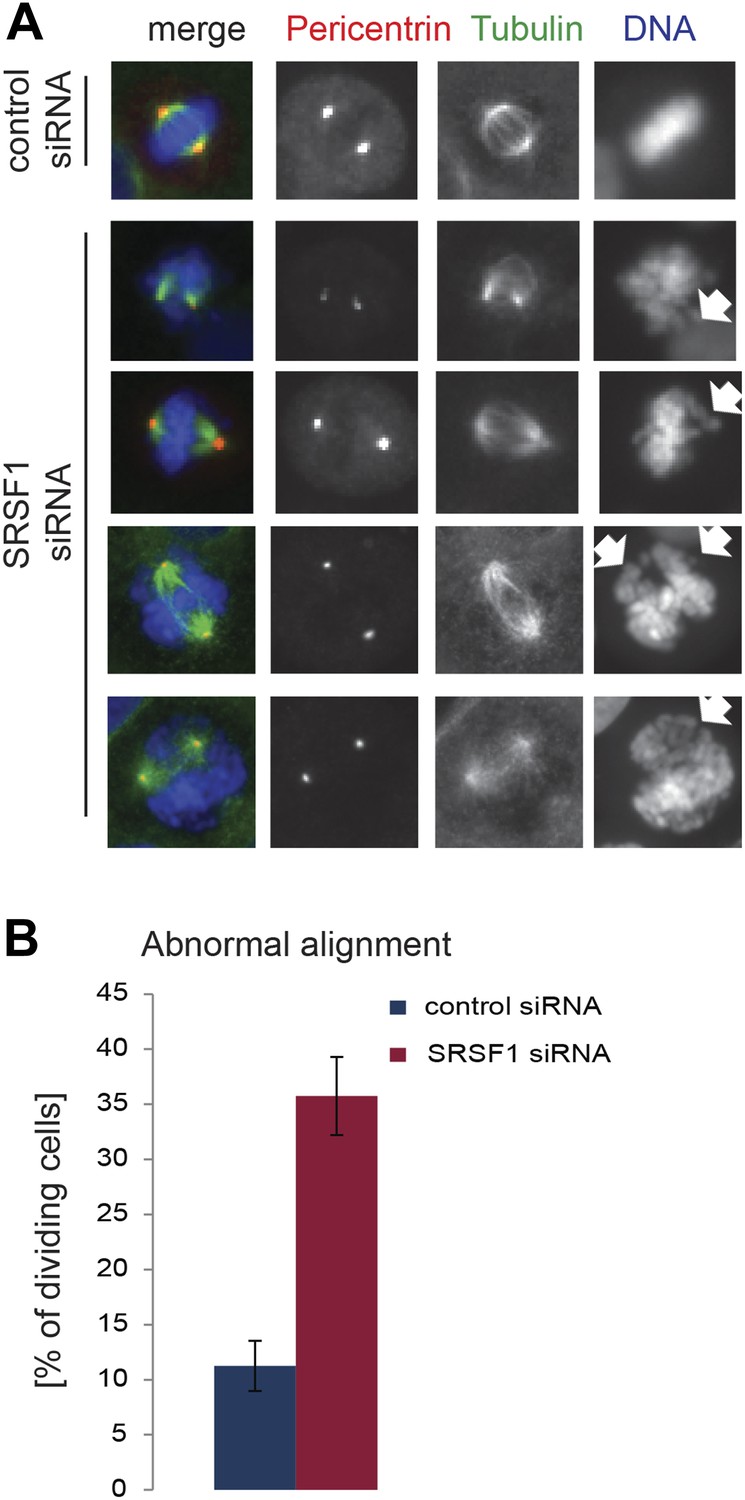
SRSF1 is required for appropriate chromosome alignment.
(A) HeLa cells were transfected with a control or an SRSF1-specific siRNA and 48 hr later stained for DNA (blue), tubulin (green), and pericentrin (red). Representative images show abnormal alignment. (B) Quantitation of the abnormal alignment phenotype upon SRSF1 depletion.
Tables
Table 1
Number of sequenced and mapped reads from each sample
| Sample | Total reads | Mapped reads | Unambiguous | Ambiguous |
|---|---|---|---|---|
| Polysomal (mock) | 15,303,461 | 13,225,802 | 8,629,499 | 4,596,303 |
| Polysomal (SRSF1) | 19,135,008 | 15,505,493 | 10,150,775 | 5,354,718 |
| Subpolysomal (mock) | 15,553,058 | 11,676,769 | 7,489,329 | 4,187,440 |
| Subpolysomal (SRSF1) | 14,417,240 | 11,025,797 | 7,106,934 | 3,918,863 |
Table 2
Total number of forward read counts considered in each sample
| Total forward counts | |
|---|---|
| Polysomal (mock) | 10,407,102 |
| Polysomal (SRSF1) | 12,219,337 |
| Subpolysosomal (mock) | 9,188,985 |
| Subpolyosomal (SRSF1) | 8,585,825 |
Download links
A two-part list of links to download the article, or parts of the article, in various formats.
Downloads (link to download the article as PDF)
Open citations (links to open the citations from this article in various online reference manager services)
Cite this article (links to download the citations from this article in formats compatible with various reference manager tools)
The translational landscape of the splicing factor SRSF1 and its role in mitosis
eLife 3:e02028.
https://doi.org/10.7554/eLife.02028


