Robust and accurate prediction of residue–residue interactions across protein interfaces using evolutionary information
- Howard Hughes Medical Institute, University of Washington, United States
- University of Washington, United States
- Facebook Inc., United States
Figures
Figure 1 with 1 supplement
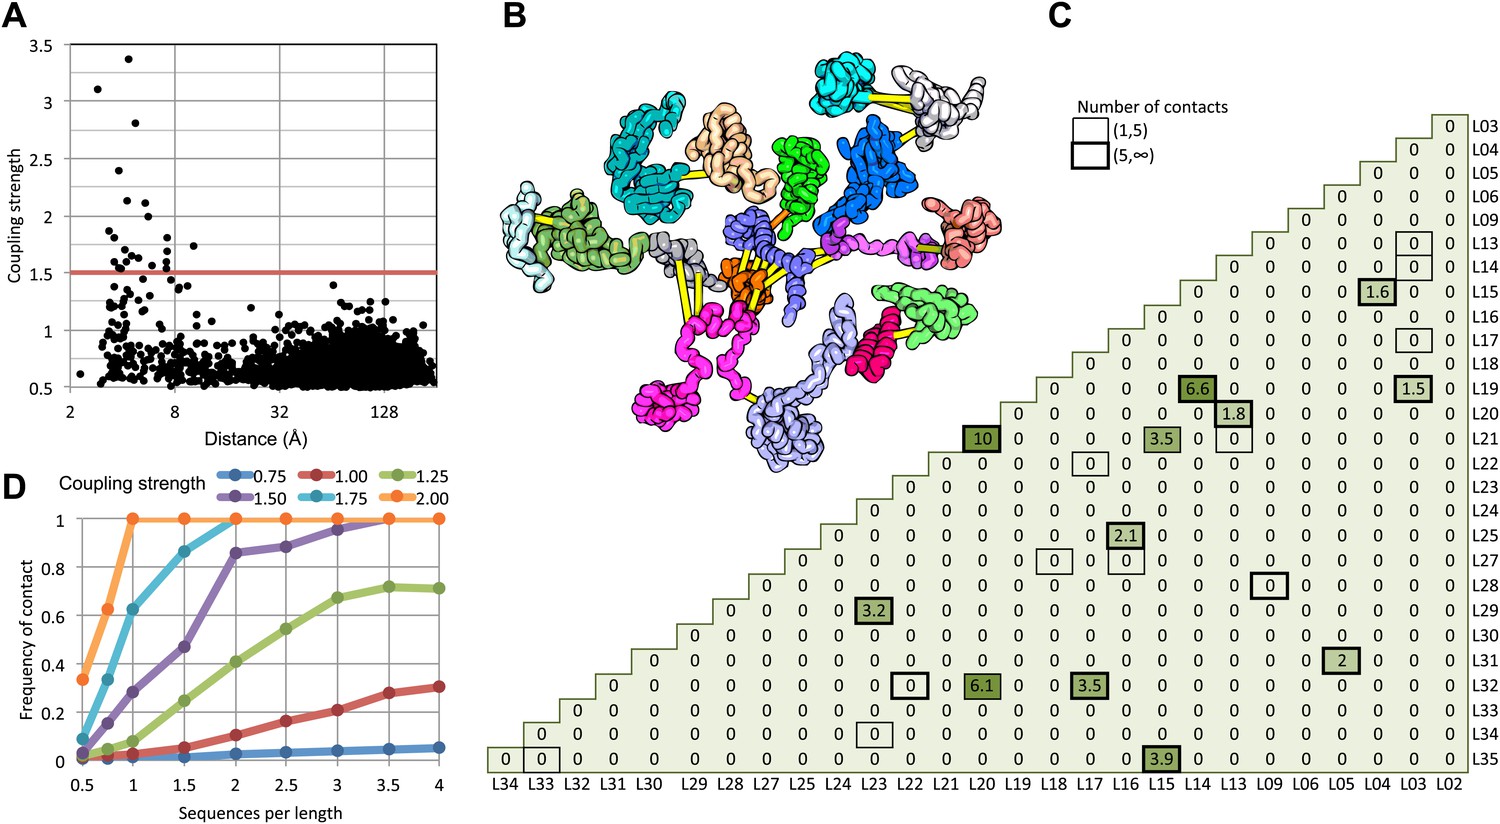
Residue pairs with high normalized coupling strengths are in contact in the 50S ribosomal subunit.
(A) Coupling strengths and inter-residue distances for each residue pair in the 50S subunit (black dots). Residue pairs with coupling strength greater than 1.5 are nearly always less than 8 Å apart. (B) Locations of coevolving (high coupling strength) residue pairs in the protein component of the 50S subunit. The monomers have been pulled apart slightly for clarity. Lines connect residue pairs with coupling strength greater than 1.5; yellow, distance less than 8 Å; orange, distance less than 12 Å. (C) Protein pairs with strong inter-residue covariation (colors) make contact in the three-dimensional structure (black boxes). For each protein pair, the sum of the coupling strength greater than 1.5 for each pair of 50S subunit proteins is indicated; black boxes indicate contacts in the crystal structure. (D) Dependence of contact prediction accuracy on coupling strength and the number of sequences in the alignments. For each of the indicated coupling strength cutoffs (colors), the frequency of contact in the 50S structure (y axis) was computed for sub alignments with different sequence depths (x axis).
Figure 1—figure supplement 1
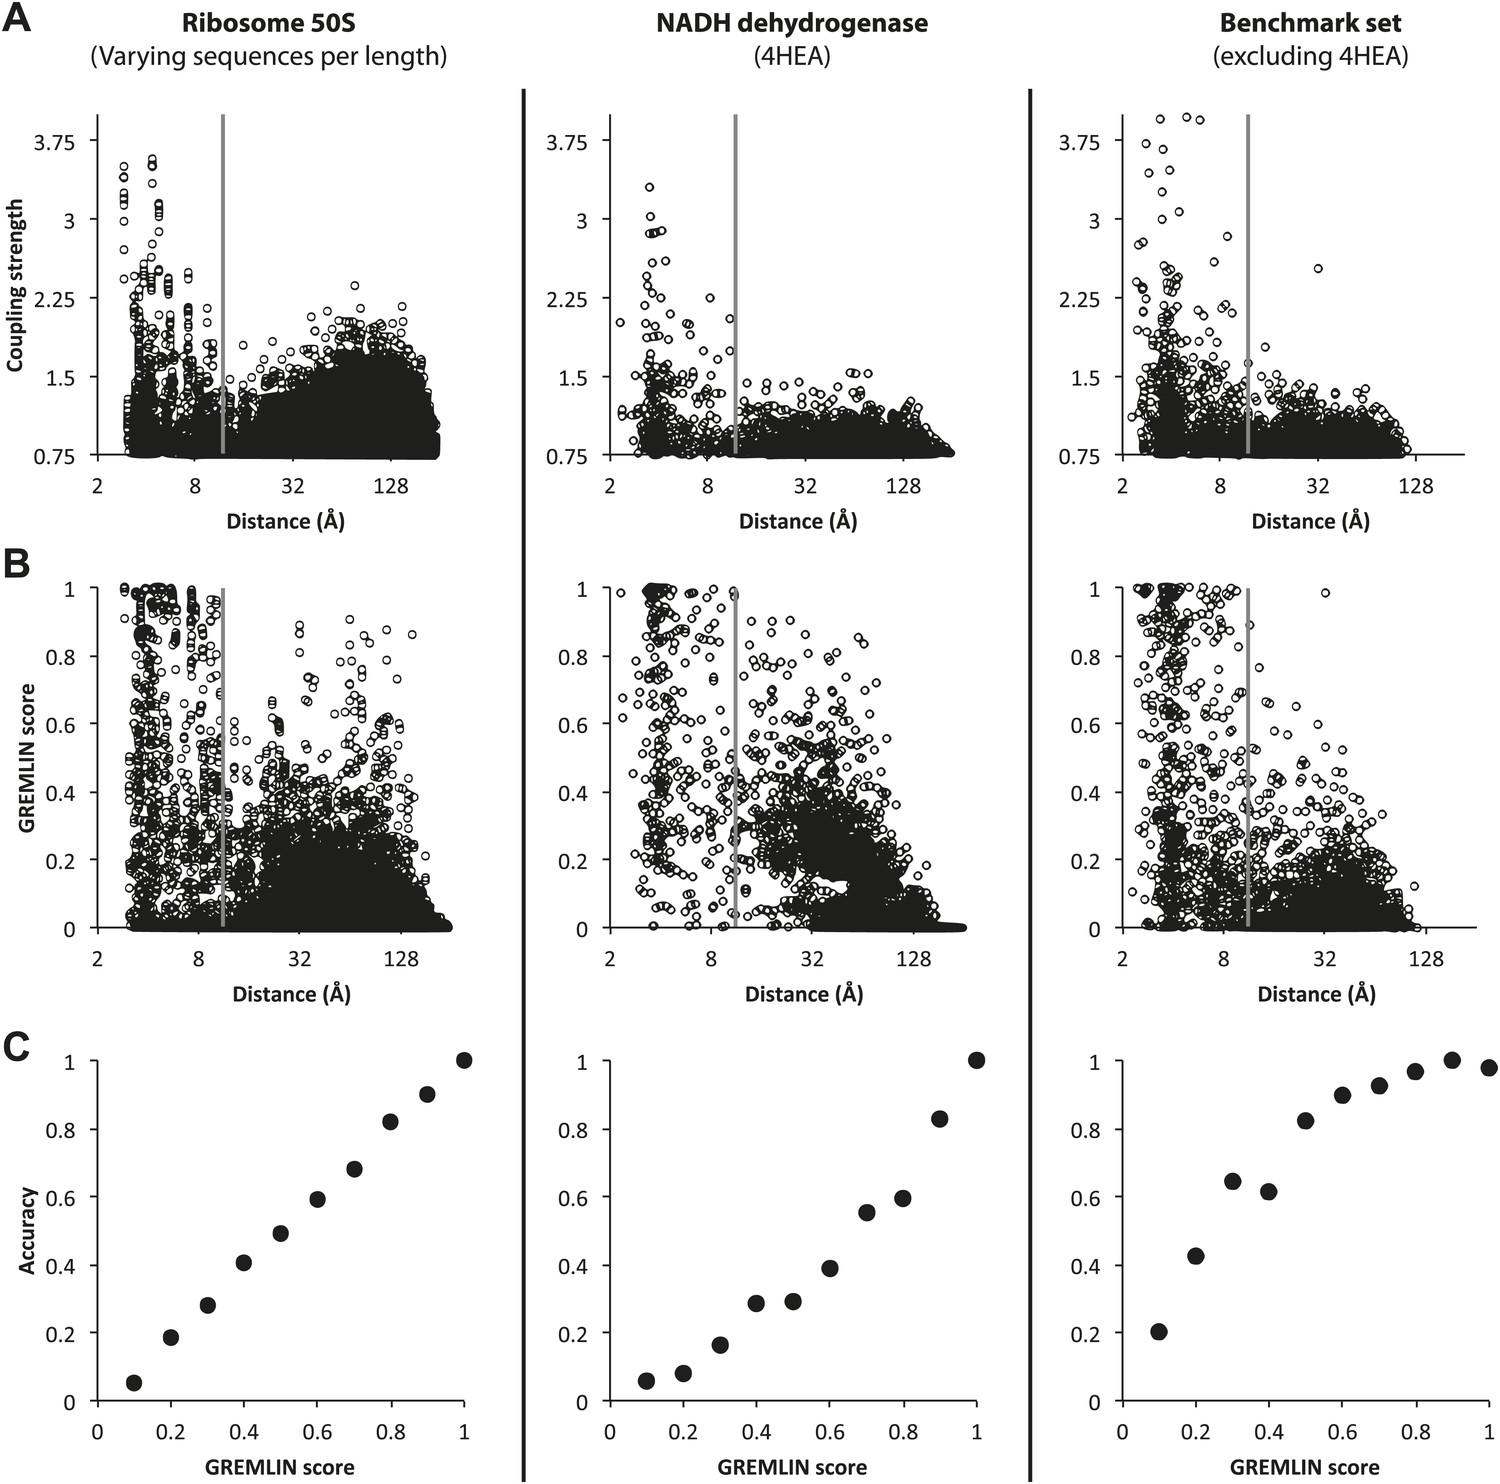
Determining GREMLIN scores from normalized coupling strengths.
Top row: (A) Normalized Coupling strengths. (B) GREMLIN score obtained by fitting a sigmoidal function of normalized coupling strengths to observed frequencies on the 50S ribosome (left column) evaluated on the benchmark set (complexes from the NADH dehydrogenase, middle column and the remaining, right column). (C) The GREMLIN score is well-calibrated: the fraction of predictions with a Gremlin score of x that are correct (distance <12 Å) is roughly x (x in [0, 1]). The overall behavior is similar across the three datasets.
Figure 2
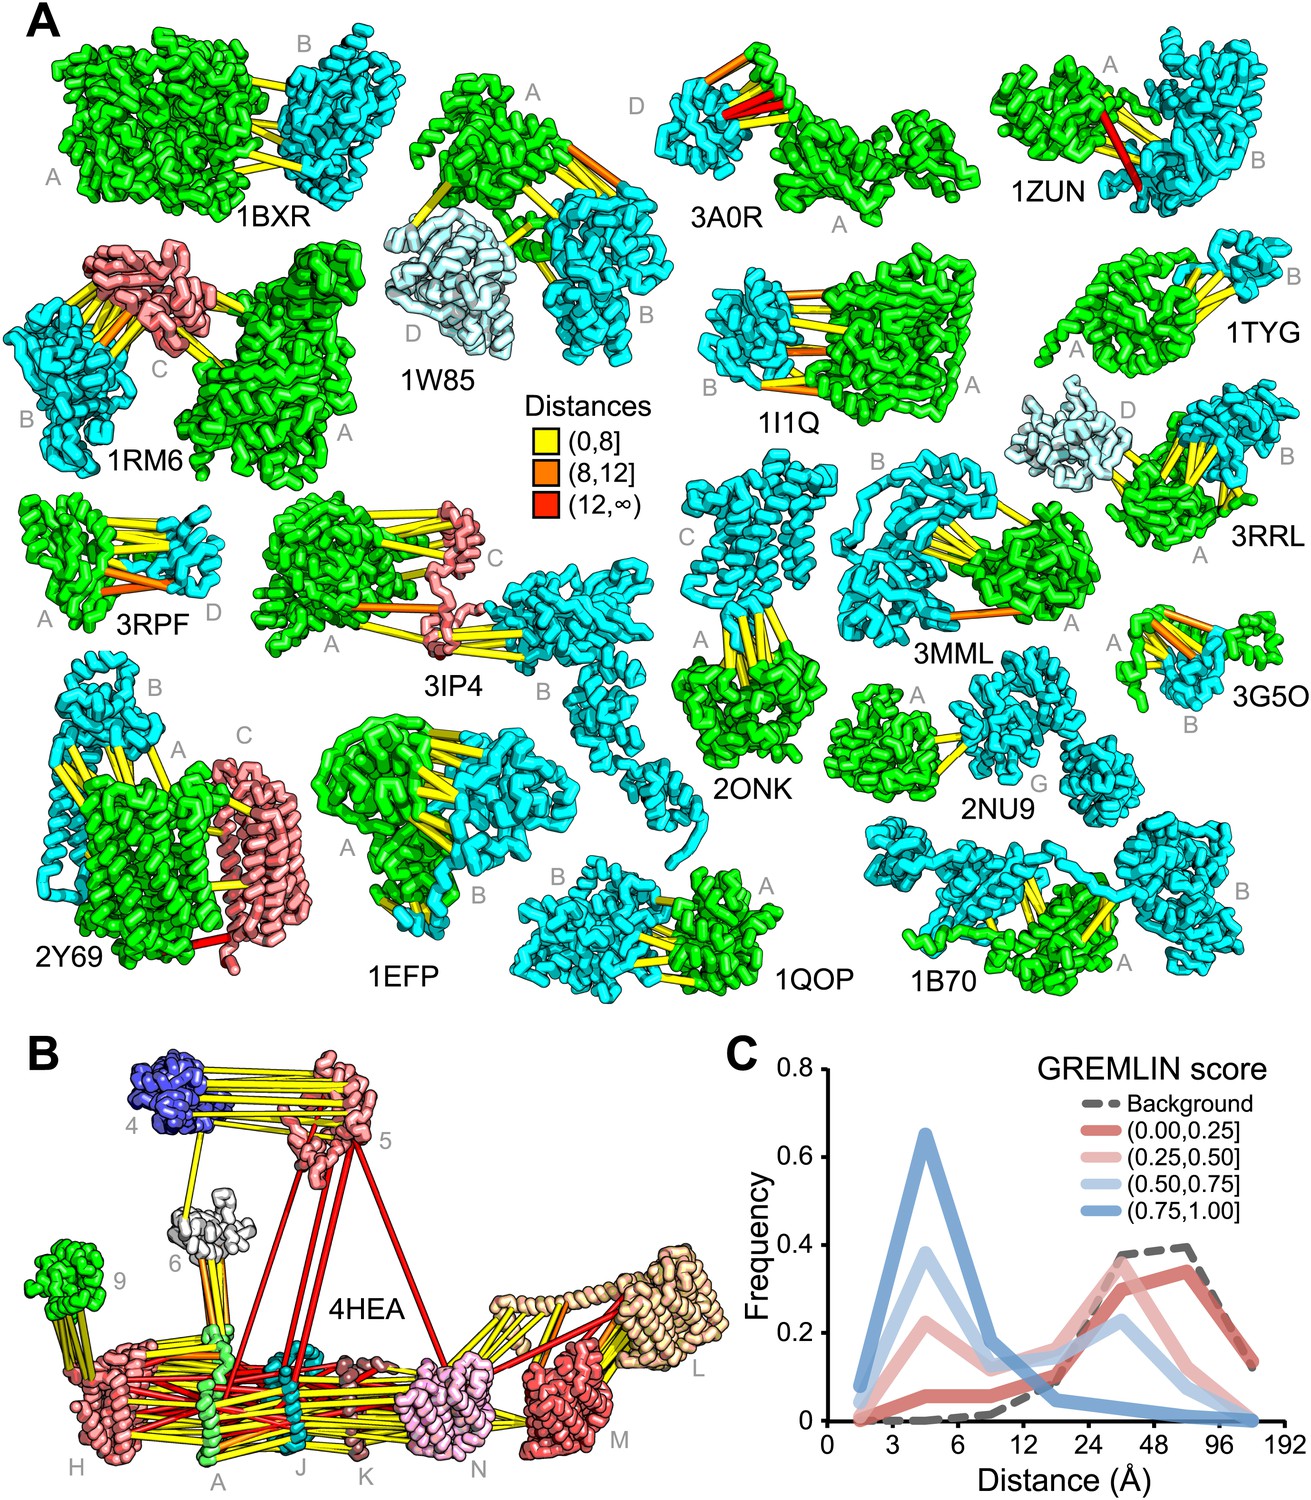
Residue covariation in complexes with known structures.
(A) Residue-pairs across protein chains with high GREMLIN scores almost always make contact across protein interfaces in experimentally determined complex structures. All contacts with GREMLIN scores greater than 0.6 are shown; the structures are pulled apart for clarity. Labels are according to chains in the PDB structure. (B) Complex I of the electron transport chain has an unusually large number of highly co-varying inter residue pairs not in contact in the crystal structure of 4HEA; these contacts may be formed in different state of the complex. Residue pairs within 8 Å are in yellow, between 8 Å and 12 Å in orange, and greater than 12 Å, in red. Distances are the minimal distances between any side chain heavy atom. Labels are according to chains in 4HEA. (C) Dependence of inter-residue distance distributions on GREMLIN score. All residue–residue pairs between subunits in the benchmark set were grouped into four bins based on their GREMLIN score (colors), and the distribution of residue–residue distances (x axis) within each bin computed from the three-dimensional structures. See Figure 2—source data 1 for the table of all the interfaces used in the calculation.
-
Figure 2—source data 1
PDB benchmark set.
The PDB id and chains in the benchmark set, with number of sequences per length (seq/len) in the multiple sequence alignment. For complexes involving more than one component, an all vs all analysis was performed.
- https://doi.org/10.7554/eLife.02030.006
Figure 3

Predicted residue–residue interactions across protein interfaces of unknown structure.
Strongly co-evolving residue pairs for complexes without known structure that had at least one prediction with GREMLIN score greater than or equal to 0.85. Each row shows the residue pairs, their sequence identity and the GREMLIN score. Structure models for complexes highlighted in red are shown in Figure 5. Full dataset is provided with the deposited data.
Figure 4 with 2 supplements

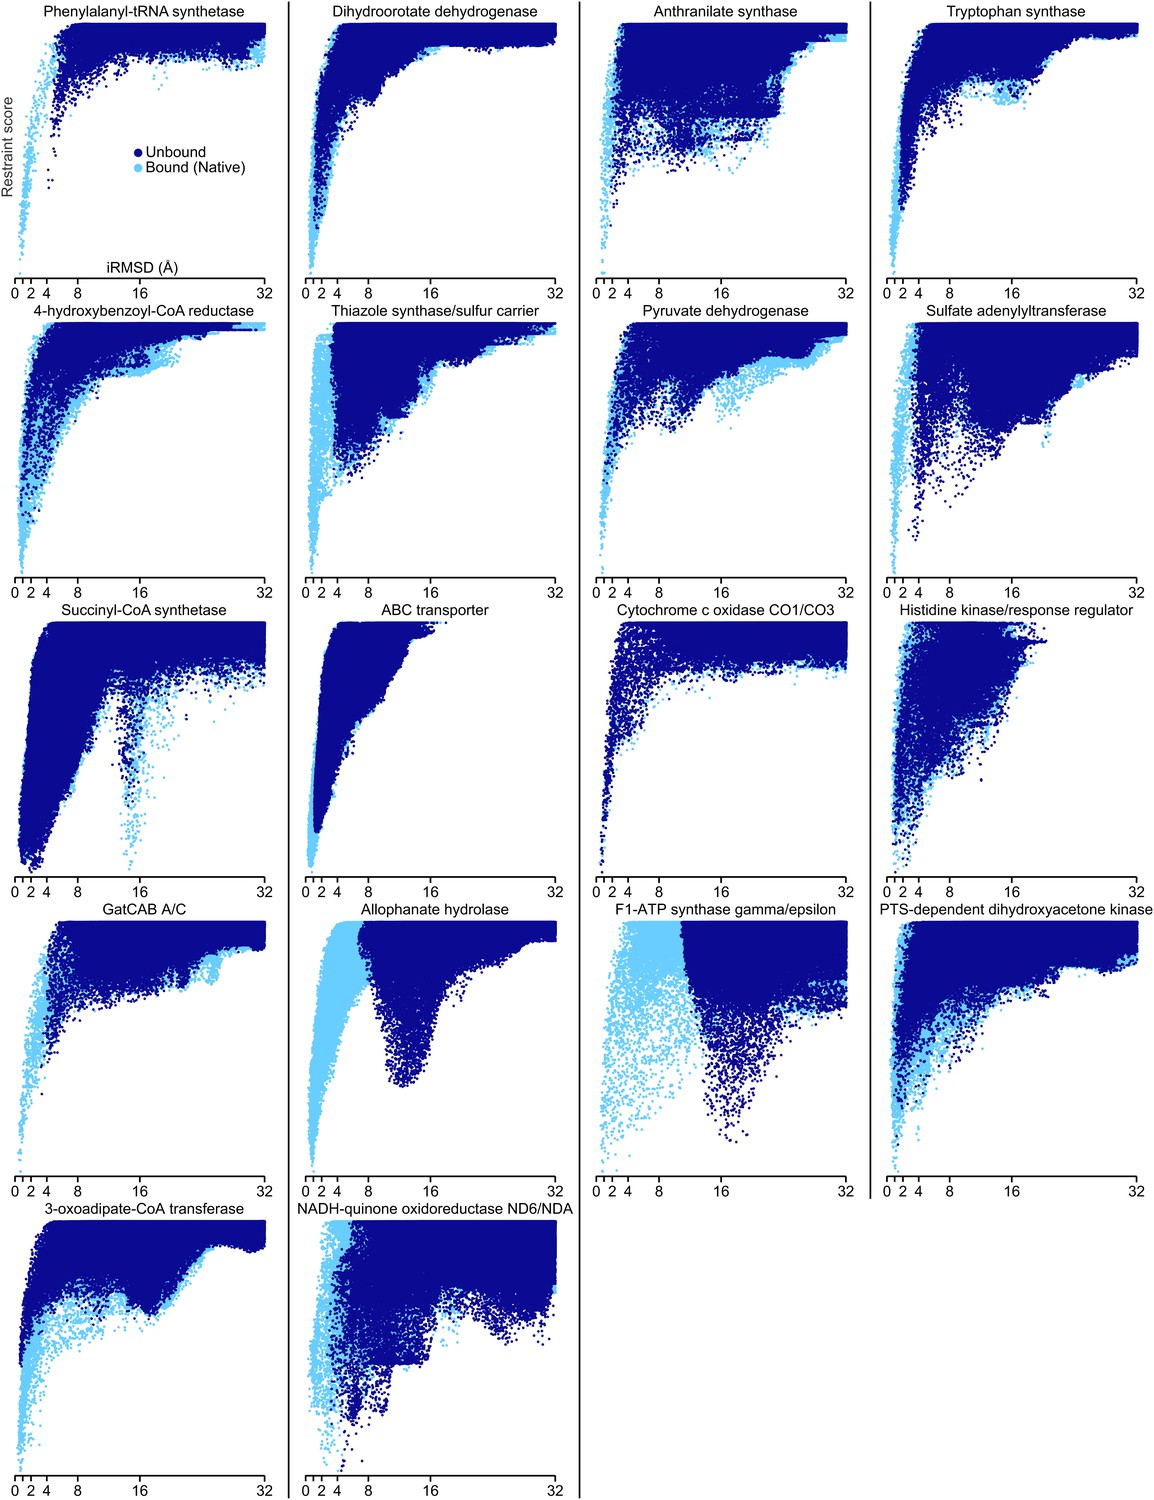
Contact guided protein–protein docking on a benchmark set of 18 protein complexes.
(A) Structure models for each complex were generated by docking structures of its constituents, at least one of which (blue) was not from the structure of the complex guided by coevolution derived distance restraints. The interface C-alpha RMSD (iRMSD) of the structural model with the lowest energy to the experimentally determined structure and the fraction of native contacts are shown. Structure models for cases in red are shown in B and C and D. (B and C) Comparison between native and docked structure for the two largest failures in the benchmark: the large iRMSD is due to large conformational changes in the monomers upon docking but the interface is still modeled correctly in the region not involved in conformational change. (D) Multiple minima in the docking landscape (right) correspond to distinct interfaces in the complex (left).
-
Figure 4—source data 1
Bound set.
The iRMSD of the lowest energy structure and the fraction of native contacts in the positive control.
- https://doi.org/10.7554/eLife.02030.009
Figure 4—figure supplement 1
Docking landscapes showing iRMSD (x-axis) vs GREMLIN restraint score (y-axis).
Each point represents a structure model generated by docking the subunits guided by the GREMLIN score. Dark blue points are from calculations in which at least one subunit was solved independently of the complex; light blue points, from positive control calculations in which both subunits are from the bound complex.
Figure 4—figure supplement 2
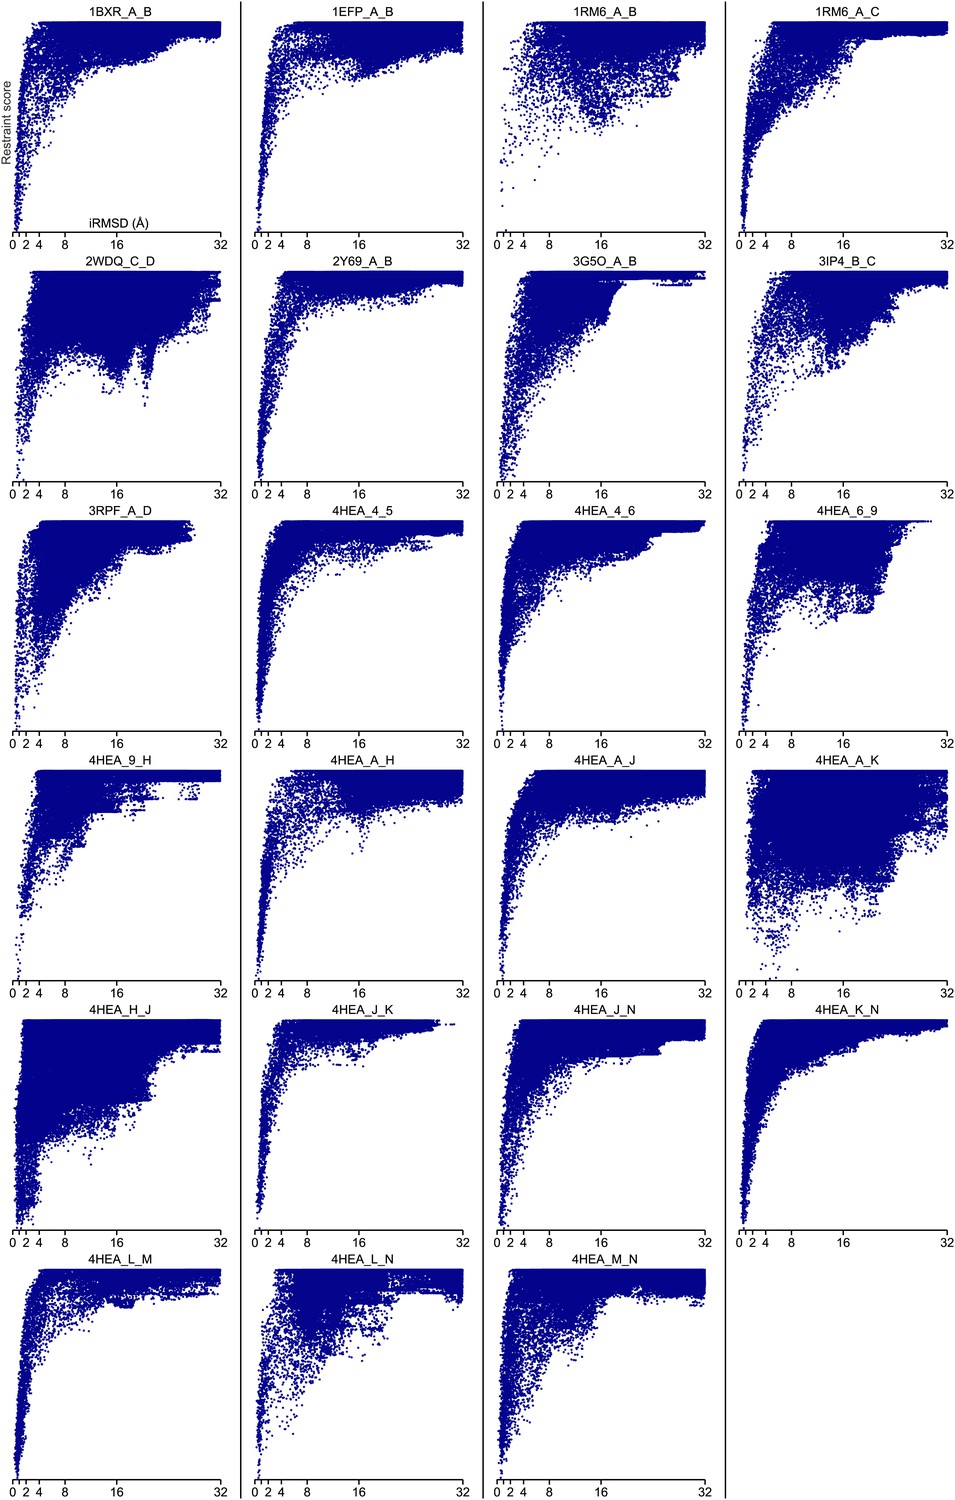
Bound set.
Docking landscapes with GREMLIN restraint score. X-axis, iRMSD; y-axis GREMLIN restraint score.
Figure 5
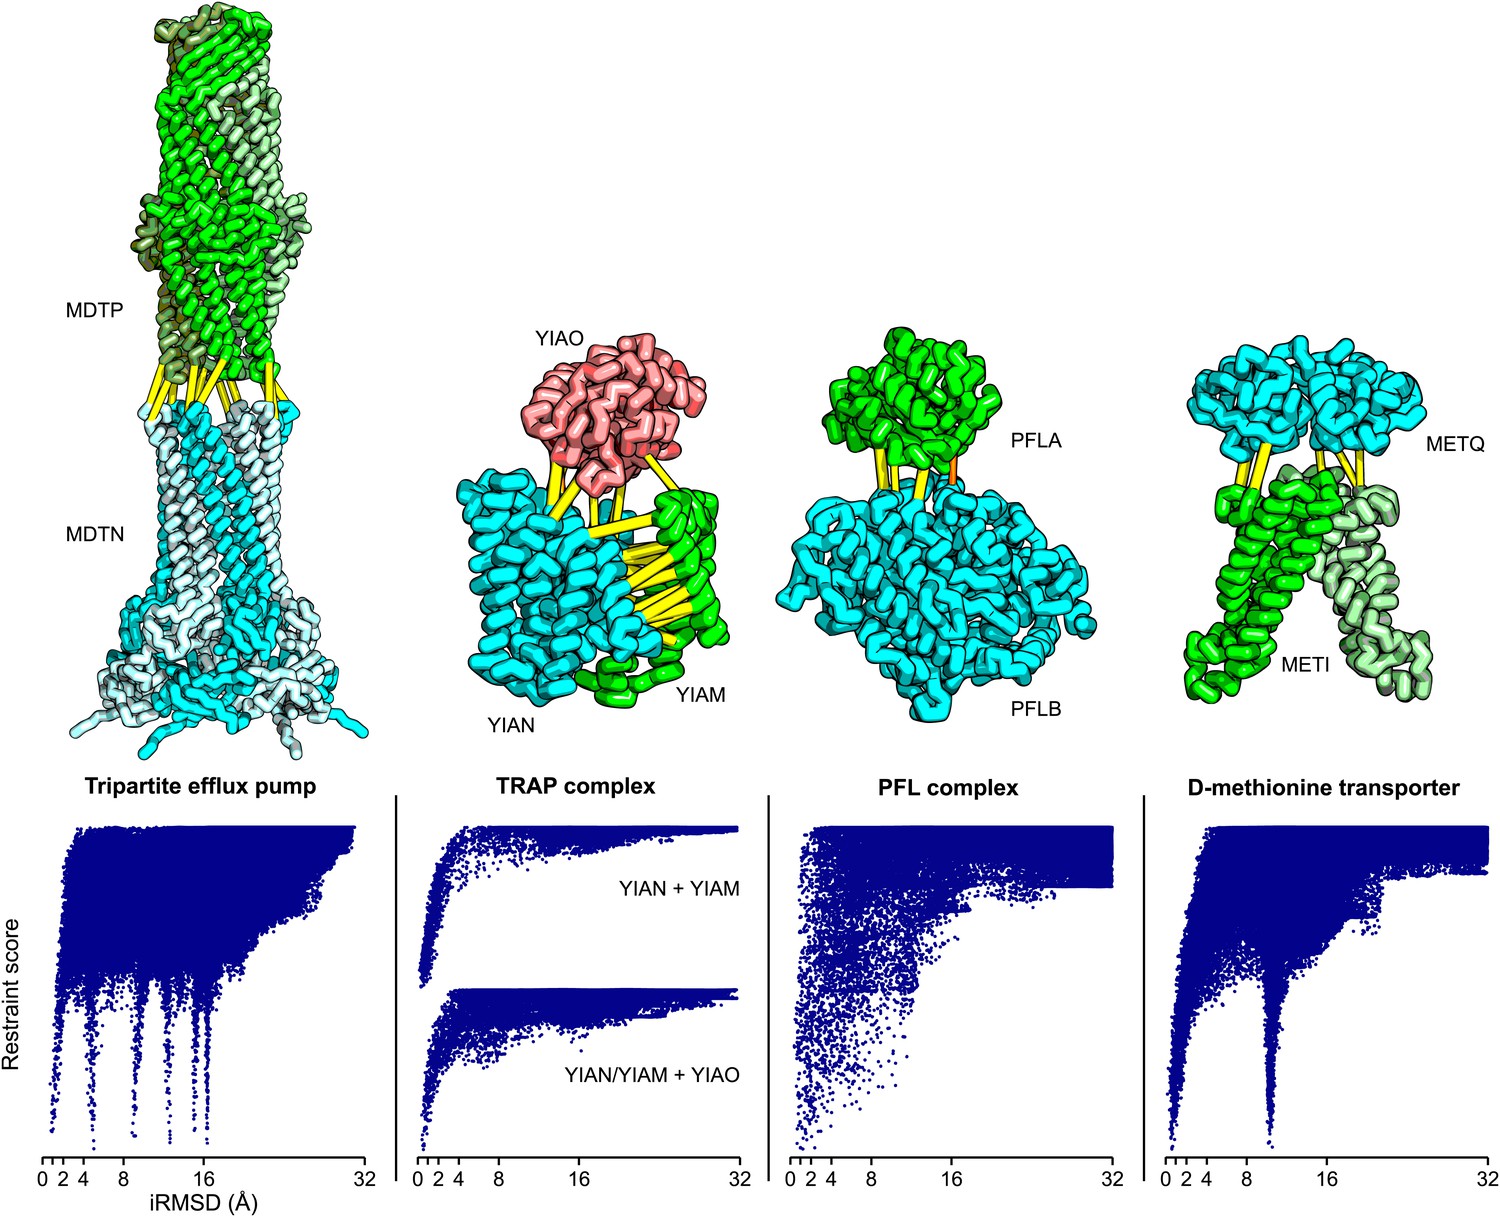
Structure models for complexes with unknown structures.
Residue pairs with GREMLIN scores ≥ 0.60 are connected by yellow bars; the structures are pulled apart for clarity. For METQ-METI and PFLA-PFLB GREMLIN scores ≥ 0.3 are shown. For each docking calculation the docking energy landscape is shown, with iRMSD to the selected model on the x-axis. The multiple minima correspond to permutations of the labels on the subunits of the homo-oligomer complex. Predicted structures of each complex are provided with the deposited data.
Download links
A two-part list of links to download the article, or parts of the article, in various formats.
Downloads (link to download the article as PDF)
Open citations (links to open the citations from this article in various online reference manager services)
Cite this article (links to download the citations from this article in formats compatible with various reference manager tools)
Robust and accurate prediction of residue–residue interactions across protein interfaces using evolutionary information
eLife 3:e02030.
https://doi.org/10.7554/eLife.02030


