Systems analysis of the CO2 concentrating mechanism in cyanobacteria
- Harvard University, United States
Figures
Figure 1
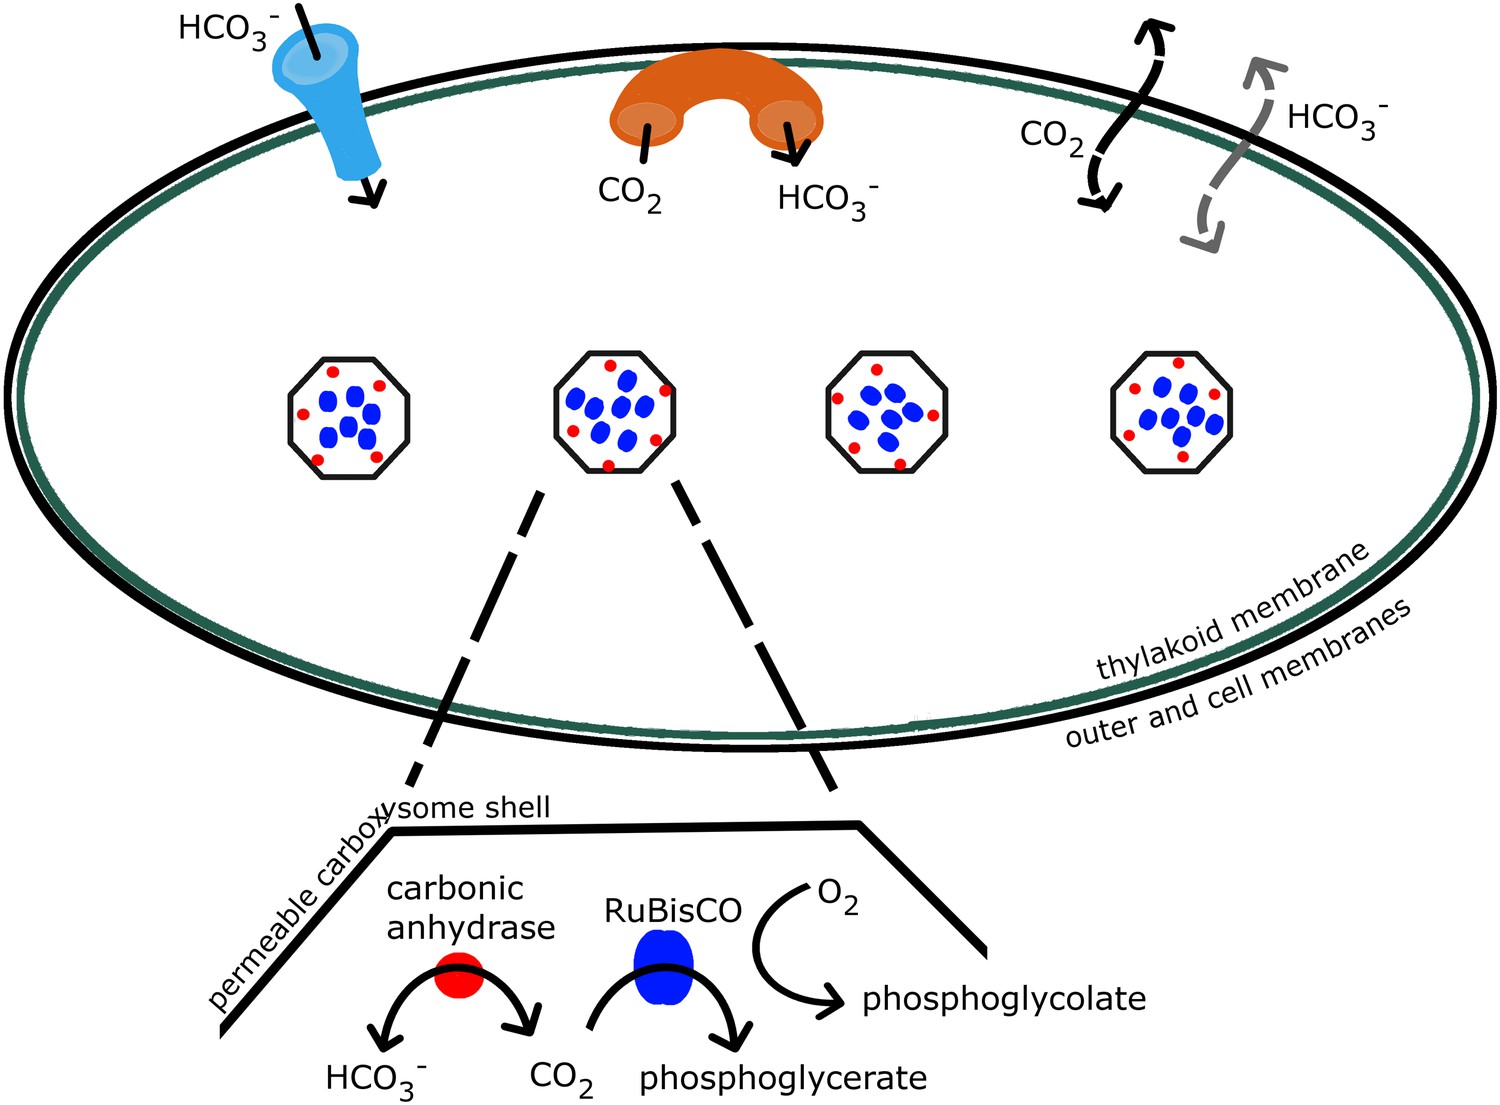
Schematic of the CCM in cyanobacteria.
Outer and cell membranes (in black), as well as, thylakoid membranes where the light reactions take place (in green) are treated together. Carboxysomes are shown as four hexagons evenly spaced along the centerline of the cell. The model treats a spherically symmetric cell, with one carboxysome at the center. Active transport into the cell is indicated (in light blue), as well as active conversion from CO2 to , sometimes called ‘facilitated uptake’ or ‘scavenging’, at membranes (in orange). Both CO2 and can leak in and out of the cell, with CO2 leaking out much more readily. Both species passively diffuse across the carboxysome shell. Carbonic anhydrase (red) and RuBisCO (blue) are contained in the carboxysomes and facilitate reactions as shown.
Figure 2 with 2 supplements

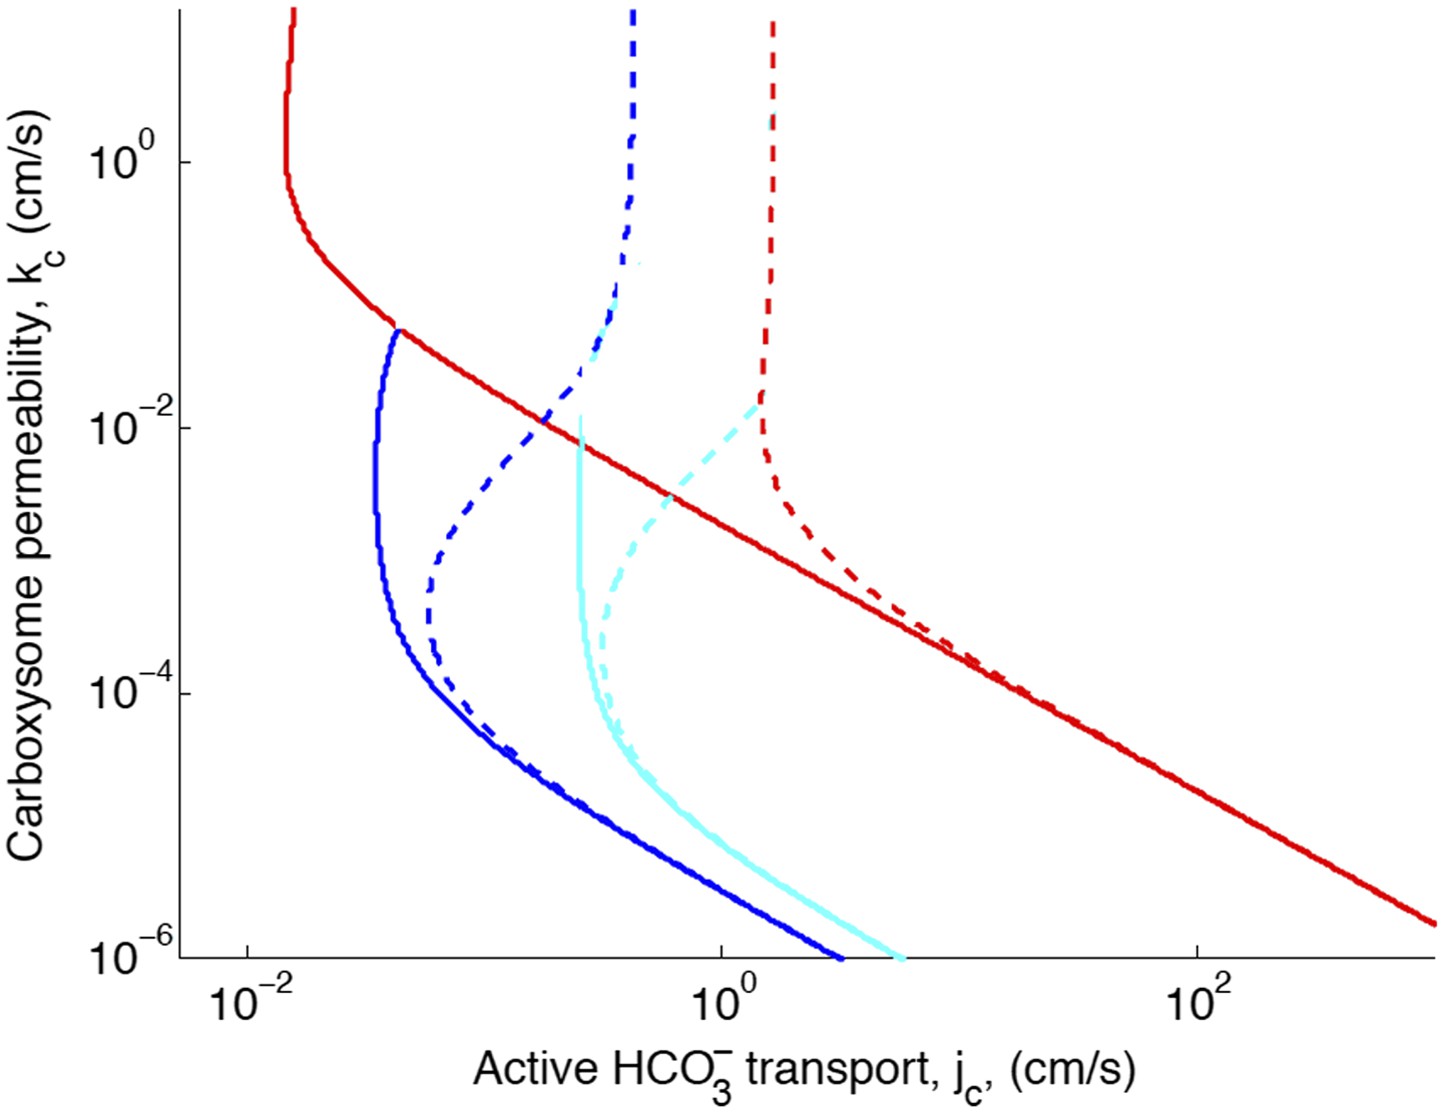
Phase space for transport, jc, and carboxysome permeability kc.
Plotted are the parameter values at which the CO2 concentration reaches some critical value. The left most line (dark blue) indicates for what values of jc and kc the CO2 concentration in the carboxysome would half-saturate RuBisCO (Km). The middle line (light blue) indicates the parameter values which would result in a CO2 concentration where 99% of all RuBisCO reactions are carboxylation reactions and only 1% are oxygenation reactions when O2 concentration is 260 μM. The right most (red) line indicates the parameter values which result in carbonic anyhdrase saturating. Here α = 0, so there is no CO2 scavenging or facilitated uptake. The dotted line (grey) shows the kc and jc values, where the concentration in the cytosol is 30 mM. The concentration in the cytosol does not vary appreciably with kc in this parameter regime, and reaches 30 mM at . All other parameters, such as reaction rates are held fixed and the value can be found in the Table 1 and Table 2.
Figure 2—figure supplement 1
Phase space for transport and carboxysome permeability.
Solid lines show lines of constant CO2 concentration in the carboxysome for , or the diffusion constant of small molecule in water. Dashed lines show the same lines of constant CO2 concentration, bur for , or the diffusion constant of a small molecule in a 60% sucrose solution.
Figure 2—figure supplement 2
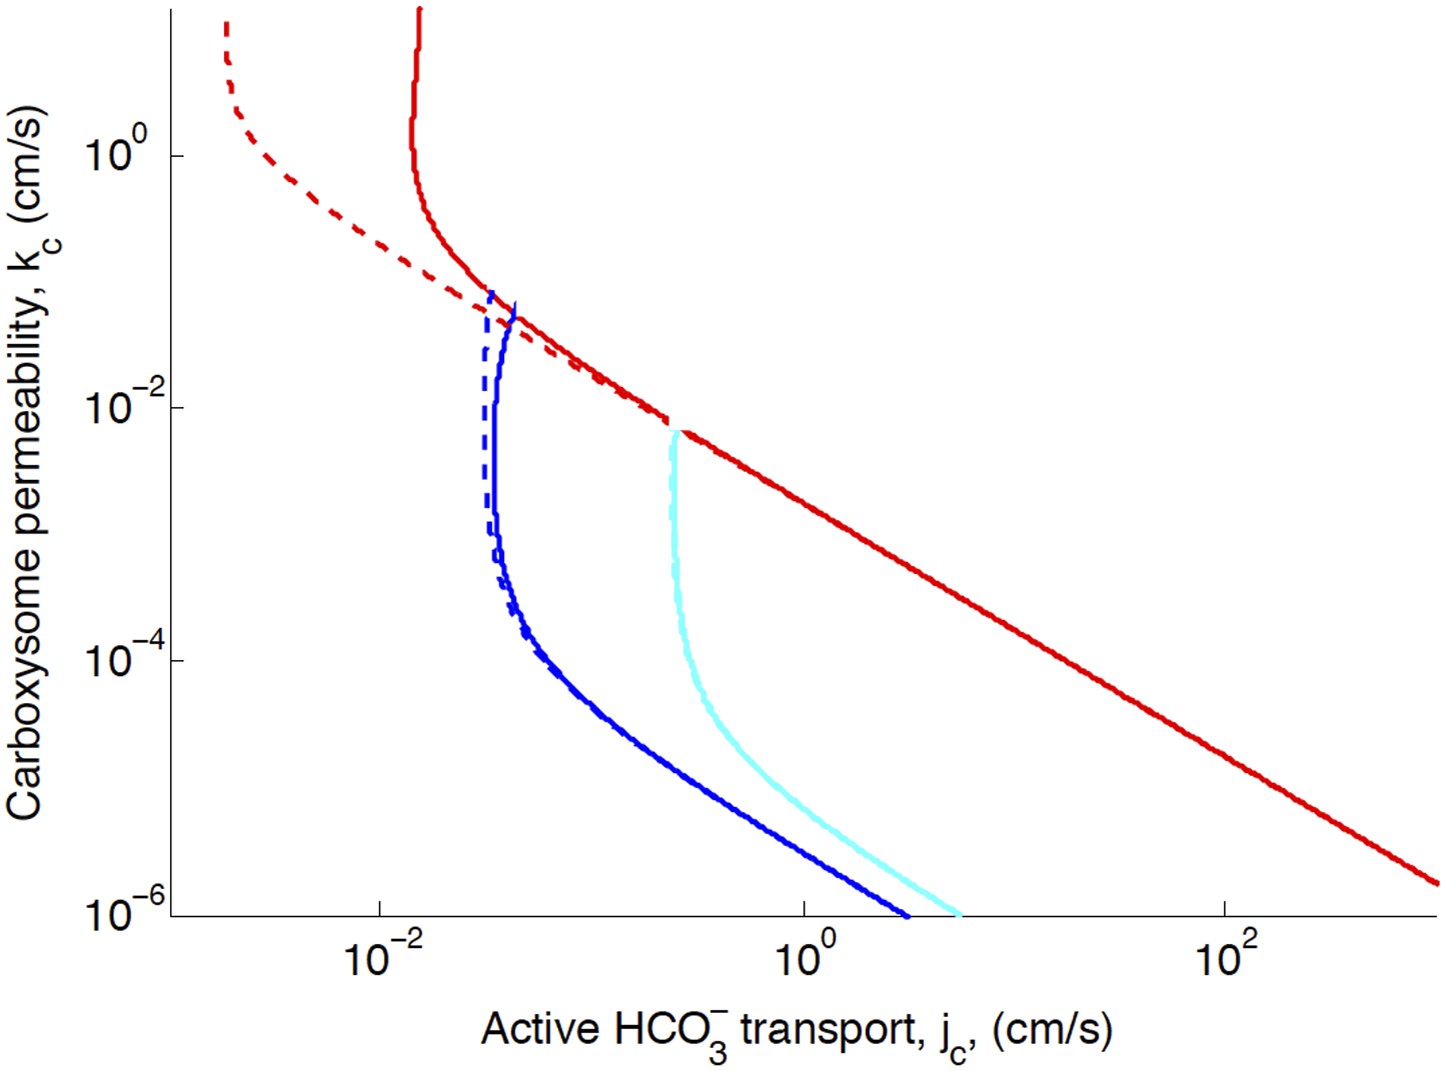
Phase space for transport, jc, and carboxysome permeability, kc.
Plotted are the parameter values at which CO2 concentration reaches some critical value. The left most line (dark blue) indicates for what values of jc and kc the CO2 concentration in the carboxysome would saturate RuBisCO. The middle line (light blue) indicates the parameter values which would result in a CO2 concentration where 99% of all RuBisCO reactions are carboxylation reactions and only 1% are oxygenation reactions when O2 concentration is 260 µM. The right most (red) line indicates the parameter values which result in carbonic anyhdrase saturating. Here (solid lines) and (dashed line), showing the effect of CO2 scavenging or facilitated uptake on the phase space. All other parameters, such as reaction rates are held fixed and the value can be found Table 1.
Figure 3 with 1 supplement
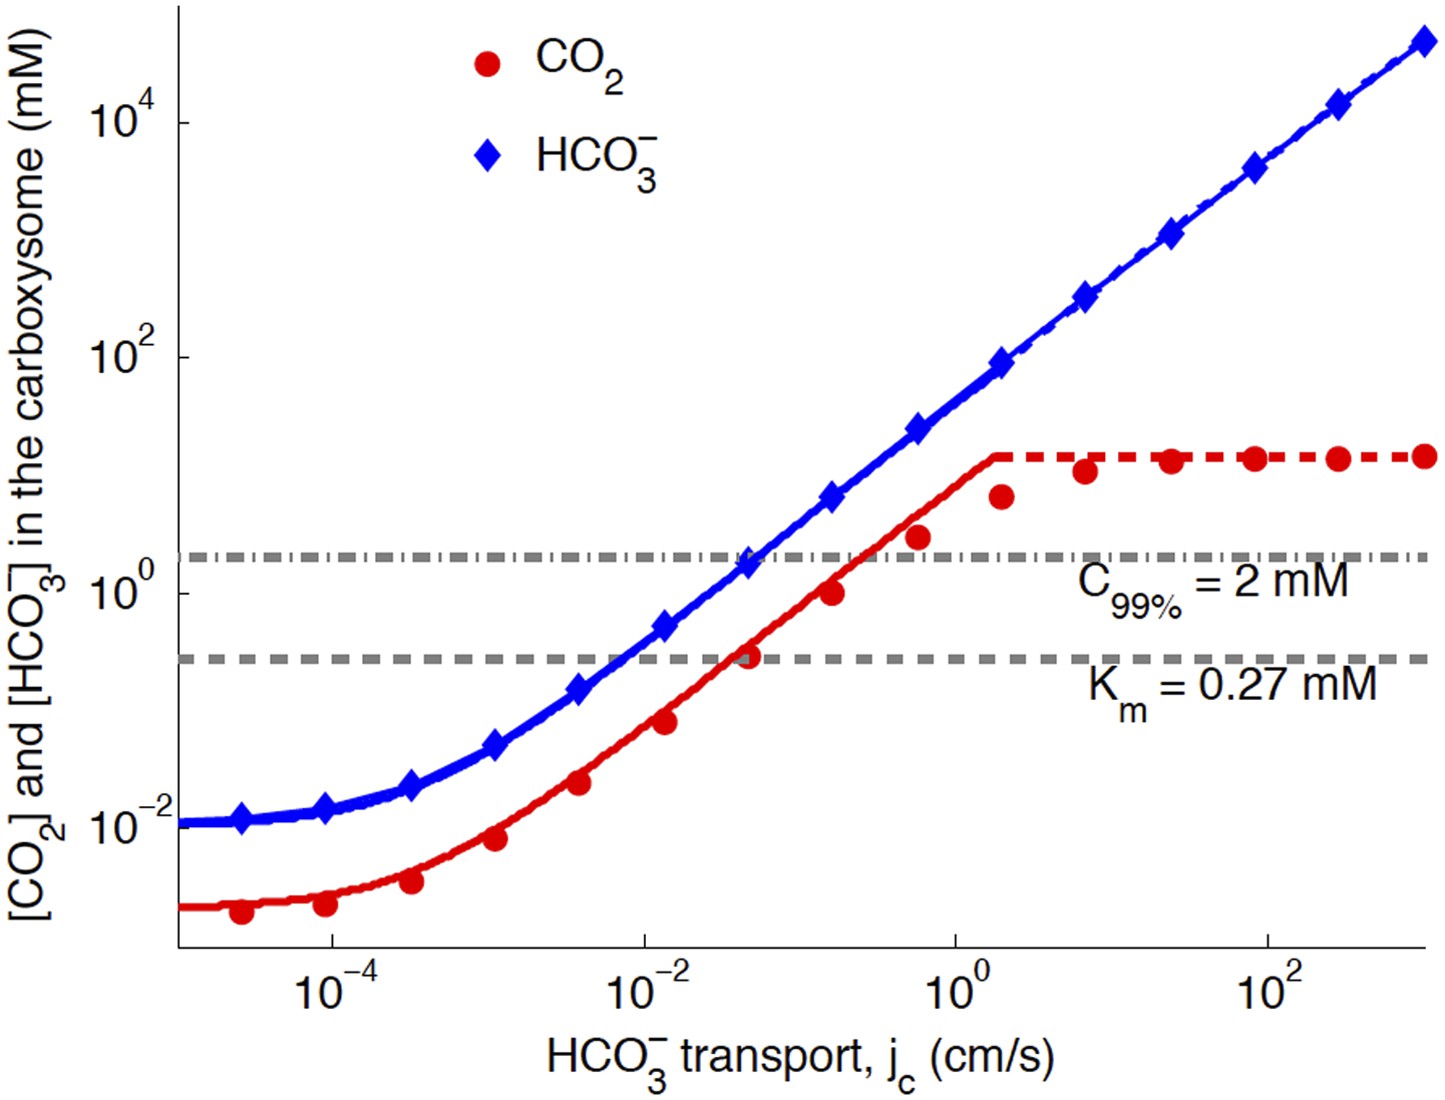
Numerical solution (diamonds and circles) and analytic solutions (carbonic anhydrase unsaturated, solid lines, and saturated, dashed lines) correspond well.
transport is varied, and all other system parameters are held constant. The CO2 concentration above which RuBisCO is saturated is Km (grey dashed line). The CO2 concentration where the oxygen reaction error rate will be 1% is C99% (grey dash-dotted line). The transition between carbonic anyhdrase being unsatruated and saturated happens where the two analytic solutions meet (where the dashed and solid red lines meet). Below a critical value of transport, the level of transport is lower than the leaking through the cell membrane. A value of for the carboxysome permeability was used for these calculations.
Figure 3—figure supplement 1
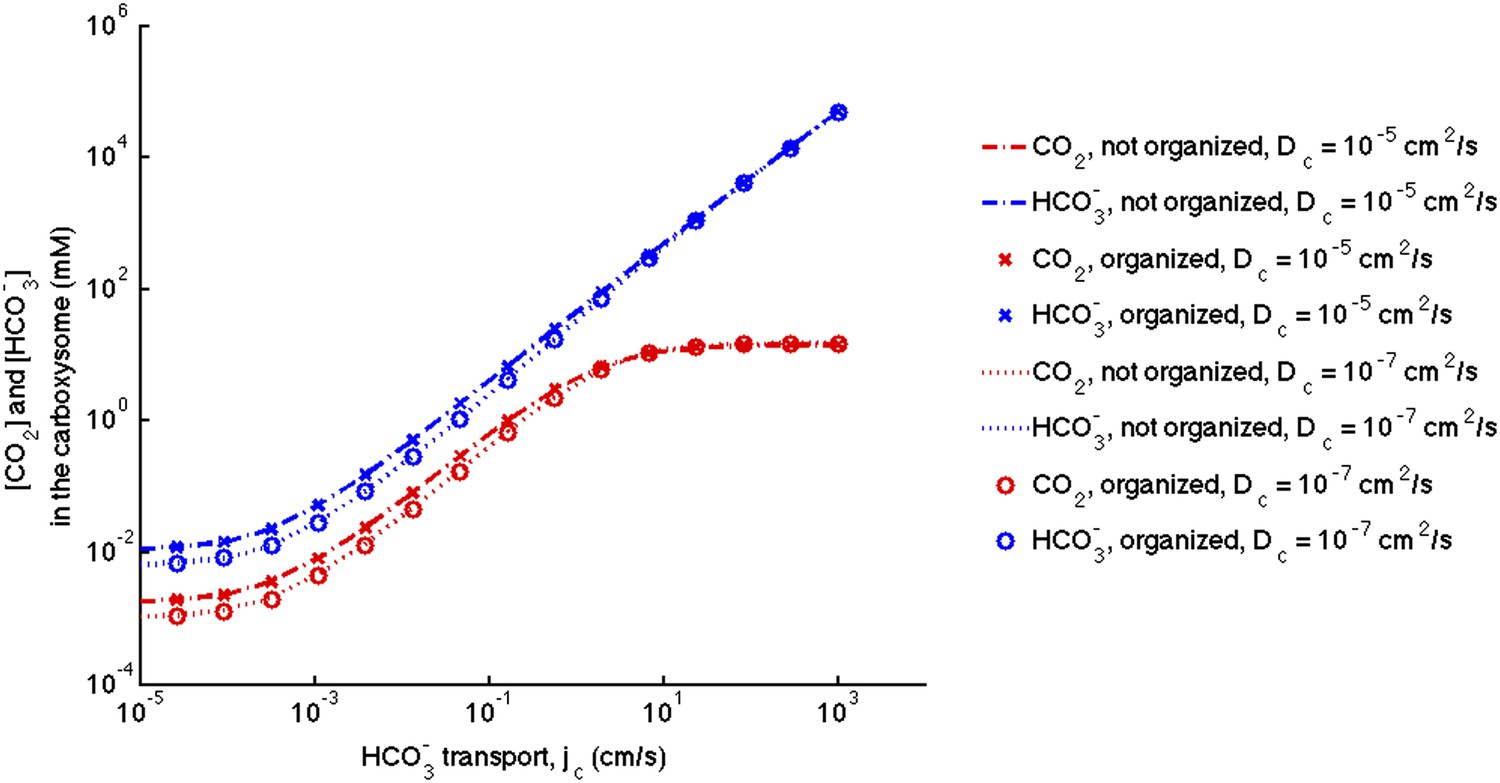
No effect of localizing carbonic anhydrase to the shell of the carboxysome.
We assume the same amount of carbonic anhydrase and RuBisCO activity for each simulation and compare the case with the enzymes evenly distributed throughout the carboxysome to the case where the carbonic anhydrase is localized to the inner carboxysome shell. The (-.-) lines are for no organization and (x) for localization with . The (…) lines are for no organization and (o) are for localization with .
Figure 4
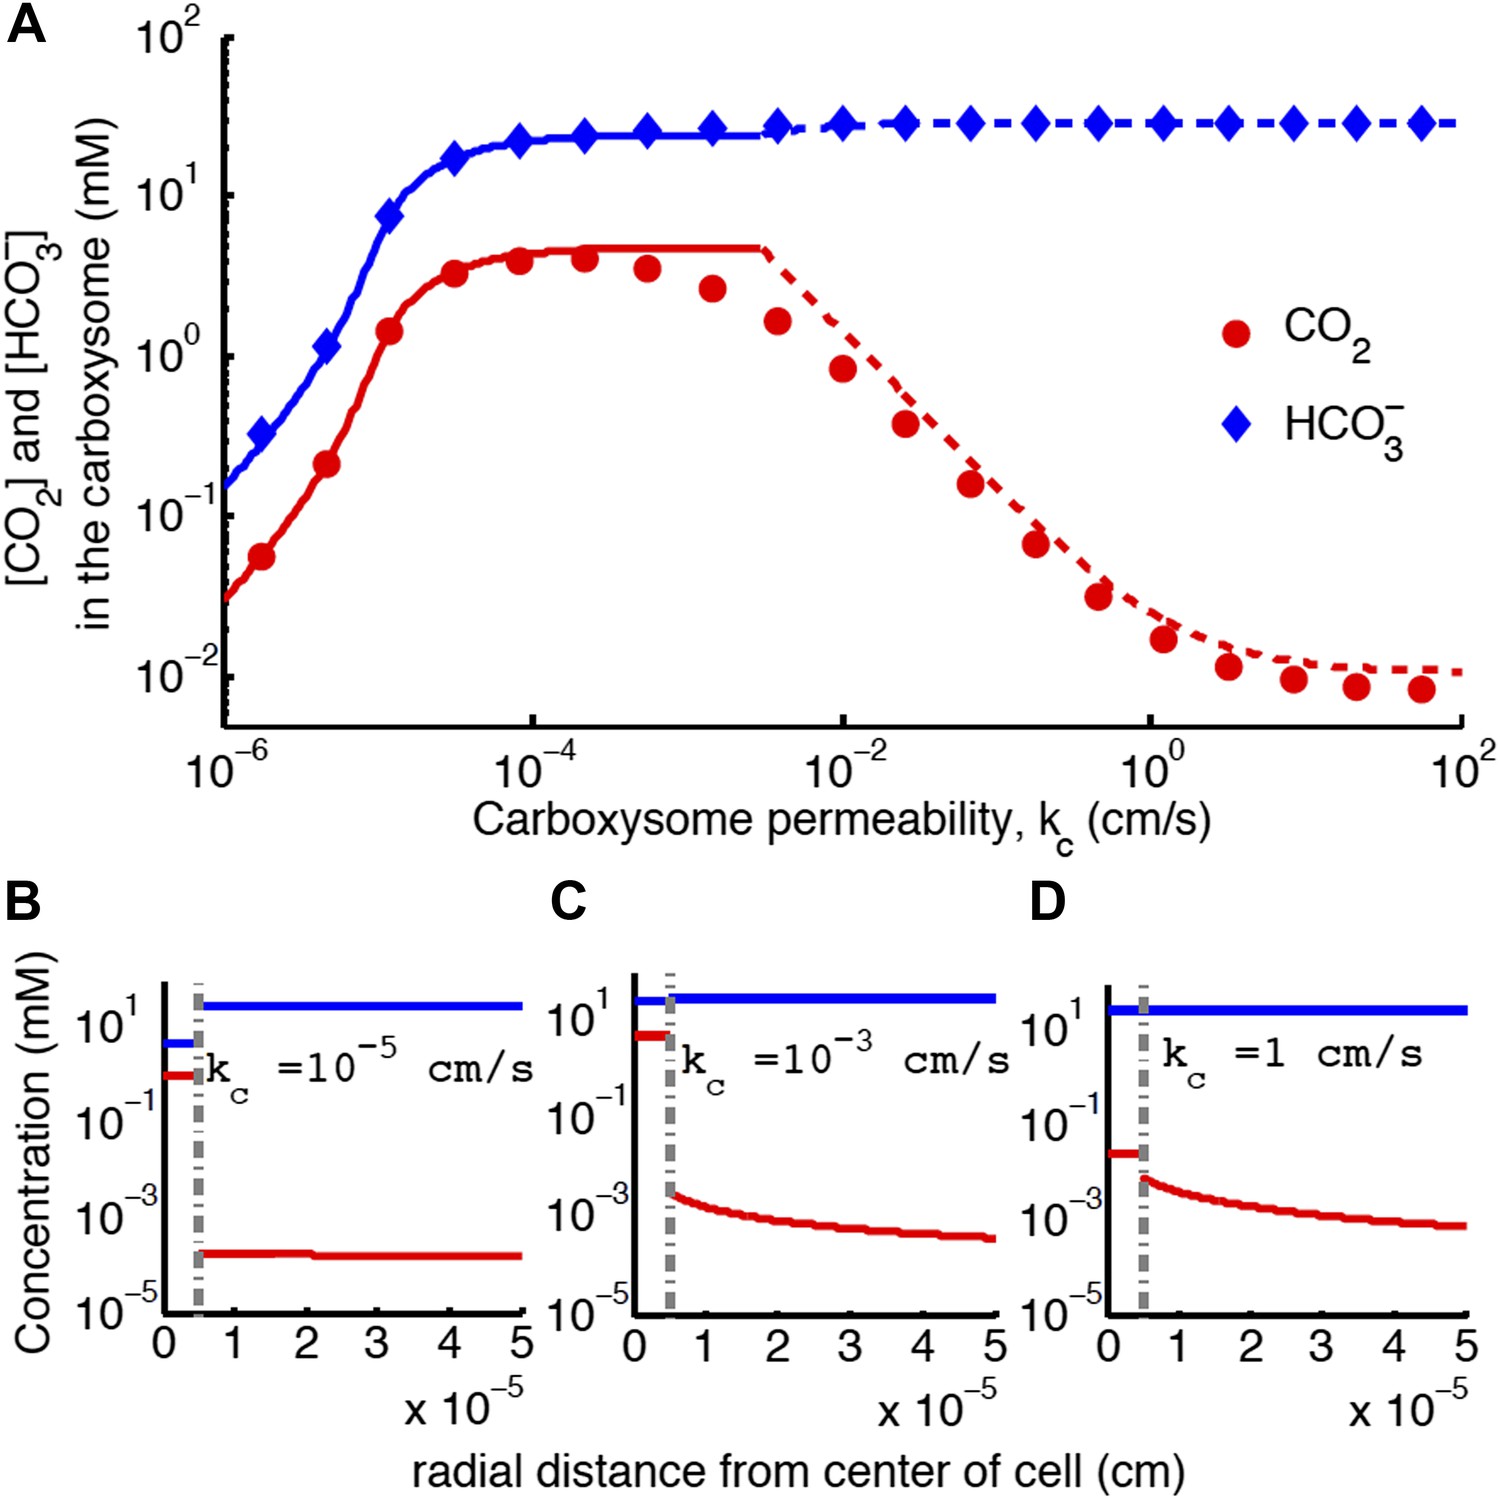
Concentration of CO2 in the carboxysome with varying carboxysome permeability (A).
Numerical solution (diamonds and circles) and analytic solutions (carbonic anhydrase unsaturated, solid lines, and saturated, dashed lines) correspond well. On all plots CO2 (red circle) < (blue diamond). Concentration in the cell along the radius, r, with carboxysome permeability (B), (C), (D). Grey dotted lines in (B), (C), (D) indicate location of the carboxysome shell boundary. The transition from low CO2 at high permeability (D) to maximum CO2 concentration at optimal permeability (C) occurs at . At low carboxysome permeability (B) diffusion into the carboxysome is slower than consumption. For all subplots and . Qualitative results remain the same with varying jc, increasing α will increase the gradient of CO2 across the cell as CO2 is converted to at the cell membrane.
Figure 5
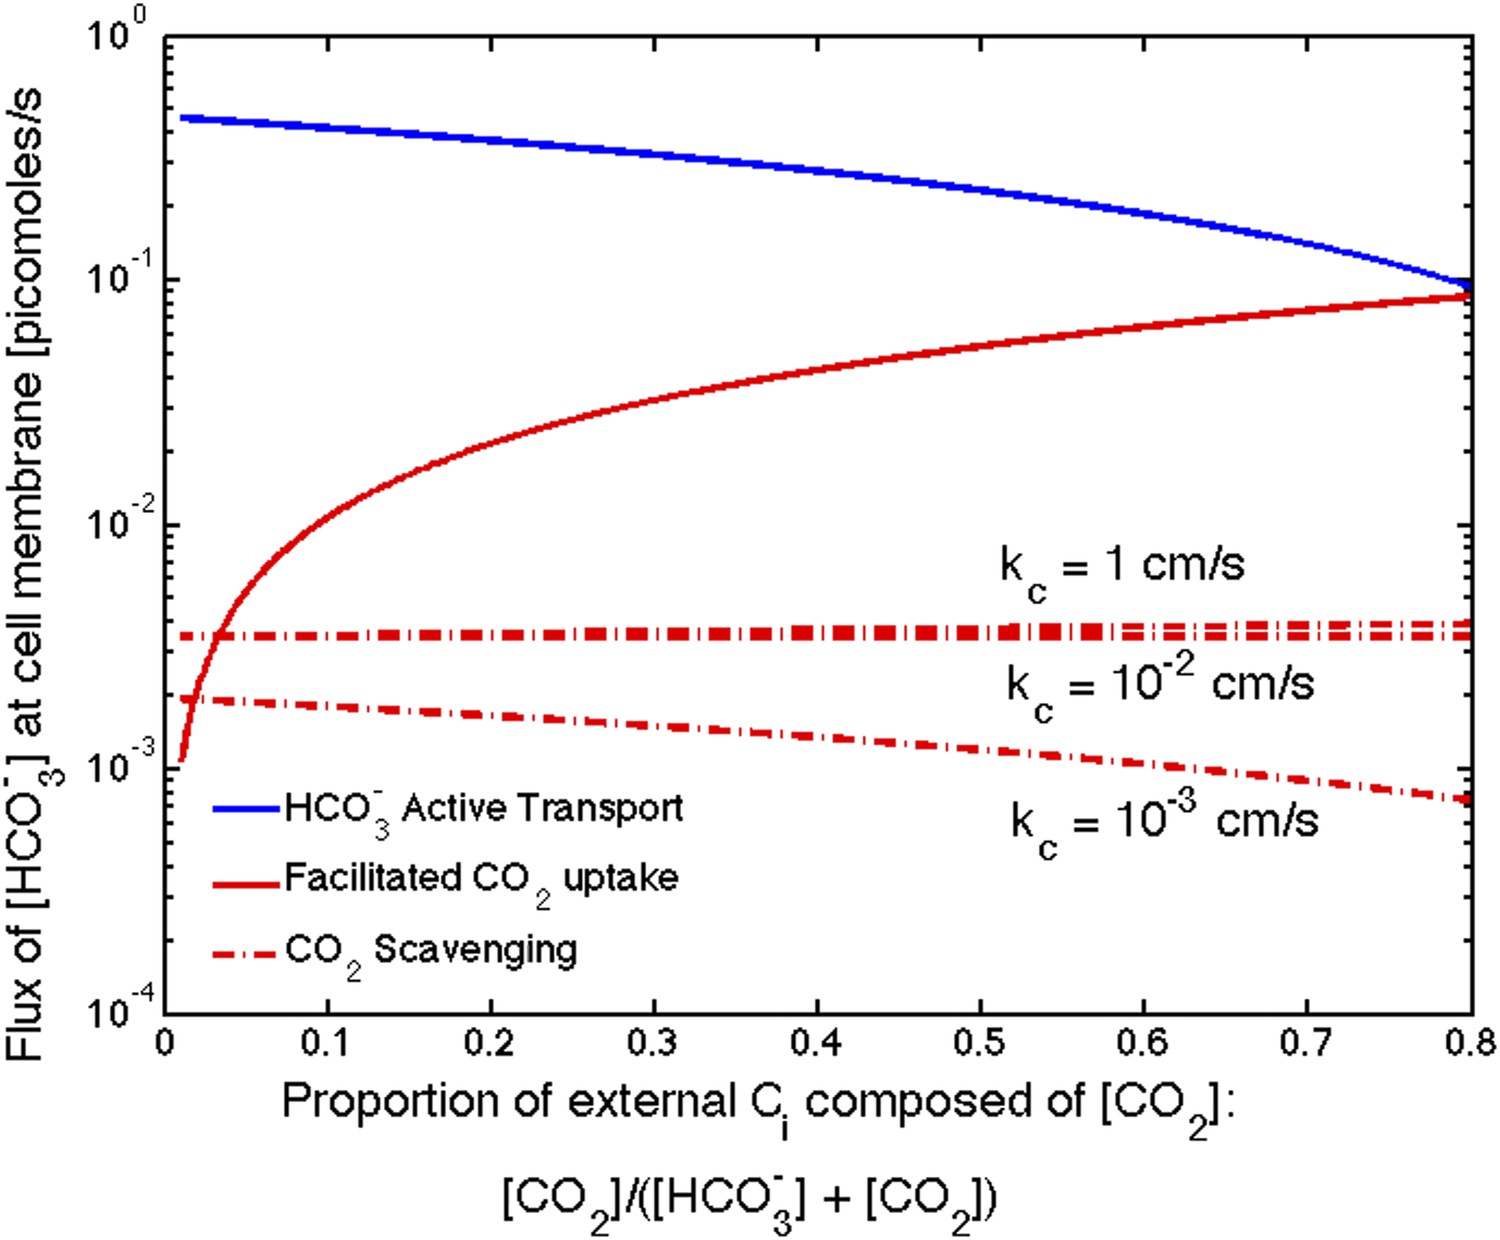
Size of the flux in one cell from varying sources, as the proportion of to outside the cell changes changes.
We show results for three carboxysome permeabilities, , and only the scavenging is effected. Total external inorganic carbon is , and . Scavenging is negligibly small for all values of shown. Unless there is very little in the environment, transport seems to be more efficient than facilitated uptake.
Figure 6

Concentration of CO2 achieved through various cellular organizations of enzymes, where we have selected the transport level such that the concentration in the cytosol is 30 mM.
O2 concentration is 260 μM. The oxygenation error rates, as a percent of total RuBisCO reactions are indicated on the concentration bars. The cellular organizations investigated are RuBisCO and carbonic anhydrase distributed throughout the entire cytosol, co-localizing RuBisCO and carbonic anhydrase on a scaffold at the center of the cell without a carboxysome shell, RuBisCO and carbonic anhydrase encapsulated in a carboxysome with high permeability at the center of the cell, and RuBisCO and carbonic anhydrase encapsulated in a carboxysome with optimal permeability at the center of the cell.
Tables
Table 1
Parameter values chosen for main set of simulations, unless otherwise indicated
| Parameter | Definition | Value | Reference |
|---|---|---|---|
| Hout | concentration of bicarbonate outside the cell | 14 μM* | (Price et al., 2008) |
| Cout | concentration of carbon dioxide outside of cell | 0.14 μM* | (Price et al., 2008) |
| D | diffusion constant of small molecules, CO2 and | 10−5 | (Fridlyand et al., 1996) |
| permeability of cell membrane to CO2 | 0.3 | (Missner et al., 2008; Gutknecht et al., 1977) | |
| permeability of cell membrane to | (Missner et al., 2008; Gutknecht et al., 1977) | ||
| Rc | radius of carboxysome | 5×10⁻⁶ cm | (Cheng et al., 2008; Schmid et al., 2006) |
| Rb | radius of bacteria | 5 × 10⁻⁵ cm | (Savage et al., 2010) |
| jc | transport rate resulting in 30mM cytosolic pool | 0.6 * | calculated here |
| optimal carboxysome permeability | 10−3 * | calculated here | |
| cell volume | calculated | ||
| cell surface area | calculated |
-
*
these parameters are varied in the text, but these values are use unless noted otherwise.
Table 2
Table comparing enzymatic rates (Woodger et al., 2005; Sultemeyer et al., 1995; Heinhorst et al., 2006)
| Enzyme reaction | active sites | in ‘cell’ | in carboxysome | ||
|---|---|---|---|---|---|
| carbonic anhydrase hydration | 80 | 8 × 10⁴ | 8.8 × 10³ | 1.5 × 10⁷ | 3.2 × 10³ |
| carbonic anhydrase dehydration | 80 | 4.6 × 10⁴ | 1.5 × 10⁴ | 8.8 × 10⁶ | 9.3 × 10³ |
| RuBisCO carboxylation | 2160 | 26 | 178 | 1.8 × 10⁵ | 270 |
-
in cell and carboxysome refer to the volumetric reaction rate assuming the enzymes are distributed throughout the entire cell or only carboxysome. Vba (Vmax for carbonic anhydrase dehydration) is estimated by assuming Keq = 5 and using parameters found in (Heinhorst et al., 2006). Vca is Vmax for carbonic anhydrase hydration. Similarly, Kba, and Kca are for dehydration and hydration respectively.
Table 3
Fate of carbon brought into the cell for jc = 0.6cm/s and kc = 10–3cm/s
| formula | % of flux | ||
|---|---|---|---|
| transport | jcHout | 3.26 × 10⁻⁴ | |
| leakage | 3.2 × 10⁻⁴ | 98.6% | |
| CO2 leakage | 4.5 × 10⁻⁴ | 1.4 % | |
| carboxylation | 8.2 × 10⁻⁸ | 0.03 % | |
| oxygenation | 6.7 × 10⁻¹⁰ | 2 × 10⁻⁴ % |
Table 4
Fate of carbon brought into the cell for jc = 0.06 cm/s and kc = 10–3cm/s
| formula | % of flux | ||
|---|---|---|---|
| transport | jcHout | 2.8 × 10⁻⁵ | |
| leakage | 2.7 × 10⁻⁵ | 96.6 % | |
| CO2 leakage | 8.8 × 10⁻⁷ | 3.2 % | |
| carboxylation | 5.4 × 10⁻⁸ | 0.2 % | |
| oxygenation | 2.3 × 10⁻⁹ | 8 × 10⁻³ % |
Additional files
-
Supplementary file 1
Mathematical derivation appendix. Mathematical derivations of analytic solutions for a spherical cell with reactions organized in a variety of ways. We present analytic solutions for the concentration of CO2 and HCO3− a carboxysome located at the center of the cell. We derive analytic solutions assuming a number of different cases for the enzymatic rates in the carboxysome: RuBisCO reaction rate negligible with carbonic anhydrase saturated and unsaturated, RuBisCO reaction rate non-negligible with carbonic anhydrase unsaturated. Additionally we derive analytic solutions for the enzymatic reactions throughout the cell and localized to a scaffold without a carboxysome shell.
- https://doi.org/10.7554/eLife.02043.016
Download links
A two-part list of links to download the article, or parts of the article, in various formats.
Downloads (link to download the article as PDF)
Open citations (links to open the citations from this article in various online reference manager services)
Cite this article (links to download the citations from this article in formats compatible with various reference manager tools)
Systems analysis of the CO2 concentrating mechanism in cyanobacteria
eLife 3:e02043.
https://doi.org/10.7554/eLife.02043


