Resveratrol modulates the inflammatory response via an estrogen receptor-signal integration network
- The Scripps Research Institute, United States
- University of Illinois, United States
- PamGene International, Netherlands
Figures
Figure 1
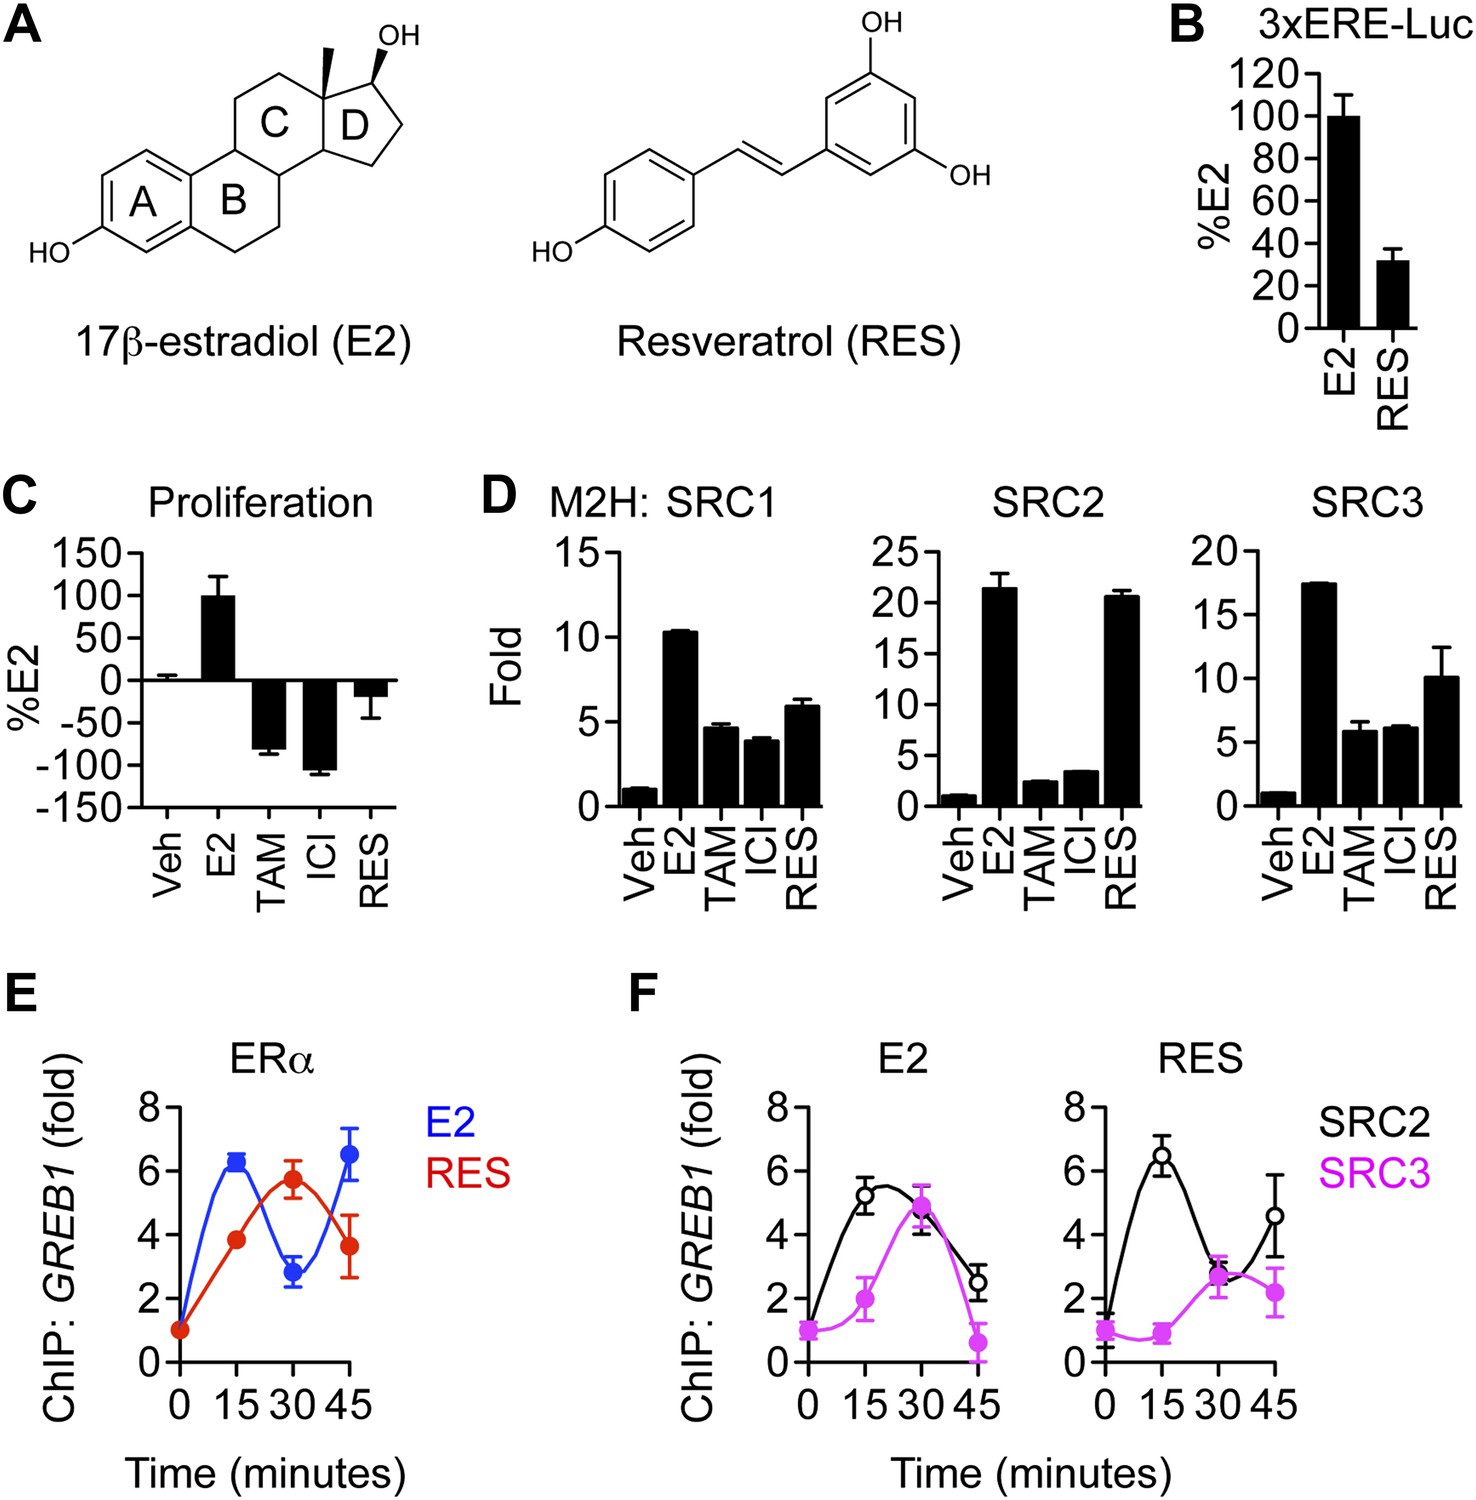
Effects of resveratrol on the canonical ERα proliferative pathway.
(A) Chemical structures of E2 and resveratrol. (B) Luciferase assay of MCF-7 cells transfected with 3xERE-luciferase reporter and stimulated with 10 nM E2 or 10 μM resveratrol. (C) Steroid-deprived MCF-7 cells were treated with 10 nM E2, 10 μM 4-hydroxytamoxifen (TAM), 10 μM ICI182, 780, or 10 μM resveratrol. After 7 days, cell number was determined with a standard curve. (D) Mammalian two-hybrid assays with ERα and the coactivators SRC1-3. HEK293 cells were transfected with Gal4 SRC1-3 fusions, ERα-VP-16, and the 5xUAS-luciferase reporter for 24 hr. Cells were treated with 10 nM E2, 10 μM TAM, 10 μM ICI, or 10 μM resveratrol for 24 hr and processed for luciferase activity. Data are presented in panels B–D as mean ± SEM. (E) Resveratrol-induced recruitment of ERα to the GREB1 promoter. Occupancy of GREB1 by ERα was compared by ChIP assay in MCF-7 cells that were steroid deprived for 3 days, treated with 10 nM E2 or 10 μM resveratrol, and fixed after 0, 15, 30, or 45 min (mean ± s.e.m. n = 2). (F) Resveratrol reduced SRC3 but not SRC2 recruitment at the GREB1 promoter. Occupancy of GREB1 by SRC2 and SRC3 were examined by ChIP assay in MCF-7 cells treated as described in panel A. Average promoter occupancies are shown as fold changes (mean ± SEM n = 2).
Figure 2 with 3 supplements
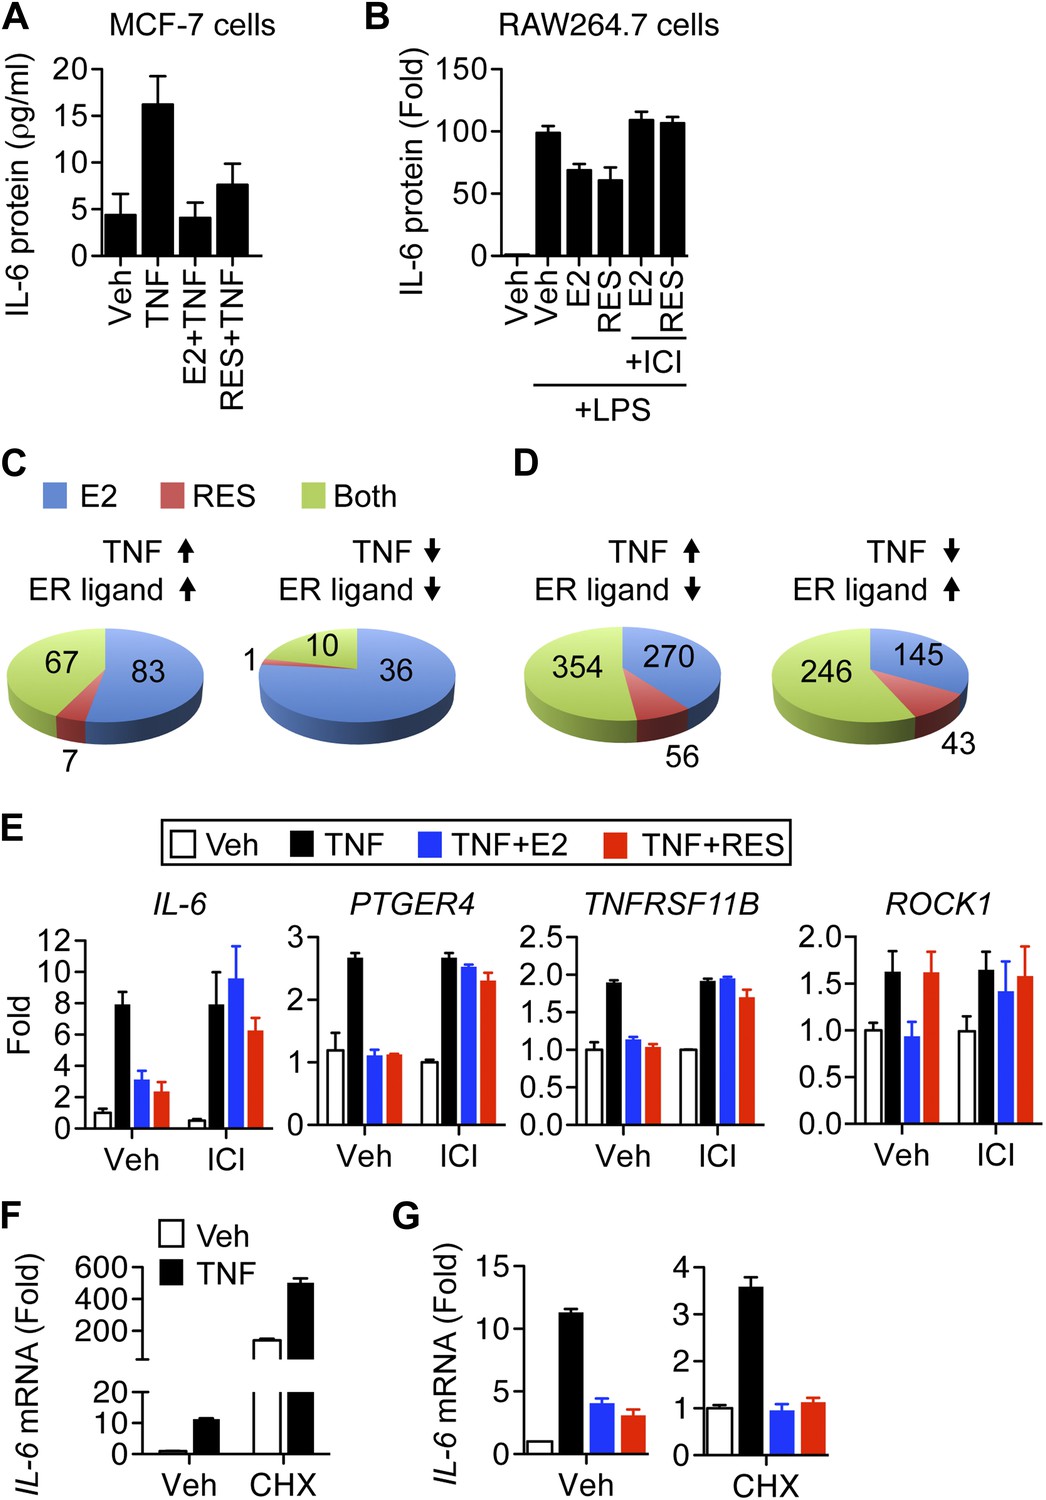
Resveratrol represses inflammatory genes through ER.
(A) MCF-7 cells were plated into charcoal-stripped phenol red free media and treated for 24 hr with 1 ng/ml TNFα ±10 μM E2, or 10 μM resveratrol. Secreted IL-6 protein was measured from the media using AlphaLISA. Mean ± SEM of biological triplicates are shown. (B) RAW264.7 macrophages were treated as in panel A, and stimulated with LPS as indicated. Mean ± SEM from biological triplicates are shown. (C and D) Steroid-deprived MCF-7 cells were treated for 4 hr with 10 ng/ml TNFα alone or in combination with 10 nM E2 or 10 μM resveratrol. Total RNA was reverse transcribed and analyzed using Affymetrix Genechip microarrays. Transcripts showing >twofold changes in expression upon TNFα stimulation were classified as indicated. Summary of genes regulated (C) in the same direction or (D) in opposite directions by TNFα and ER ligands are shown. (E) Steroid-deprived MCF-7 were pre-treated for 1 hr with ethanol vehicle or 1 μM ICI, and then treated as indicated with 10 ng/ml TNFα, 10 nM E2, and 10 μM resveratrol for 2 hr. Total RNA reverse-transcribed and analyzed by qPCR for the indicated mRNAs. Mean ± SEM of a representative experiment of biological duplicates are shown. (F and G) IL-6 mRNA levels in steroid-deprived MCF-7 cells pre-treated with vehicle or 10 μg/ml CHX for 1 hr and stimulated TNFα, E2, and resveratrol as in panel D for 3 hr were analyzed by qPCR. Levels in the control samples (first bar) of each graph were arbitrarily set to 1. Mean ± SEM of a representative experiment are shown.
Figure 2—figure supplement 1
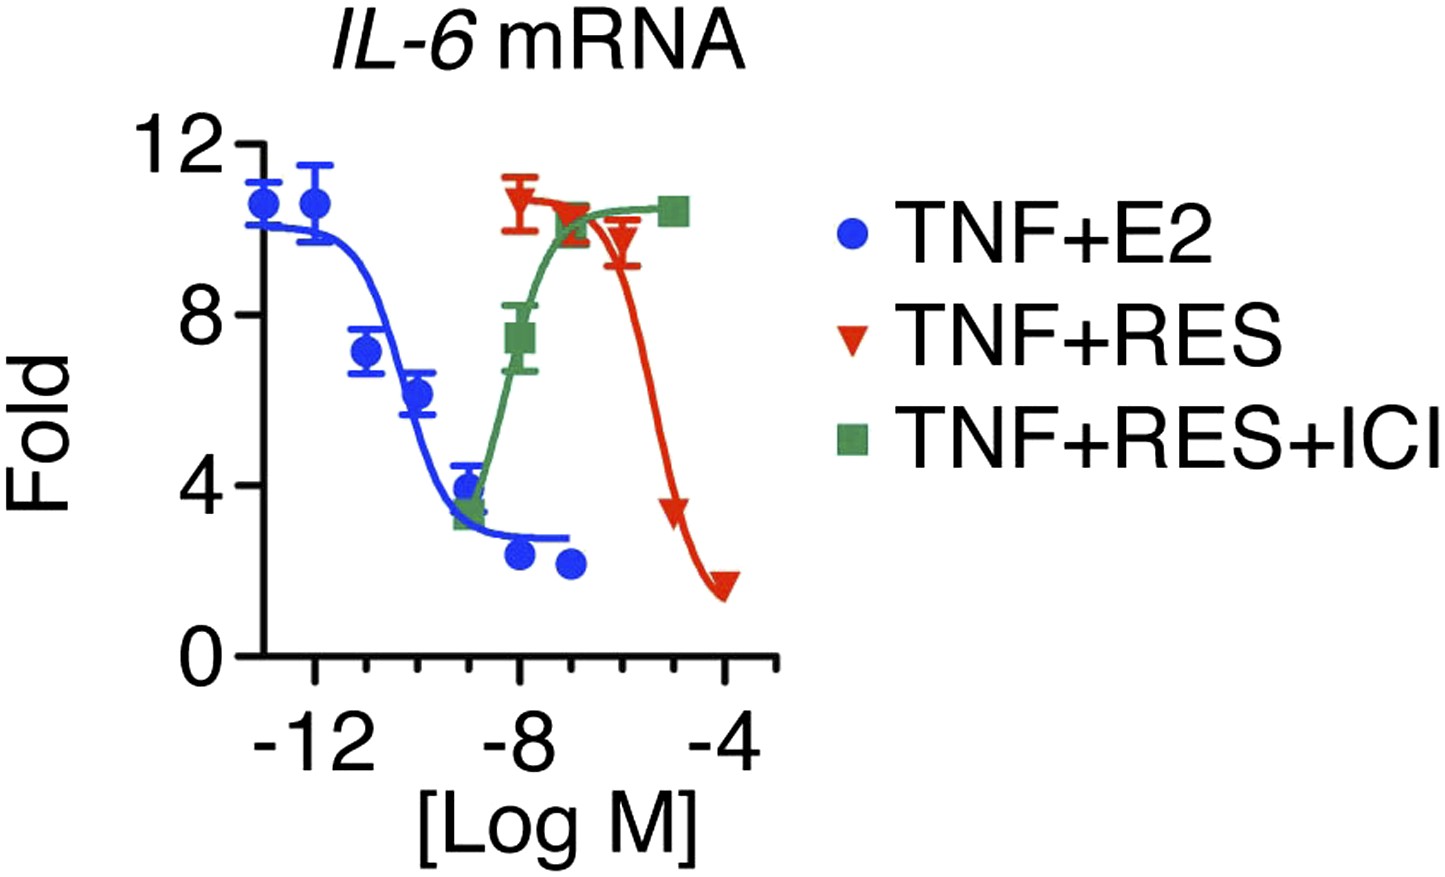
Resveratrol represses IL-6 in a dose-dependent manner.
Steroid-deprived MCF-7 cells were pretreated with ethanol vehicle or increasing doses of ICI for 1 hr, and then stimulated with 10 ng/ml TNFα in combination with increasing doses of E2 or RES for 2 hr. Relative IL-6 mRNA levels were determined by qPCR.
Figure 2—figure supplement 2
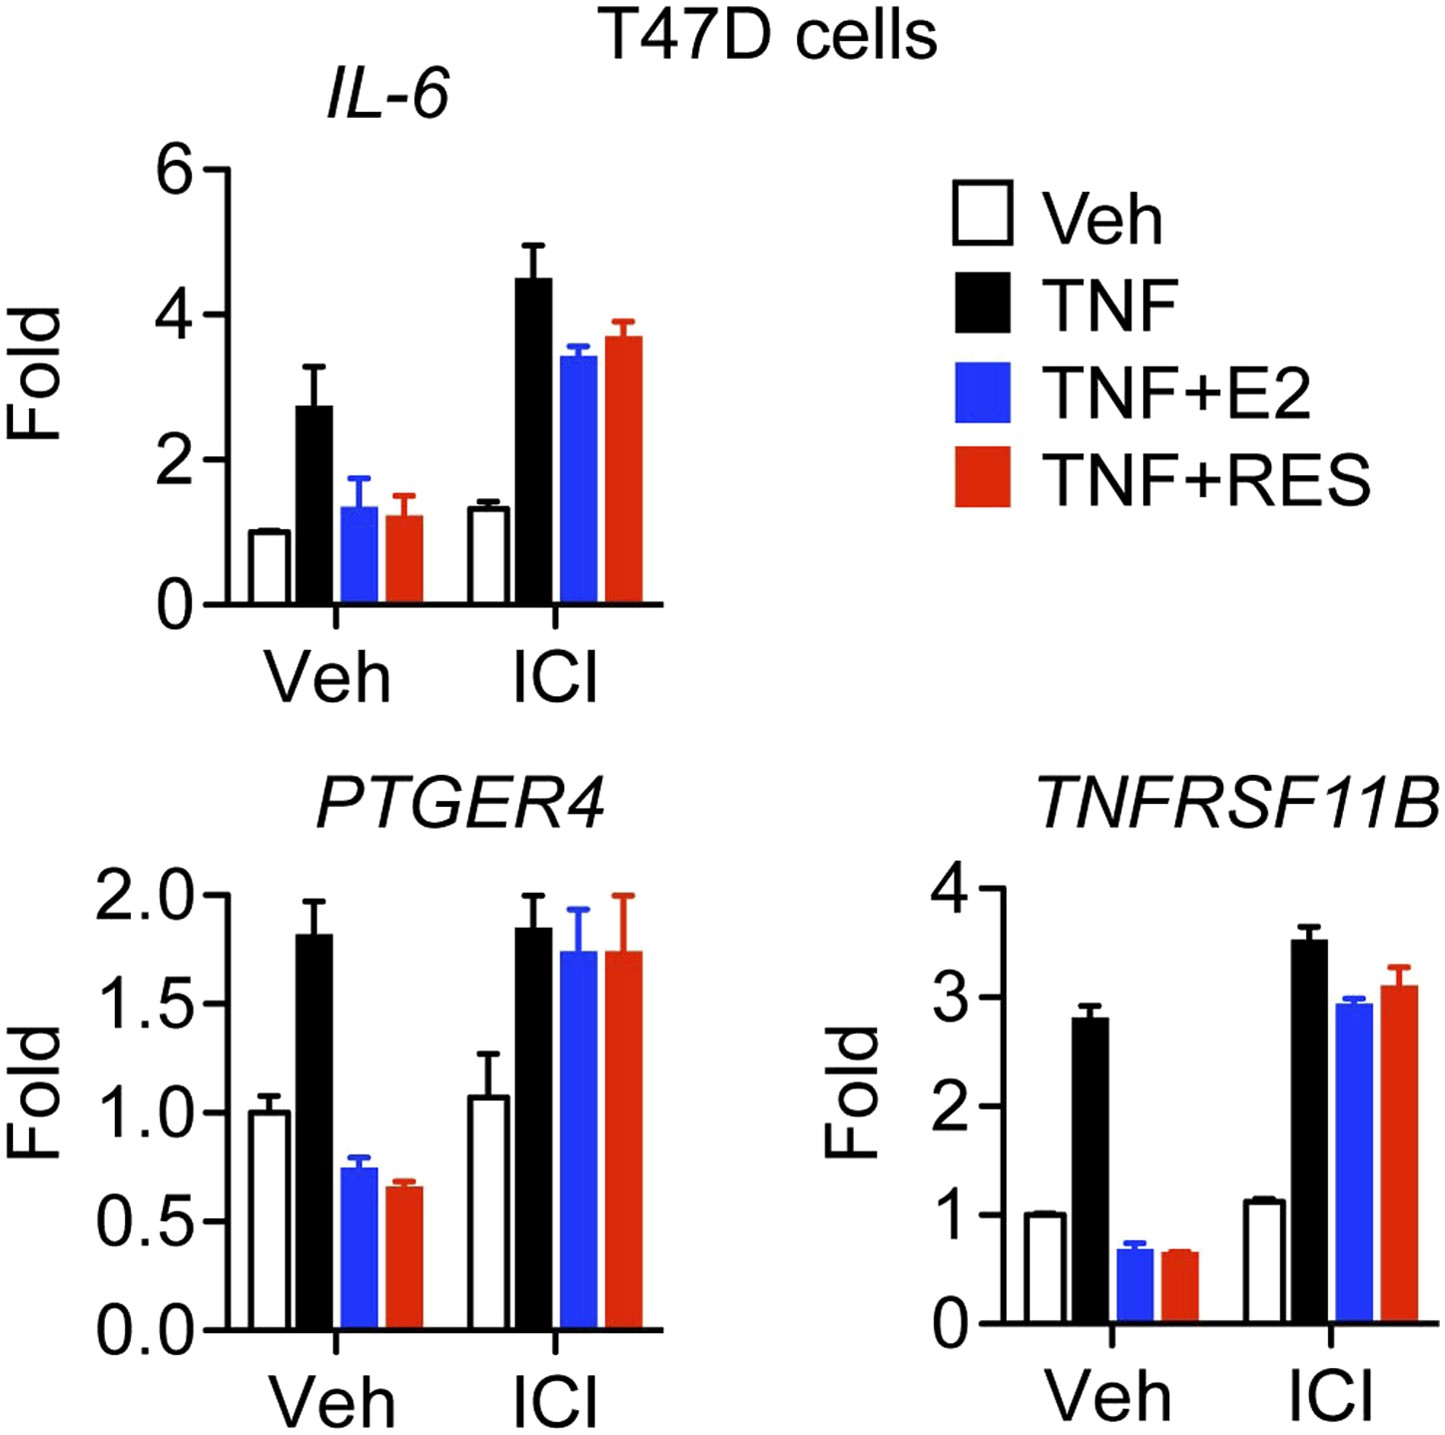
Resveratrol represses inflammatory genes through ER.
Steroid-deprived T47D cells were pretreated for 1 hr with ethanol vehicle or 1 μM ER antagonist ICI, and then treated as indicated with 10 ng/ml TNFα, 10 nM E2 and 10 μM resveratrol for 2 hr. Relative mRNA levels were determined by qPCR.
Figure 2—figure supplement 3

Resveratrol represses IL-6 in cycloheximide-treated cells.
IL-6 mRNA levels in steroid-deprived T47D cells pre-treated with vehicle or 10 μg/ml CHX for 1 hr and stimulated TNFα, E2, and resveratrol as in Figure 2—figure supplement 2 for 3 hr were analyzed by qPCR. Levels in the control samples (first bar) of each graph were arbitrarily set to 1. Mean ± SEM of a representative experiment are shown.
Figure 3 with 6 supplements

ERα adopts a resveratrol-specific conformation.
(A) Crystal structure of ERα LBD in complex with resveratrol. The LBD is shown as a ribbon diagram with one monomer colored gray and the other cyan, except for helix 12 (h12), colored magenta. The receptor-interacting peptide of SRC2 (coral tube) docks at the AF2 surface. (B) Structure of E2-bound ERα shows that the A-ring forms a hydrogen-bonding network that is conserved among steroid receptors. PDB ID: 1ERE. (C) Binding orientations of resveratrol. Compared to E2, resveratrol binds in two distinct orientations. Conformer #1 shows the expected binding orientation, with the phenol mimicking the A-ring of E2. In contrast, the ‘flipped’ conformer #2 with the resorcinol mimicking the A-ring of E2 was unexpected and predominant. Hydrogen bonds (dashes) and residues that contact the resveratrol molecule are shown. (D) 19F-NMR of F-resveratrol. The inset shows a narrow peak in the spectrum of F-resveratrol in buffer (half-height line width = 27 Hz), while the broad peak for F-resveratrol bound to ERα LBD (modeled in orange) fits best to two NMR resonances (colored red and blue), consistent with two distinct binding modes. (E–G) Crystal structure of the ERα LBD in complex with the control compound i.e., an A-CD ring estrogen (gray), was superposed on the resveratrol-bound structure (cyan). In panel E, resveratrol (green) shifts h3 Met343 to disrupt the normal packing of the h11–h12 loop, shifting the position of V534 by 2.5 Å. In panel F, resveratrol-induced shift in h3 is transmitted allosterically via ERαV355 and ERα I358 to SRC2 L693 within its 690LxxLL694 motif. Panel G shows the resveratrol-induced rotation of the SRC2 peptide.
Figure 3—figure supplement 1
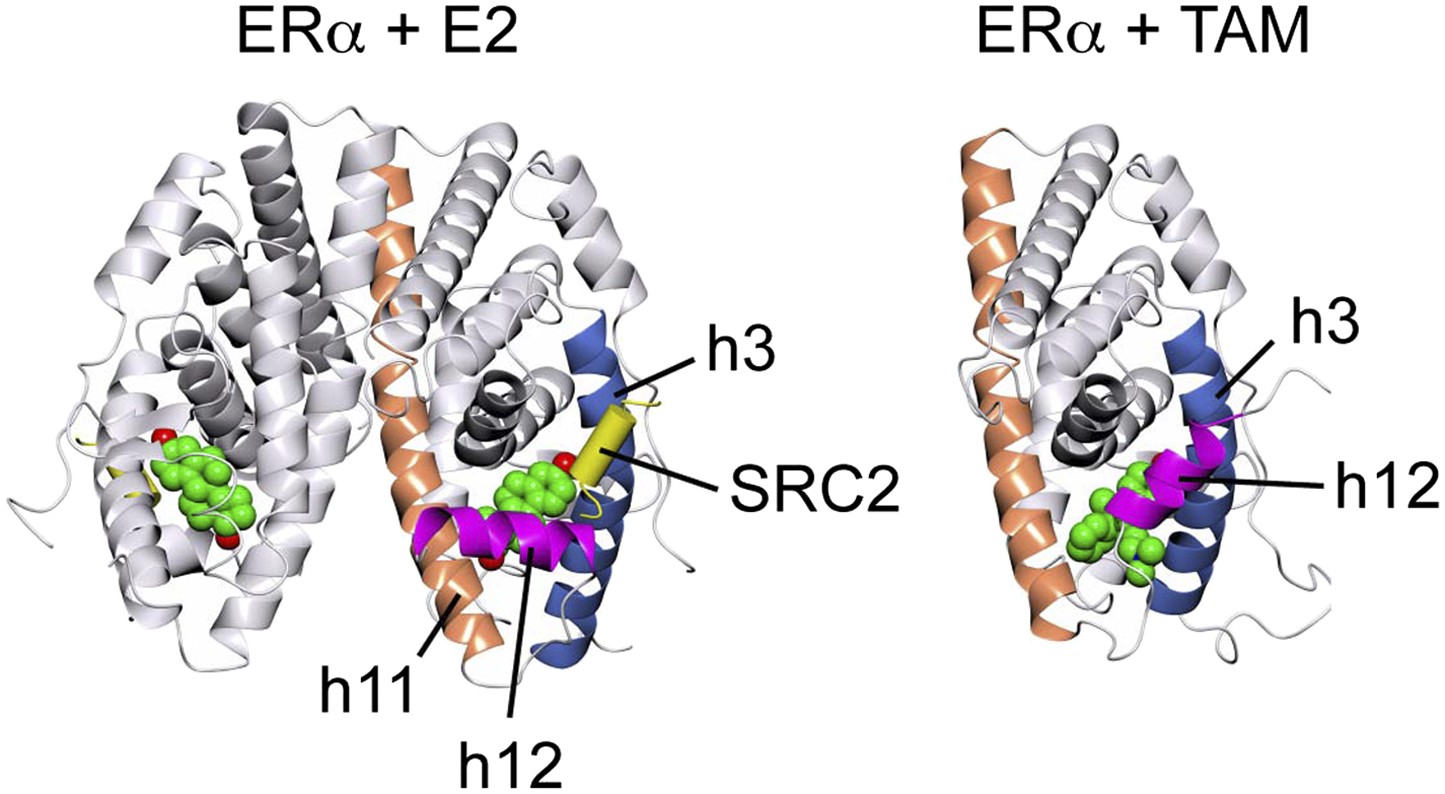
Crystal structures of the ERα LBD in complex with E2 and 4-hydroxytamoxifen (TAM).
In the E2-bound conformation, h12 lies across h11 and h3, thus allowing the LxxLL motif peptide of the coactivator, SRC2 to bind at the AF2 surface. In contrast, TAM directly relocates h12, which in turn occludes the AF2 surface. PDB IDs: 1GWR and 3ERT.
Figure 3—figure supplement 2
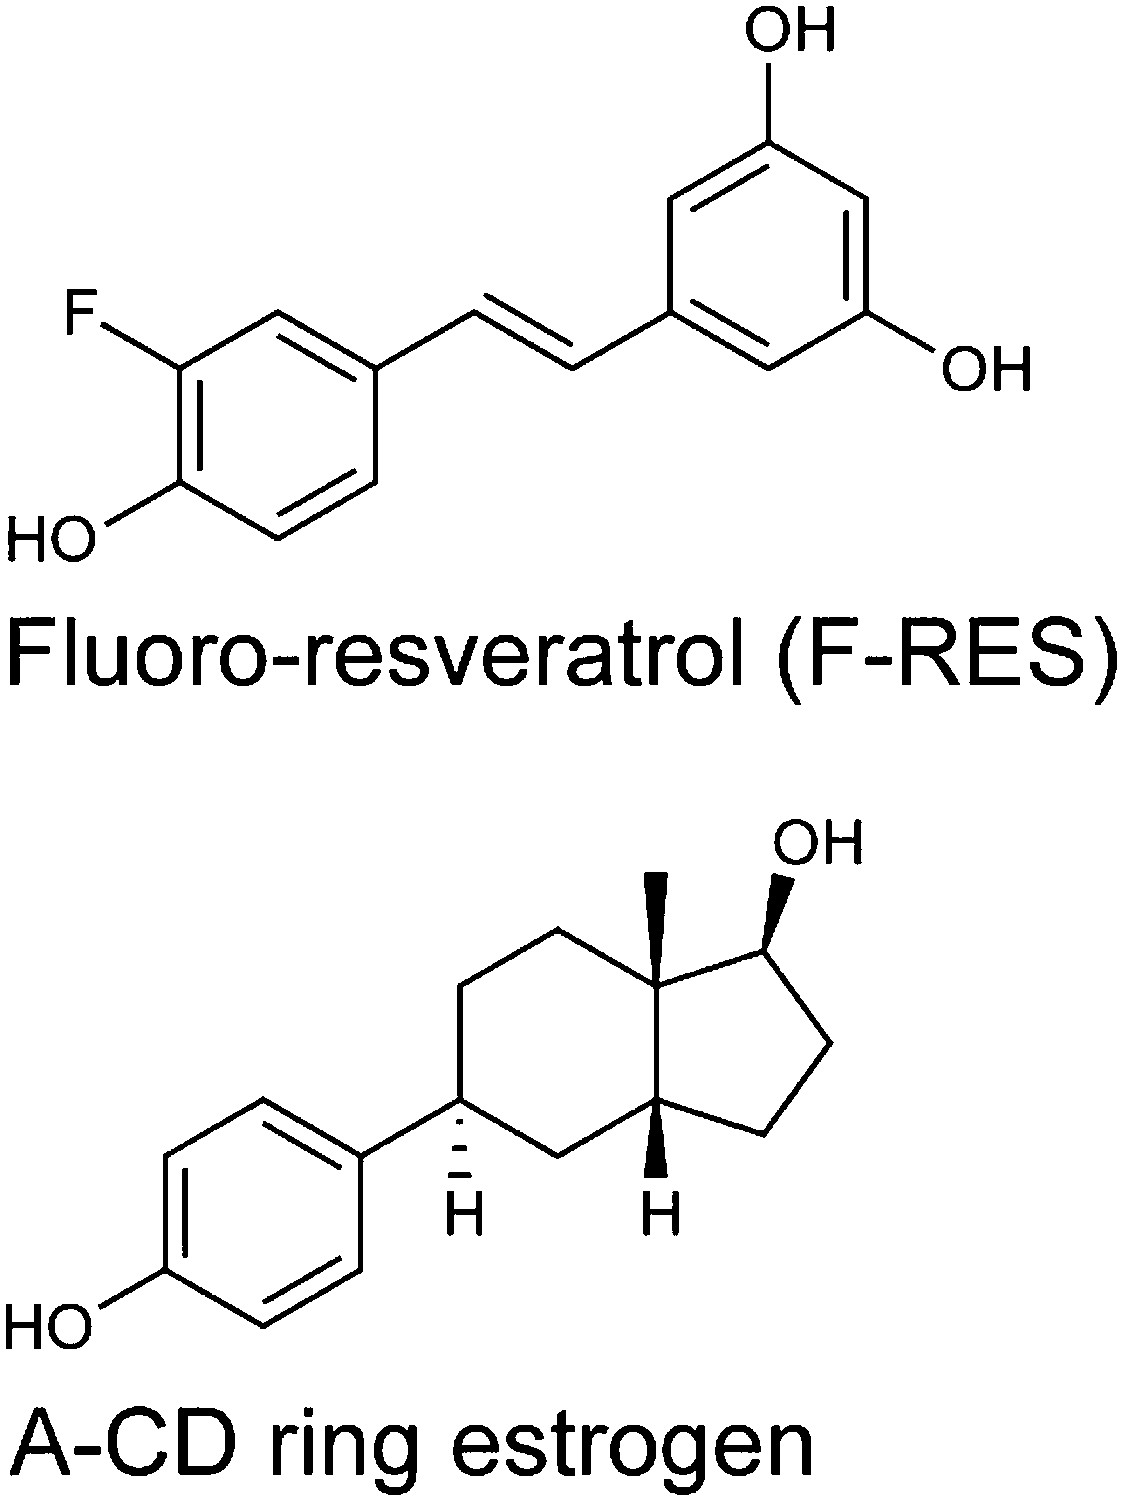
Chemical structures of F-resveratrol and the A-CD ring estrogen used as a structural control.
https://doi.org/10.7554/eLife.02057.010
Figure 3—figure supplement 3
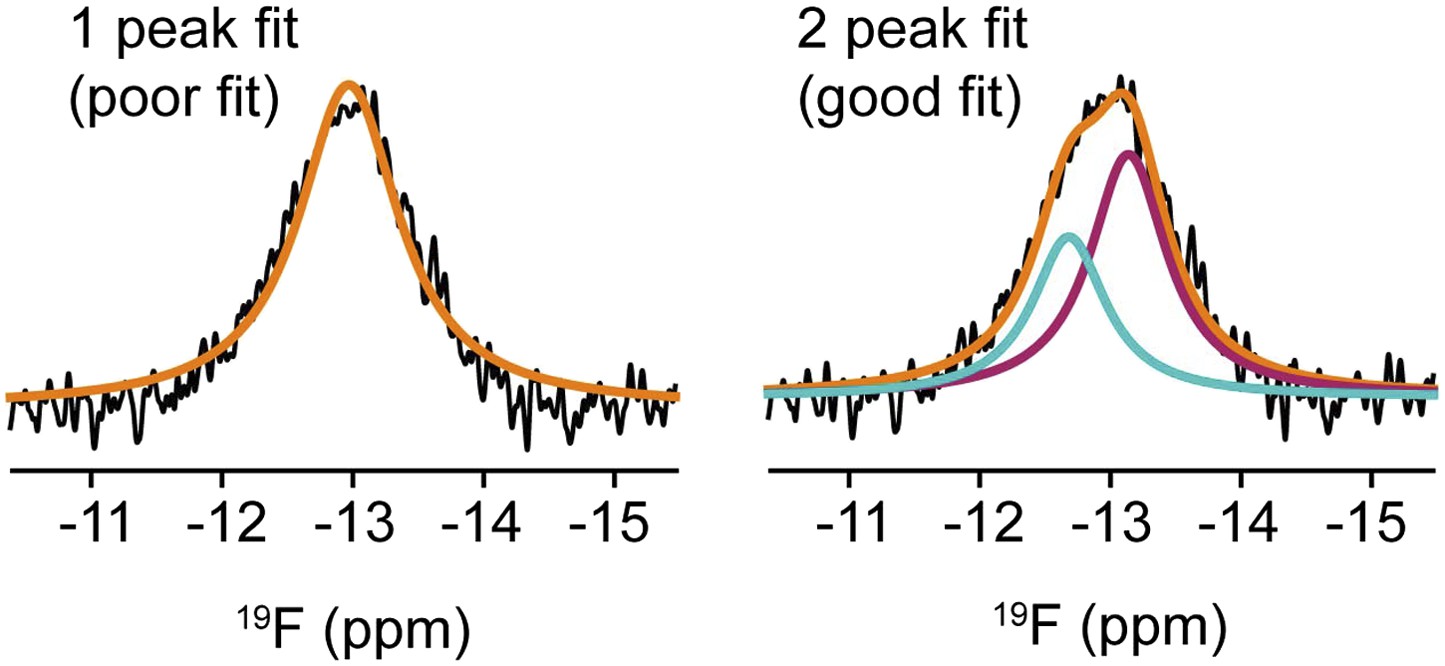
Deconvolution of NMR signal from F-resveratrol bound to ERα.
One or two peaks were fit to the F-resveratrol signal. The two-peak fit is significantly better than the one peak fit (Bayesian Information Criterion, or BIC, score for two peak fit is 96,550 while that for the one peak fit is 99,165; the lower BIC score indicates a significantly better fit).
Figure 3—figure supplement 4

F-RES also binds ERα in two orientations.
Crystal structure of the ERα LBD in complex with F-RES showing ligand-binding orientations observed within the pockets.
Figure 3—figure supplement 5

Electron density maps of resveratrol and F-resveratrol within the ERα ligand-binding pocket.
The 2Fo-Fc maps (blue) were contoured at 1σ, while Fo-Fc difference maps (red and green) were contoured at 3σ to indicate where the model is wrong. Red indicates clashes, while green indicates omissions. Densities observed after molecular replacement and autobuild, and before ligand docking (None); after docking and refinement with the obvious ligand conformer (Add #2), or both ligand conformers (Add both); and upon shaking coordinates by 1 Å, and refinement with simulated annealing after removal of either ligand conformer (Remove #1 or Remove #2).
Figure 3—figure supplement 6
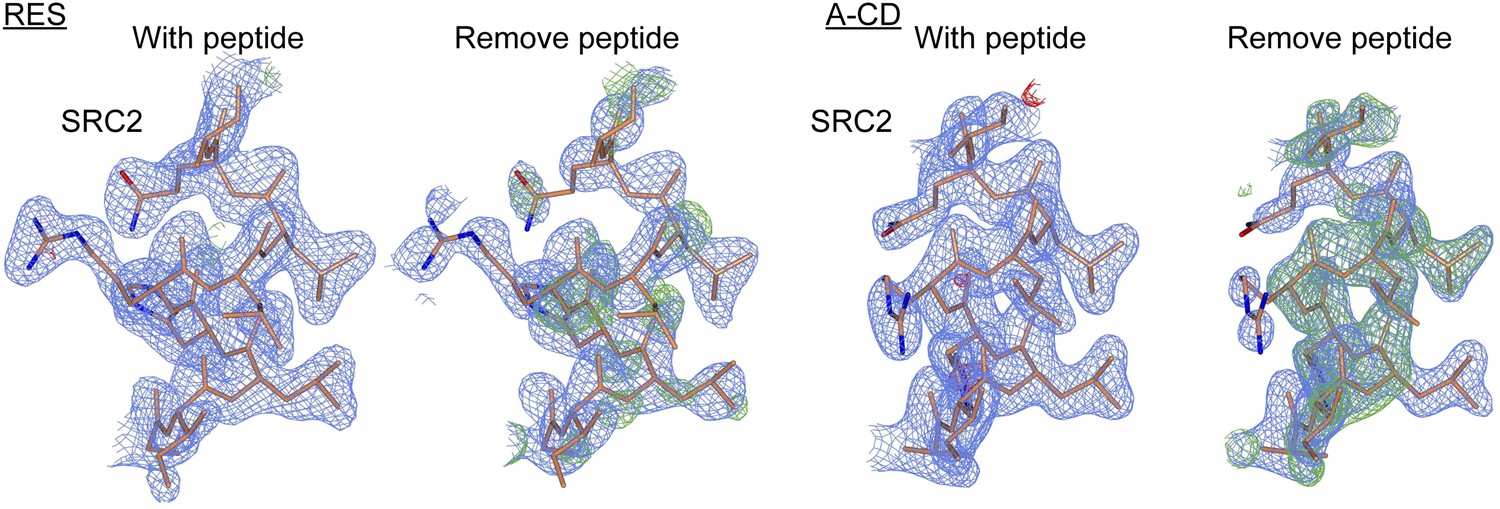
Electron density maps of SRC2 peptides docked at the AF2 surface.
The electron density maps (shown as described in Figure 3—figure supplement 5) of the SRC2 peptide obtained from the resveratrol- and A-CD ring estrogen-bound structures, upon shaking coordinates by 1 Å, and refinement with simulated annealing, with or without removing the peptide. The peptide is shown in both cases for comparison.
Figure 4 with 2 supplements
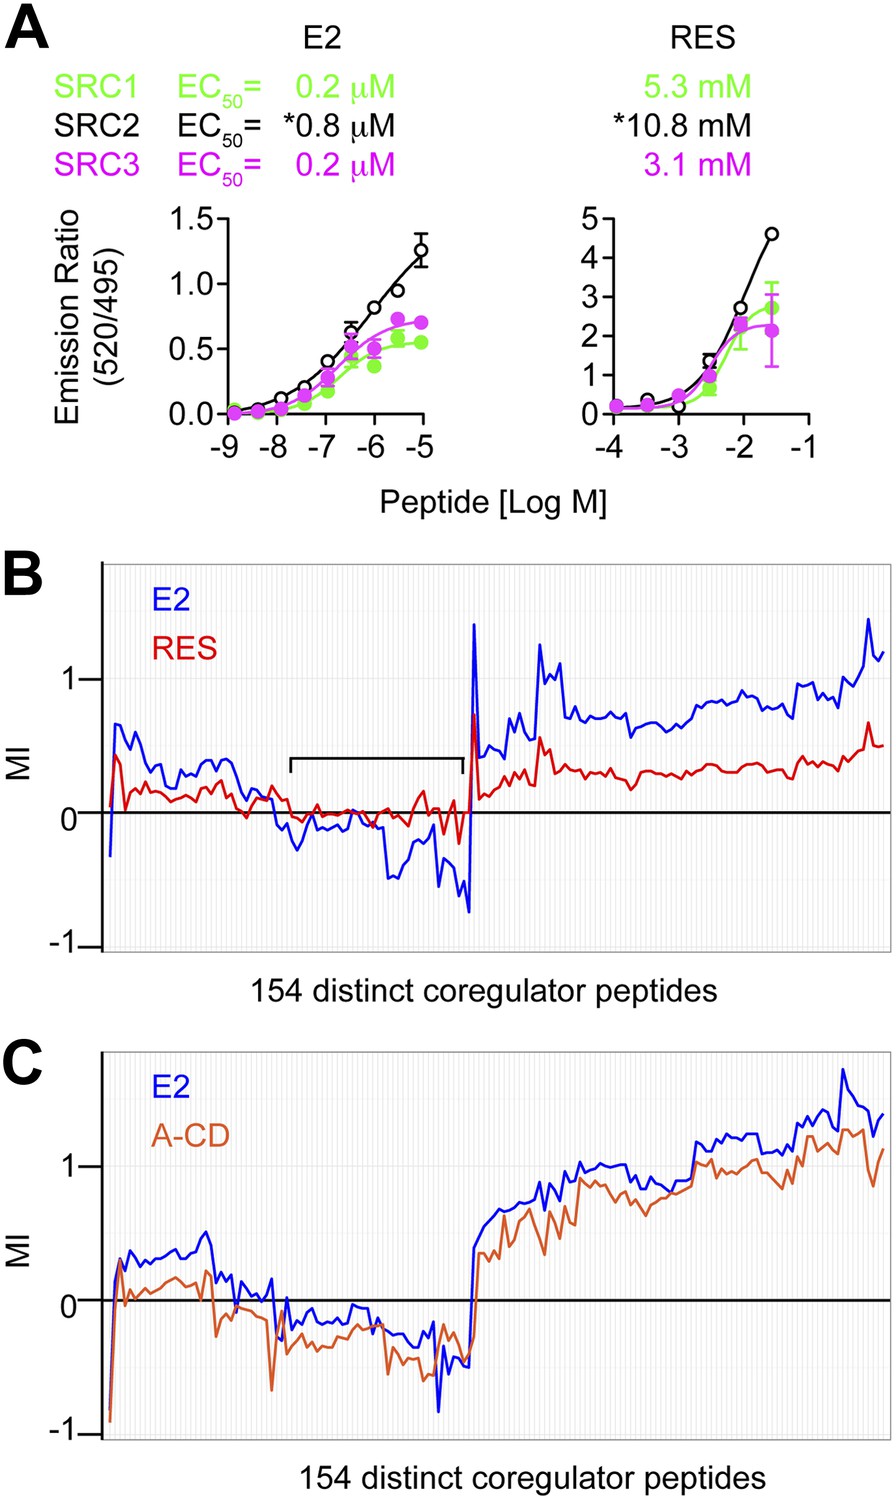
Resveratrol alters the binding of coregulator peptides to the ERα LBD.
(A) E2- and resveratrol-induced binding of SRC1, SRC2, and SRC3 peptides to the ERα LBD were compared using LanthaScreen assay performed at fixed ligand concentrations, with increasing doses of SRC peptides. Mean ± SEM (n = 3) are shown. *EC50 could not be determined accurately since the saturating SRC2 peptide dose is unclear. (B and C) Hierarchical clustering of coregulator peptide-binding at the AF2 surface induced by 1 μM E2, (B) 100 μM resveratrol or (C) 1 μM A-CD ring estrogen, was performed using the quantitative in vitro assay, MARCoNI. MI >0 suggests ligand-induced recruitment, while MI <0 suggests ligand-dependent dismissal of a peptide compared to DMSO vehicle. The black bracket shows a cluster of E2 dismissed peptides that are not dismissed by resveratrol. See Figure 4—figure supplement 2 for more details.
Figure 4—figure supplement 1

SRC peptides.
The SRC peptides shown exhibited the highest E2-induced binding to ERα and were therefore used for the LanthaScreen assay. The sequence bound to the AF2 surface in the resveratrol- and A-CD ring crystal structures is underlined.
Figure 4—figure supplement 2
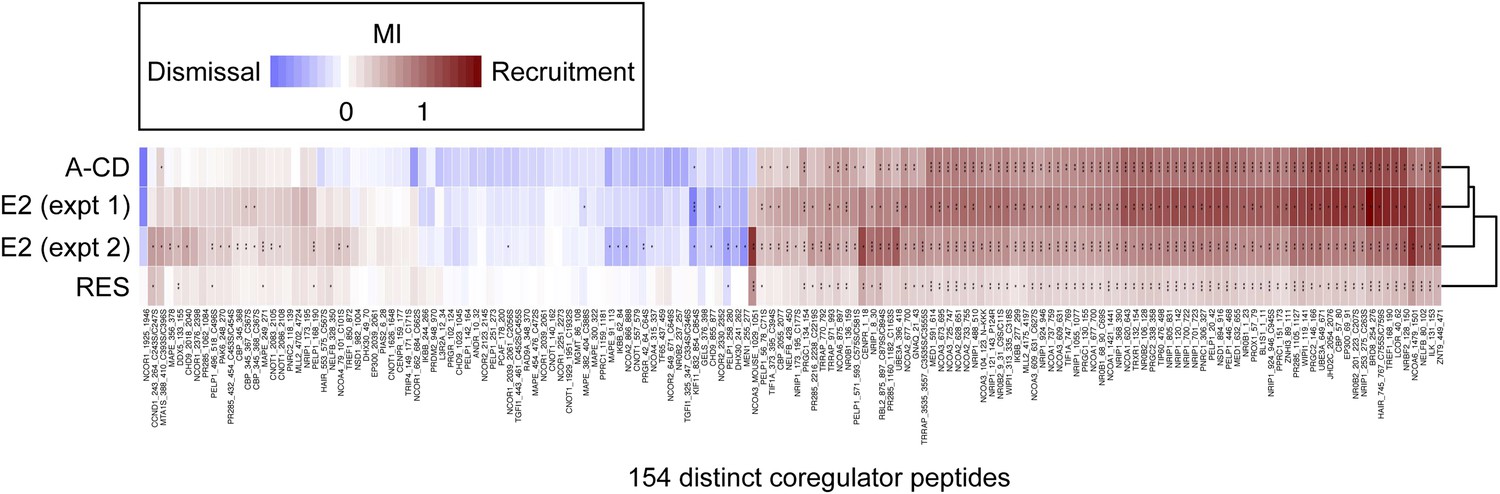
Details of proteomic comparison of ligand-induced binding of coregulator peptides using MARCoNI.
Statistically significant changes relative to vehicle were identified by Student's t-test. *p<0.05, **p<0.01 or ***p<0.001.
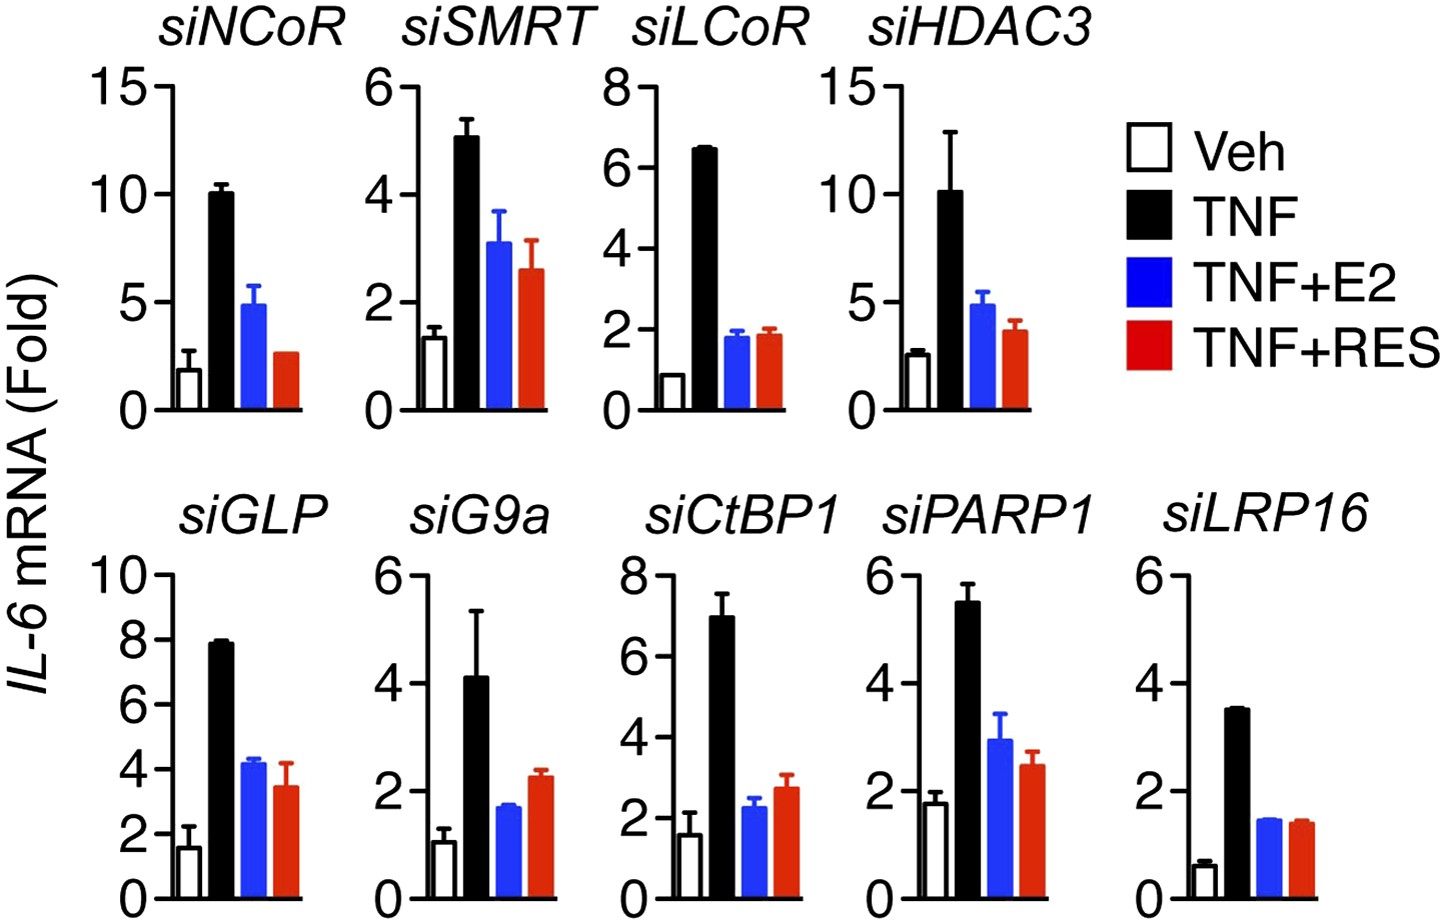
Figure 5 with 2 supplements

Molecular requirements for resveratrol- and E2-mediated suppression of IL-6.
(A–E) MCF-7 cells were transfected with the indicated siRNAs and steroid-deprived for 48 hr. The cells were then treated with 10 ng/ml TNFα and 10 μM resveratrol or 10 nM E2 for 2 hr. IL-6 mRNA levels were compared by qPCR, and are shown relative to the cells treated with ethanol vehicle and control siRNA. The small-scale siRNA screen was repeated three different times. Mean ± SEM are shown.
Figure 5—figure supplement 1
Molecular requirements for resveratrol- and E2-mediated suppression of IL-6.
MCF-7 cells were transfected with the indicated siRNAs and steroid-deprived for 48 hr. The cells were then treated with 10 ng/ml TNFα and 10 μM RES or 10 nM E2 for 2 hr. Total RNA was analyzed by qPCR. Changes IL-6 mRNA levels are shown relative to the cells treated with ethanol vehicle and siRNA control. The small-scale siRNA screen was repeated three different times. The mean ± SEM are shown.
Figure 5—figure supplement 2
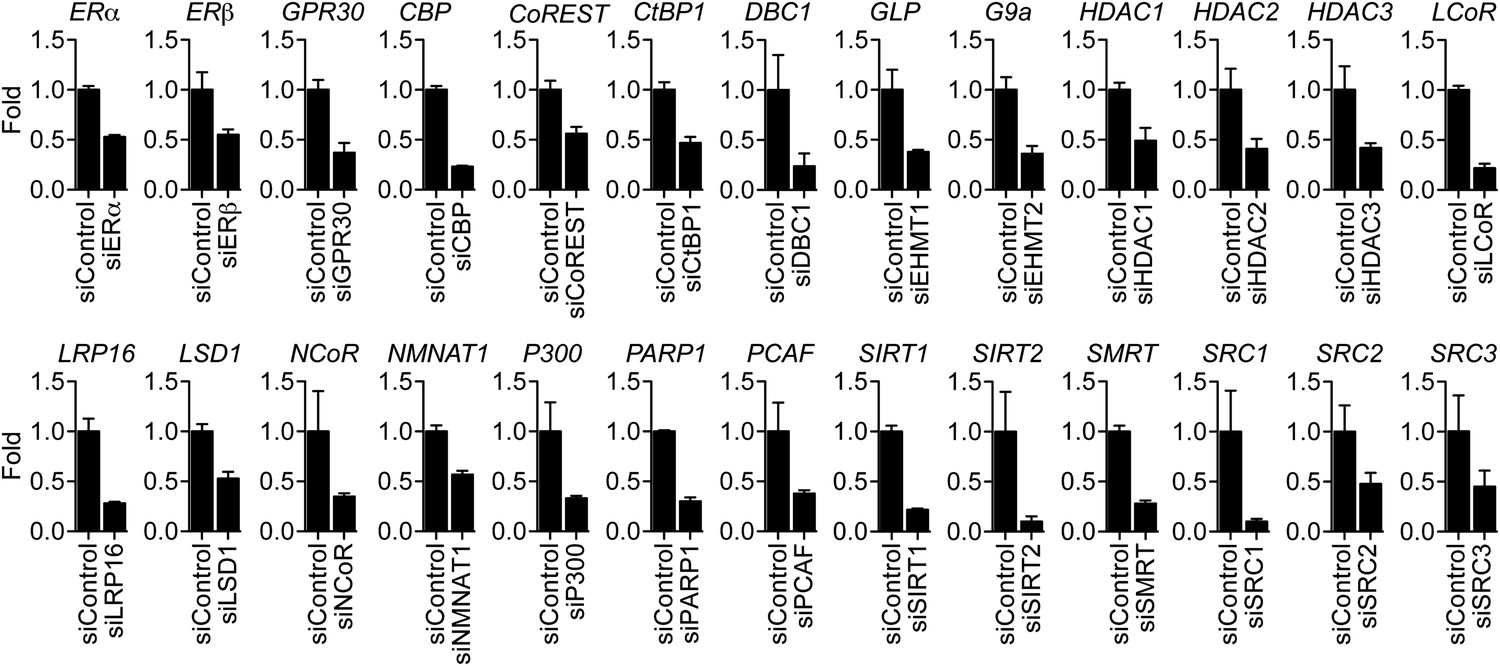
Effect of siRNAs on target mRNA levels.
MCF-7 cells were transfected with the indicated siRNAs, steroid-derived for 48 hr and analyzed by qPCR for the indicated mRNAs. Mean +SEM of duplicate experiments are shown.
Figure 6 with 2 supplements
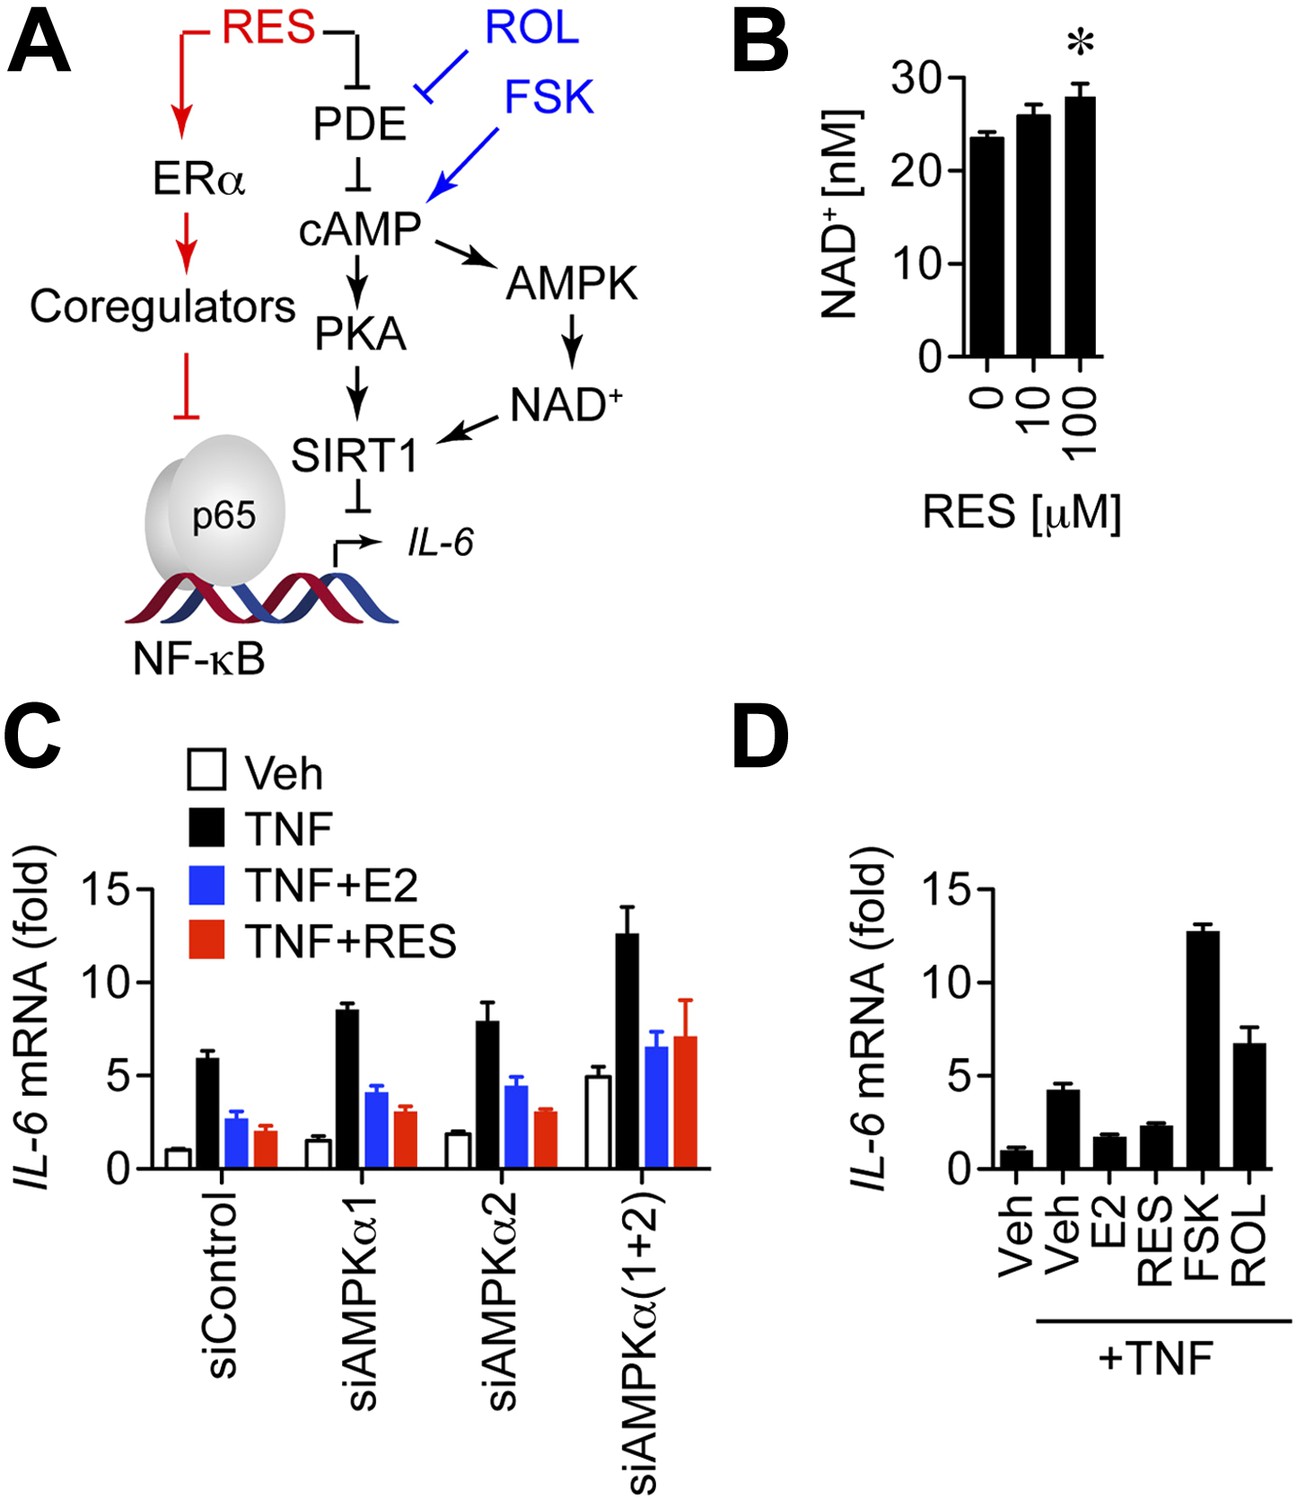
Resveratrol does not repress IL-6 through the cAMP or AMPK pathways.
(A) Resveratrol stimulates ERα activity and inhibits cAMP-specific phosphodiesterases (PDEs) to activate cAMP SIRT1, and AMPK. The small molecule compounds i.e., the adenylyl cyclase activator forskolin (FSK) and the PDE inhibitor rolipram (ROL) used to further dissect this signaling network are shown in blue. (B) Resveratrol increases intracellular NAD+ levels. Average intracellular NAD+ concentrations were determined in MCF-7 cells treated with resveratrol for 5 min. Unpaired Student's t test (mean ± SEM, n = 6) was used to determine statistical significance. *p=0.006. (C) IL-6 mRNA levels in steroid-deprived MCF-7 cells transfected with the indicated siRNAs and treated as described in Figure 5, were compared by qPCR. Mean ± SEM of representative biological duplicates are shown. (D) Steroid-deprived MCF-7 cells were treated with 10 ng/ml TNFα, 10 nM E2, 10 μM resveratrol, 10 μM FSK, and 25 μM ROL as indicated for 2 hr. Relative IL-6 mRNA levels were compared by qPCR. Mean ± SEM of representative biological duplicates are shown.
Figure 6—figure supplement 1
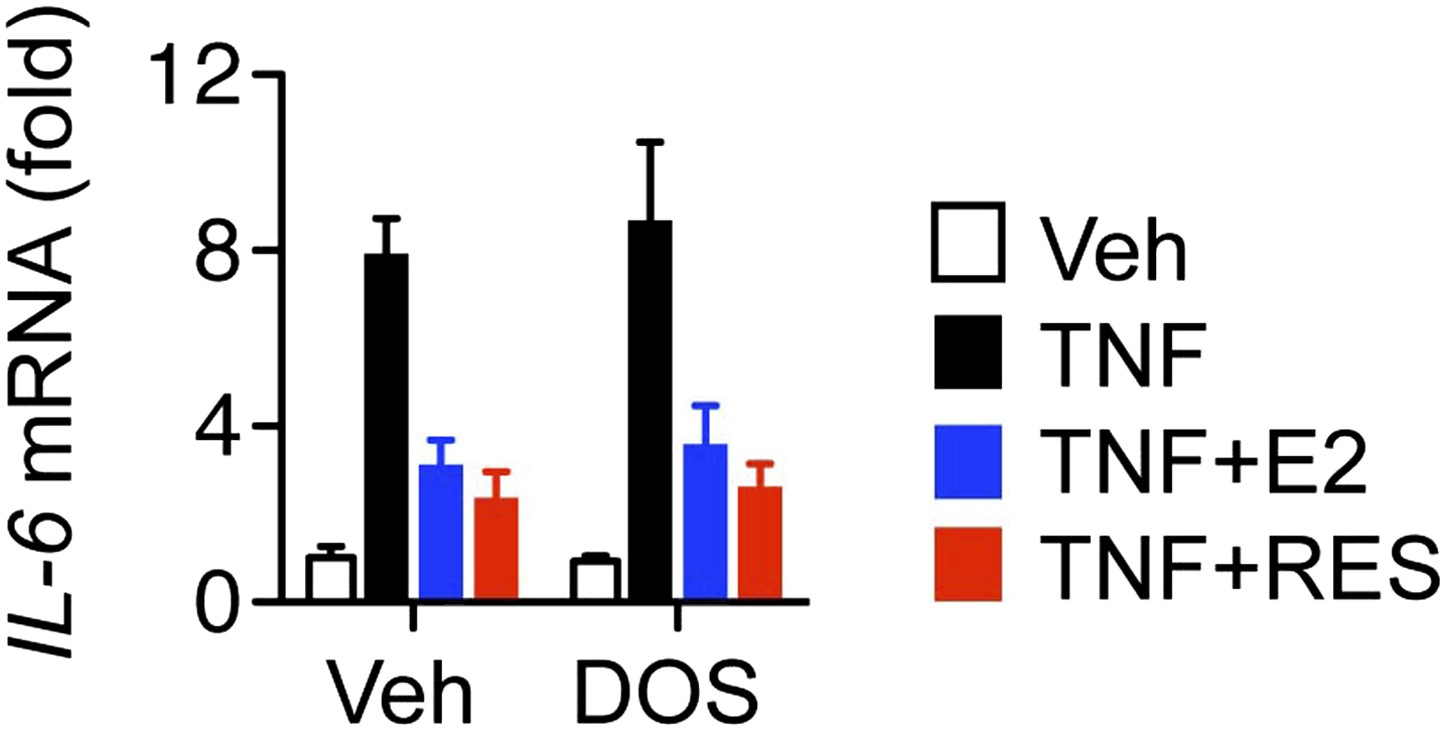
Resveratrol represses IL-6 in cells dorsomorphin-treated cells.
Steroid-deprived MCF-7 cells were pre-treated with DMSO control or 1 μM Dorsomorphin (DOS) for 30 min, and then treated as indicated with TNF, E2 and RES for 2 hr. Relative IL-6 mRNA levels were determined by QPCR. Shown are mean ± SEM of representative biological duplicates.
Figure 6—figure supplement 2
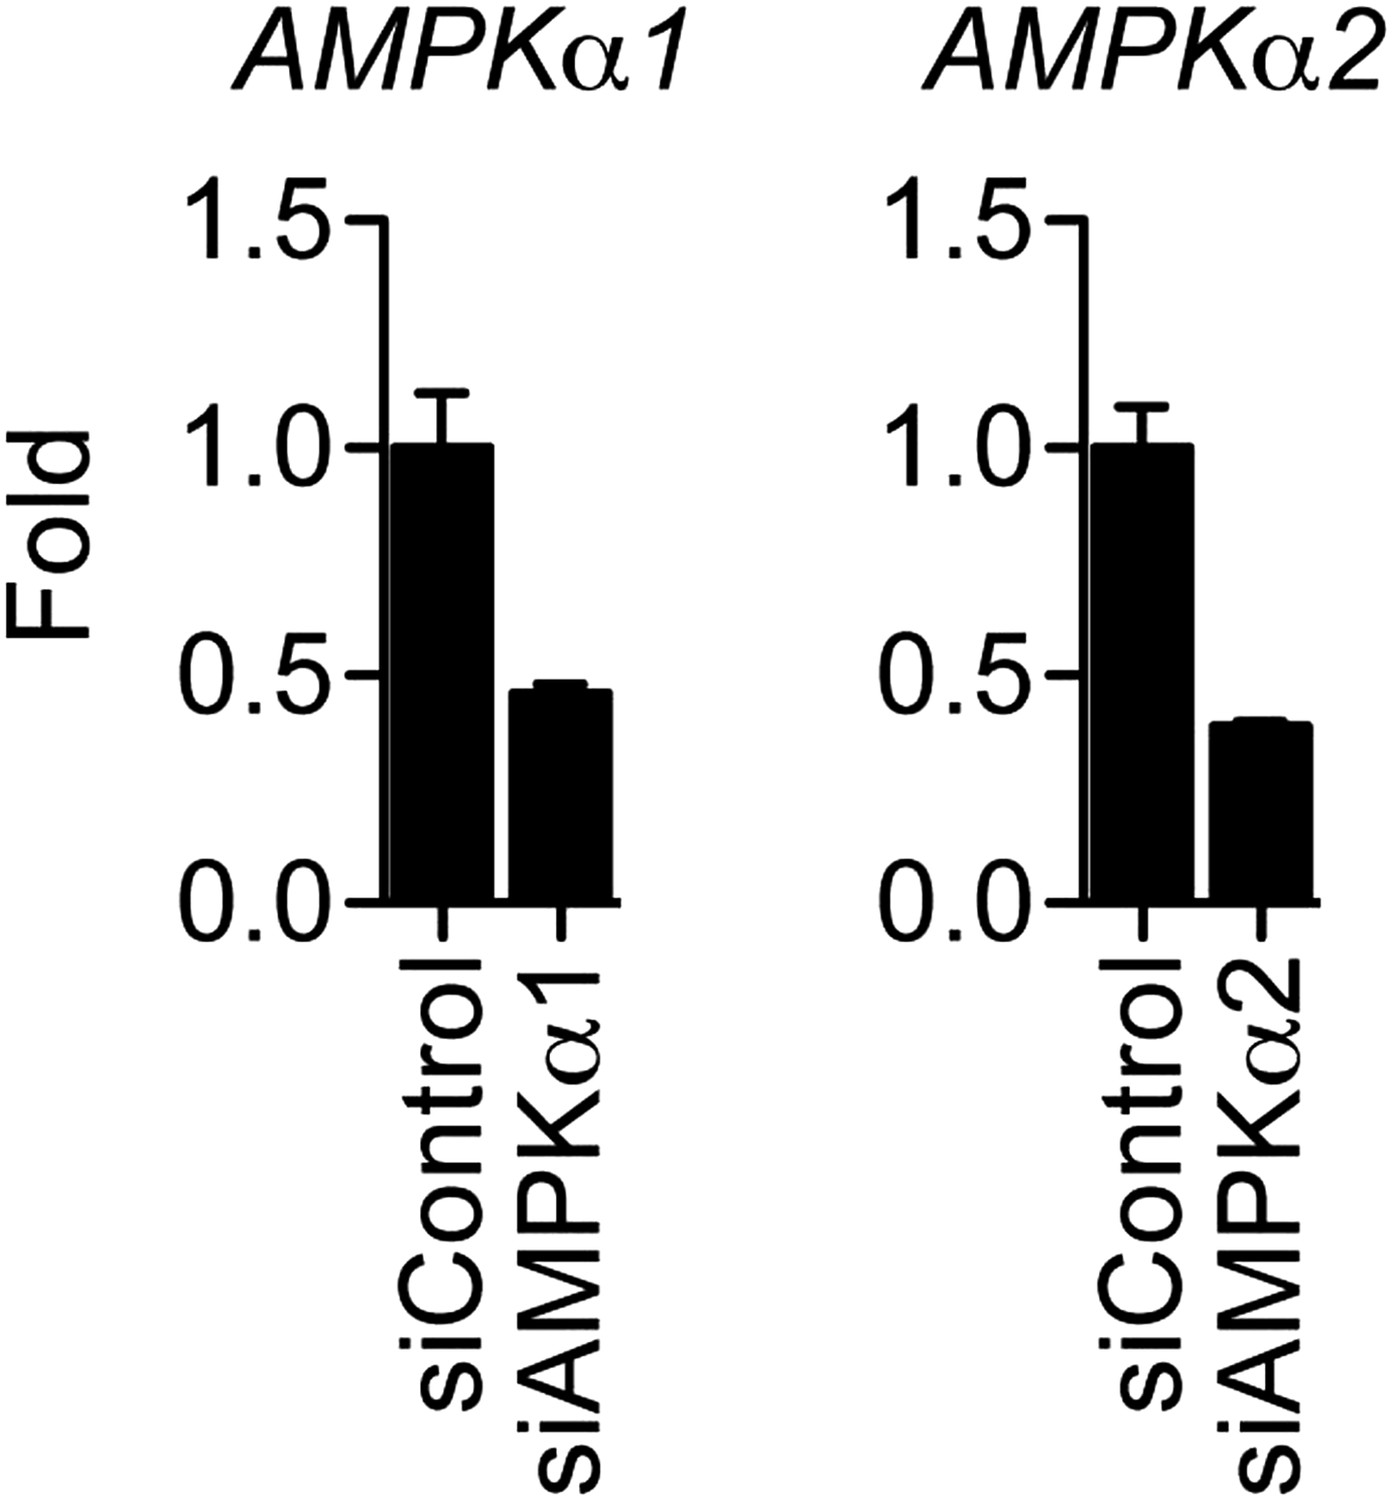
Effect of siRNAs on the mRNA levels of AMPK catalytic subunits.
MCF-7 cells were transfected with the indicated siRNAs, steroid-derived for 48 hr and analyzed by qPCR for the indicated mRNAs. Mean +s.e.m of duplicate experiments are shown.
Figure 7 with 5 supplements
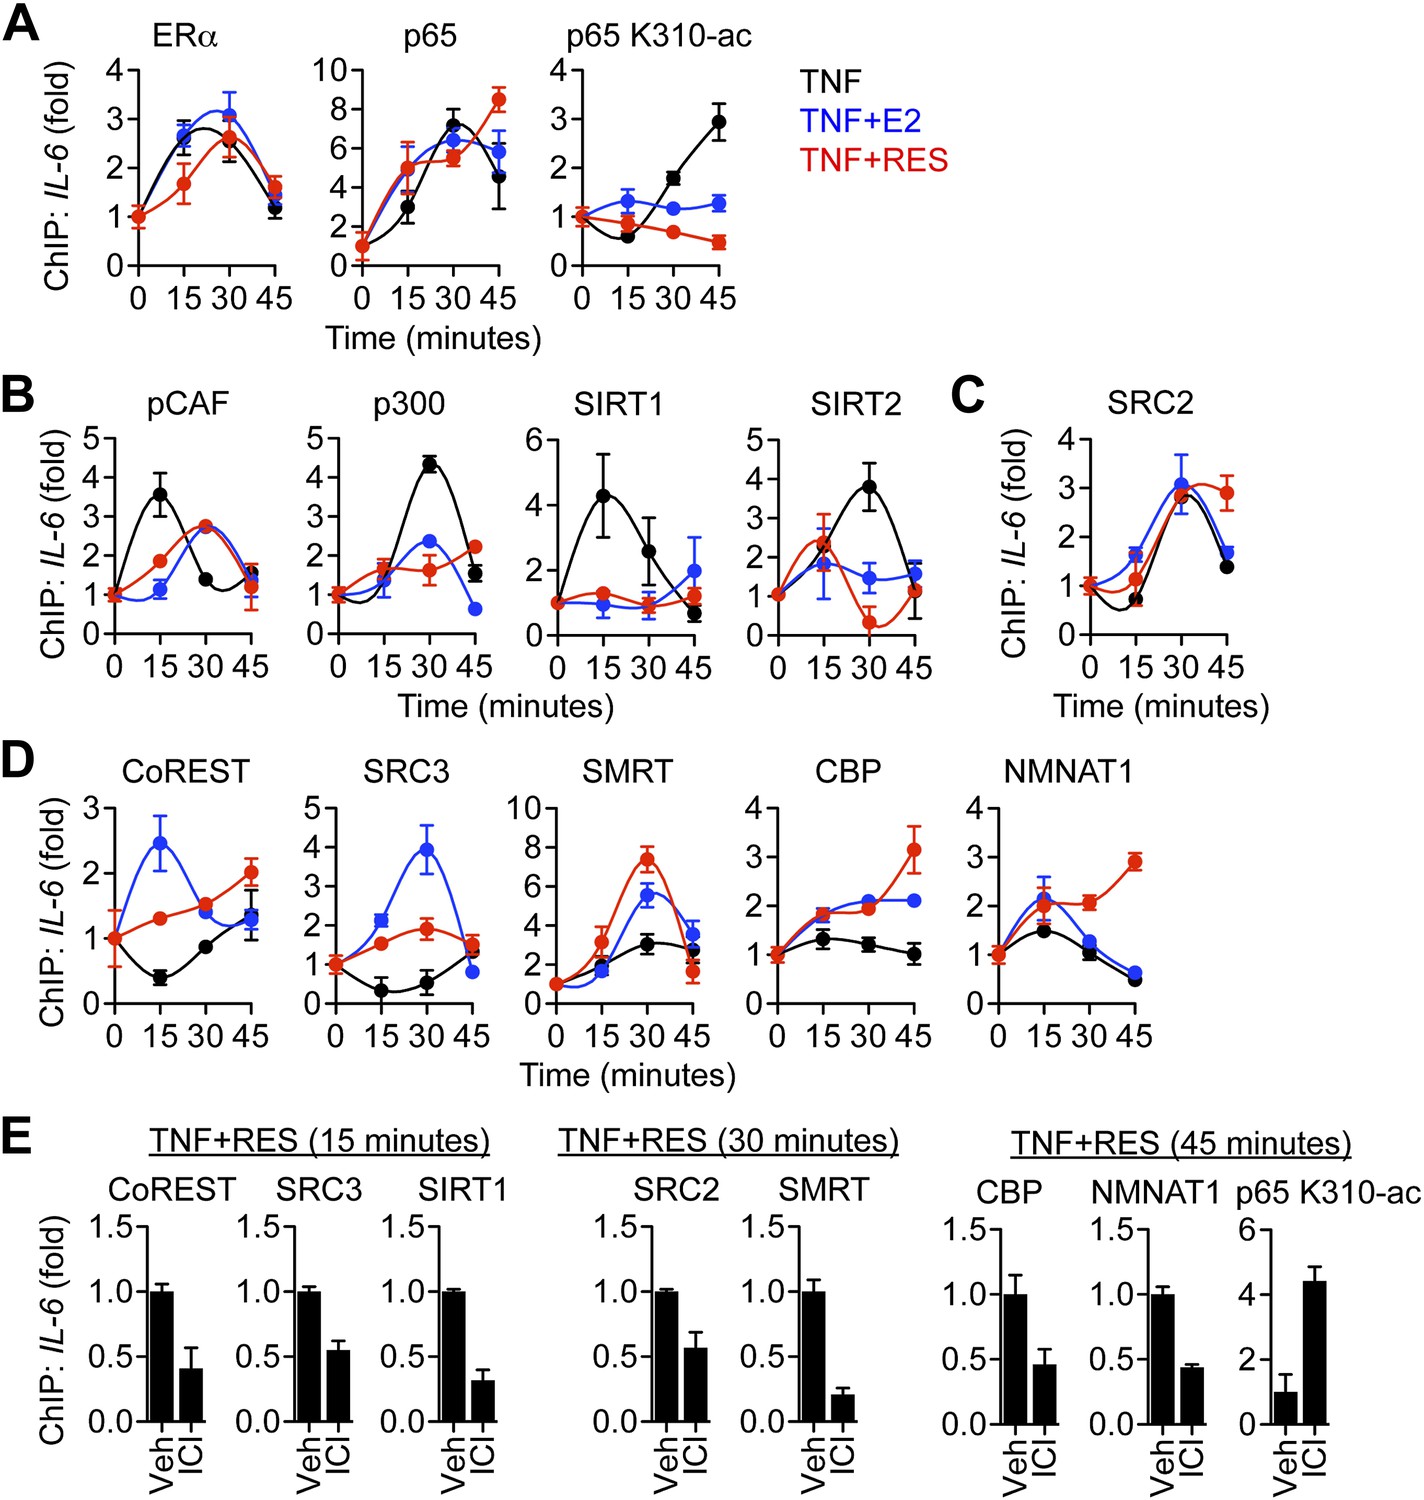
ERα orchestrates ligand-dependent coregulator exchange at the IL-6 promoter.
(A–D) Occupancy of the indicated factors at the IL-6 promoter were compared by ChIP assay in steroid-deprived MCF-7 cells treated with 10 ng/ml TNFα alone or in combination with 10 nM E2 or 10 μM resveratrol, and fixed after 0, 15, 30, and 45 min (mean ± SEM n = 3) (E) Effect of ICI on promoter occupancy was determined by ChIP assay in steroid-deprived MCF-7 cells were pretreated with vehicle or 1 μM ICI for 1 hr, stimulated with 10 ng/ml TNFα plus 10 μM resveratrol, and fixed after 15, 30, or 45 min. Average promoter occupancies are shown as fold changes (mean ± SEM n = 3).
Figure 7—figure supplement 1
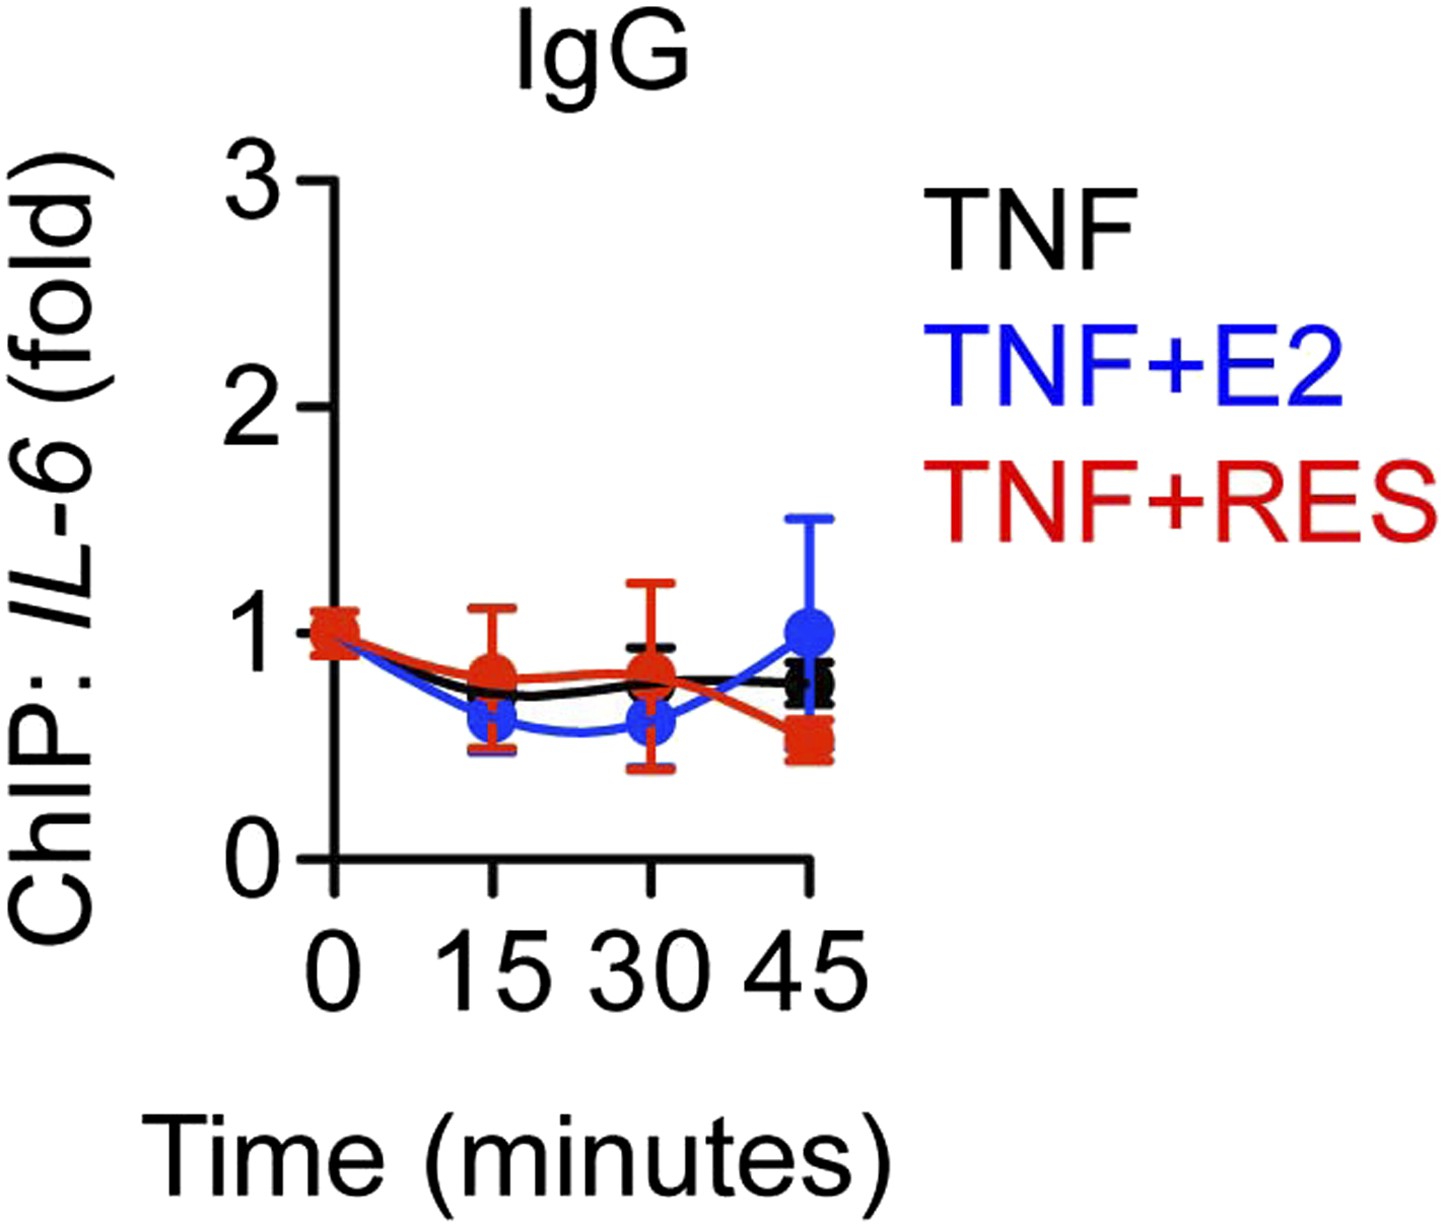
Control ChIP assay.
As a control, ChIP assay was performed using pre-immune rabbit IgG to compare MCF-7 cells treated with 10 ng/ml TNFα and 10 μM RES and 10 nM E2 for 0, 15, 30 and 45 min. Average promoter occupancies are shown as fold changes (mean ± SEM n = 3).
Figure 7—figure supplement 2
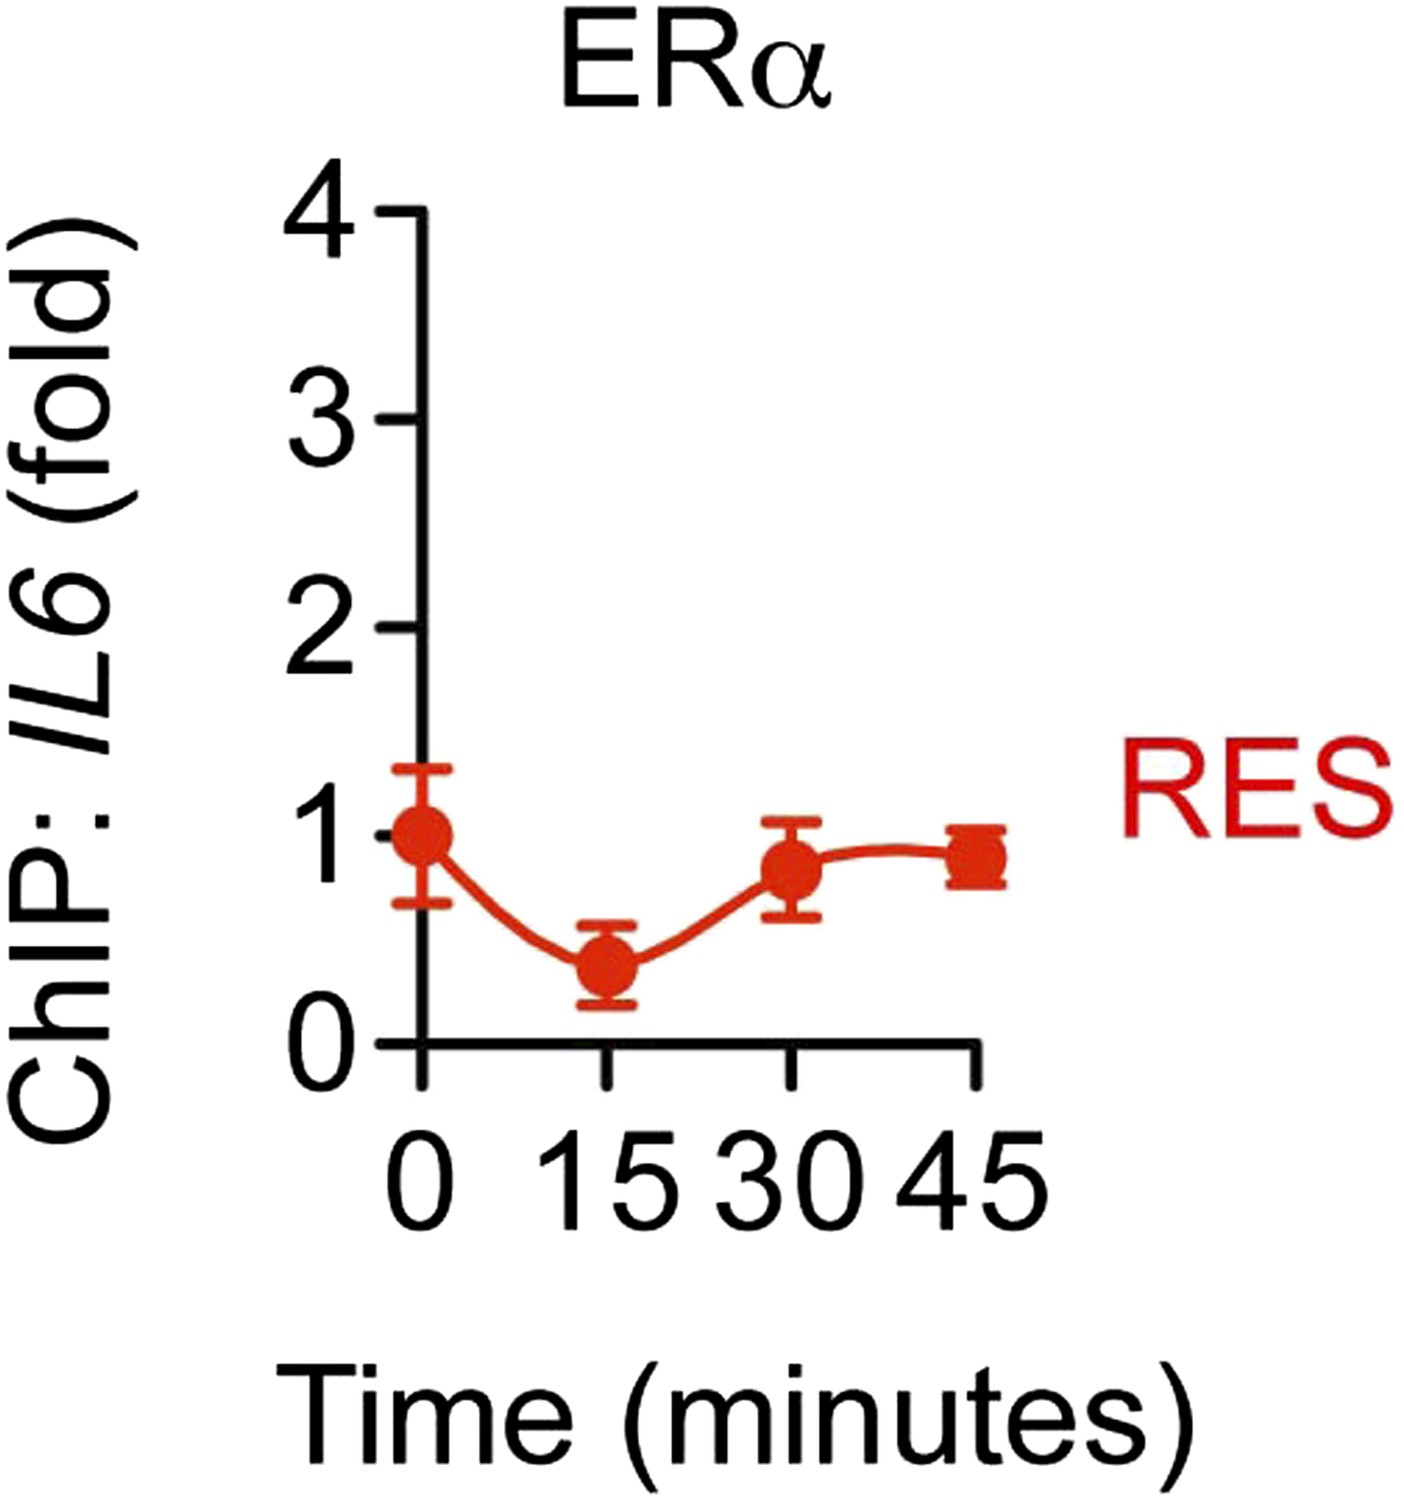
Without TNFα, RES does not induce recruitment of ERα to the IL-6 promoter.
ChIP assay using ERα antibody was performed in steroid-deprived MCF-7 cells treated with only 10 μM RES for 0, 15, 30 and 45 min. Average promoter occupancies are shown as fold changes (mean ± SEM n = 2).
Figure 7—figure supplement 3
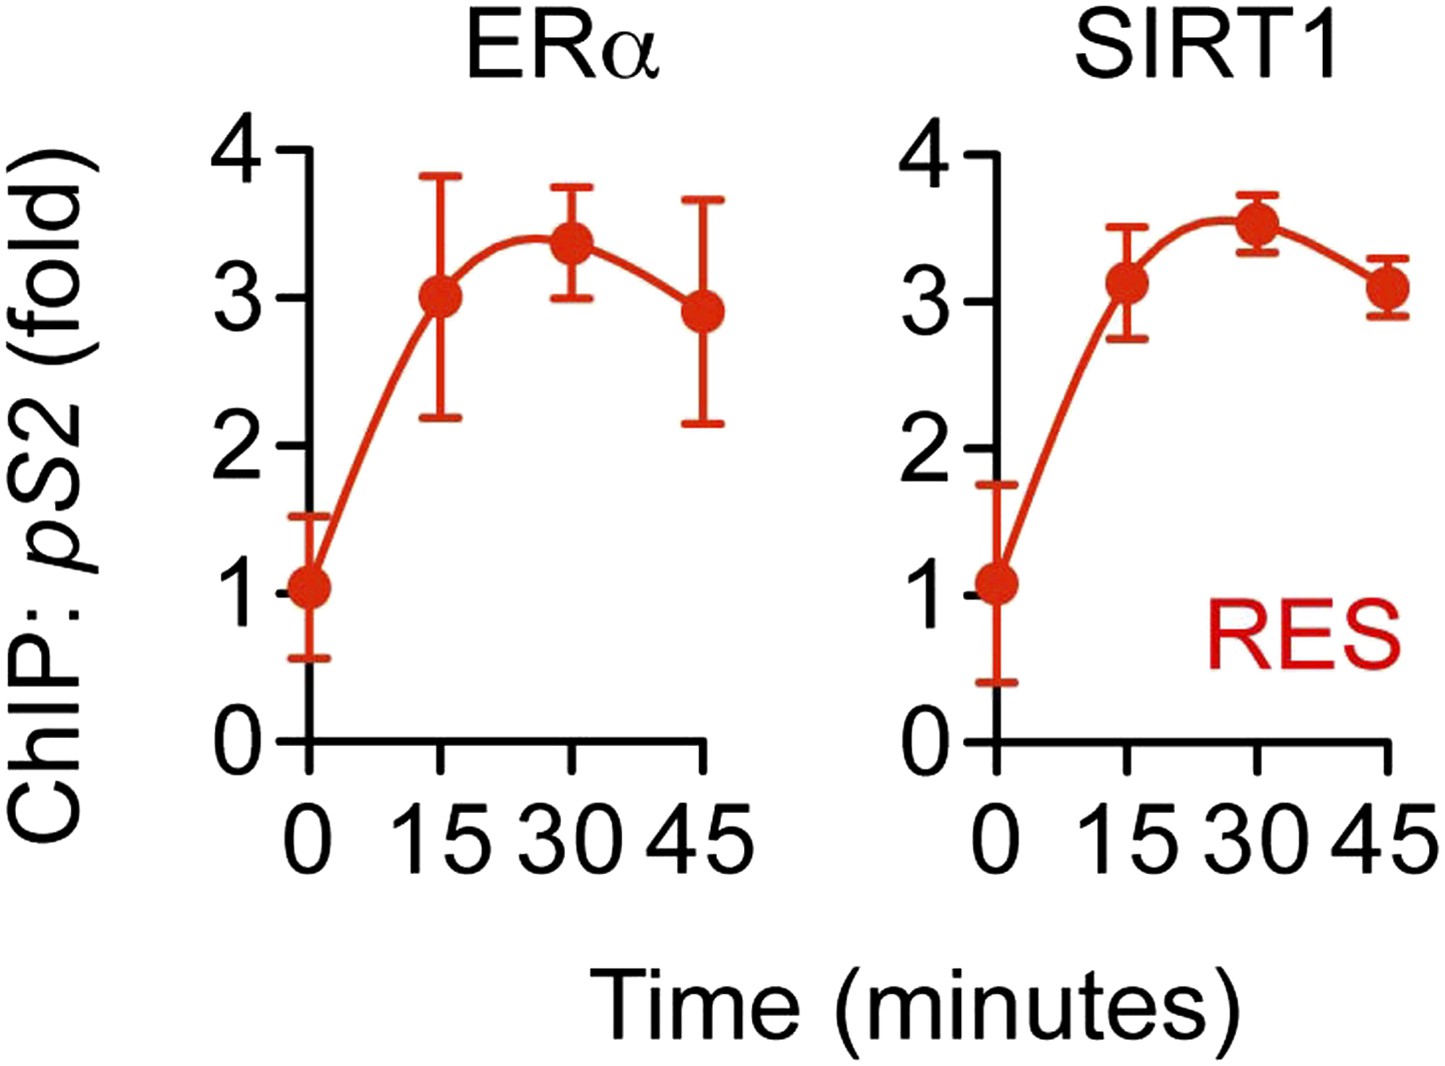
RES induces ERα and SIRT1 recruitment at the TFF1/pS2 promoter.
Steroid-deprived MCF-7 cells were treated with 10 μM RES, and fixed after the indicated periods. Average promoter occupancies were determined by ChIP assay using ERα and SIRT1 antibodies and are shown as fold changes (mean ± SEM n = 3).
Figure 7—figure supplement 4

ICI increased p65 K310-ac levels at the IL-6 promoter.
Steroid-deprived MCF-7 cells were pretreated with or without 1 μM ICI for 1 hr before a 45-min treatment with 10 ng/ml TNFα and 10 μM RES and 10 nM E2 as indicated. Average promoter occupancies were determined by ChIP assay using p65 K310-ac antibody and are shown as fold changes (mean ± SEM n = 3).
Figure 7—figure supplement 5

ICI did not increase recruitment of pCAF, p300 and SIRT2.
Effect of ICI on promoter occupancy was determined by ChIP assay in steroid-deprived MCF-7 cells were pretreated with vehicle or 1 μM ICI for 1 hr, stimulated with 10 ng/ml TNFα plus 10 μM resveratrol, and fixed after 15, 30 or 45 min. Average promoter occupancies are shown as fold changes (mean ± SEM n = 3).
Figure 8
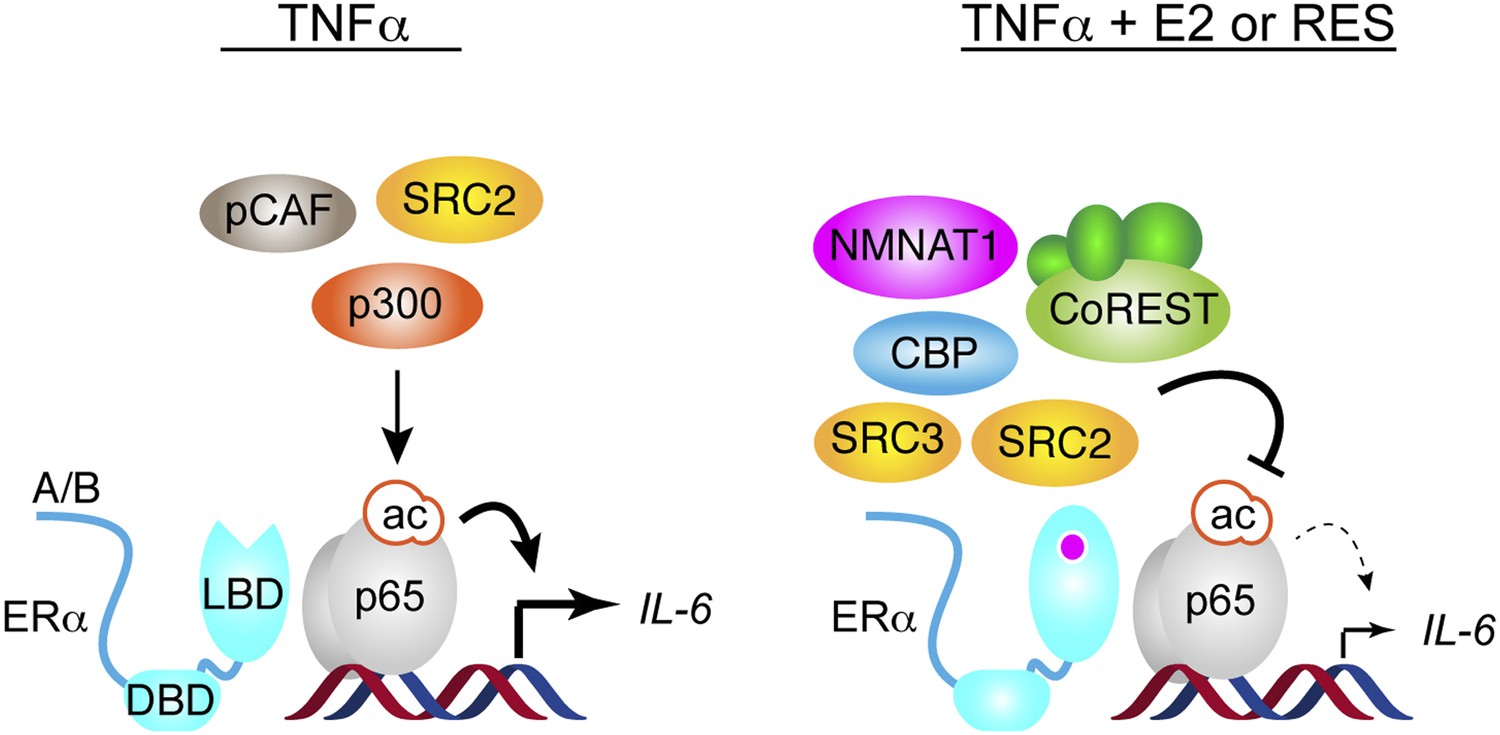
Proposed model for ERα-mediated transrepression of IL-6.
In MCF-7 cells stimulated with TNFα, the p65 NF-κB subunit binds the IL-6 promoter and mediates recruitment of many coregulators including p300, which acetylates p65 at Lys310, to drive transactivation of IL-6. In these cells, TNFα also induces recruitment of ERα to this site via a tethering mechanism. In response to E2 or resveratrol, ERα undergoes a conformational change, dismisses the set of coregulators including p300, and recruits a set that contains SRC3, CoREST, and other key coregulators required to inhibit p65 acetylation and repress IL-6.
Figure 9

Diethyl 3,5-dimethoxybenzylphosphonate S1.
https://doi.org/10.7554/eLife.02057.034
Figure 10

(E)-1-(3-fluoro-4-methoxystyryl)-3,5-dimethoxybenzene S2.
https://doi.org/10.7554/eLife.02057.035
Figure 11
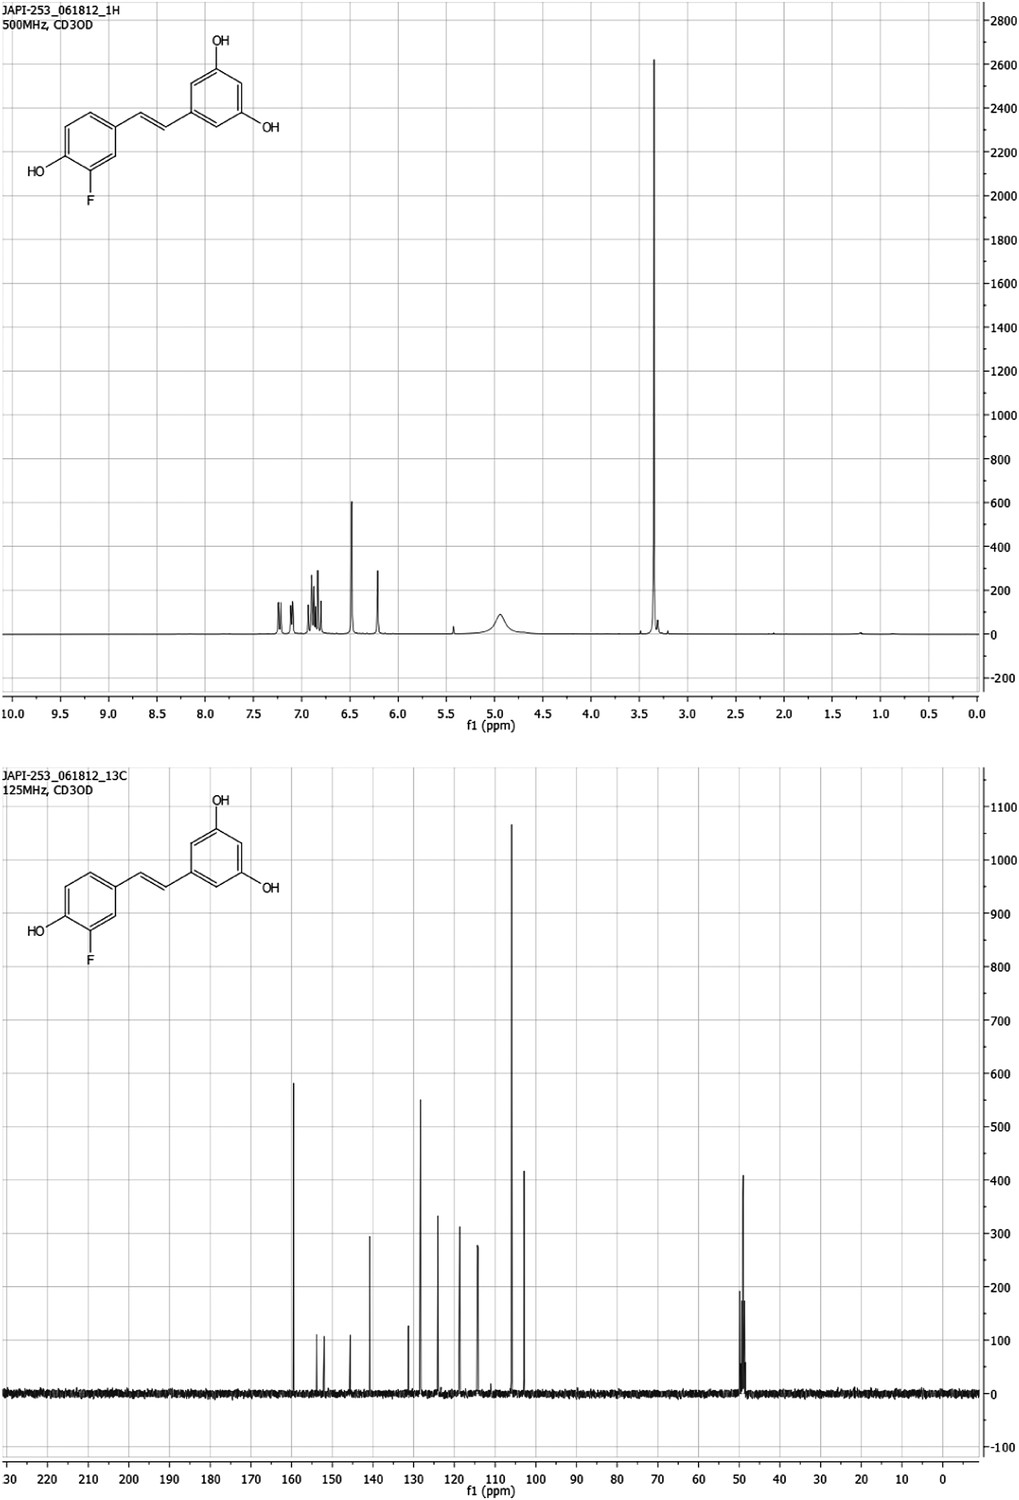
(E)-5-(3-fluoro-4-hydroxystyryl)benzene-1,3-diol F-Resveratrol.
https://doi.org/10.7554/eLife.02057.036Tables
Table 1
Data collection and refinement statistics for new ERα structures
| Ligand | Resveratrol | F-resveratrol | A-CD ring estrogen |
|---|---|---|---|
| PDB ID | 4PP6 | 4PPP | 4PPS |
| Data collection | |||
| Space group | P 1 21 1 | P 1 21 1 | P 1 21 1 |
| a, b , c (Å) | 56.04, 84.67, 58.42 | 54.19, 81.93, 58.47 | 56.11, 84.19, 58.48 |
| α, β , γ (°) | 90.0, 108.32, 90.0 | 90.0, 110.86, 90.0 | 90.0, 108.35, 90.0 |
| Resolution (Å) | 33.7–2.2 (2.28–2.20) | 46.3–2.7 (2.78–2.69) | 33.5–1.9 (2.00–1.93) |
| Number of reflections | 22,678 (944) | 11,884 (481) | 38,369 (3443) |
| I/σ | 12.6 (2.9)* | 22.5 (1.7) | 27.7 (2.1) |
| Rmerge | 0.07 (0.21) | 0.09 (0.45) | 0.05 (0.45) |
| Completeness (%) | 86.14 (36.35) | 88.46 (35.98) | 98.68 (89.10) |
| Multiplicity | 2.5 (1.5) | 6.3 (5.8) | 3.5 (2.0) |
| Refinement | |||
| Number of non-H atoms | |||
| Protein | 3840 | 3710 | 4014 |
| Ligands | 51 | 54 | 36 |
| Water | 307 | 36 | 323 |
| Rwork/Rfree | 16.79/22.22 | 18.38/23.90 | 17.38/20.15 |
| Ramachandran favored (%) | 99 | 95 | 98 |
| Ramachandran outliers (%) | 0.21 | 1.1 | 0 |
| Wilson B-factor | 17.31 | 44.12 | 27.03 |
| Average B-factor | |||
| All atoms | 26.7 | 66.1 | 36.1 |
| Protein | 26.4 | 66.4 | 36.1 |
| Water | 29.7 | 42.9 | 40.4 |
| RMS deviations | |||
| Bond lengths (Å) | 0.008 | 0.011 | 0.002 |
| Bond angles (°) | 1.03 | 1.26 | 0.61 |
-
*
(Highest-resolution shell).
Table 2
Gene-specific qPCR primers
| Gene | Forward (5′-3′) | Reverse (5′-3′) |
|---|---|---|
| CTBP1 | CTCAATGGGGCTGCCTATAG | GGACGATACCTTCCACAGCA |
| DBC1 | GATCCACACACTGGAGCTGA | TGGCTGAGAAACGGTTATGG |
| G9a | CTTCAGTTCCCGAGACATCC | CGCCATAGTCAAACCCTAGC |
| GLP | GCTCGGGTTTGACTATGGAG | CAGCTGAAGAGCTTGCCTTT |
| GPR30 | CTGACCAAGGAGGCTTCCAG | CTCTCTGGGTACCTGGGTTG |
| HDAC1 | AAGGAGGAGAAGCCAGAAGC | GAGCTGGAGAGGTCCATTCA |
| HDAC2 | TCCAAGGACAACAGTGGTGA | GTCAAATTCAGGGGTTGCTG |
| HDAC3 | AGAGGGGTCCTGAGGAGAAC | GAACTCATTGGGTGCCTCTG |
| LCoR | CTCTCCAGGCTGCTCCAGTA | ACCACTCCGAAGTCCGTCT |
| LRP16 | AGCACAAGGACAAGGTGGAC | CTCCGGTAGATGTCCTCGTC |
| LSD1 | GGCTCAGCCAATCACTCCT | ATGTTCTCCCGCAAAGAAGA |
| ROCK1 | CCACTGCAAATCAGTCTTTCC | ATTCCACAGGGCACTCAGTC |
| SIRT2 | TTGGATGGAAGAAGGAGCTG | CATCTATGCTGGCGTGCTC |
| SRC1 | CACACAGGCCTCTACTGCAA | TCAGCAAACACCTGAACCTG |
| SRC2 | AGCTGCCTGGAATGGATATG | AACTGGCTTCAGCAGTGTCA |
| SRC3 | GTGGTCACATGGGACAGATG | TCTGATCAGGACCCATAGGC |
Table 3
Inventoried TaqMan gene expression assays (Applied Biosystems)
| Gene | Assay ID |
|---|---|
| AMPKα1 | Hs01562315_m1 |
| AMPKα2 | Hs00178903_m1 |
| CBP | Hs00231733_m1 |
| CoREST | Hs00209493_m1 |
| ERα | Hs01046812_m1 |
| ERβ | Hs01100353_m1 |
| IL-6 | Hs00174131_m1 |
| NCoR | Hs01094540_m1 |
| NMNAT1 | Hs00978912_m1 |
| P300 | Hs00914223_m1 |
| PARP1 | Hs00242302_m1 |
| PCAF | Hs00187332_m1 |
| SIRT1 | Hs01009006_m1 |
| SMRT | Hs00196955_m1 |
Table 4
Flexitube siRNAs (Qiagen)
| siRNA | Gene ID | Catalog No. |
|---|---|---|
| AMPKα1 | 5562 | SI02622228 |
| AMPKα2 | 5563 | SI02758595 |
| CoREST | 23,186 | SI03137435 |
| CtBP1 | 1487 | SI03211201 |
| DBC1 | 57,805 | SI00461846 |
| GLP | 79,813 | SI02778923 |
| G9a | 10,919 | SI00091189 |
| ERα | 2099 | SI02781401 |
| ERβ | 2100 | SI03083269 |
| GPR30 | 2852 | SI00430360 |
| HDAC1 | 3065 | SI02663472 |
| HDAC2 | 3066 | SI00434952 |
| HDAC3 | 8841 | SI00057316 |
| LCOR | 84,458 | SI00143213 |
| LRP16 | 28,992 | SI00623658 |
| LSD1 | 23,028 | SI02780932 |
| NMNAT1 | 64,802 | SI04344382 |
| P300 | 2033 | SI02622592 |
| PARP1 | 142 | SI02662996 |
| SIRT1 | 23,411 | SI04954068 |
| SIRT2 | 22,933 | SI02655471 |
| SRC1 | 8648 | SI00055342 |
| SRC2 | 10,499 | SI00089509 |
| SRC3 | 8202 | SI00089369 |
Table 5
ON-TARGETplus SMARTpool siRNAs (Thermo Scientific Dharmacon, Lafayette, CO)
| siRNA | Gene ID | Catalog No. |
|---|---|---|
| PCAF | 8850 | L-005055-00 |
| CBP | 1387 | L-003477-00 |
| NCoR | 9611 | L-003518-00 |
| SMRT | 9612 | L-020145-00 |
Download links
A two-part list of links to download the article, or parts of the article, in various formats.
Downloads (link to download the article as PDF)
Open citations (links to open the citations from this article in various online reference manager services)
Cite this article (links to download the citations from this article in formats compatible with various reference manager tools)
Resveratrol modulates the inflammatory response via an estrogen receptor-signal integration network
eLife 3:e02057.
https://doi.org/10.7554/eLife.02057


