RNAP II CTD tyrosine 1 performs diverse functions in vertebrate cells
- Columbia University, United States
- Rutgers University New Jersey Medical School, United States
Figures
Figure 1 with 1 supplement
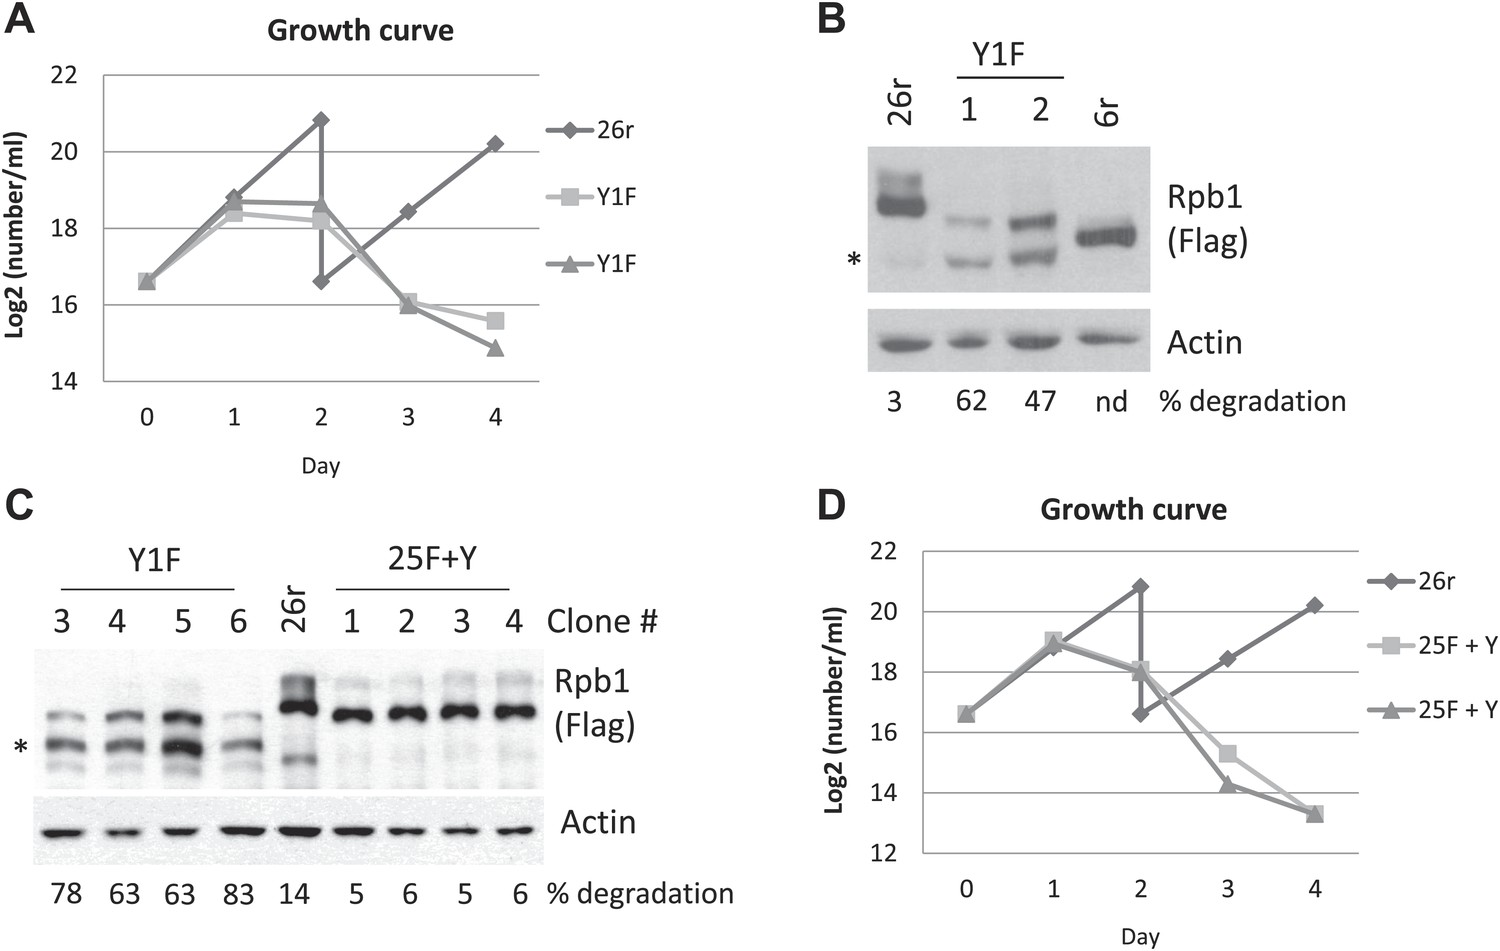
Growth properties of Rpb1 cell lines.
(A) Cells were cultured in medium containing 1 µg/ml tetracycline (tet). Control cells, 26r, were split on day 2. Average cell counts from two independent experiments were plotted. (B) Cells were treated with tet for 24 hr. Whole-cell lysates from 26r, Y1F cells, and cells (6r) expressing an Rpb1 with 6 YSPTSPS repeats were analyzed by western blotting. Flag-tagged Rpb1 proteins were detected using Flag antibody. Partially degraded CTD-less Rpb1 is indicated by an asterisk (*). Full-length and degraded Rpb1 isoforms were quantified using ImageJ, and % degradation is displayed. nd, Degraded Rpb1 not detected. (C) Cell lysates from four independent 25F+Y and four independent Y1F cell lines were analyzed as in (B). Asterisk indicates partially degraded Rpb1. The lower molecular weight species in the 26r sample is of unknown identity and was not observed reproducibly, but was included in the quantitation. (D) Growth curves of two independent 25F+Y cell lines and 26r cells were plotted as in (A).
Figure 1—figure supplement 1
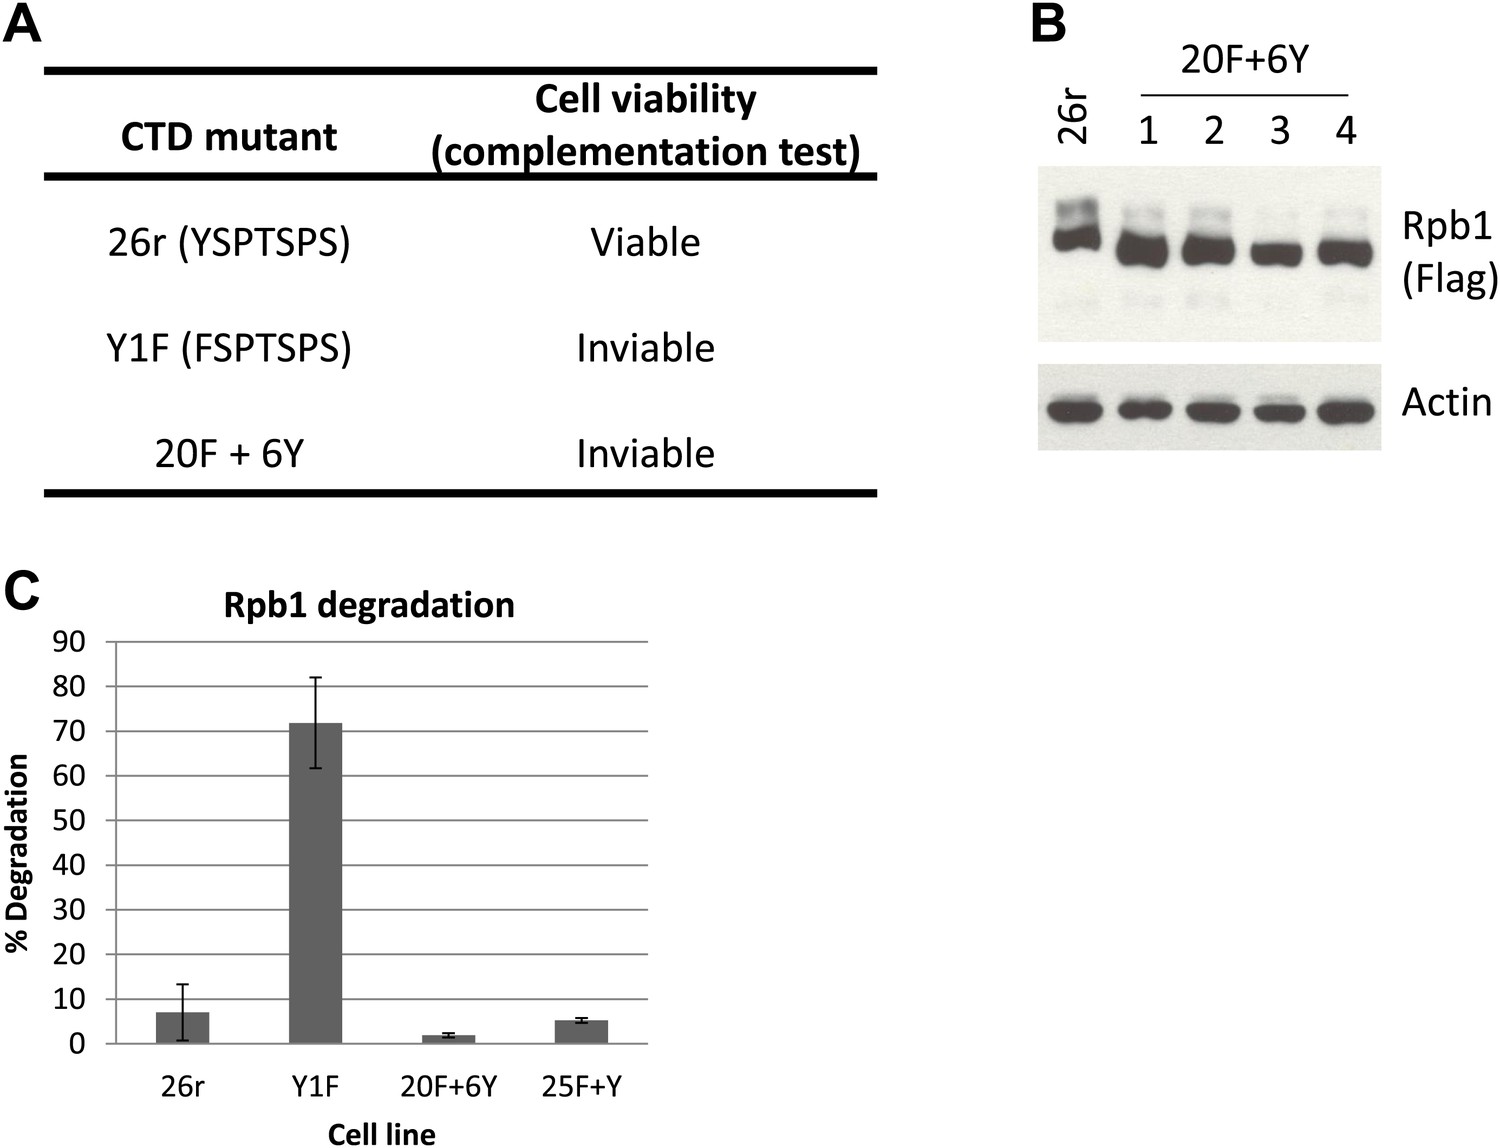
Complementation test and western blotting analysis in cells with Y1F mutations.
(A) Complementation test was performed as described and results were shown. (B) Western blotting analysis of 20F+Y cells. Cells (20F+6Y) expressing an Rpb1 with the last 6 Y1F repeats replaced with normal YSPTSPS repeats were treated with tet for 24 hr. Rpb1 proteins were detected using Flag antibody. (C) Whole-cell lysates prepared from cells expressing the indicated Rpb1 derivative and treated with tet for 24 hr were analyzed by western blotting. Western blots were quantified using ImageJ, and % degradation from 3–4 independent replicates is presented. Error bars denote standard deviation.
Figure 2 with 1 supplement
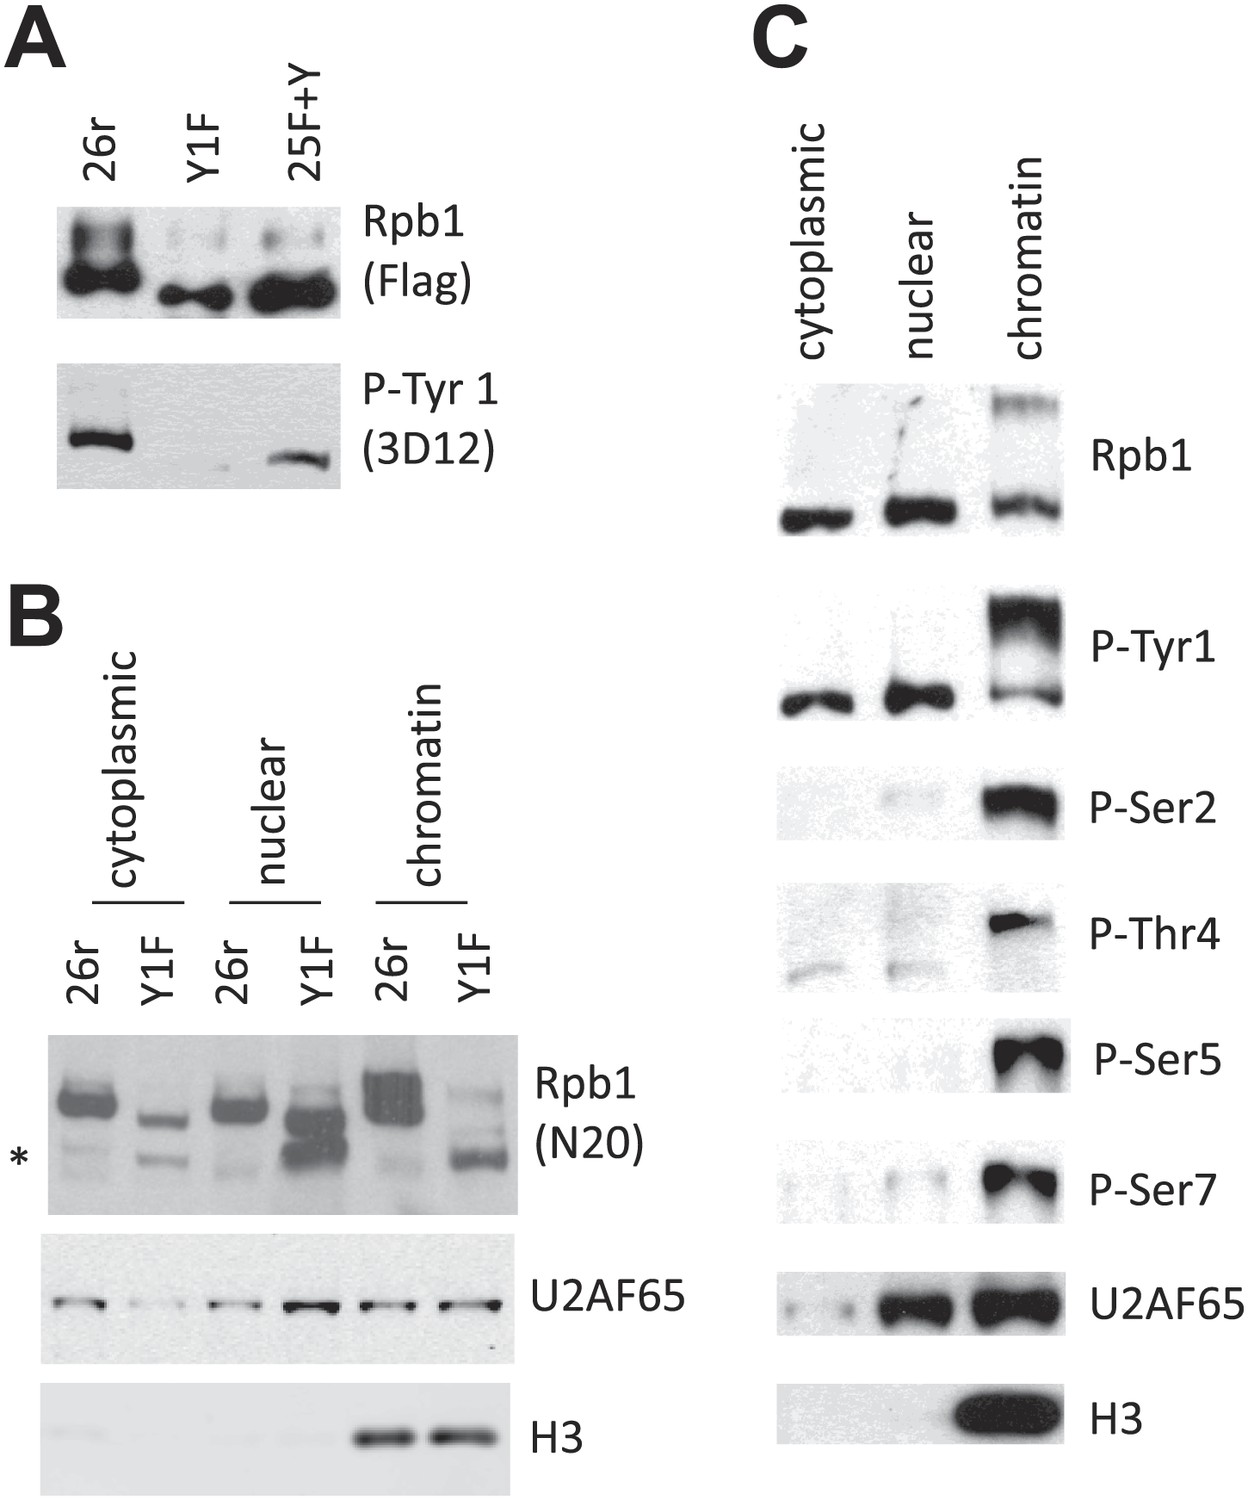
Rpb1 Tyr1 phosphorylation is found in all cell fractions.
(A) Flag-tagged Rpb1 proteins were immunoprecipitated from cells treated with tet for 24 hr, and analyzed using western blotting. Phosphorylation on Tyr1 (Tyr1-P) was detected by the 3D12 antibody. (B) 26r and Y1F cells were treated with tet for 24 hr, subcellular fractionation was performed, and cytoplasmic, nuclear, and chromatin fractions were analyzed by western blotting. U2AF65 (a nuclear protein), and chromatin bound histone H3 protein served as controls for subcellular fractionation. The asterisk (*) indicates partially degraded Rpb1. (C) Wild-type DT40 cells were subjected to subcellular fractionation. The localization of Rpb1 phosphorylated on Tyr1, Ser 2, 5 and 7 and Thr4 was determined using antibodies as described in ‘Materials and methods’.
Figure 2—figure supplement 1
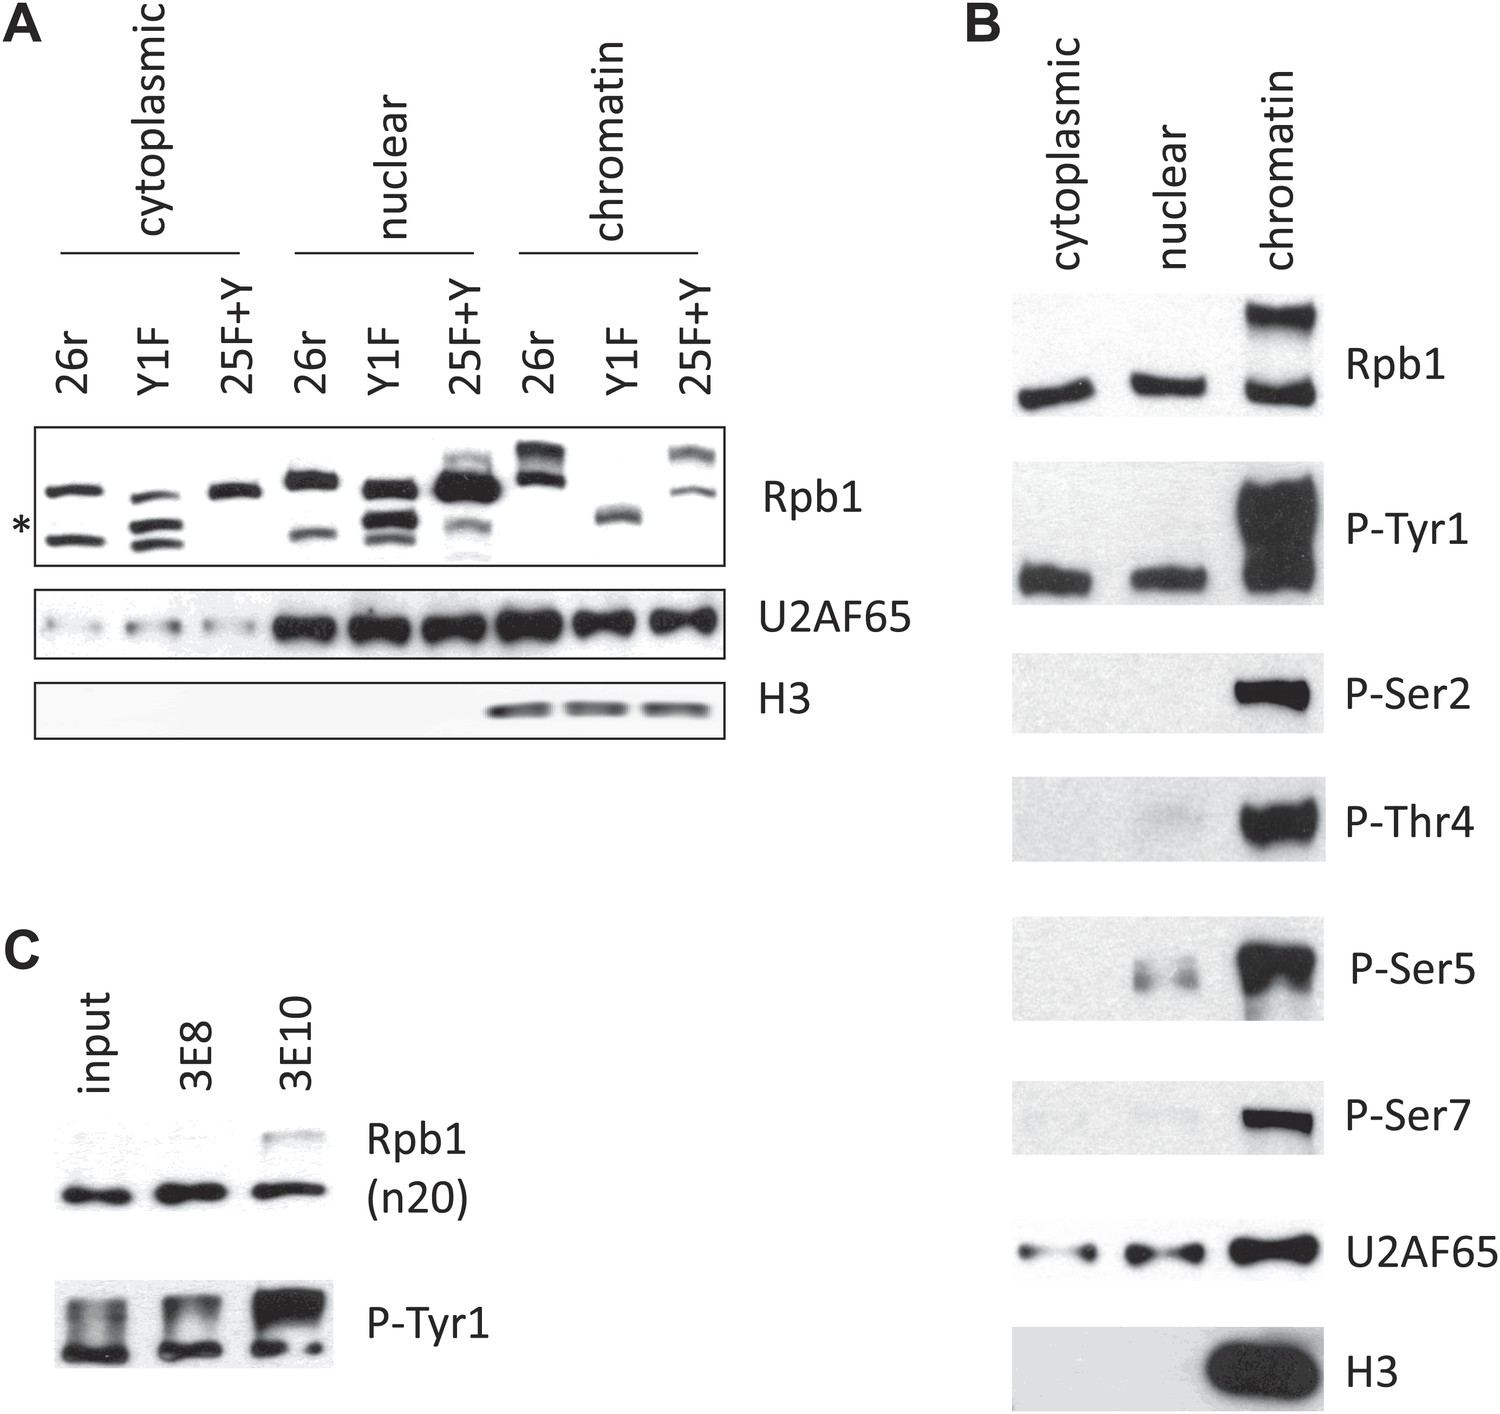
Western blotting analysis.
(A) Cells were treated with tet for 24 hr, and then subjective to subcellular fractionation. Rpb1 localization was determined by western blotting. Nuclear protein U2AF65, and chromatin-bound histone H3 served as controls for fractionation. Asterisk (*) indicates the degraded Rpb1 fragment. (B) Subcellular fractionation assay was performed in HEK293 cells. The localization of Rpb1 phosphorylated on Tyr1, Ser 2, 5, 7, and Thr4 was determined using antibodies as described in ‘Materials and methods’. (C) Rpb1 from DT40 cell lysates were immunoprecipitated using antibodies recognizing phosphoserine 5 (3E8) or phosphoserine 2 (3E10). The association of tyrosine phosphorylation with phosphoserine 5 or phosphoserine 2 was determined by western blotting using the 3D12 antibody.
Figure 3 with 1 supplement
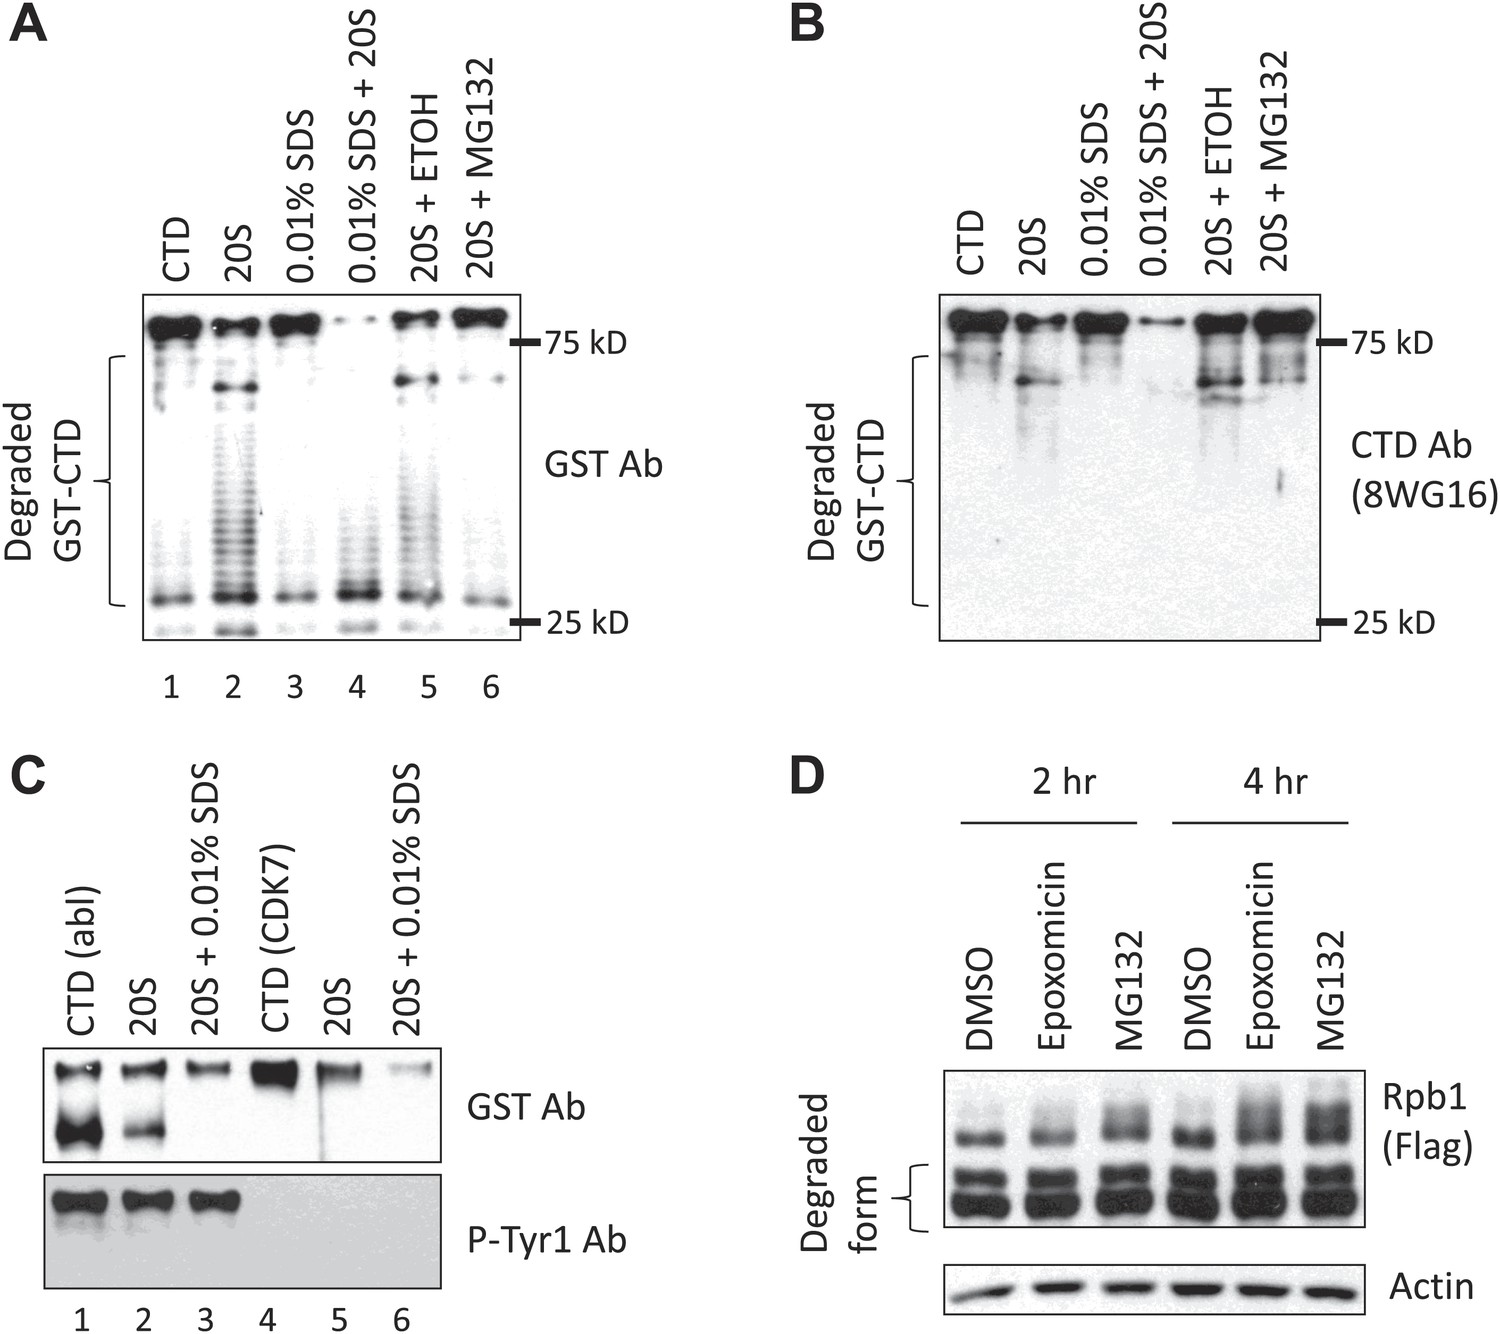
Tyr1 phosphorylation functions in CTD stability.
(A) In vitro 20S proteasome assay. 200 nM purified GST-CTD was incubated with 5 nM bovine 20S proteasome, and the reaction was carried with or without 0.01% SDS. MG132 was used to inhibit the proteasome, and reaction with 2.5% ethanol (ETOH) served as control. Western blotting was performed using antibody against GST, and the CTD (B). Position of 25 and 75 kD molecular weight markers are indicated. (C) 40 nM GST-CTD phosphorylated by recombinant c-Abl or by purified CDK7 complex was incubated with 2 nM 20S proteasome with or without 0.01% SDS for 1 hr, and reactions were analyzed by western blotting. (D) Y1F cells grown in the absence of tet were treated with 50 nM epoxomicin or 5 µM MG132 for indicated time. DMSO treatment served as control. Cell lysates were analyzed by western blotting. Partially degraded Rpb1 is indicated.
Figure 3—figure supplement 1
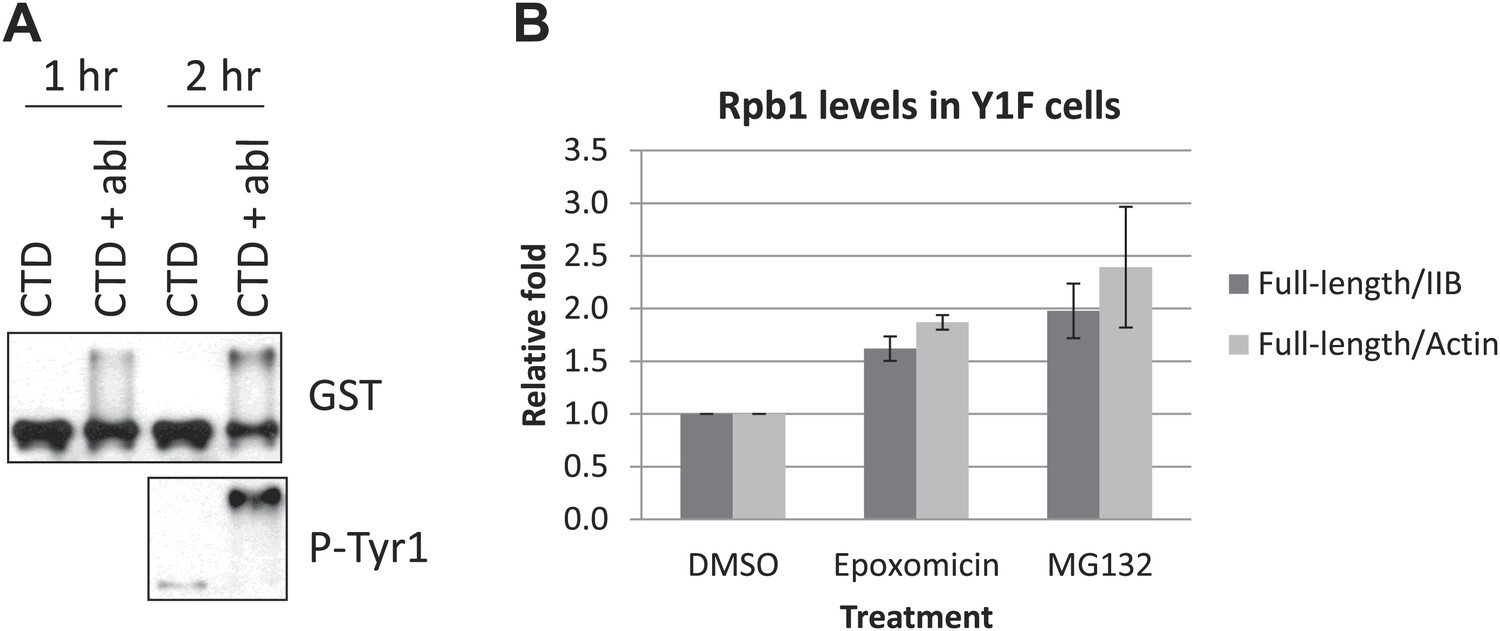
Western blotting analysis and quantification.
(A) GST-CTD proteins were phosphorylated by Abl tyrosine kinase for indicated time in vitro. Reactions were analyzed by western blotting with indicated antibodies. (B) Y1F cells grown in the absence of tet were treated with 50 nM epoxomicin or 5 µM MG132 for 4 hr. Cell lysates were analyzed by western blotting as in Figure 3D. The levels of full-length Rpb1 were quantified using ImageJ, and ratios of full-length Rpb1 to degraded Rpb1 (IIB) and actin were presented. N = 3. Error bars display standard deviation.
Figure 4 with 6 supplements
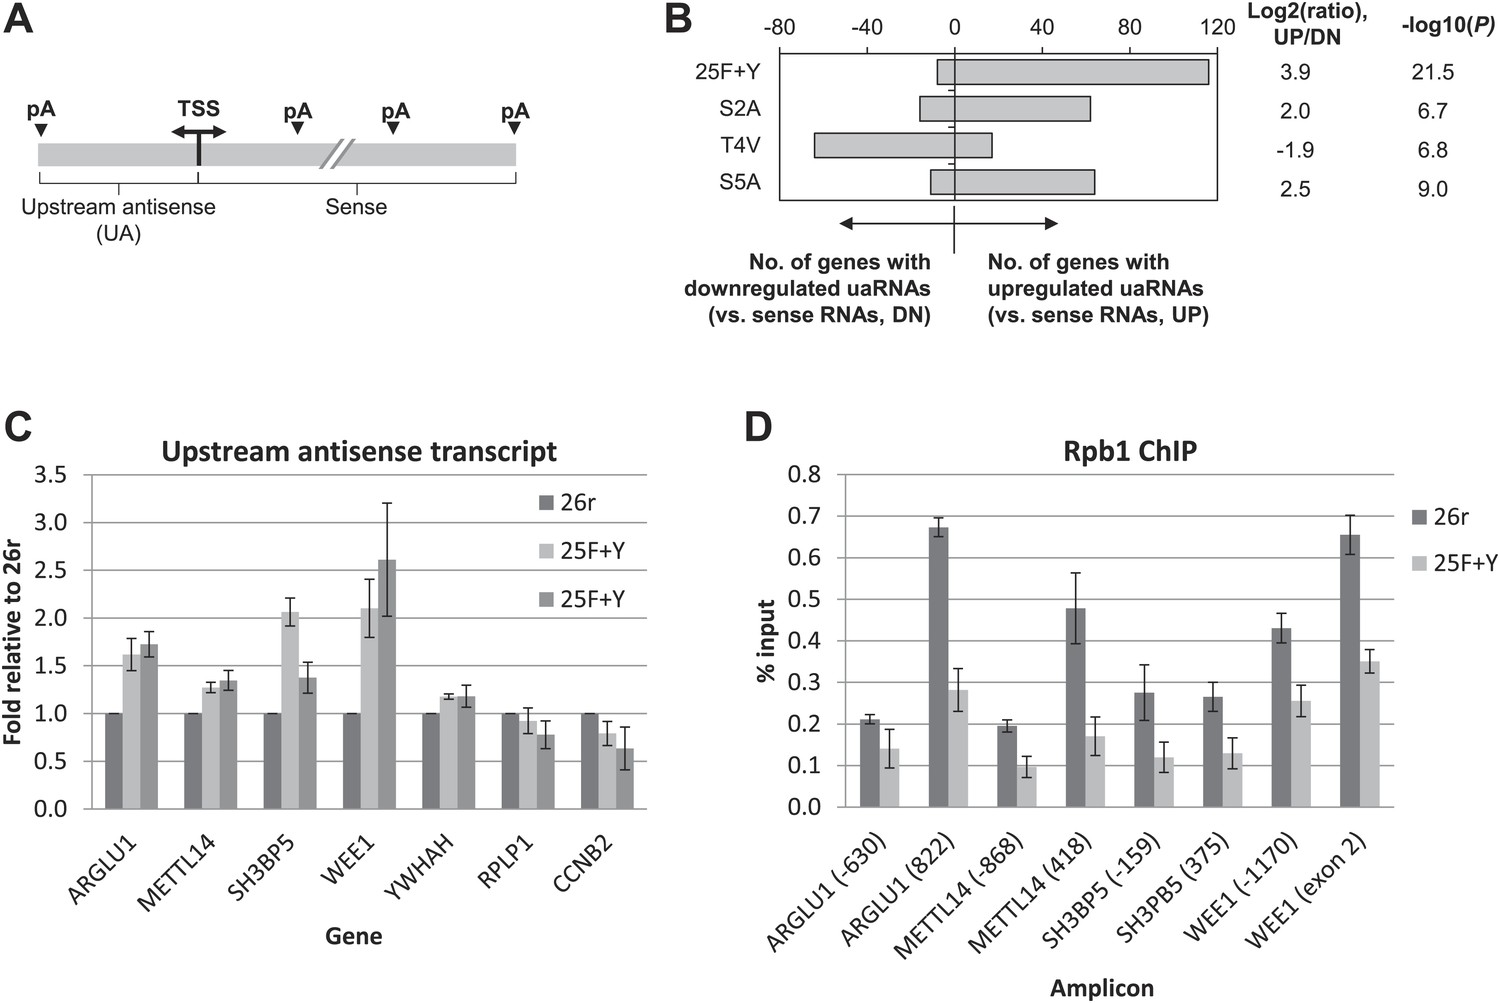
Tyr1 functions in expression of upstream antisense transcripts.
(A) Schematic of sense RNA and upstream antisense (ua) RNAs analyzed. (B) Regulation of uaRNA expression. Cells treated with tet for 24 hr were processed for 3′READS RNA-seq analysis. The number of genes with upregulated (UP) and downregulated (DN) uaRNAs (compared to sense RNA expression) are shown. Their ratio (UP/DN) and p-value (Chi-squared test) are shown. (C) RT-qPCR was performed to measure uaRNA levels associated with select genes detected in the RNA-Seq analysis. Fold relative to 26r cells is plotted. N = 3. (D) Rpb1 levels on sense and antisense genes were determined by ChIP using primers as indicated. The number in parenthesis next to the examined gene indicates the distance between the amplicon and the TSS (minus sign denotes upstream). N = 3. Error bars display standard deviation.
Figure 4—figure supplement 1
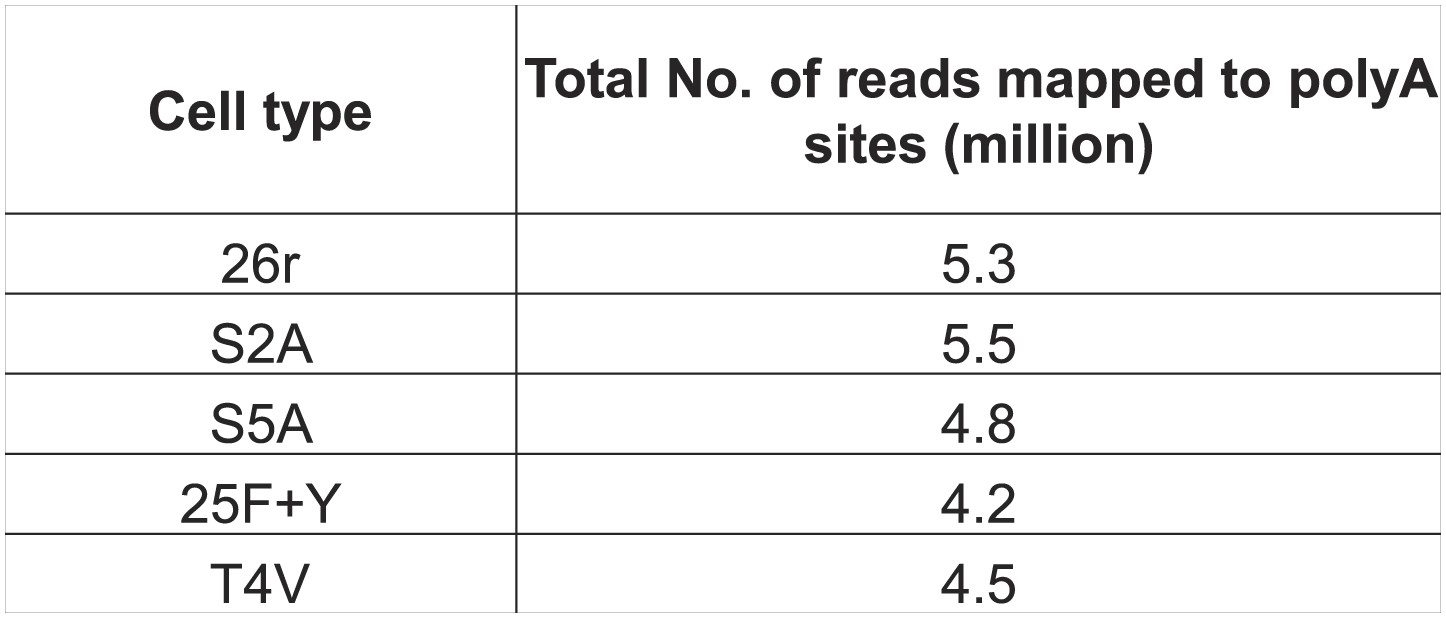
RNA-Seq analysis of Rpb1 cell lines.
RNA from cells treated with tet for 24 hr were processed for deep sequencing as described. S2A cells express an Rpb1 derivative with 26 YAPTSPS repeats, whereas S5A cells express an Rpb1 with 28 YSPTAPS repeats. The number of reads mapped to polyA sites for each cell type are shown.
Figure 4—figure supplement 2
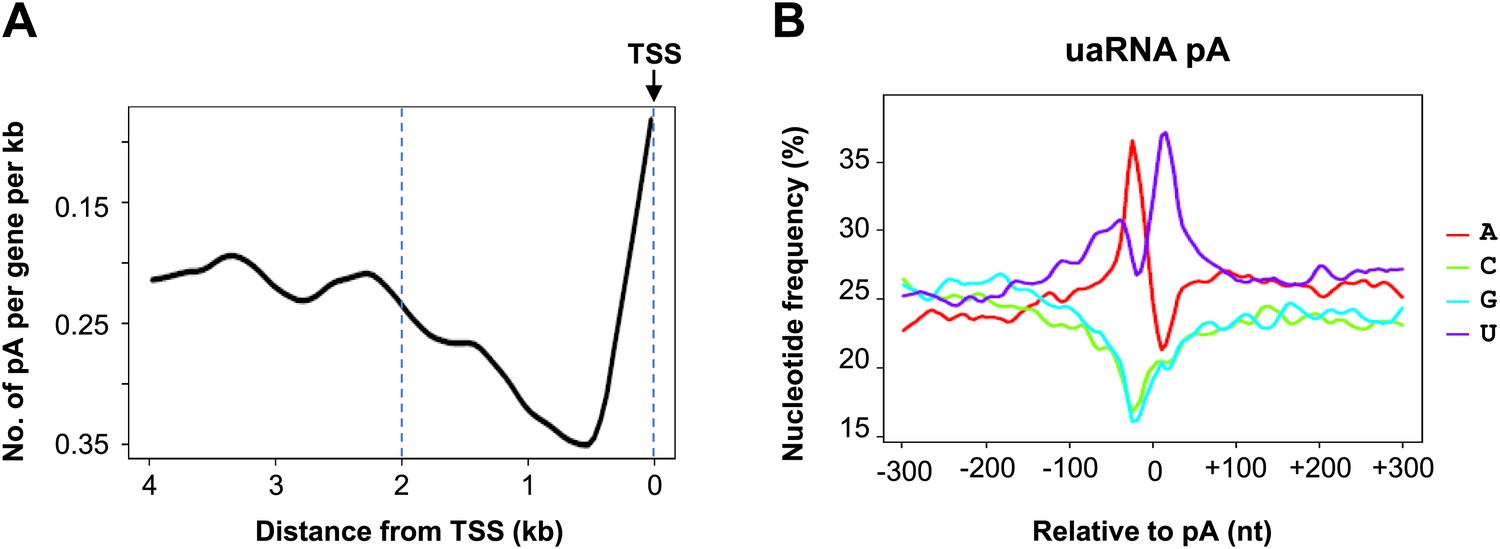
uaRNA polyA site analysis.
(A) The distribution of uaRNA polyA sites. The number of polyA sites in generated reads was counted and plotted against their distance from TSS. (B) The nucleotide profiles of polyA sites in (A).
Figure 4—figure supplement 3
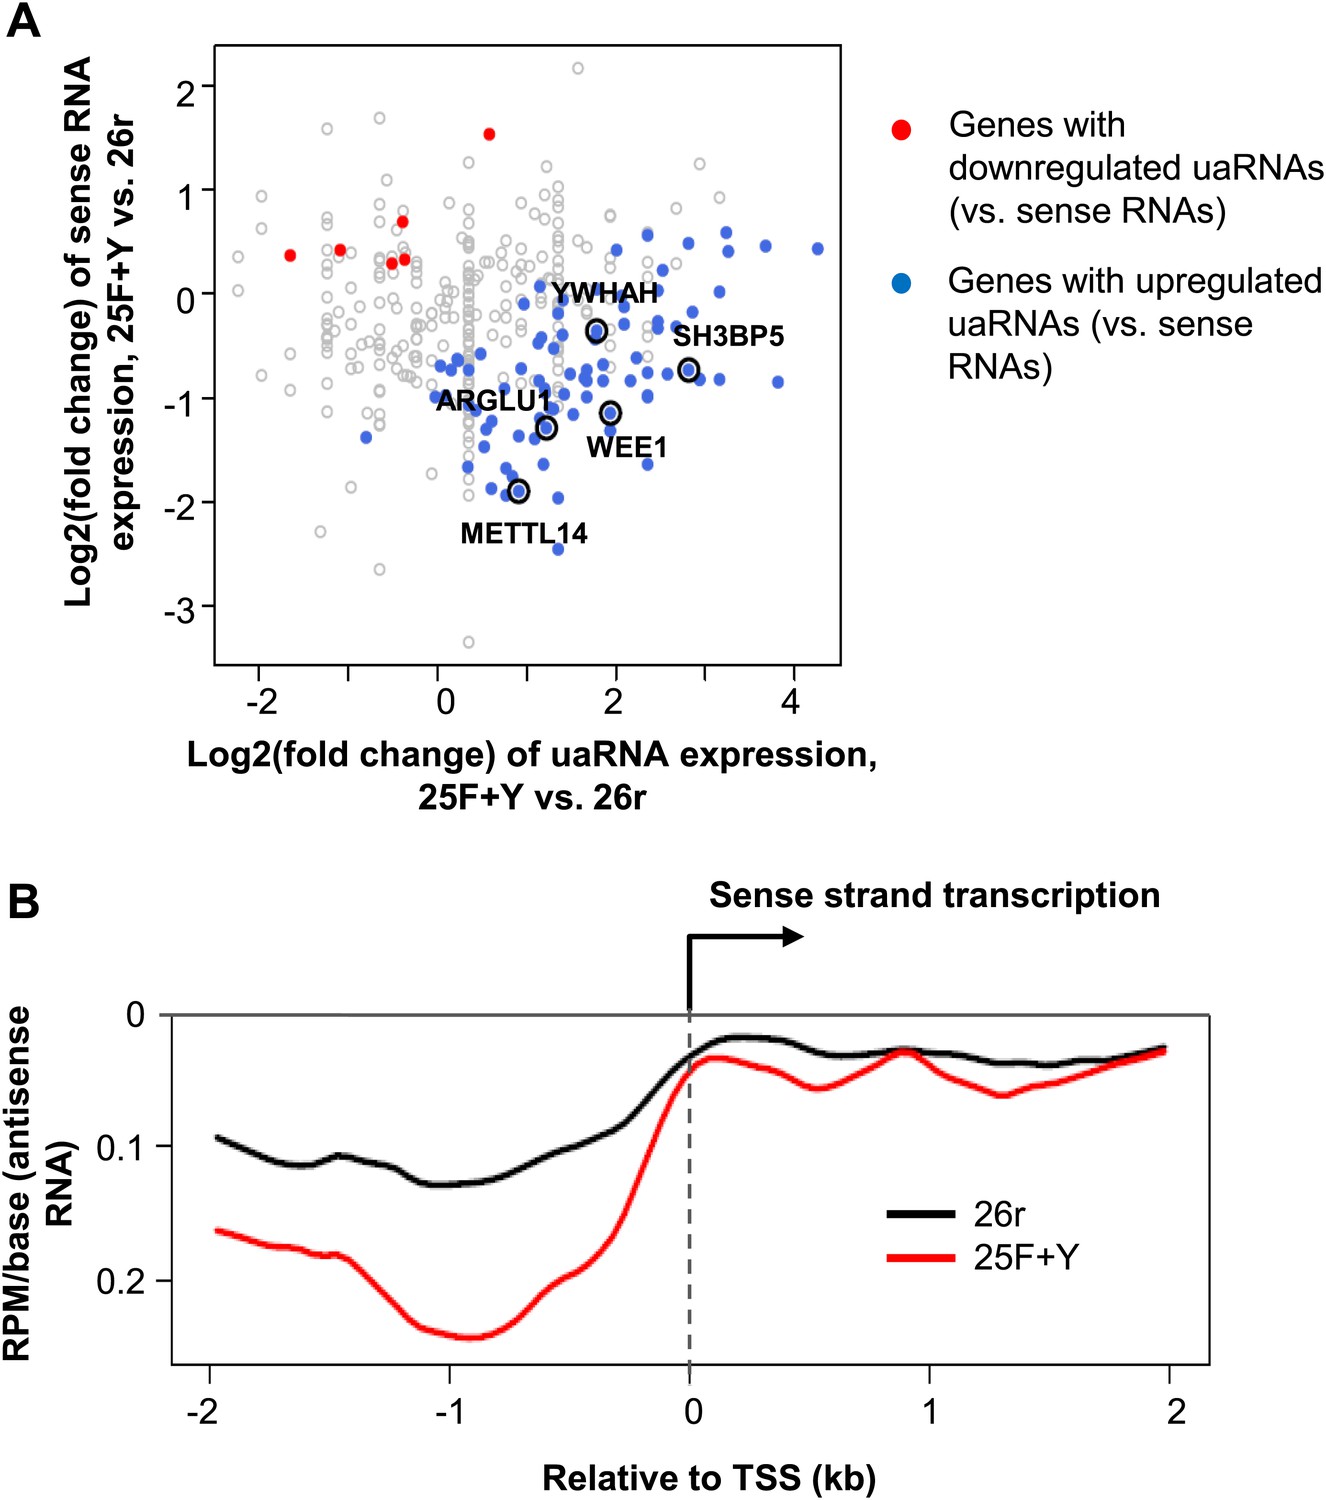
uaRNA expression analysis in 25F+Y and 26r cells.
(A) Expression difference of uaRNAs vs sense strand RNAs for 25F+Y and 26r cells. Each dot is a gene with uaRNA expression detected. Genes with significant difference in expression of uaRNAs vs sense strand RNAs (p<0.05, Fisher's exact test) were highlighted. The five genes validated in Figure 4C were marked in the plot. (B) Expression of antisense poly(A)+ RNA near the transcription start site (TSS) in 26r and 25F+Y cells. Reads per million (RPM) per base for poly(A) sites were shown (y-axis). All genes with upstream antisense (ua) RNAs detected in either 26r or 25F+Y cells were used for plotting. The curves were smoothened by the ‘lowess’ function.
Figure 4—figure supplement 4
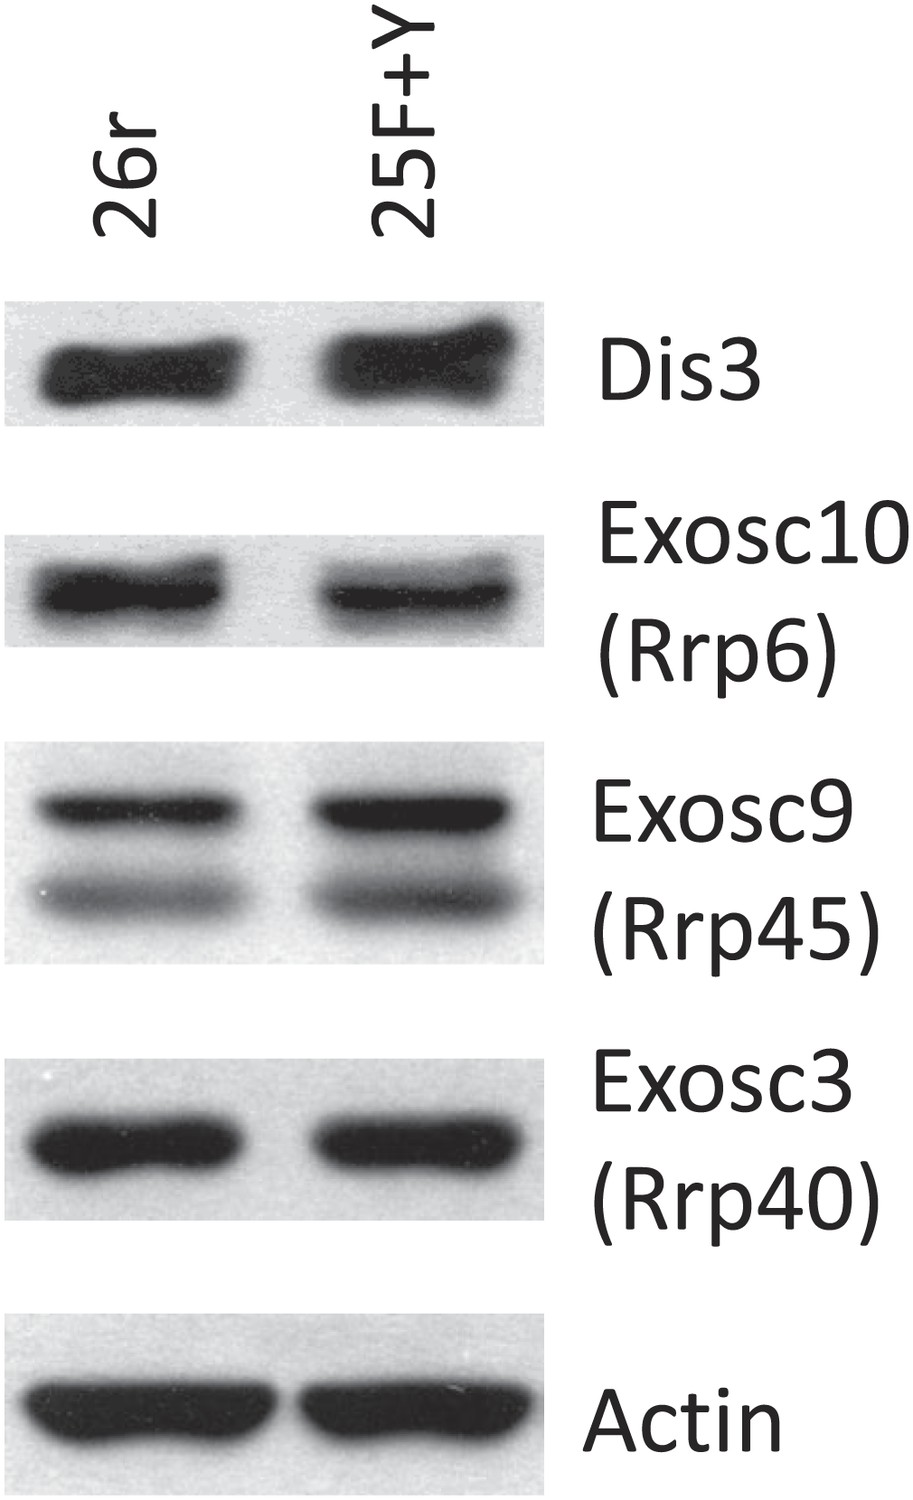
Exosome subunit levels.
Cells were treated with tet for 24 hr. The levels of exosome subunits Exosc 3 (Rrp40), Exosc 9 (Rrp45), Exosc 10 (Rrp6), and Dis3 were determined by western blotting.
Figure 4—figure supplement 5
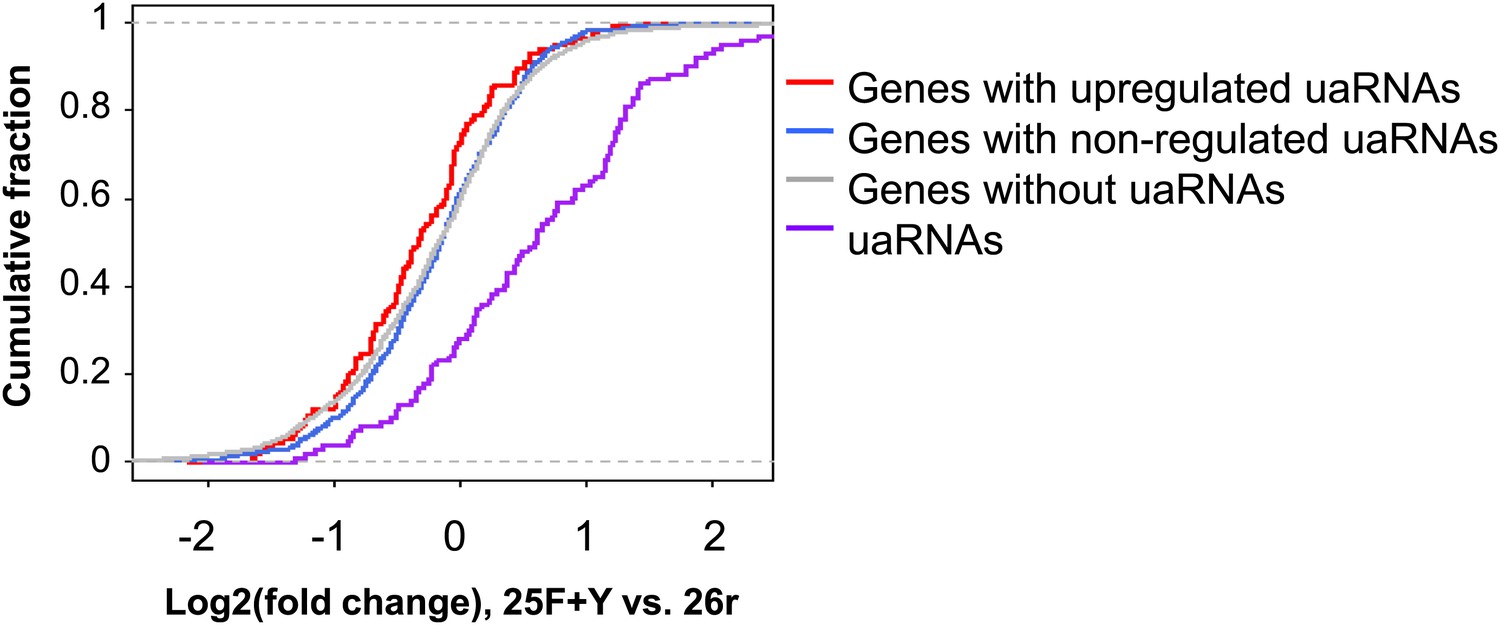
Expression changes for different types of transcripts in 25F+Y cells compared to 26r cells.
Values are shown in cumulative distribution function (CDF) curves. Transcript type is indicated in the graph. Expression change was based on log2 ratio of the Read Per Million total PASS reads (RPM) value. We used only genes that had at least 20 reads in two samples combined for this analysis. Expression of uaRNAs (purple line) is significantly upregulated compared to sense transcripts (other lines). Genes with upregulated uaRNAs (red line) tend to be slightly downregulated as compared to genes with non-regulated uaRNAs (blue line) or no detectable uaRNAs (gray line).
Figure 4—figure supplement 6
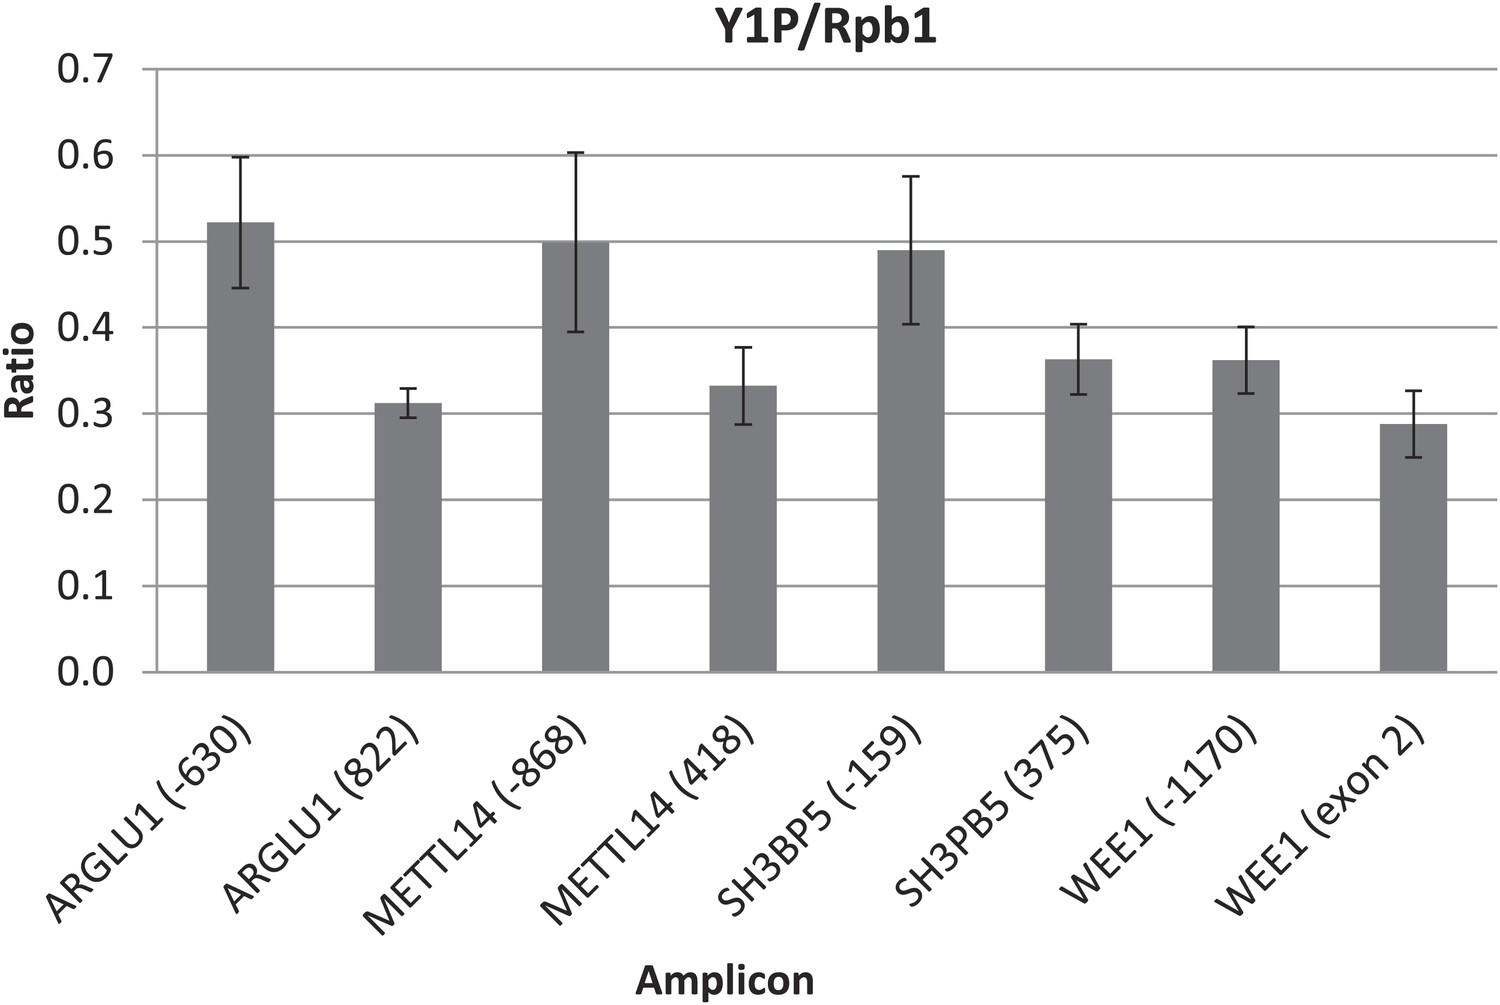
Tyr1-P ChIP analysis.
Data from Figure 4D were reanalyzed by normalizing the Tyr1-P signals to Rpb1 levels. N = 3. Error bars display standard deviation.
Additional files
-
Supplementary file 1
List of primer sequences.
- https://doi.org/10.7554/eLife.02112.016
Download links
A two-part list of links to download the article, or parts of the article, in various formats.
Downloads (link to download the article as PDF)
Open citations (links to open the citations from this article in various online reference manager services)
Cite this article (links to download the citations from this article in formats compatible with various reference manager tools)
RNAP II CTD tyrosine 1 performs diverse functions in vertebrate cells
eLife 3:e02112.
https://doi.org/10.7554/eLife.02112


