Imaging the fate of histone Cse4 reveals de novo replacement in S phase and subsequent stable residence at centromeres
- Janelia Farm Research Campus, Howard Hughes Medical Institute, United States
- National Cancer Institute, National Institutes of Health, United States
Figures
Figure 1 with 2 supplements

Internal tagging of Cse4 confers exclusive centromeric localization and preserves wild type phenotype.
(A) Alternative tag locations at Leu81 (internal XbaI site) or at the C-terminus of Cse4 are indicated by green triangles. Unstructured N-terminal tail (aa1-135) is depicted in grey while region corresponding to the known 3D structure of mammalian CENP-A (aa134-226) is shown as solid black and red (loops and α-helices of histone-fold domain). Functionally important END region (aa28-60) and C-terminal CENP–C interaction region QFI (aa227-228) are highlighted in blue and yellow. (B) Schematic position of fluorescent protein tags in relation to the overall nucleosome structure. Monomeric GFP tag is shown in green while Cse4 histone-fold domains are highlighted in red inside nucleosome core. Unstructured N-terminal tails of Cse4 are depicted as dashed lines for illustrative purposes. (C–E) Distribution of tagged Cse4 in live cells containing Cse4 tagged internally with GFP (C) or tdEos (D), or the C-terminal GFP fusion (E). Cell cycle stages are indicated in DIC panels. In addition to G1, S, and G2, individual stages of mitosis are identified as: M—metaphase, A—anaphase, T—telophase. Fluorescence images are shown as negatives to reveal residual intracellular autofluorescence and the diffuse nuclear presence of C-terminally tagged Cse4. (F) Viability test of strains containing wild-type or tagged Cse4. 10 μl of 10-fold serial dilutions of equivalent log-phase cultures were spotted on YPD plates and incubated overnight at 38°C or for 36 hr at 24°C.
Figure 1—figure supplement 1

Fluorescence of centromeric clusters containing C-terminally tagged Cse4 is slightly elevated but does not double in anaphase.
(A) Representative examples of metaphase and telophase cells (outlined) shown at the same brightness scale. Clusters in surrounding cells may be out of focus. (B) Intensity of individual centromeric clusters in metaphase (M) and telophase (T) was measured by photometry (5 s exposure). Minimum/1st quartile/median/3rd quartile, and maximum values are displayed for each group of 20 measurements. Prior to measurement, clusters were separated from lower frequency components of the image (diffuse fluorescence present in nuclei and intracellular autofluorescence) by processing the image with wavelet function and adding together scales 1+2+3 (1, 2 and 4 pixels across) (see Figure 7—figure supplement 1).
Figure 1—figure supplement 2

Internally tagged Cse4 accumulates at levels comparable to wild-type protein.
(A) Whole-cell lysates of cells containing wild-type or tagged Cse4 were probed with affinity-purified anti-Cse4 antibody. Arrows indicate bands corresponding to wild-type Cse4 (27 kDa) and Cse4 fused to GFP (57 kDa) or tdEos (87 kDa). A control blot probed for histone H4 is shown below. (B) Anti-Cse4 antibody was used to estimate the level of endogenous wild-type Cse4 (present in WT lysate) by comparison to indicated amounts of purified recombinant H6-Cse4 introduced into a lysate of the strain carrying Cse4-GFPinternal. The * denotes a common background band used to normalize different lysates; see below. The presence of the Histidine-tag visibly retards the electrophoretic mobility of recombinant Cse4 and Cse4-GFP. (C and D) A similar analysis of Cse4 internally tagged with GFP (C) or tdEos (D). In these cases, purified proteins were introduced into WT lysate. (E) Plot of band intensity (panel B) for recombinant Cse4 (black dots) to estimate the endogenous Cse4 level (red dot). (F and G) Estimates of endogenous levels of internally tagged Cse4 (panels C and D). Insets show the intensity of the common background band used to compare Cse4-GFPinternal and Cse4-tdEosinternal lysates to WT lysate. The resulting normalization factor is given in red. After normalization (protein fmoles/normalization factor), we obtained a 1:1 ratio for both Cse4:Cse4-GFPinternal and Cse4:Cse4-tdEosinternal.
Figure 2
Pre-existing Cse4 is removed and exchanged for new Cse4 molecules at G1/S transition.
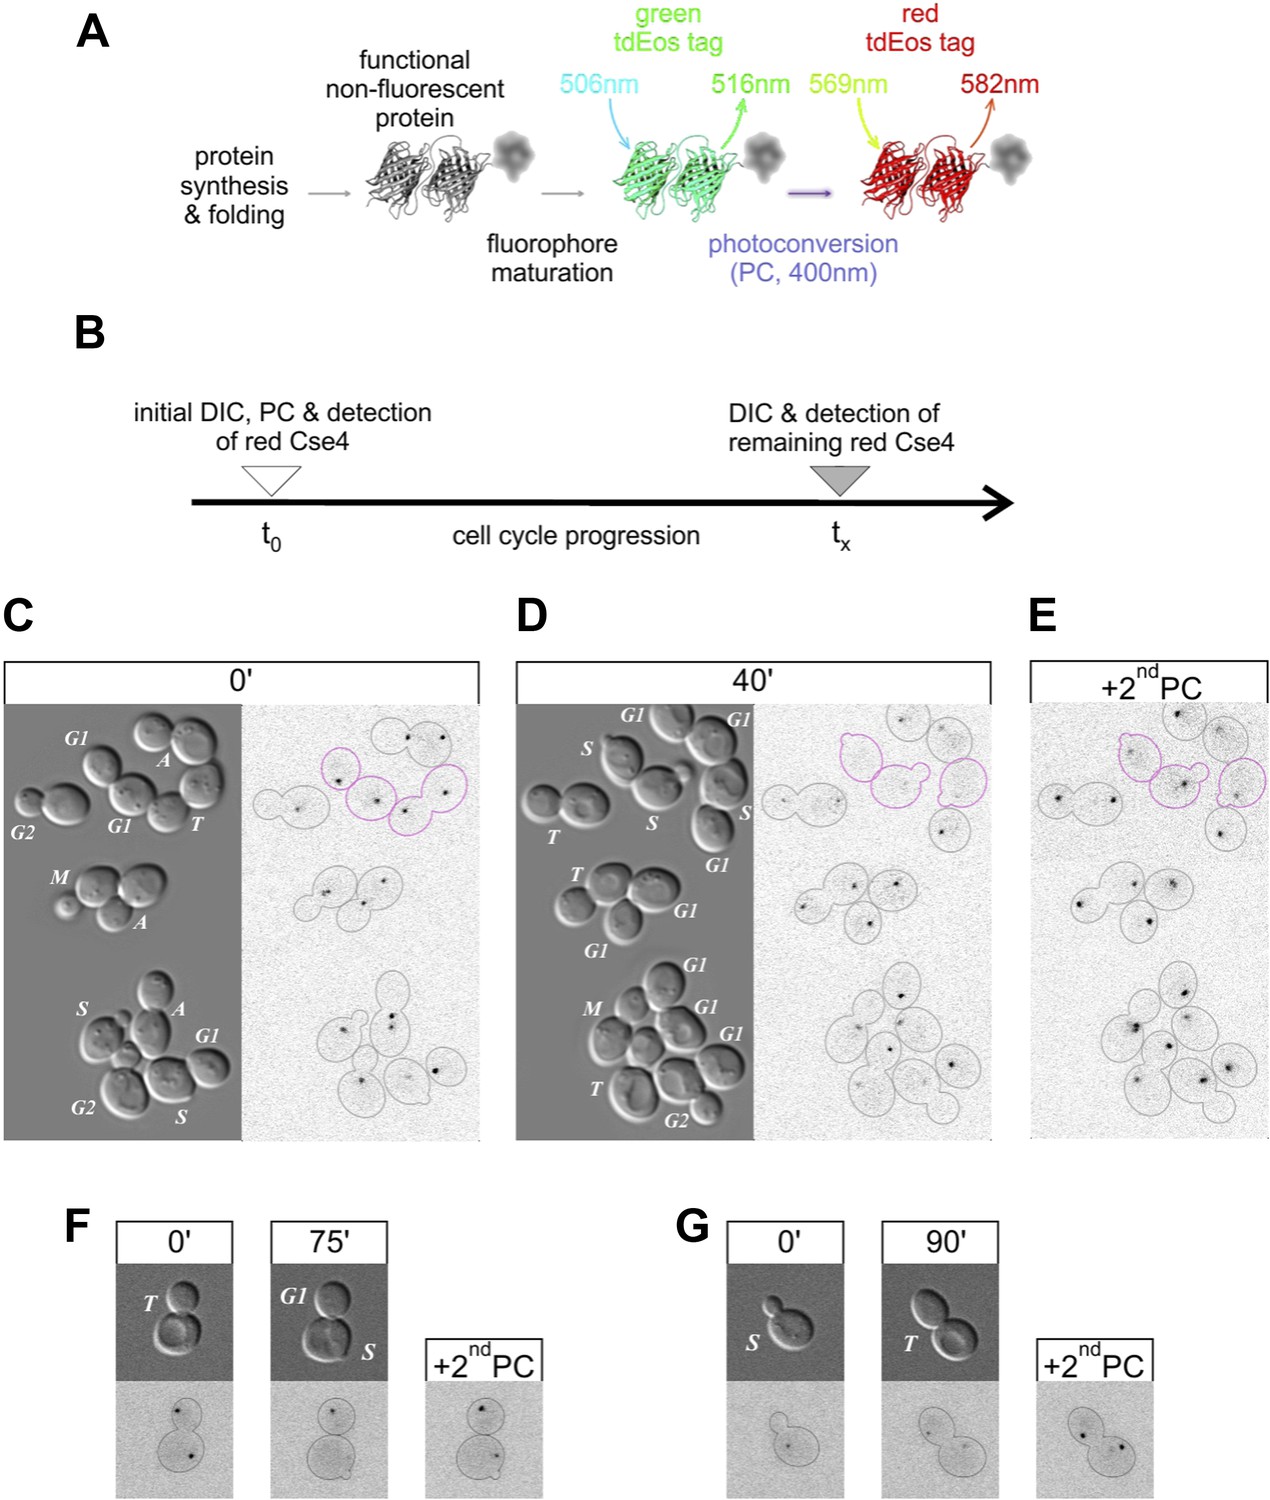
(A) Relevant fluorescence states of a tdEos-tagged protein molecule are depicted schematically after its synthesis and folding, fluorophore maturation and irreversible photoconversion. Excitation and emission peak wavelengths are indicated (see Figure 6—figure supplement 1 for additional details). (B) Pulse-chase experimental scheme. After initial photoconversion (pulse at t0), red-fluorescent Cse4 is followed into later stages of the cell cycle (chase until tx). (C–E) Cells containing Cse4-tdEos were imaged immediately after pulse (C) and following 40 min chase (D). At the end, additional photoconversion (2ndPC) was used to confirm sufficient Z-stack range (E). Three cells that crossed G1/S boundary are outlined in magenta while all other cells are outlined in grey, based on DIC images. (F) An example of a telophase cell followed until mother cell entered S phase, while the bud-derived daughter remained in G1. (G) An example of S phase cell followed into telophase.
Figure 3
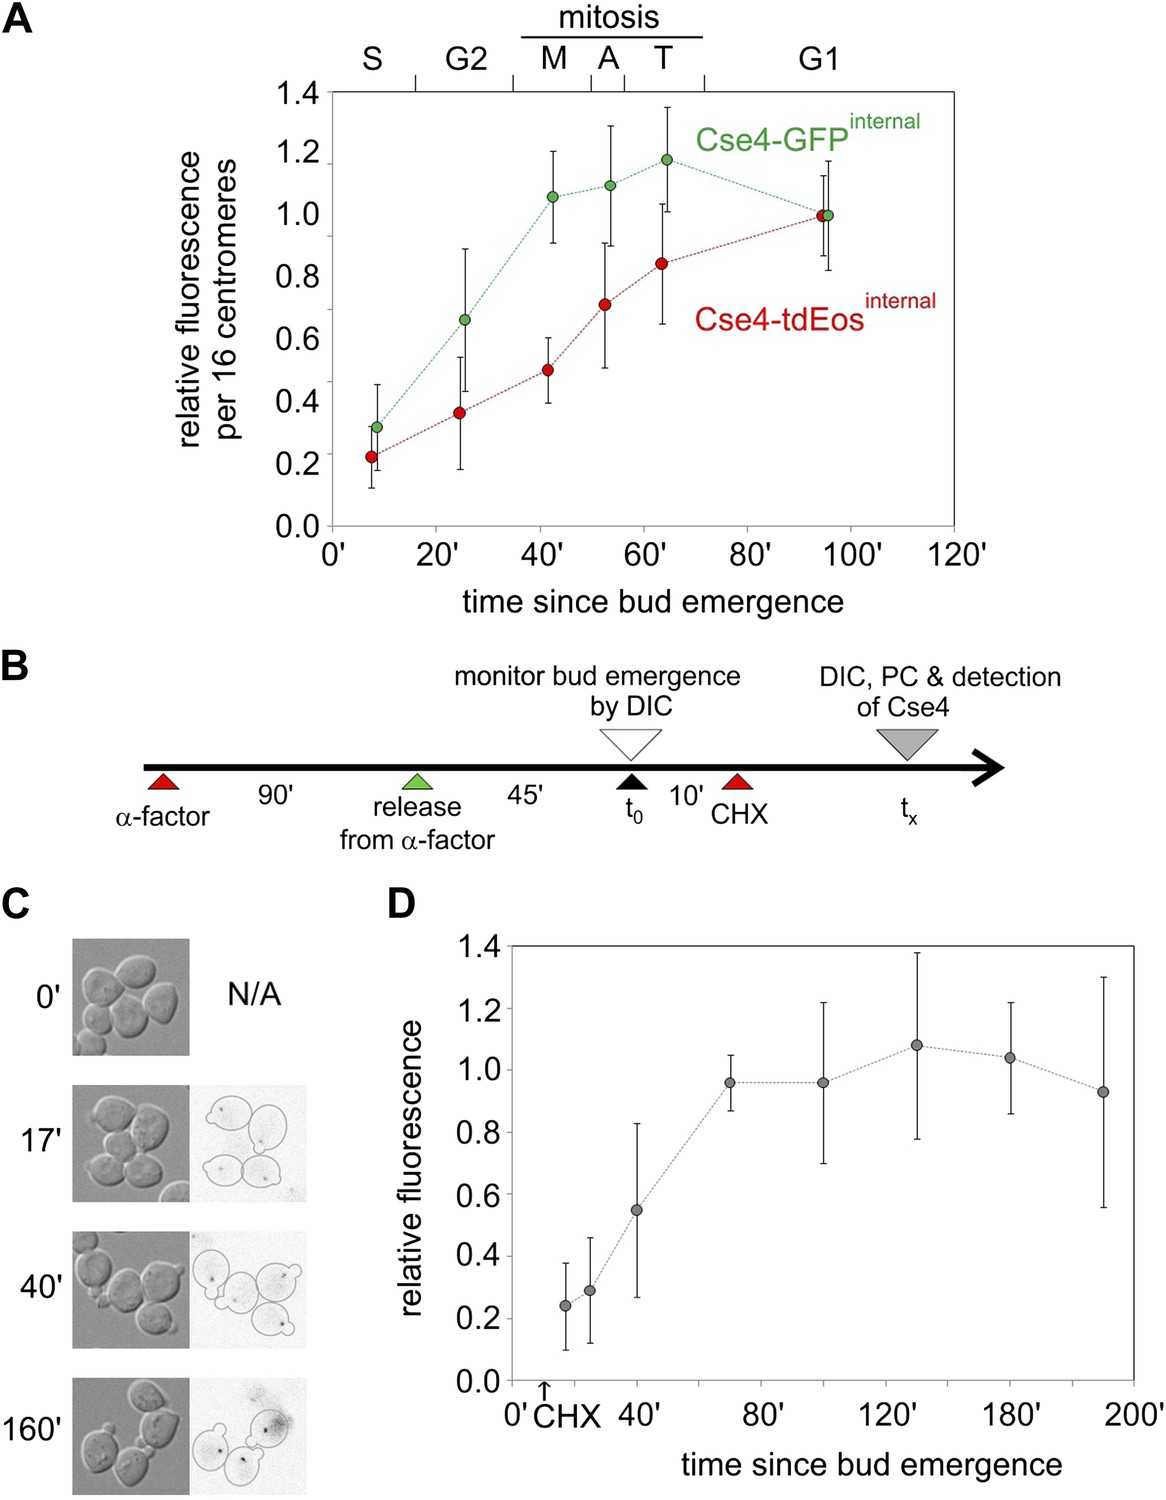
Cell cycle-dependent increase in centromere cluster intensity is a result of fluorophore maturation.
(A) Relative intensity of centromeric clusters in asynchronously growing cells as the function of cell cycle stage and approximate time since entry into S phase. Values were corrected per 16 centromeres, to account for the presence of replicated (32) centromeres in a single ‘dot’ in S and G2. ∼7500 and ∼11,000 photons were detected during 5 s exposure for G1 clusters containing Cse4 with internal GFP or tdEos, respectively—other results were normalized against those values. Standard deviation of each sample is indicated. (B) Schematic of the experiment to measure maturation rate of fluorophores present on Cse4-tdEos. Following α-factor synchronization, cycloheximide (CHX, 0.2 mg/ml) was added 10 min after entry into S phase. (C) Images of S phase cells at different sampling points (tx) after bud emergence. Cells which entered S phase prior to addition of cycloheximide are outlined. (D) Relative fluorescence of Cse4-tdEos centromere clusters in S phase in the absence of protein synthesis. Plateau value (average of points representing tx >100 min, ∼1750 photons detected during 1 s exposure) was used for normalization and standard deviations are indicated.
Figure 4
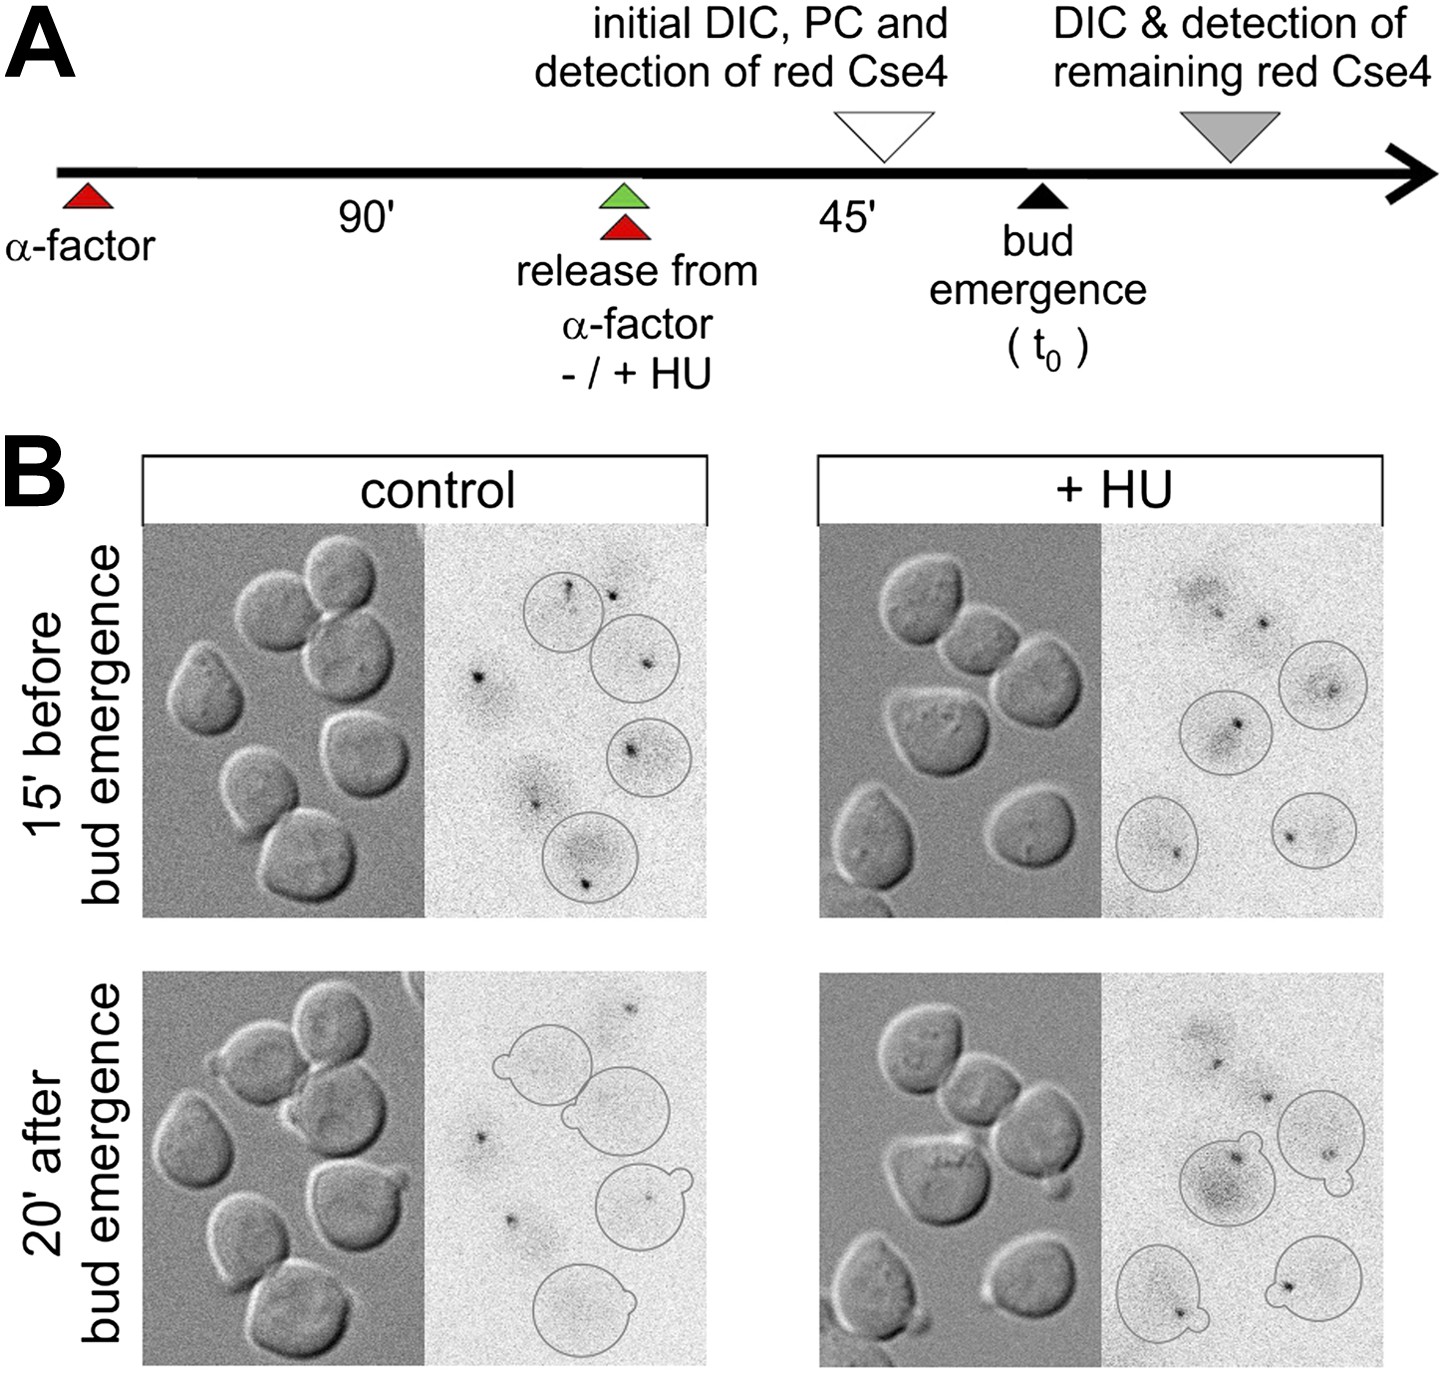
Removal of pre-existing Cse4 is associated with DNA replication.
(A) Experimental scheme to assess role of DNA replication on the removal of pre-existing Cse4. α-factor synchronized cells were released into control medium or one with 0.2 M hydroxyurea (HU). Cse4-tdEos was photoconverted prior to bud emergence and then followed after sizable buds became evident. (B) Examples of cells released from α-factor block directly into control or hydroxyurea (+HU) containing medium. Time of photoconversion and observation after chase is indicated. Only cells on which buds appeared during the observation period are outlined.
Figure 5
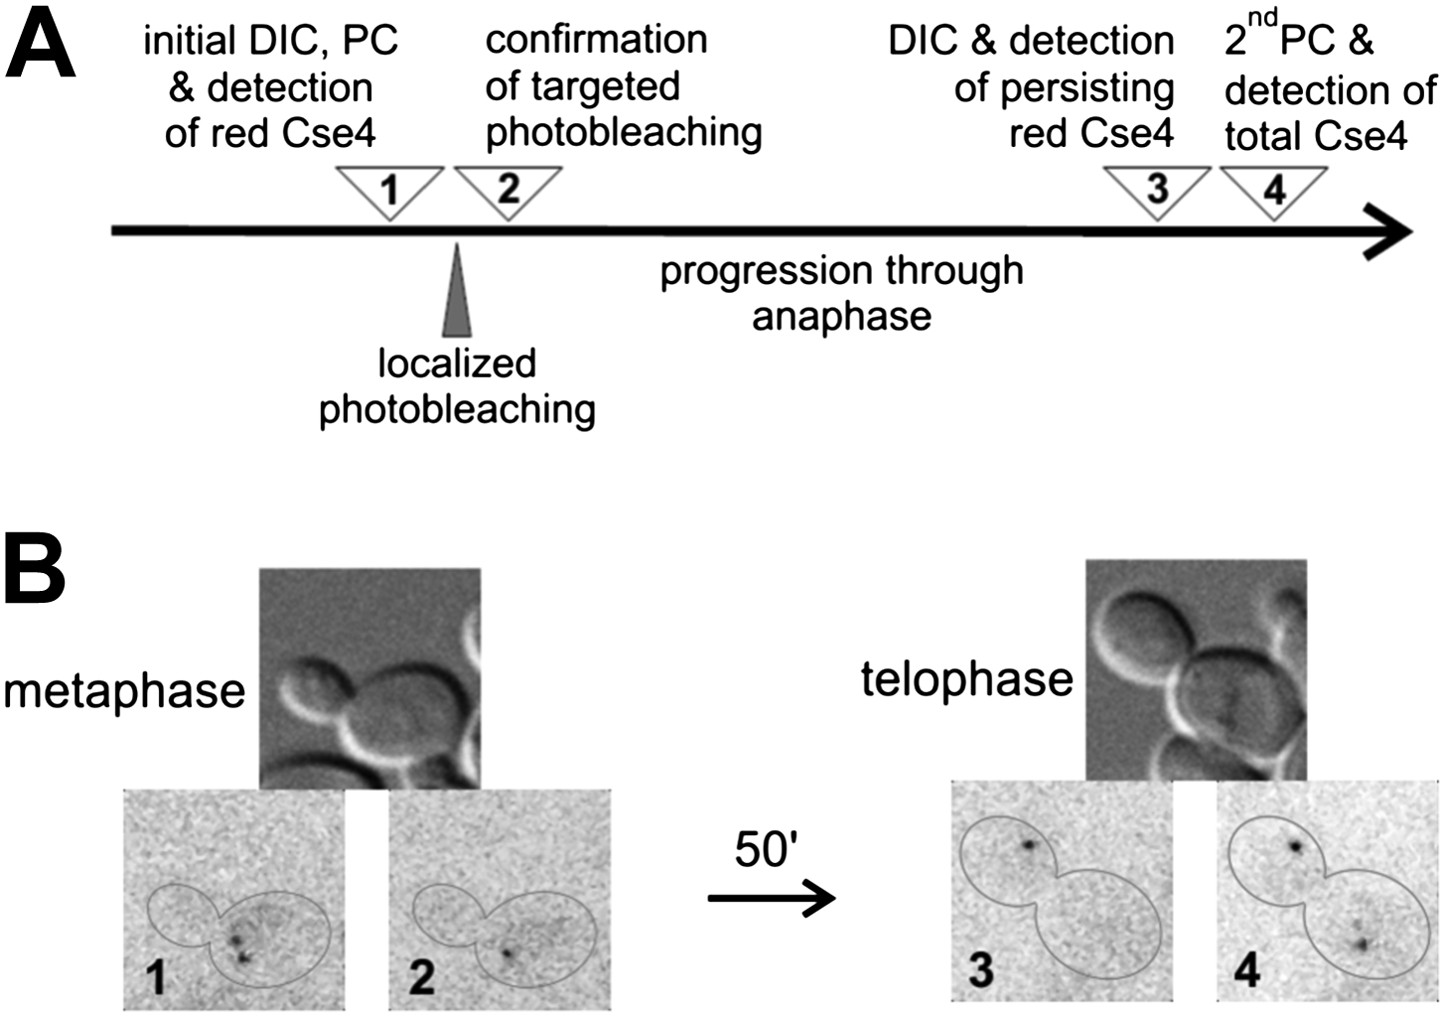
There is no additional Cse4 deposition in anaphase.
(A) Scheme of the experimental test for Cse4 deposition in anaphase. All operations were carried on a selected metaphase cell in the specified order. 3D diffraction-limited spot, generated with a galvano-controlled MicroPoint 551 nm dye laser system, was used for targeted photobleaching. (B) An example of the metaphase cell subjected to a targeted photobleaching of photoconverted Cse4-tdEos centromeric cluster. Images were acquired at stages indicated in panel A.
Figure 6 with 1 supplement

Centromeric clusters become more compact during anaphase.
(A) An example of MFM-PALM image with nine simultaneously acquired Z-planes. Gold Nanorods are indicated (blue circles) and distance above the glass surface is listed for other tiles. Anaphase cell outline (red) is based on a separate bright-field MFM image. Two single-molecule events of Cse4-tdEos are visible inside the cell. (B) A time-trace representation of the number of tdEos fluorophore detections per frame during single MFM-PALM acquisition series. Events lasting >1 frame were considered to represent the same fluorophore. (C) A projection of all 73 independent single-fluorophore detections in the above image series. Image volume is indicated and Z position of individual localizations is color-coded. Each event is depicted as a dot 50 nm across (increased from average 20 nm lateral precision to facilitate visualization at this image scale). Number of events concentrated at each of the two centromeric clusters is listed. See Video 1. ViSP software (El Beheiry and Dahan, 2013) was used for projections in C–E. (D) A representative example of a 3D distribution of Cse4-tdEos molecules on the G1 centromere cluster. Each event (total of 21 independent detections) is depicted as a 20 nm dot, corresponding to the average lateral localization precision. Total volume of 1 μm3 is shown, with color-coded Z distance. See Video 2. (E) A representative late anaphase centromere cluster depicted as above. Total of 24 independent detections are plotted. See Video 3. (F) Compilation of detections from 10 G1 clusters, center-aligned and projected onto XY plane. Grey circle depicts cross-section of a sphere (∼450 nm across) sufficient to contain majority of detected Cse4-tdEos molecules. (G) Compilation of total detections from 10 late anaphase and telophase clusters projected onto XY plane (center-aligned, long axis rotated horizontally). Grey ellipse depicts cross-section of an ellipsoid (∼350 nm equatorial diameter and ∼200 nm polar distance) sufficient to contain majority of detected Cse4-tdEos molecules. In both cases, distribution in Z is comparable to that along X-axis (not shown).
Figure 6—figure supplement 1

tdEos fluorophore undergoes transitions between multiple fluorescent and dark states.
Different states of tdEos fluorophore (and mEos variants, including mIRIS [Wiedenmann et al., 2011]) are shown schematically. Newly synthesized non-fluorescent tdEos undergoes fast folding followed by slow maturation into green emitting state (λexc/λem = 506 nm/516 nm, respectively) (Nienhaus et al., 2006). Green tdEos can undergo irreversible photobleaching as well as conversion to a long-term reversible dark state, from which it is ‘rescued’ by 405 nm illumination (JW personal communication). 405 nm light also induces irreversible photoconversion from green- to red-emitting form (Nienhaus et al., 2006). Interestingly, PFA fixation also results in the conversion of some fluorophores into the red-emitting state (JW, personal communication). Red tdEos may be bleached irreversibly or enter a reversible dark state as well—again subject to rescue by 405 nm illumination (Annibale et al., 2010). In addition, both fluorescent forms undergo short-term ‘blinking’ (not depicted in the figure).
Figure 7 with 1 supplement
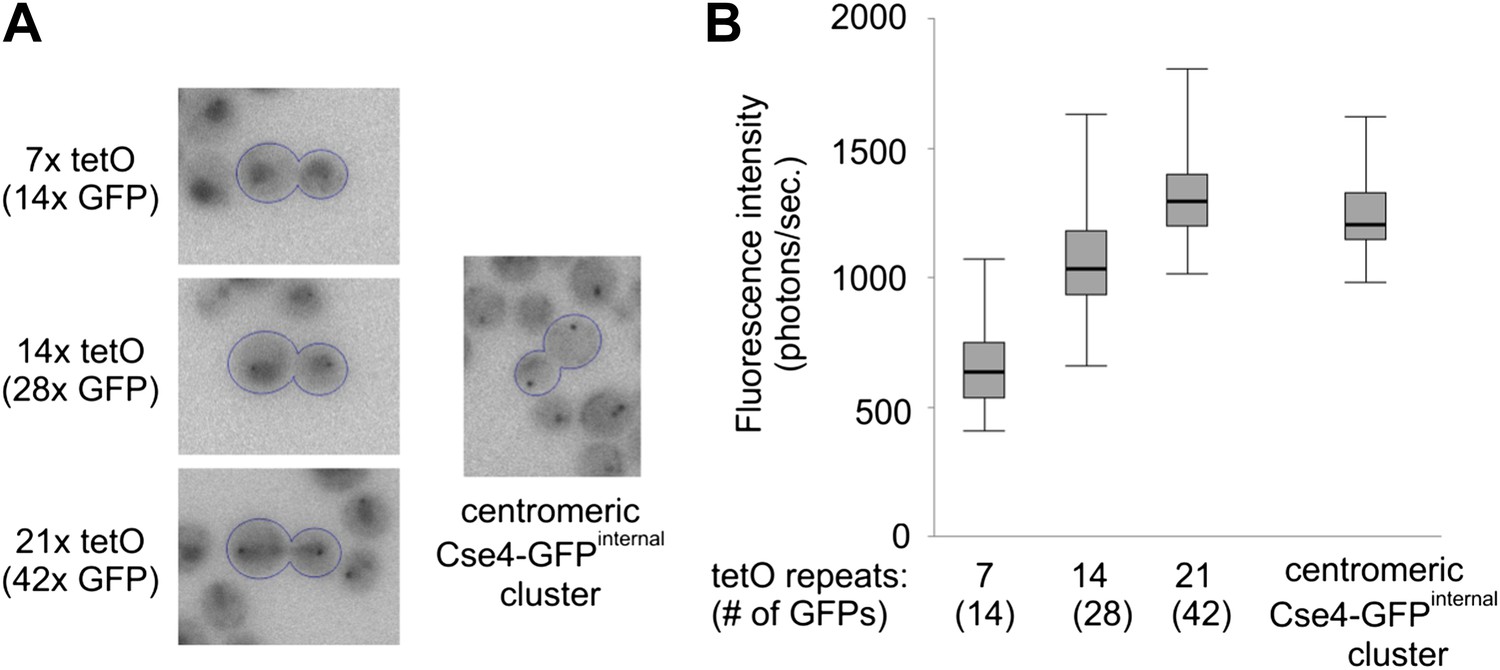
Two Cse4 molecules are present on each centromere.
(A) Comparison of Cse4-GFP centromere clusters with TetR-GFP bound to arrays of 7, 14 or 21 tetO, displayed within the same brightness range. Representative telophase cells are outlined. Clusters in surrounding cells may be out of focus. (B) Fluorescence intensity of tetO arrays and centromeric clusters was measured in telophase cells (2 s exposure). Minimum/1st quartile/median/3rd quartile and maximum values are displayed for each group of 50 measurements. Prior to measurement, clusters were separated from lower frequency components of the image (diffuse fluorescence in nuclei and intracellular autofluorescence) by processing the image with wavelet function and adding together scales 1, 2 and 3 (1, 2 and 4 pixels FWHM).
Figure 7—figure supplement 1
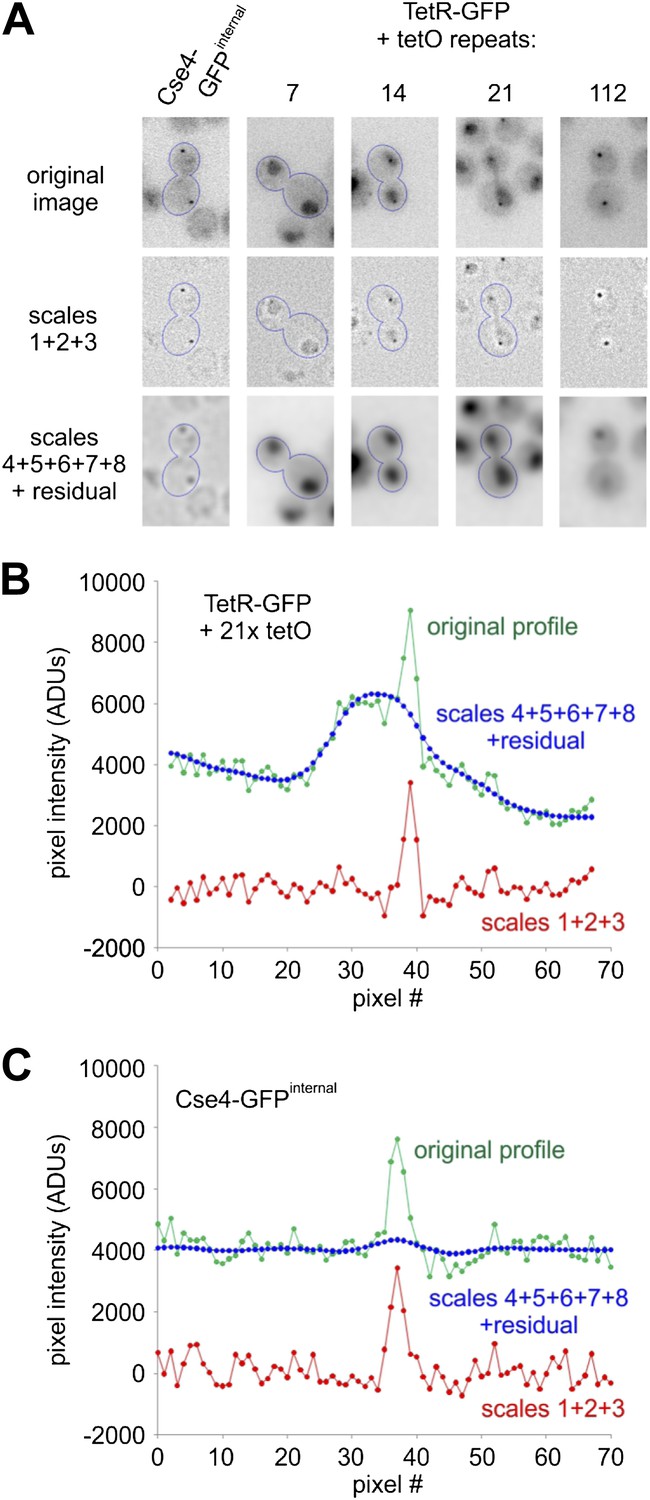
Wavelet filtering allows precise separation of cluster signal from nuclear and cellular background.
(A) Images of the representative telophase cells (outlined) are shown for Cse4-GFPinternal strain or strains containing integrated tetO arrays (7, 14, 21 or 112 repeats) and TetR-GFP under constitutive low level expression from mutated URA3 promoter. Image containing extracted small-scale structures (sum of wavelet scales 1, 2, and 3) is presented together with the larger structures, representing background (including cells and nuclei; sum of remaining wavelet scales and residual). Simple arithmetic addition of all scales (1 through 8) and residual returns the image indistinguishable from the original (within the precision of the 32-bit floating-point format). (B) An example of intensity profile (in ADUs) across cell, nucleus and cluster present in a telophase cell from the strain containing 21x tetO and TetR-GFP. Scales 1+2+3 accurately separate cluster signal from background (represented by higher scales). (C) Similar example of intensity profile and effects of wavelet filtering for a telophase cell containing Cse4-GFPinternal.
Figure 8 with 2 supplements

Scm3 dynamically interacts with centromeres at levels equivalent to Cse4.
(A) Scm3-tdEos fluorescence recovery after targeted photobleaching. The experiment was performed essentially as shown in Figure 5A, except that recovery was monitored by repetitive imaging, without additional photoconversion. In this example, images were acquired only when indicated. Arrowhead indicates targeted centromere cluster. (B) Pulse-chase demonstrates overall stability and cell-cycle persistence of Scm3-tdEos. Photoconverted Scm3 molecules were followed after approximately one and two cell cycles (2.5 and 4 hr, respectively). Fluorescent images are displayed with the same intensity range. (C) Fluorescence intensity of centromeric clusters containing Scm3-tdEos (black circles) or Cse4-tdEosinternal (open circles) in late anaphase/telophase. Average and standard deviation are shown as a function of excitation time to illustrate photostability of photoconverted tdEos. ∼10,000 photons were initially detected in 5 s exposure in both cases. Representative images of individual cells containing Cse4-tdEosinternal or Scm3-tdEos are shown at the same brightness scale.
Figure 8—figure supplement 1

Scm3-tdEos is present on centromeres and in the nucleus at every stage of the cell cycle.
(A) Distribution of Scm3-tdEos in live cells. Cell cycle stages are indicated in DIC panels and red fluorescence, after photoconversion, is shown as in Figure 1. (B) Majority of Scm3 is dispersed throughout nucleus. Average ratio of fluorescence present at centromeres (±standard deviation) through the cell cycle is indicated. (C) Scm3-tdEos is not displaced from centromeres in S phase but its signal diminishes, probably due to exchange with new, less mature molecules.
Figure 8—figure supplement 2

Similar amounts of Cse4 and Scm3 molecules reside at centromeres.
(A) Average intensity (photons/s, ±standard deviation) of centromeric clusters containing Cse4-GFPinternal or Scm3-GFP (n = 8), measured during continuous excitation. (B) Sample images of cells containing Cse4-GFP or Scm3-GFP are shown at the same brightness scale.
Figure 9
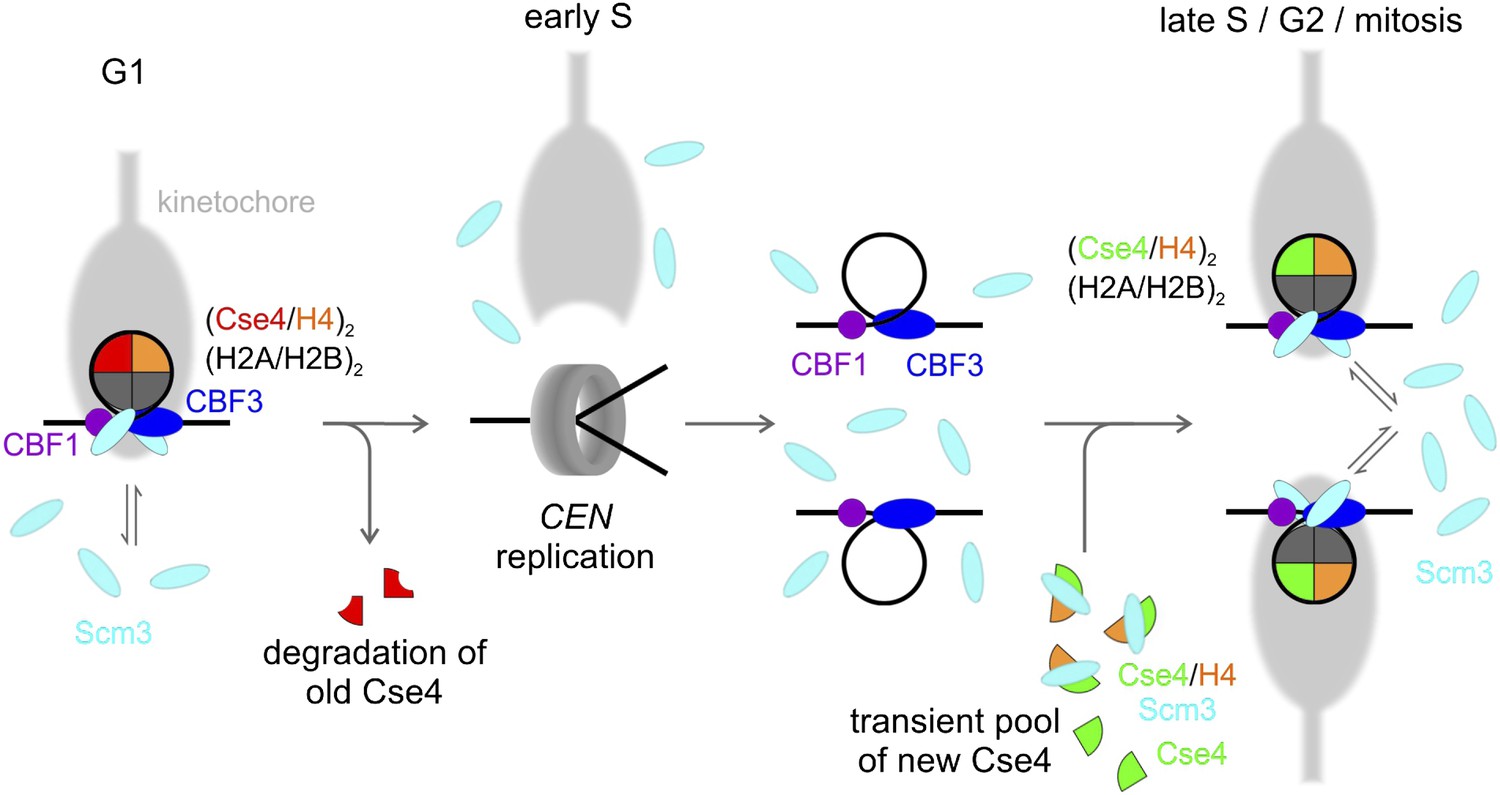
Model of Cse4 replacement and re-establishment of point centromere during cell cycle (see text for details).
https://doi.org/10.7554/eLife.02203.021Videos
Video 1
3D representation of tdEos fluorophore distribution in anaphase cell from Figure 6C.
Each event is depicted as a dot 50 nm across instead of the actual average localization precision (20 nm lateral/50 nm axial). The original color coding of axial distance from Figure 6C is maintained. The video was assembled in ViSP software (El Beheiry and Dahan, 2013).
Video 2
3D representation of Cse4-tdEos distribution in G1 centromere cluster from Figure 6D.
Each event is depicted as a dot 20 nm across instead of the actual average localization precision (20 nm lateral/50 nm axial). The box encloses 1 μm3 volume and two artificial sizing marks (red and blue) are present at the corners. The original color coding of axial distance (Figure 6D) is maintained. The video was assembled in ViSP software (El Beheiry and Dahan, 2013).
Video 3
3D representation of Cse4-tdEos distribution in late anaphase centromere cluster from Figure 6E.
Each event is depicted as a dot 20 nm across instead of the actual average localization precision (20 nm lateral/50 nm axial). The box encloses 1 μm3 volume and two artificial sizing marks (red and blue) are present at the corners. The original color coding of axial distance (Figure 6E) is maintained. The movie was assembled in ViSP software (El Beheiry and Dahan, 2013).
Tables
Table 1
Recovery time of centromeric Scm3-tdEos after targeted photobleaching
| Cell cycle stage | Mean recovery time (min) | Standard deviation | Sample size |
|---|---|---|---|
| G1 | 5.2 | 2.5 | 9 |
| S | 4.5 | 1.6 | 4 |
| metaphase | 4.9 | 2.3 | 7 |
| anaphase | 4.7 | 2.0 | 13 |
| telophase | 5.1 | 2.7 | 9 |
-
Note: After targeted photobleaching of photoconverted Scm3-tdEos centromere clusters with 551 nm dye-laser, cells were imaged with stepwise focus changes within -1 μm to +1 μm Z range (7 steps, 333nm apart, 5 sec. exposure per step). G2 clusters were excluded due to their extended size.
Table 2
Saccharomyces cerevisiae strains
| Strain | Genotype |
|---|---|
| MBY507* | MATa ade2 CSE4-GFP-CSE4 can1-100 his3-11,15 leu2-3,112 trp1-1 ura3-1 RAD5 |
| JBY119† | MATa ADE2 dynLC::hphMX4 cse4::natMX4 can1-100 his3-11,15 leu2-3,112::LEU2-CSE4-tdEOS-CSE4 trp1-1 ura3-1 RAD5 |
| JBY111‡ | MATa ADE2 dynLC::hphMX4 SCM3-tdEOS-kanMX4 can1-100 his3-11,15 leu2-3,112 trp1-1 ura3-1 RAD5 |
| JBY251§ | MATa ADE2 can1-100 his3-11,15 leu2-3,112::LEU2-Δ80ura3p-TetR-GFP-TAP-ADHt trp1-1 ura3-1::pRS406-7xtetO RAD5 |
| JBY252§ | MATa ADE2 can1-100 his3-11,15 leu2-3,112::LEU2-Δ80ura3p-TetR-GFP-TAP-ADHt trp1-1 ura3-1::pRS406-14xtetO RAD5 |
| JBY253§ | MATa ADE2 can1-100 his3-11,15 leu2-3,112::LEU2-Δ80ura3p-TetR-GFP-TAP-ADHt trp1-1 ura3-1::pRS406-21xtetO RAD5 |
| JBY254§ | MATa ADE2 can1-100 his3-11,15 leu2-3,112::LEU2-Δ80ura3p-TetR-GFP-TAP-ADHt trp1-1 ura3-1::pRS306-112xtetO RAD5 |
| MSY173# | MATa his3-1 leu2-0 ura3-0 Cse4-GFP::SpHIS5 |
-
Notes: *Cse4-GFPinternal, Xiao et al., 2011.
-
†
Cse4-tdEosinternal, this paper.
-
‡
Scm3-tdEosC-terminal, this paper.
-
§
7, 14, 21 or 112 tetO repeats, respectively, and TetR-GFP, this paper.
-
#
Cse4-GFPC-terminal, Shivaraju et al., 2012.
Table 3
Light sources and filters used for wide field fluorescence imaging
| Fluorophore | Light source & channel | Filter cube | ||
|---|---|---|---|---|
| Excitation | Beamsplitter | Emission | ||
| GFP | Colibri/LED470* Spectra-6/C§ | FF01-475/28† LL01-488/1† | T495LP‡ | FF01-525/50† |
| tdEos (red emission) | Colibri/LED555* Spectra-6/GY§ | BP550/25* FF01-543/3† | FT570* FF568-Di01† | BP605/70* FF01-593/46† |
| tdEos (photoconversion) | Colibri/LED405* Spectra-6/V§ | FF01-405/10† | 59004BS‡ | 59004M‡ |
-
Source: *Zeiss.
-
†
Semrock.
-
‡
Chroma.
-
§
Lumencor.
Additional files
-
Supplementary file 1
Batch FITS converter macro for ImageJ. This macro converts 16-bit TIFF files from a selected folder into FITS files (re-assigned into 32-bit floating-point space) and saves them in a destination folder. The content of the file should be saved as ‘Batch FITS Converter.txt’ into Macro folder of ImageJ.
- https://doi.org/10.7554/eLife.02203.024
Download links
A two-part list of links to download the article, or parts of the article, in various formats.
Downloads (link to download the article as PDF)
Open citations (links to open the citations from this article in various online reference manager services)
Cite this article (links to download the citations from this article in formats compatible with various reference manager tools)
Imaging the fate of histone Cse4 reveals de novo replacement in S phase and subsequent stable residence at centromeres
eLife 3:e02203.
https://doi.org/10.7554/eLife.02203


