Hsp70 chaperones are non-equilibrium machines that achieve ultra-affinity by energy consumption
- Ecole Polytechnique Fédérale de Lausanne (EPFL), Switzerland
Figures
Figure 1
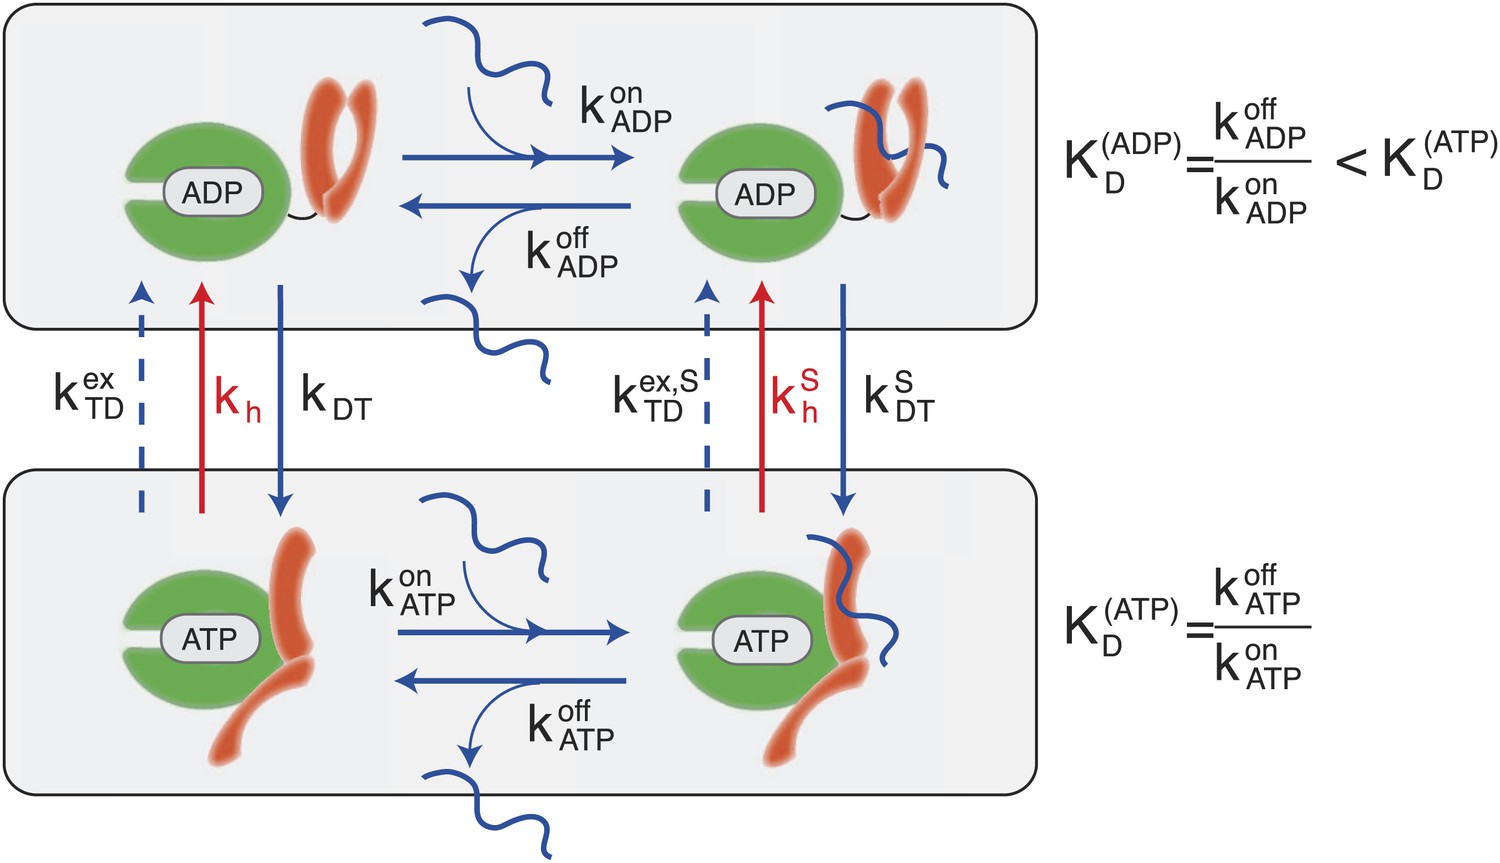
Canonical Hsp70 biochemical cycle.
The model takes into account four states in Hsp70 (NBD is schematically represented here in green, SBD in orange), which are defined by substrate binding and by the nature of the bound nucleotide (ADP or ATP). The rates of the substrate binding/unbinding process (horizontal blue lines) are influenced by the nucleotide (, , , ). ADP-bound states are converted to ATP-bound states through a nucleotide exchange process (vertical solid blue lines) with rates kDT , . The ATP to ADP conversion can occur by means of either a nucleotide exchange process (dashed blue lines) with rates , or ATP-hydrolysis (red lines) with rates kh, .
Figure 2
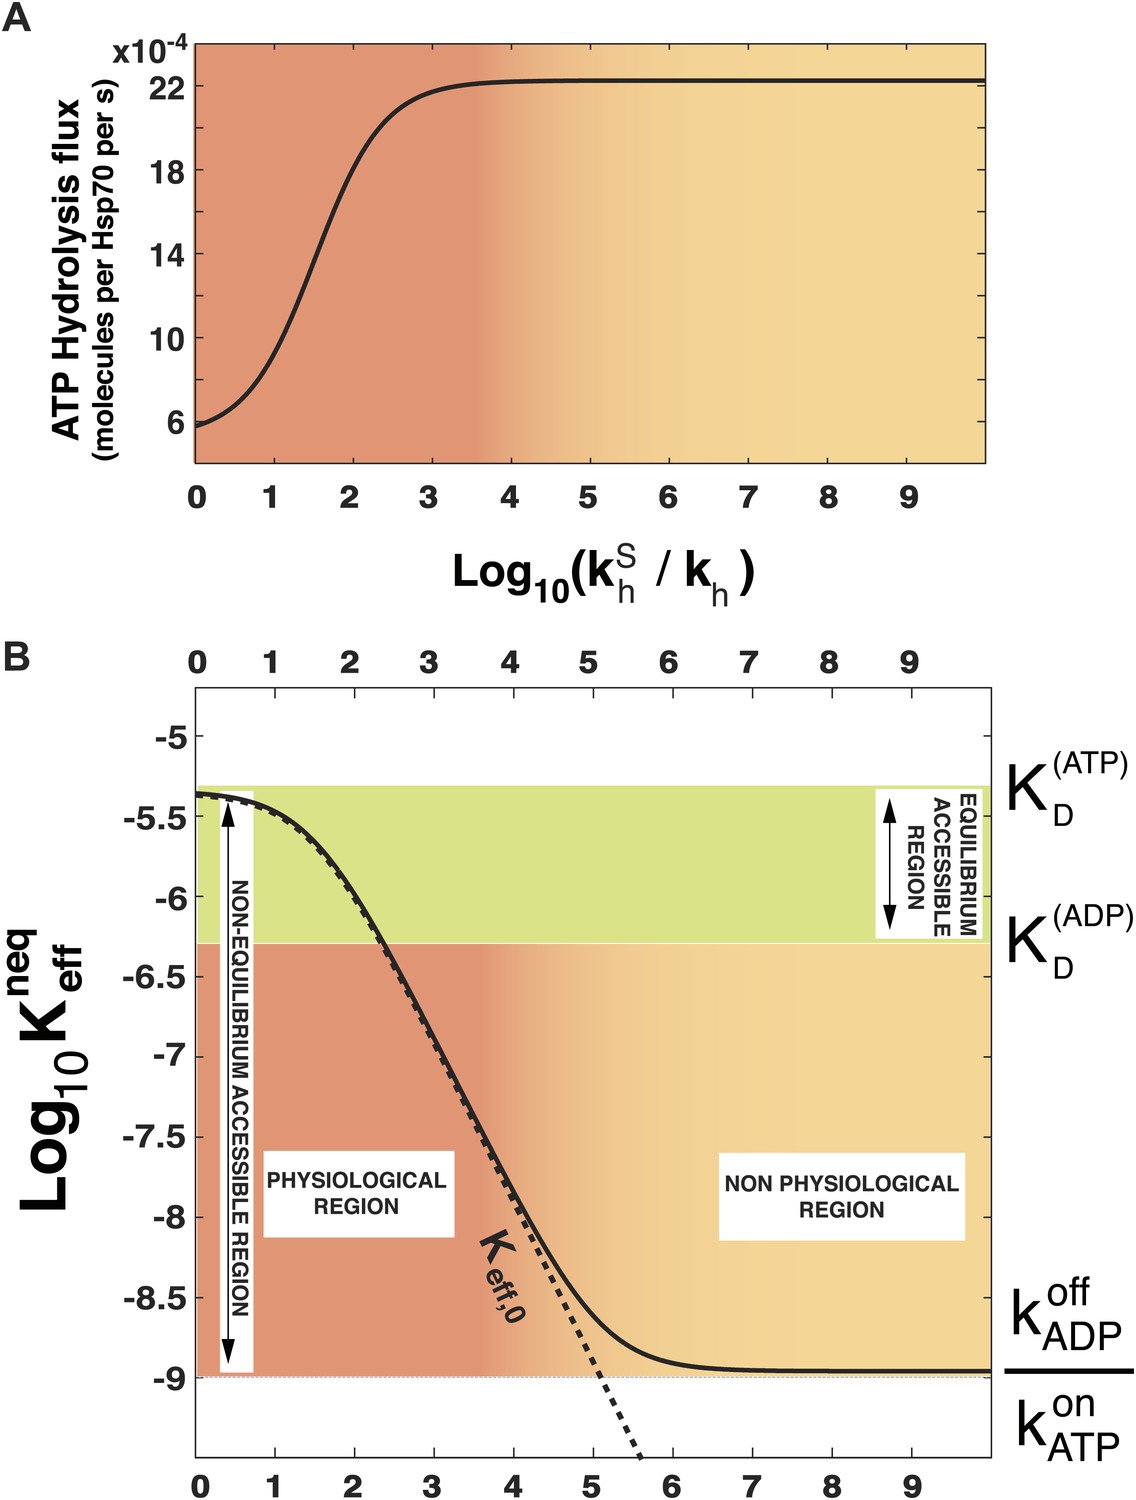
Effect of ATP-hydrolysis on .
Total energy consumption (A) and effective non-equilibrium dissociation constant of the Hsp70-substrate complex (B) is plotted as a function of the hydrolysis acceleration ratio , for the DnaK/DnaJ/substrate system with concentrations [Hsp70]tot = 40 μM and [S]tot = 4 μM (see ‘Materials and methods’ for the parameters), The approximate dissociation constant is also plotted for comparison (black dashed line). The green region comprised between and corresponds to the range of affinities accessible at equilibrium (no hydrolysis). The red-to-yellow region corresponds to the values of the dissociation constants that are exclusively accessible to the non-equilibrium regime. The region where red fades to yellow (103 ≤ ≤ 104) corresponds to the transition from physiological to non-physiological values of hydrolysis acceleration.
Figure 3
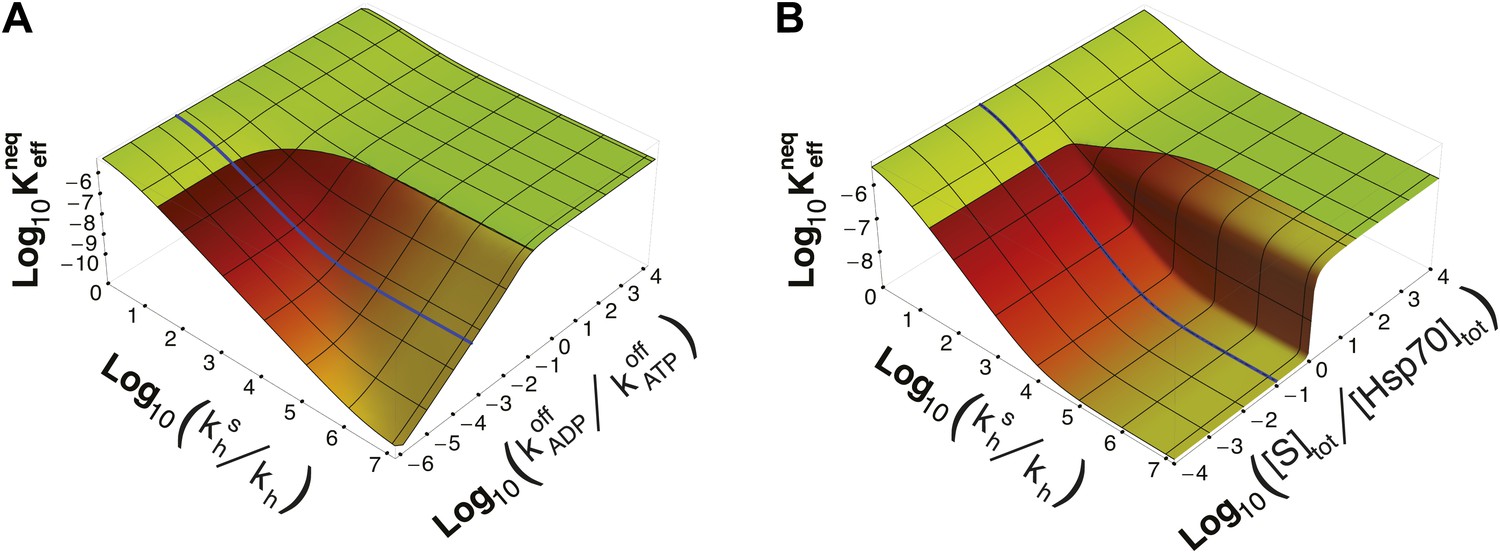
Dependence of on time-scale separation and on stoichiometric ratio.
(A) Non-equilibrium dissociation constant as a function of the hydrolysis acceleration ratio and of the time-scale separation between the ATP- and ADP-state, expressed as the ratio between the substrate unbinding rates between the ATP- and ADP-state. (B) Non-equilibrium dissociation constant as a function of the hydrolysis acceleration ratio and of the stoichiometric ratio between the total substrate and Hsp70 concentrations. The color codes are the same as in Figure 2, green for the region accessible in equilibrium, and red-to-yellow for the region accessible in non-equilibrium. The blue line is the non-equilibrium dissociation constant reported in Figure 2B.
Tables
Table 1
Parameters of the model
| kh | 0.0006 s−1 (McCarty et al., 1995) |
| * | 1.8 s−1 (Laufen et al., 1999) |
| 4.5 × 10⁵ s−1 M−1 (Schmid et al., 1994; Gisler et al., 1998) | |
| 2 s−1 (Schmid et al., 1994; Gisler et al., 1998) | |
| 1000 s−1 M−1 (Mayer et al., 2000) | |
| 4.7 × 10⁻⁴ s−1 (Mayer et al., 2000) | |
| kATP− | 1.33 × 10⁻⁴ s−1 (Russell et al., 1998) |
| kATP+ | 1.3 × 10⁵ s−1 M−1 (Russell et al., 1998) |
| kADP− | 0.022 s−1 (Theyssen et al., 1996; Russell et al., 1998) |
| kADP+ | 2.67 × 10⁵ s−1 M−1 (Russell et al., 1998) |
-
Parameters used in the model, from various sources. Notable cases are:
-
*
This corresponds to the reaction Hsp70⋅ATP⋅DnaJ2⋅S → Hsp70⋅ADP⋅DnaJ2⋅S.
Download links
A two-part list of links to download the article, or parts of the article, in various formats.
Downloads (link to download the article as PDF)
Open citations (links to open the citations from this article in various online reference manager services)
Cite this article (links to download the citations from this article in formats compatible with various reference manager tools)
Hsp70 chaperones are non-equilibrium machines that achieve ultra-affinity by energy consumption
eLife 3:e02218.
https://doi.org/10.7554/eLife.02218


