An atomic-resolution view of neofunctionalization in the evolution of apicomplexan lactate dehydrogenases
- Brandeis University, United States
- Lawrence Berkeley National Laboratory, United States
Figures
Figure 1 with 1 supplement
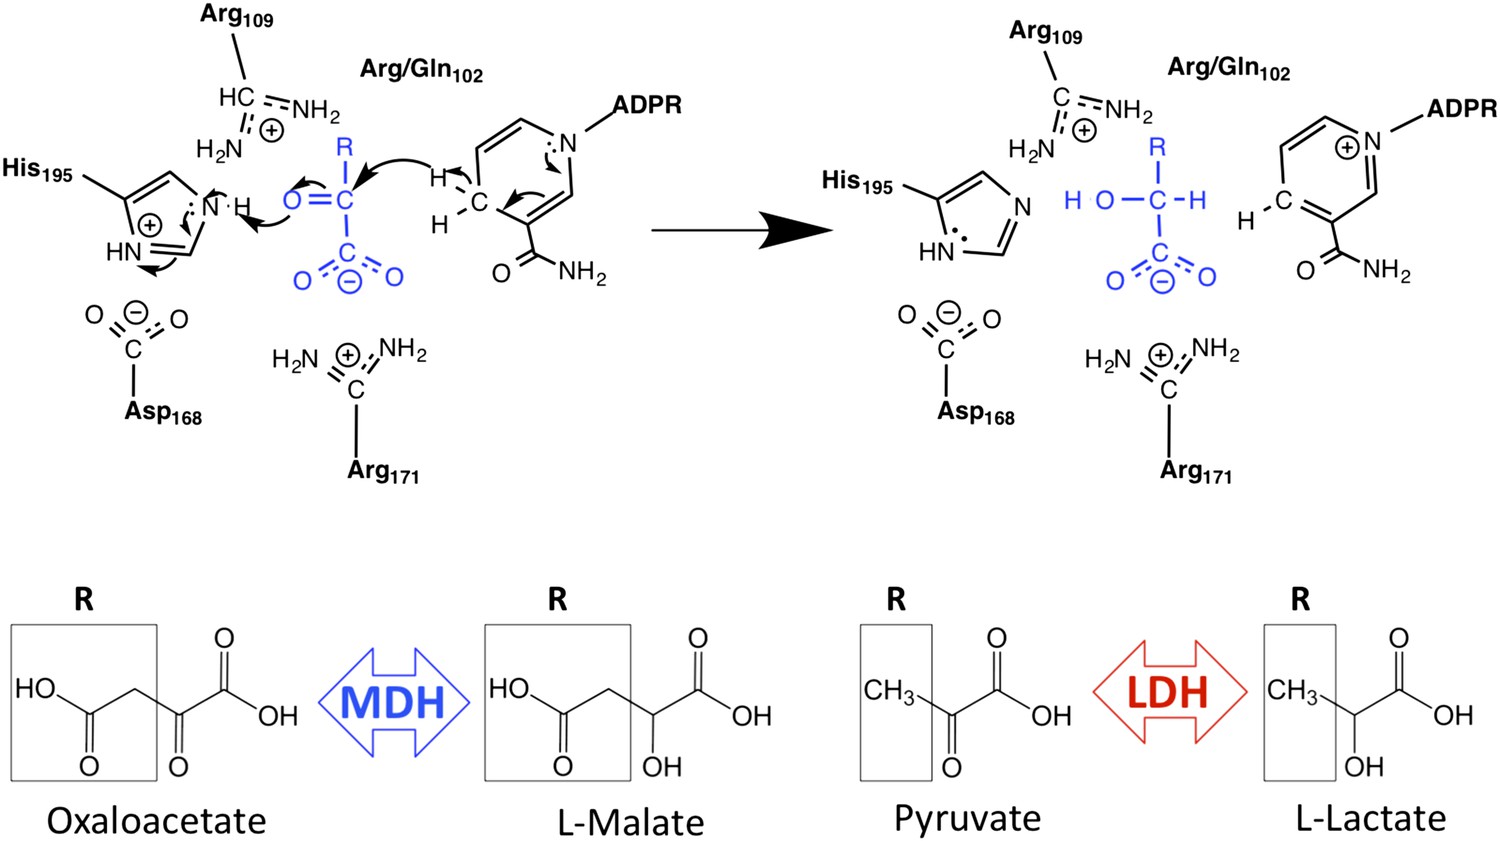
Schematic of M/LDH superfamily active site and catalytic mechanism.
MDH reduces oxaloacetate to malate, in which the R-group is a methylene carboxylate group. LDH reduces pyruvate to lactate, in which the R-group is a methyl group. Key conserved active site residues are shown in black; substrate is shown in blue. The oxidized 2-ketoacid form of the substrate is at left; the reduced 2-hydroxy acid form is shown at right. The R-group of the substrate interacts with Arg102 in MDHs and Gln102 in canonical LDHs. Both Arg109 and position 102 are found in the mobile ‘specificity loop’ that closes over the active site.
Figure 1—figure supplement 1
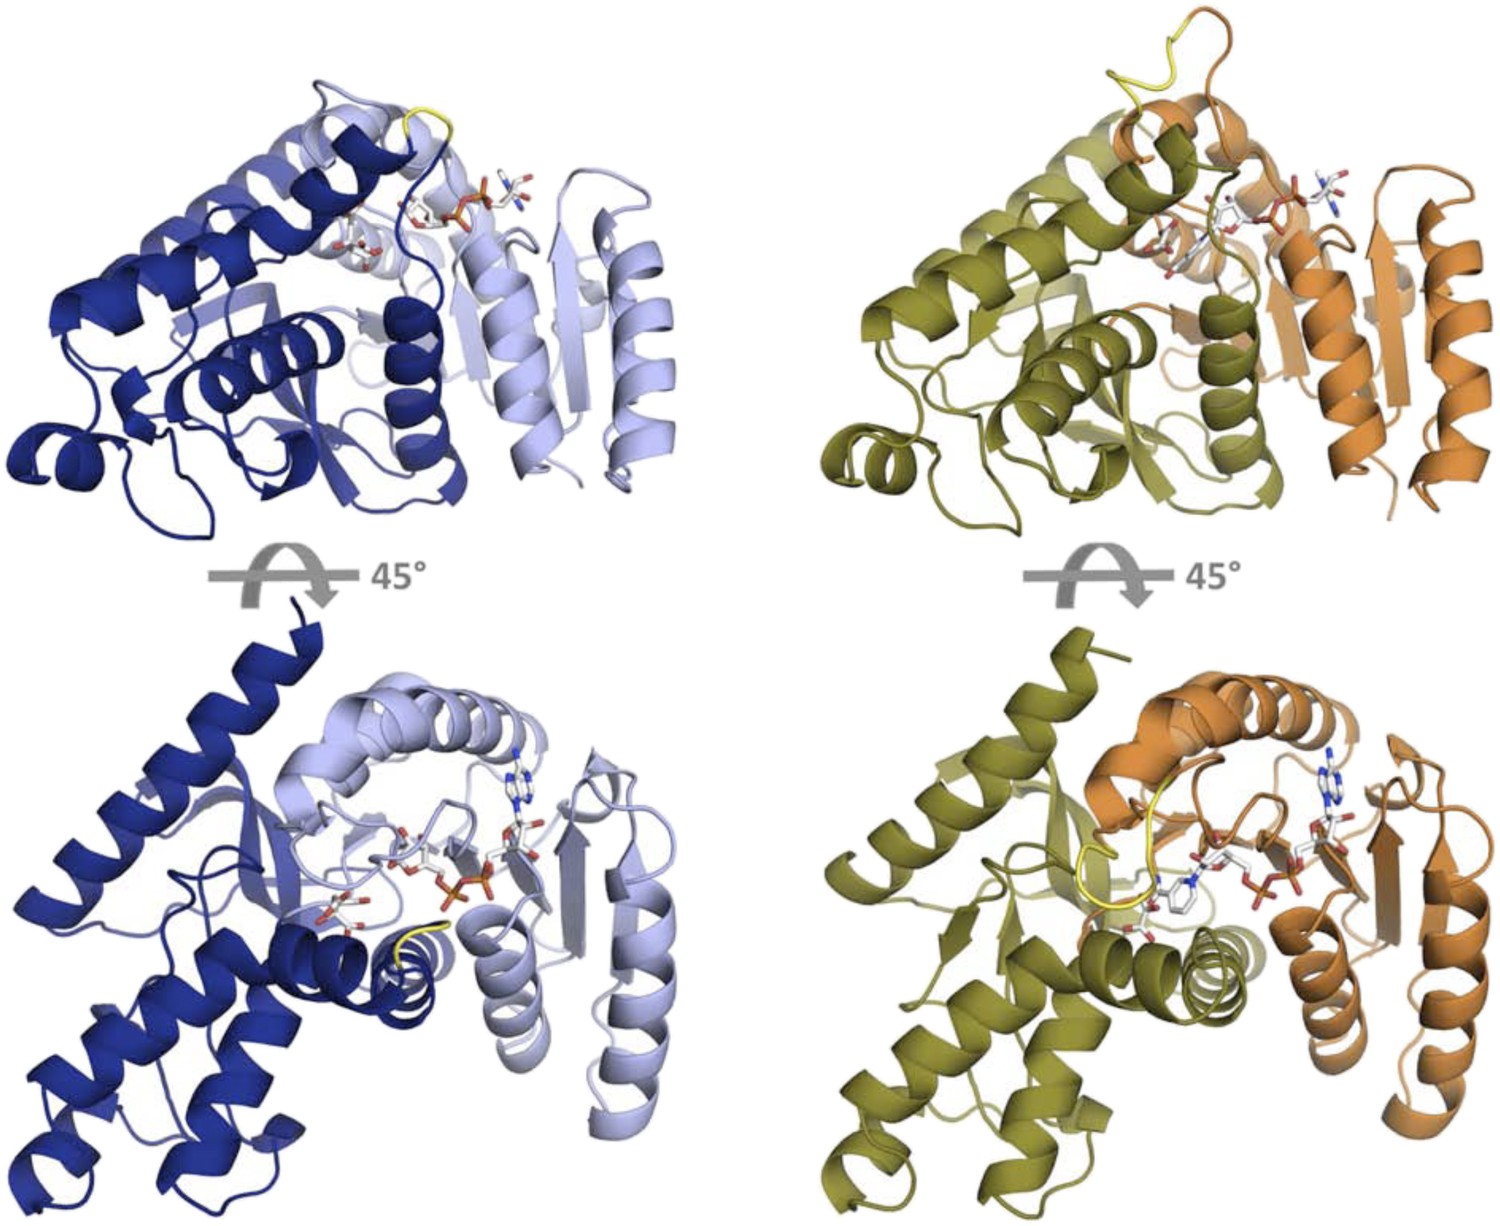
Fold architecture in the LDH and MDH superfamily.
At left is CpMDH (blue, 2hjr), at right is PfLDH (vermilion and olive, 1t2d). The Rossmann fold domain, which binds the NADH cofactor, is show as light blue in CpMDH and vermilion in PfLDH. The active site is found at the interface of the two domains. In CpMDH, the ‘opposing loop’ is highlighted in yellow (see text). In PfLDH, the six-residue insertion is highlighted in yellow.
Figure 2 with 3 supplements
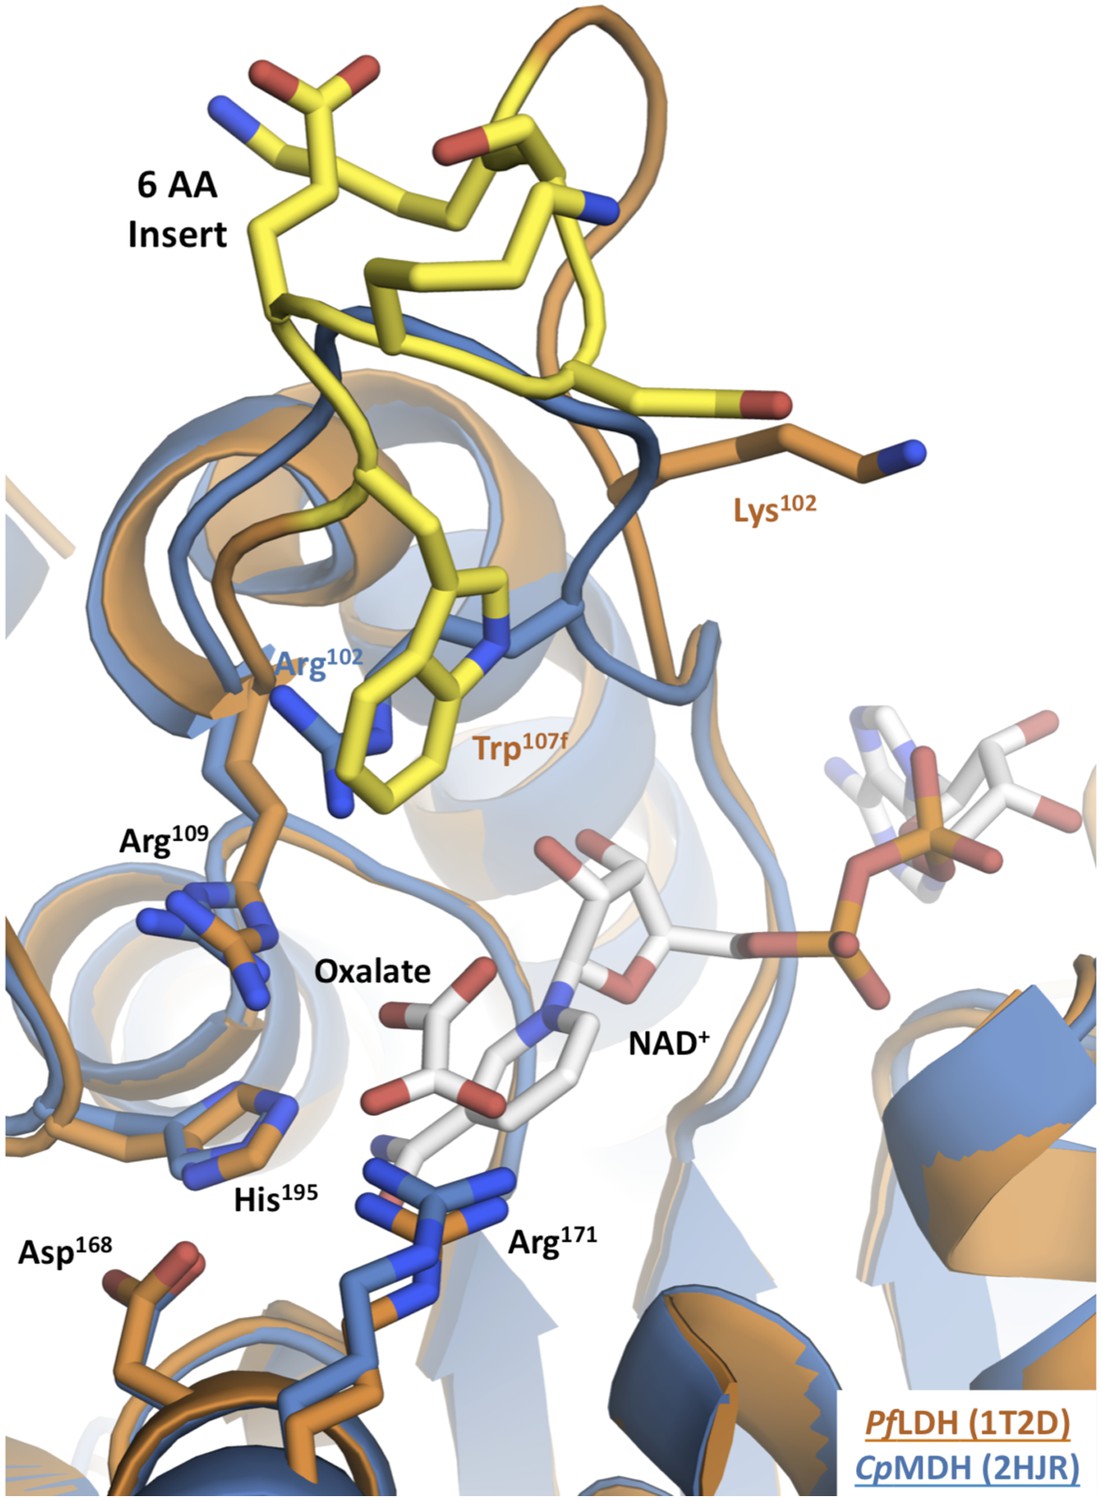
Apicomplexan M/LDH active sites.
Structures of CpMDH (blue, 2hjr) and PfLDH (vermilion, 1t2d) superposed using THESEUS. The ligands (oxalate and NAD+) are from 1t2d and colored white. Side chains of important residues are shown as sticks and the six-residue insert of PfLDH is highlighted in yellow. Note how the PfLDH Trp107f overlays Arg102 from CpMDH. Residues in the insertion are labeled using numbers and letters to maintain consistency with homologous positions in the dogfish LDH.
Figure 2—figure supplement 1
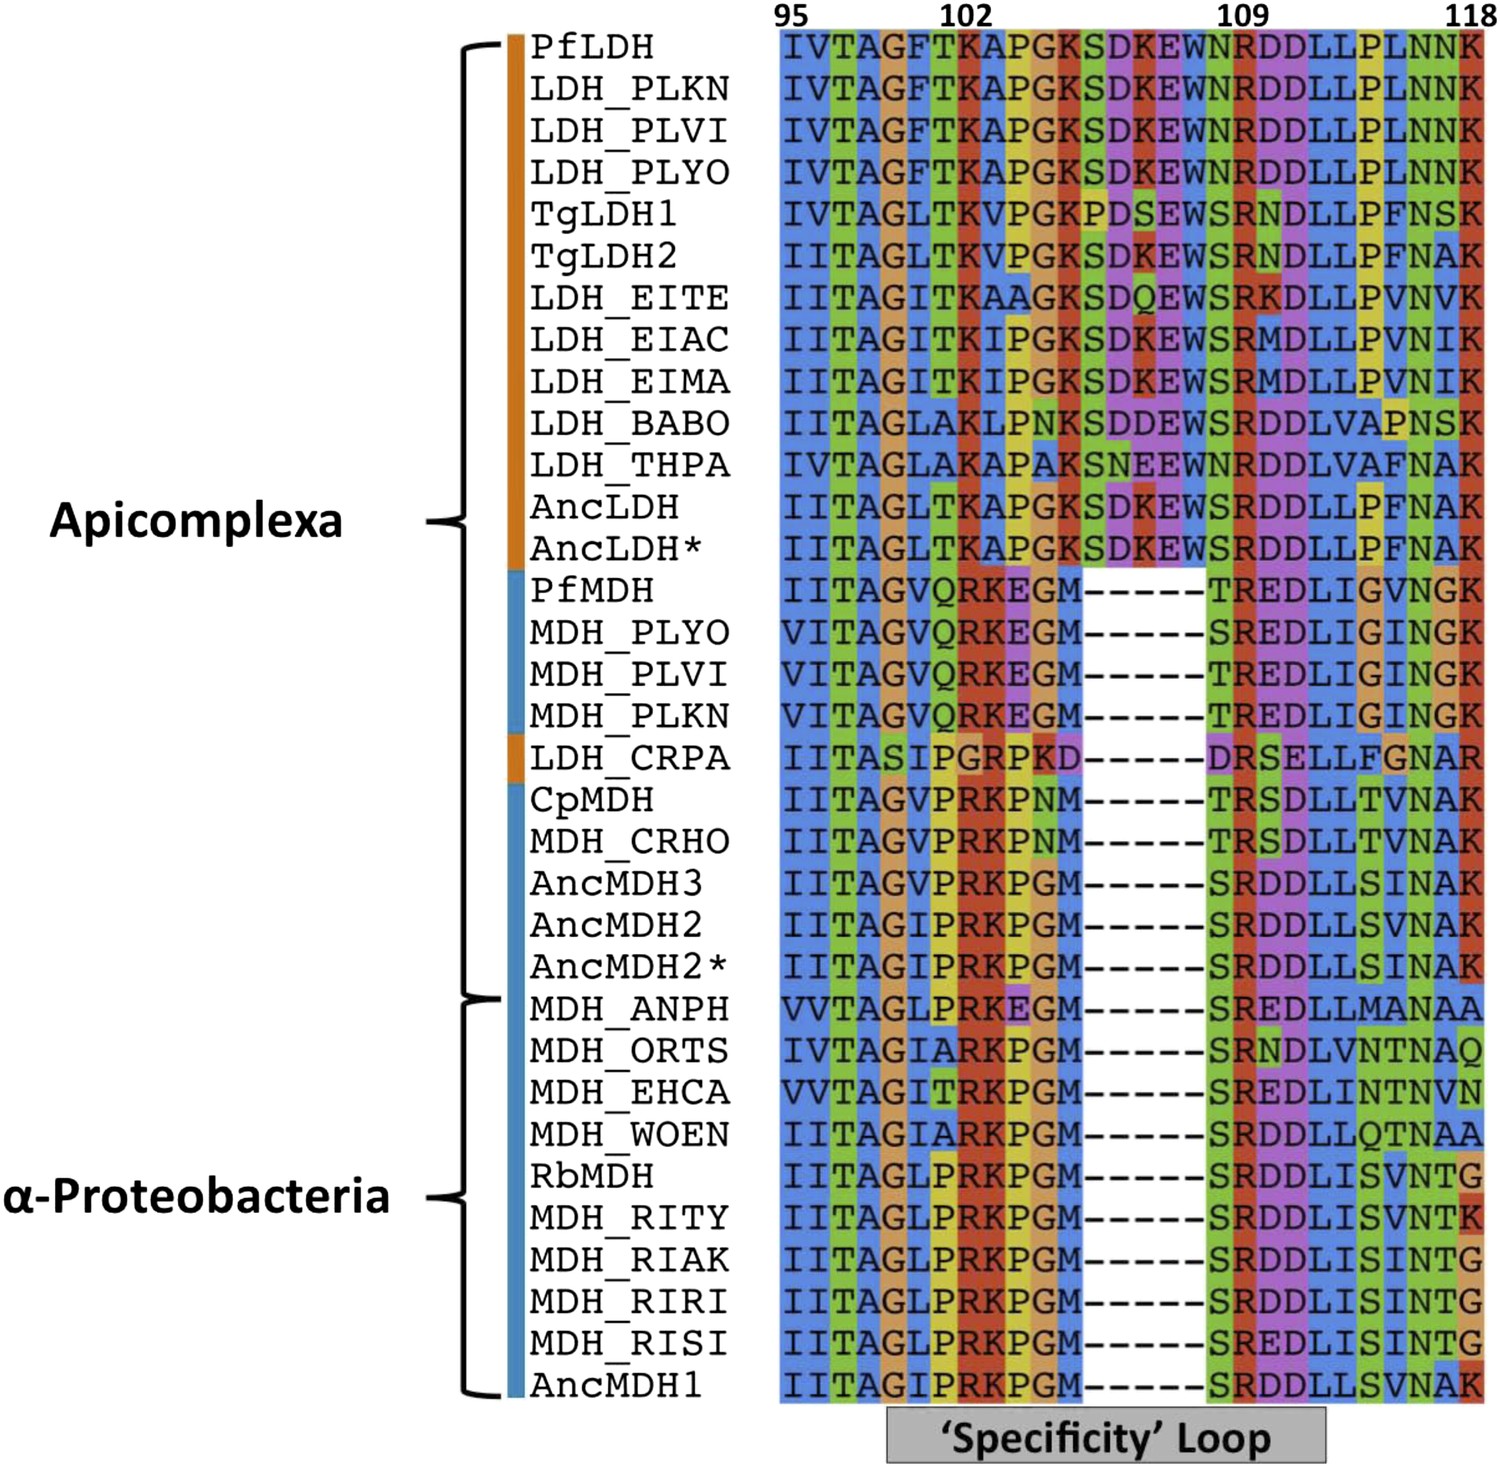
Sequence alignment of the specificity loop from apicomplexan M/LDHs with ancestral sequences.
https://doi.org/10.7554/eLife.02304.006
Figure 2—figure supplement 2
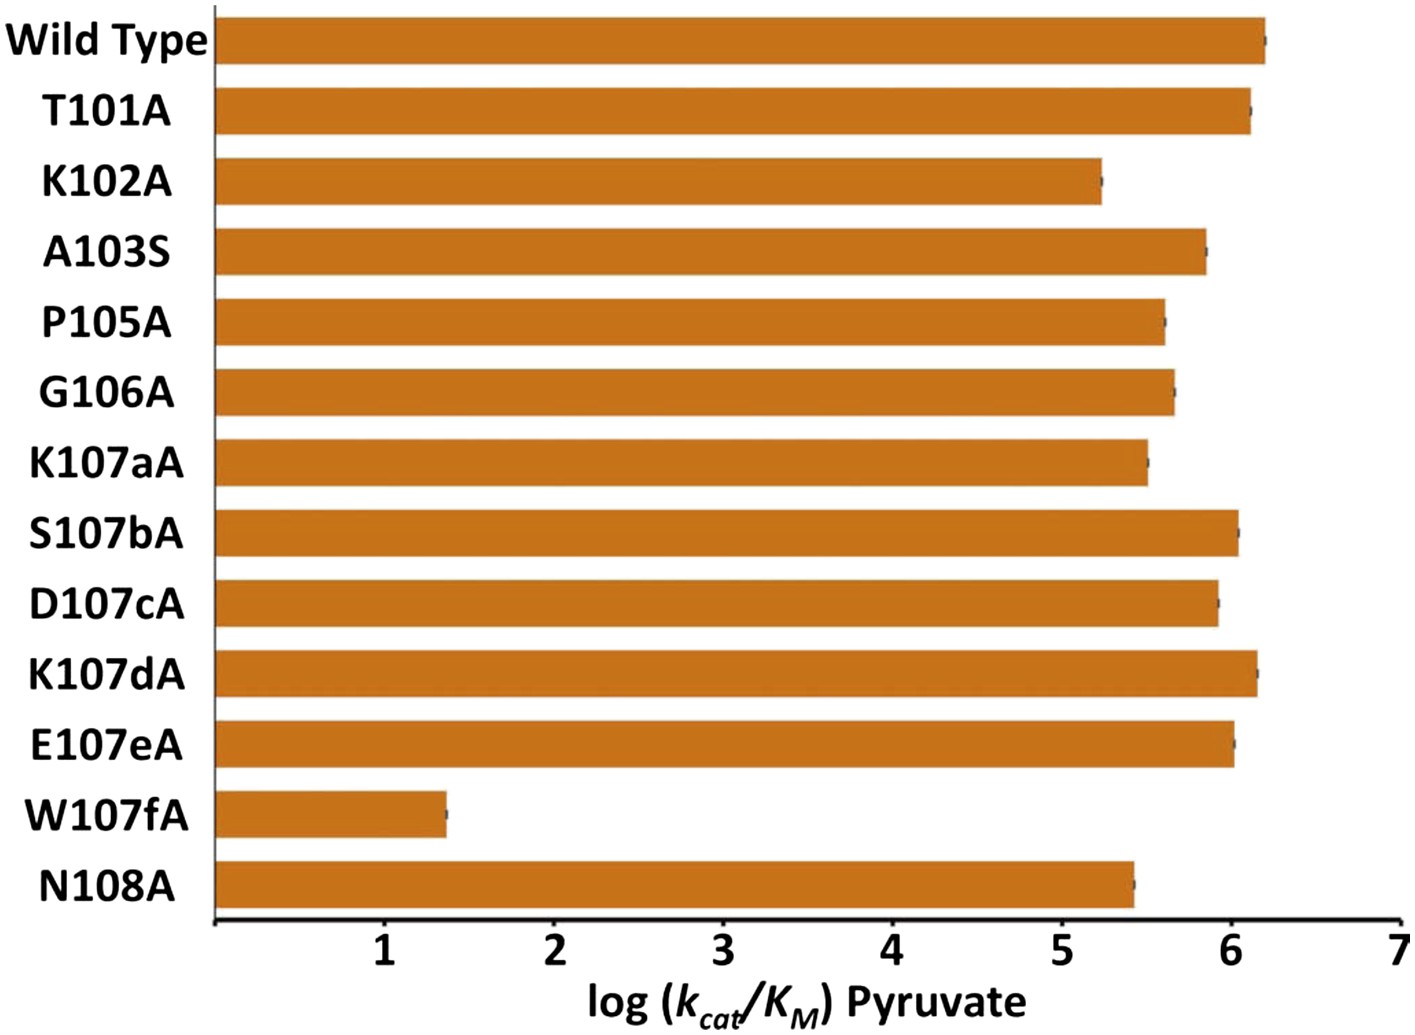
Alanine scanning of PfLDH specificity loop.
Logarithm of pyruvate kcat/KM of PfLDH and each mutant. Labels on x-axis describe the mutation tested in the WT PfLDH background.
-
Figure 2—figure supplement 2—source data 1
Kinetic parameters for PfLDH alanine-scan.
- https://doi.org/10.7554/eLife.02304.008
Figure 2—figure supplement 3
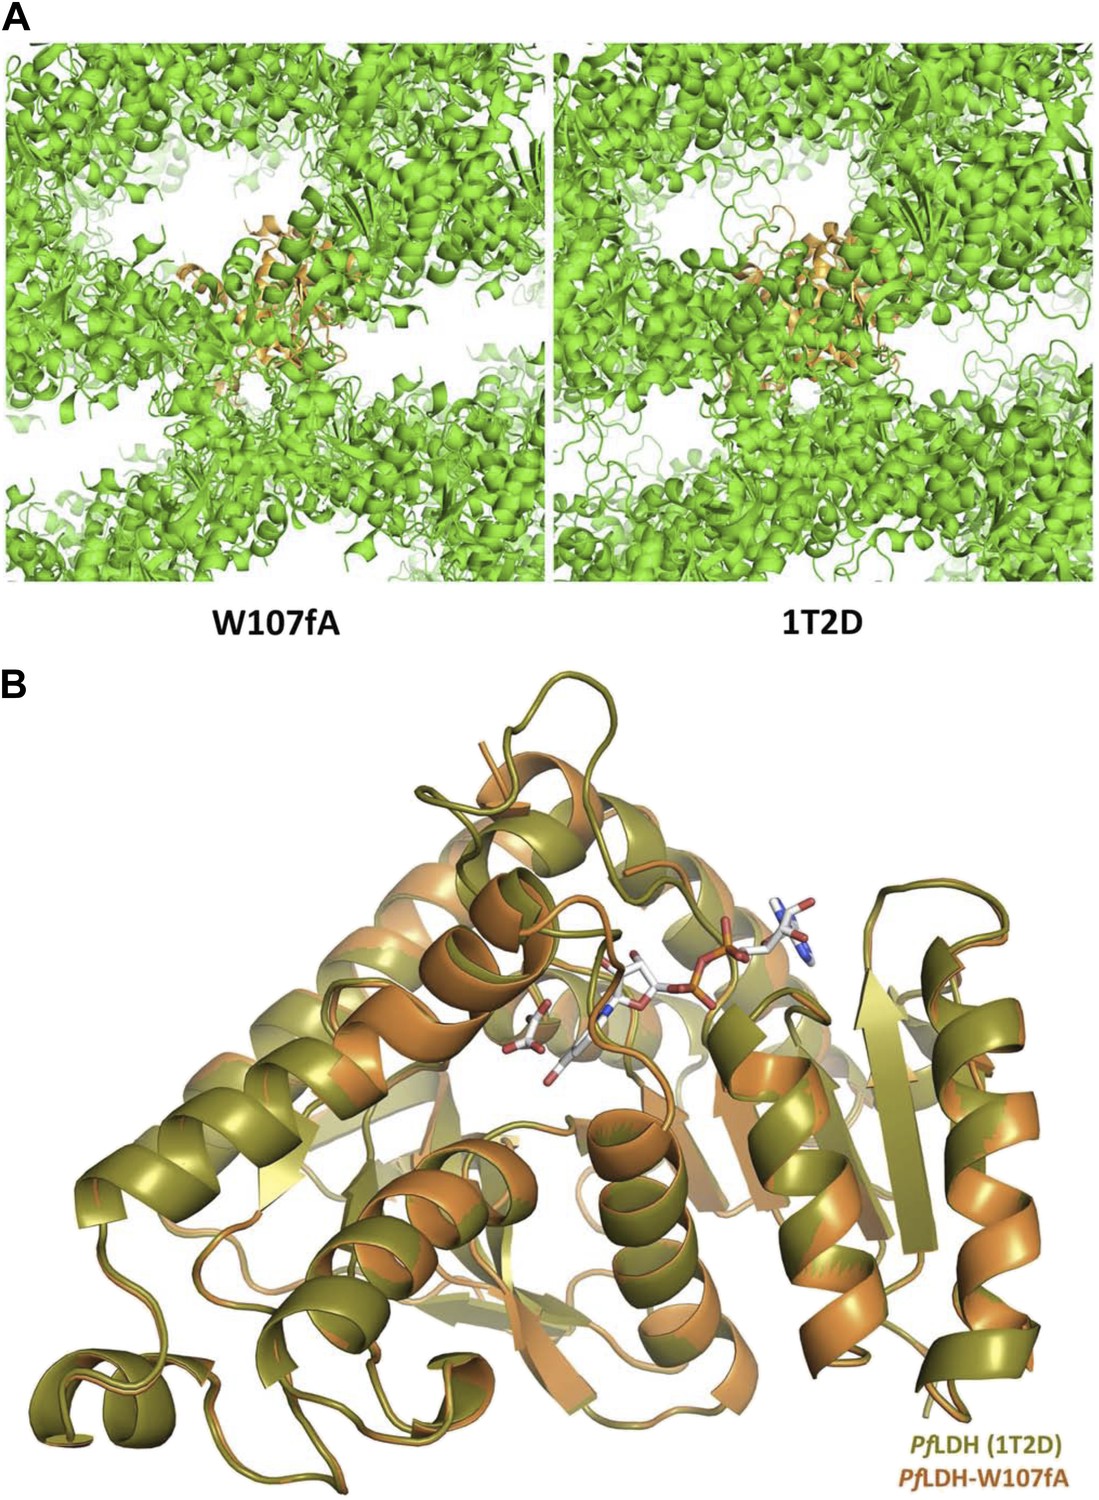
Crystal structure of PfLDH-W107fA mutant.
(A) Crystal lattice of the W107fA mutant (left) compared to the WT PfLDH (right). (B) Superposition of the WT PfLDH (olive) and the W107fA mutant (vermilion). The structures are highly similar throughout, expect for the active site loop (at top), which is closed in the WT and partially disordered and open in the mutant.
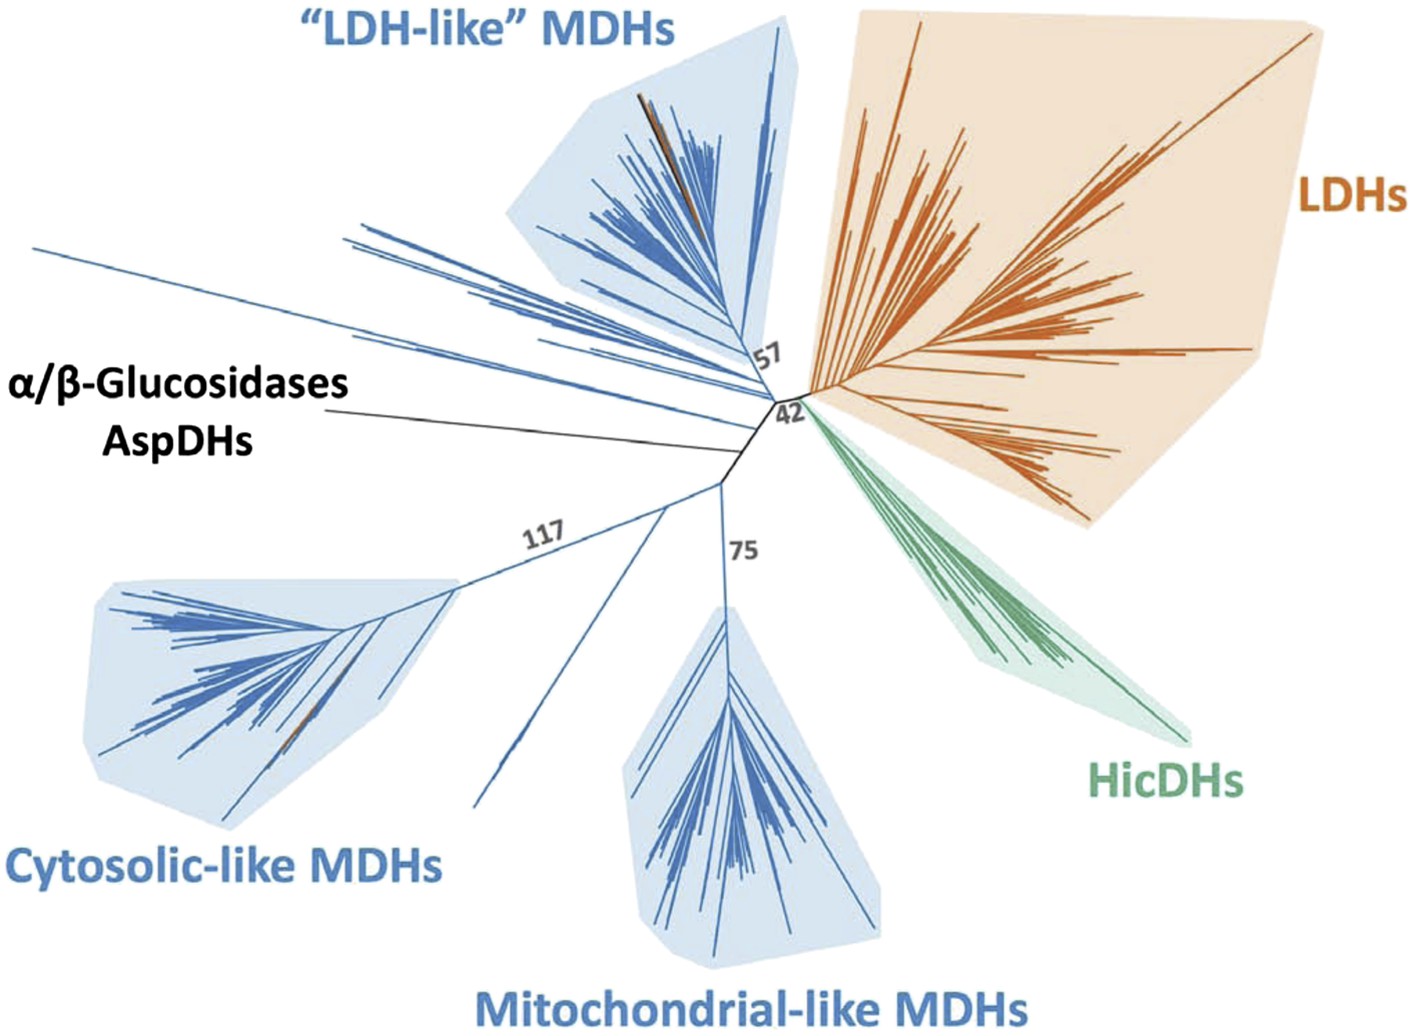
Figure 3 with 3 supplements

Phylogeny of apicomplexan M/LDH superfamily.
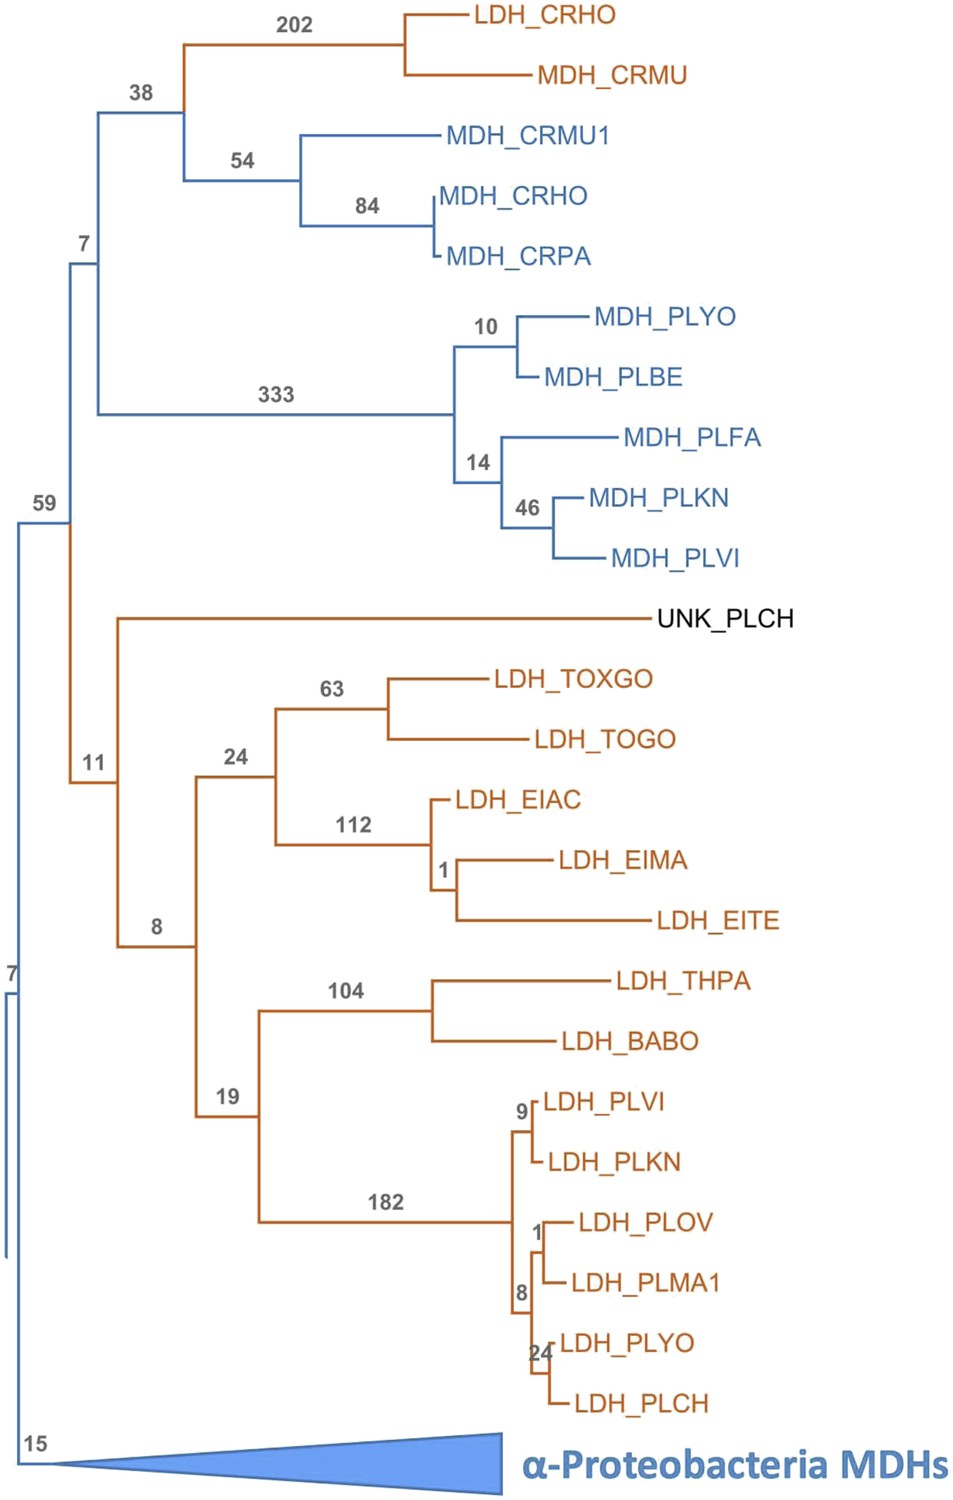
(A) 1844 taxa. The tree is colored according to function (LDH—vermilion; MDH—blue; HicDH—moss). The N-terminal Rossmann-fold of glucosidases and aspartate dehydrogenases (AspDHs) was used to root the phylogeny. Numbers highlight convergent events of LDH evolution from MDHs: 1–Canonical LDHs, 2–Trichomonad LDHs, and 3,4–apicomplexan LDHs. The shaded clades have highly significant supports (Anisimova and Gascuel, 2006). (B) Apicomplexan M/LDH Clade. A close-up of the apicomplexan portion of the phylogeny in A, similarly colored by function. aLRT supports for each group: α-proteobacteria MDHs, 15; apicomplexan LDHs, 11; Plasmodium LDHs, 333; Cryptosporidium MDHs, 54; Cryptosporidium LDHs, 202. Ancestral reconstructed proteins are labeled at internal nodes (AncMDH1, AncMDH2, AncMDH3, AncLDH). The focus of the present work is the gene duplication at node 3.
Figure 3—figure supplement 1
Phylogeny of M/LDH superfamily.
Same phylogeny as Figure 3A with select branch supports shown (aLRT supports).
Figure 3—figure supplement 2

Phylogeny of M/LDH superfamily.
Same phylogeny as Figure 3A. The tree is colored by domain of life (eubacterial—vermilion; eukaryotic—blue; archeal—magenta).
Figure 3—figure supplement 3
Apicomplexan M/LDH Clade.
Same phylogeny as Figure 3B with aLRT branch supports and clades shown in full detail.
Figure 4
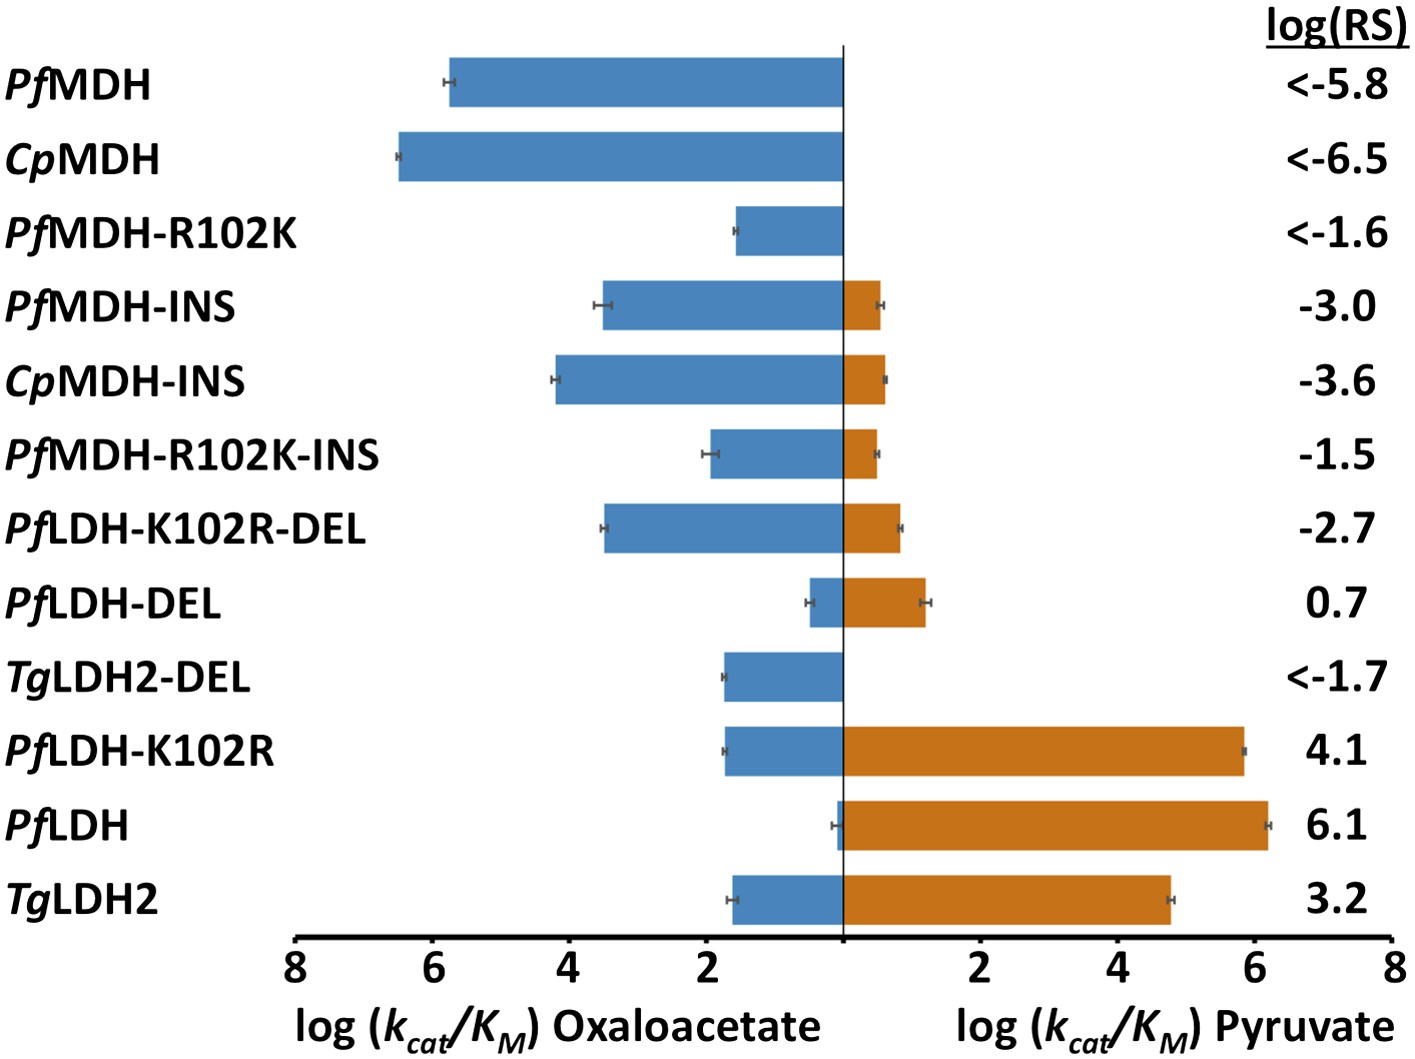
Specificity switching in apicomplexan M/LDHs.
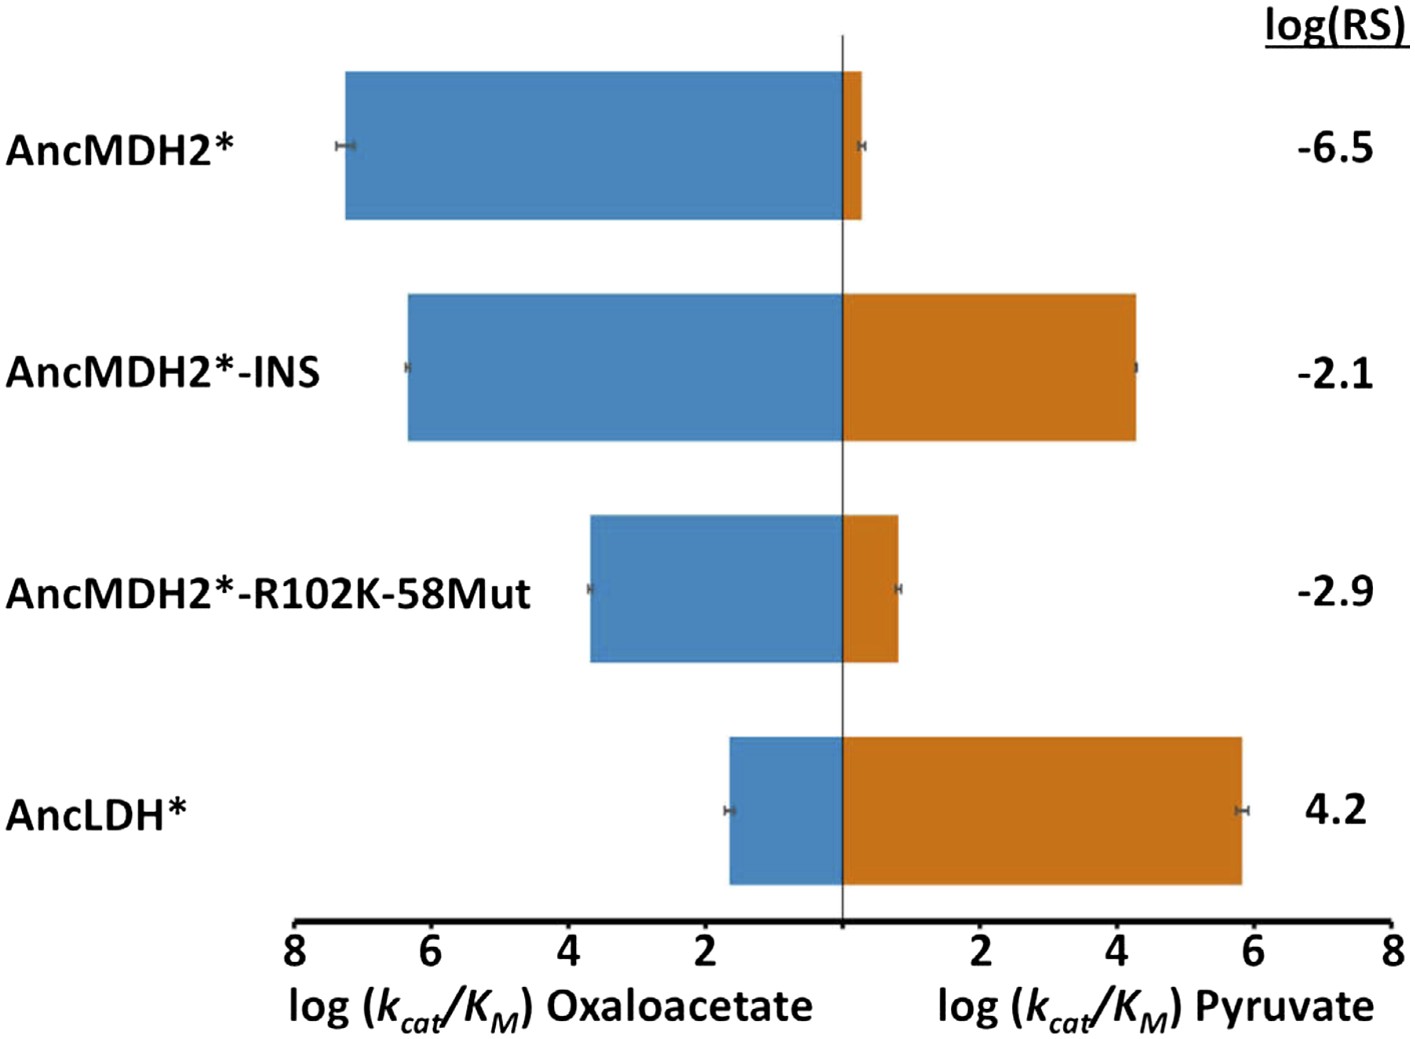
Blue horizontal bars (left) quantify activity towards oxaloacetate; vermilion horizontal bars (right) quantify activity towards pyruvate. Activity is measured as log10(kcat/KM ), where kcat/KM is in units of s-1M−1. Error bars are shown as small black brackets and represent 1 SD of the mean from triplicate measurements. INS refers to the presence of the six-residue insertion from PfLDH, DEL refers to the removal of the six-residue insertion. Relative specificity (RS) is the ratio of kcat/KM for pyruvate vs oxaloacetate, with positive log10(RS) representing a preference for pyruvate and negative log10(RS) representing a preference for oxaloacetate. All logarithms are base 10.
-
Figure 4—source data 1
Kinetic parameters for modern constructs.
- https://doi.org/10.7554/eLife.02304.015
Figure 5 with 1 supplement
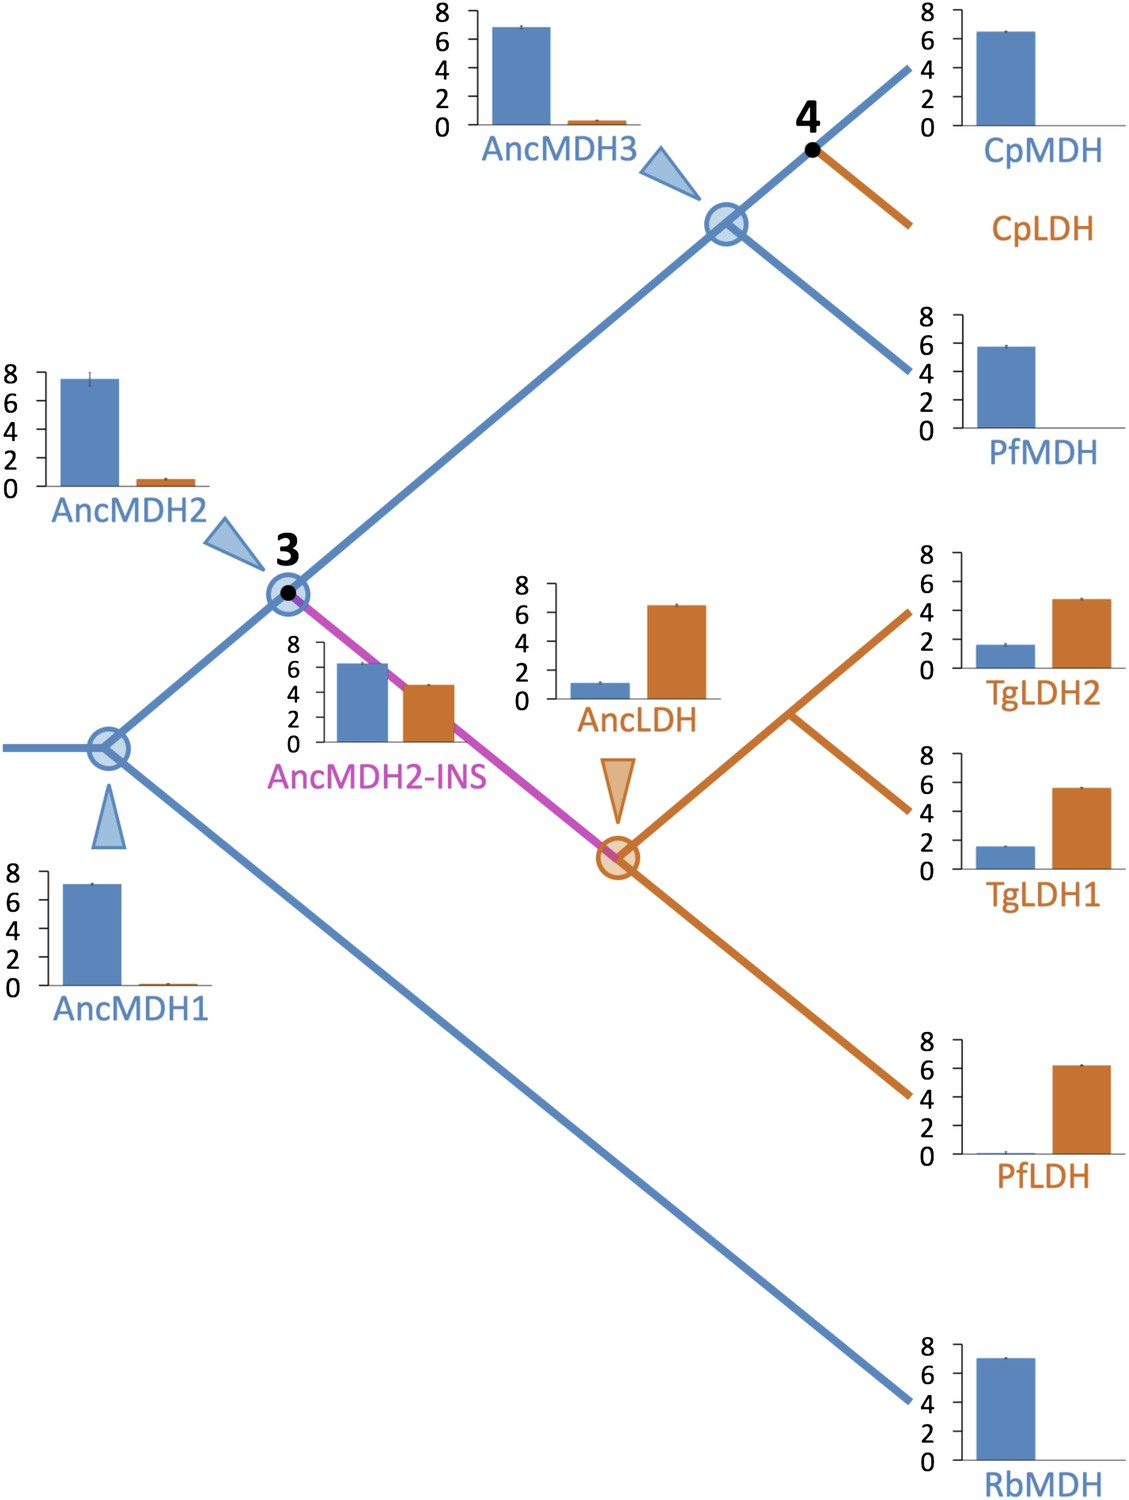
Evolution of novel LDHs in Apicomplexa.
The activities of ancestral and modern apicomplexan M/LDHs are plotted on the corresponding nodes of the protein phylogeny. Nodes are numbered as in Figure 3B. The y-axis of the bar graphs is log(kcat/KM), with oxaloacetate in blue and pyruvate in vermilion. RbMDH is a representative α-proteobacterial MDH from Rickettsia bellii. T. gondii has two LDH proteins (TgLDH1 and TgLDH2), each expressed at different stages of the life cycle (Dando et al., 2001).
-
Figure 5—source data 1
Kinetic parameters for ancestral/modern phylogeny.
- https://doi.org/10.7554/eLife.02304.017
Figure 5—figure supplement 1

Sequence identity of ancestral and modern proteins.
https://doi.org/10.7554/eLife.02304.018
Figure 6 with 7 supplements
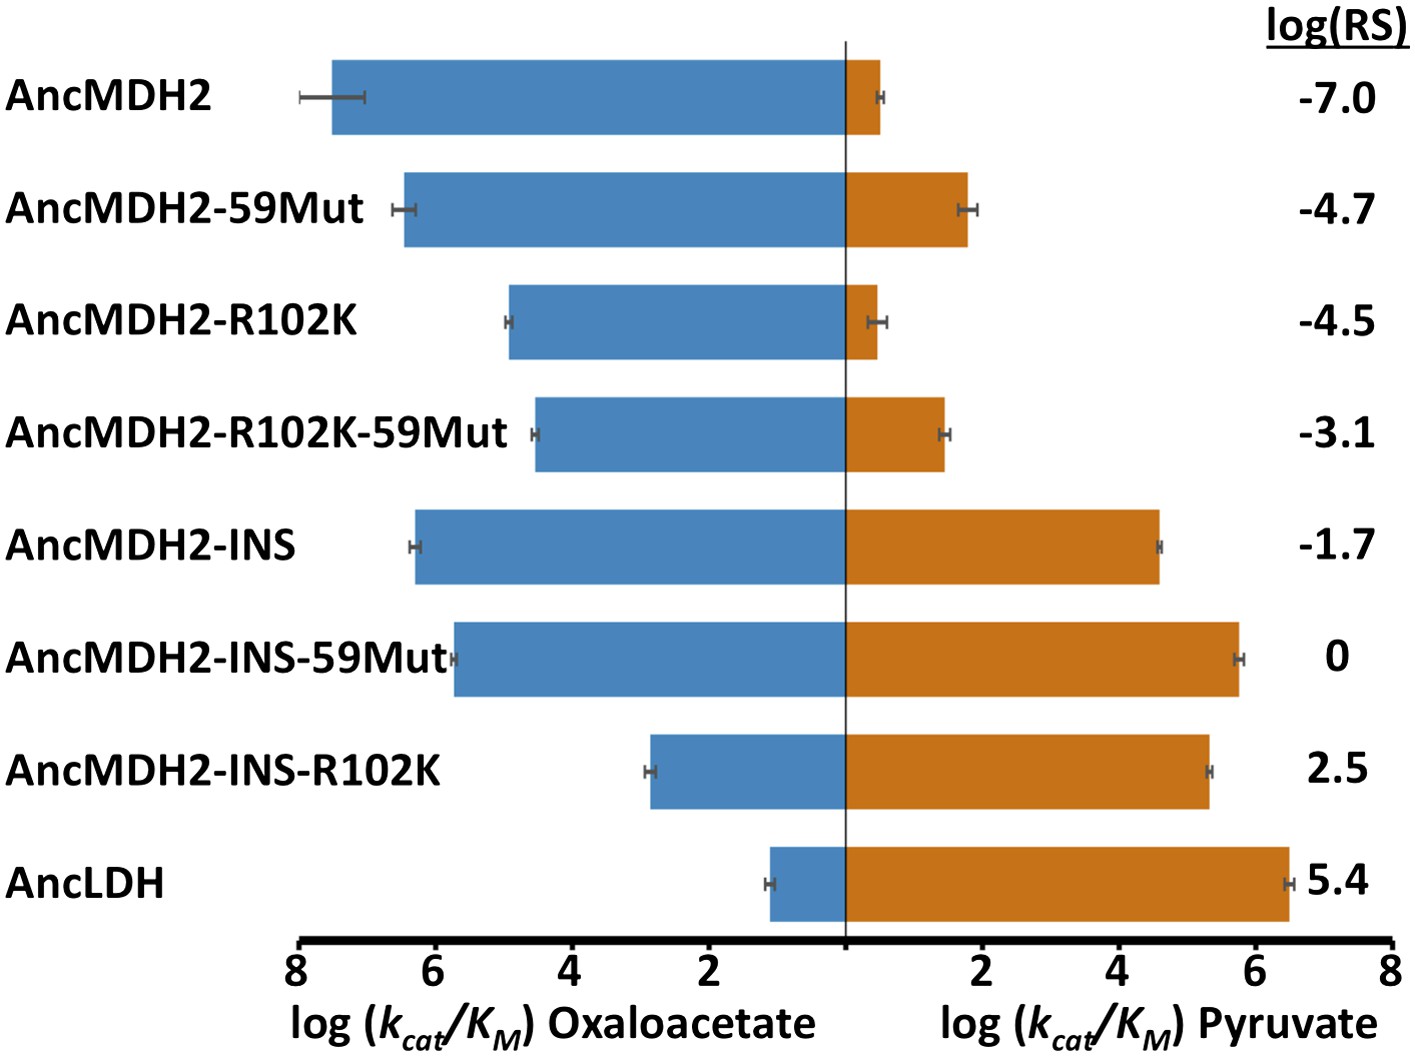
Specificity switching in ancestral MDH2.
INS refers to the reconstructed six-residue insertion from AncLDH. 59Mut is described in the text. Relative specificity (RS) is described in legend of Figure 4.
-
Figure 6—source data 1
Kinetic parameters for ancestral specificity switch mutants.
- https://doi.org/10.7554/eLife.02304.020
-
Figure 6—source data 2
Source data for figure supplement 7. Kinetic parameters for alternative ancestral proteins.
- https://doi.org/10.7554/eLife.02304.021
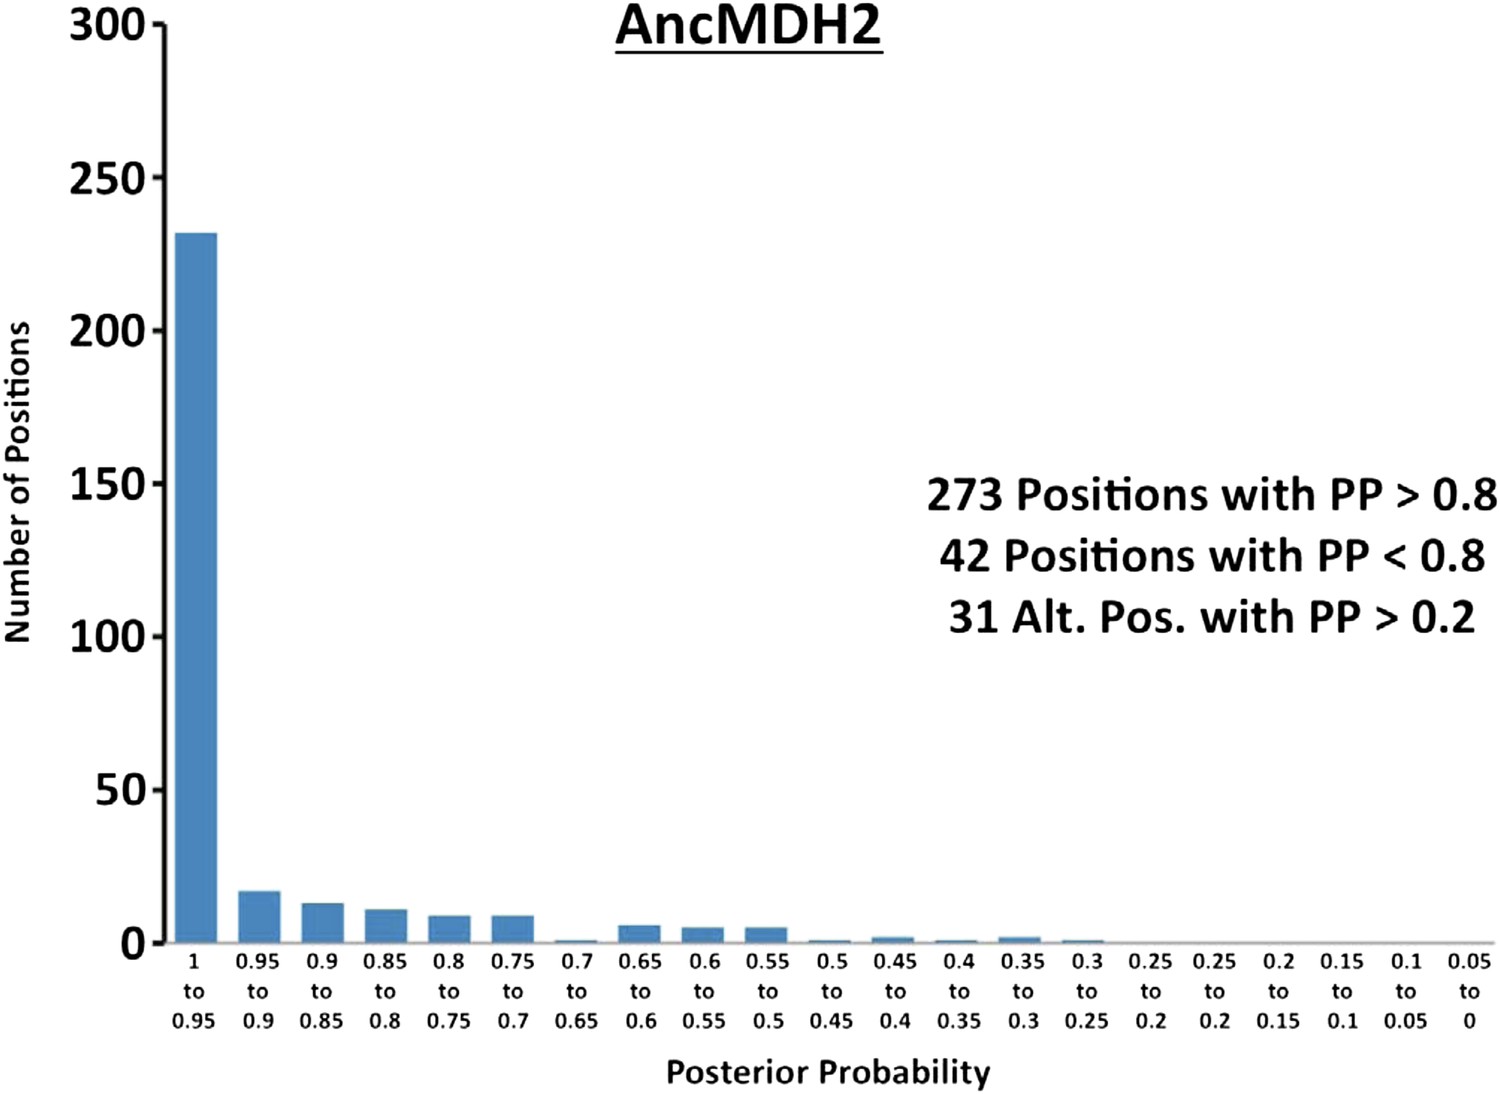
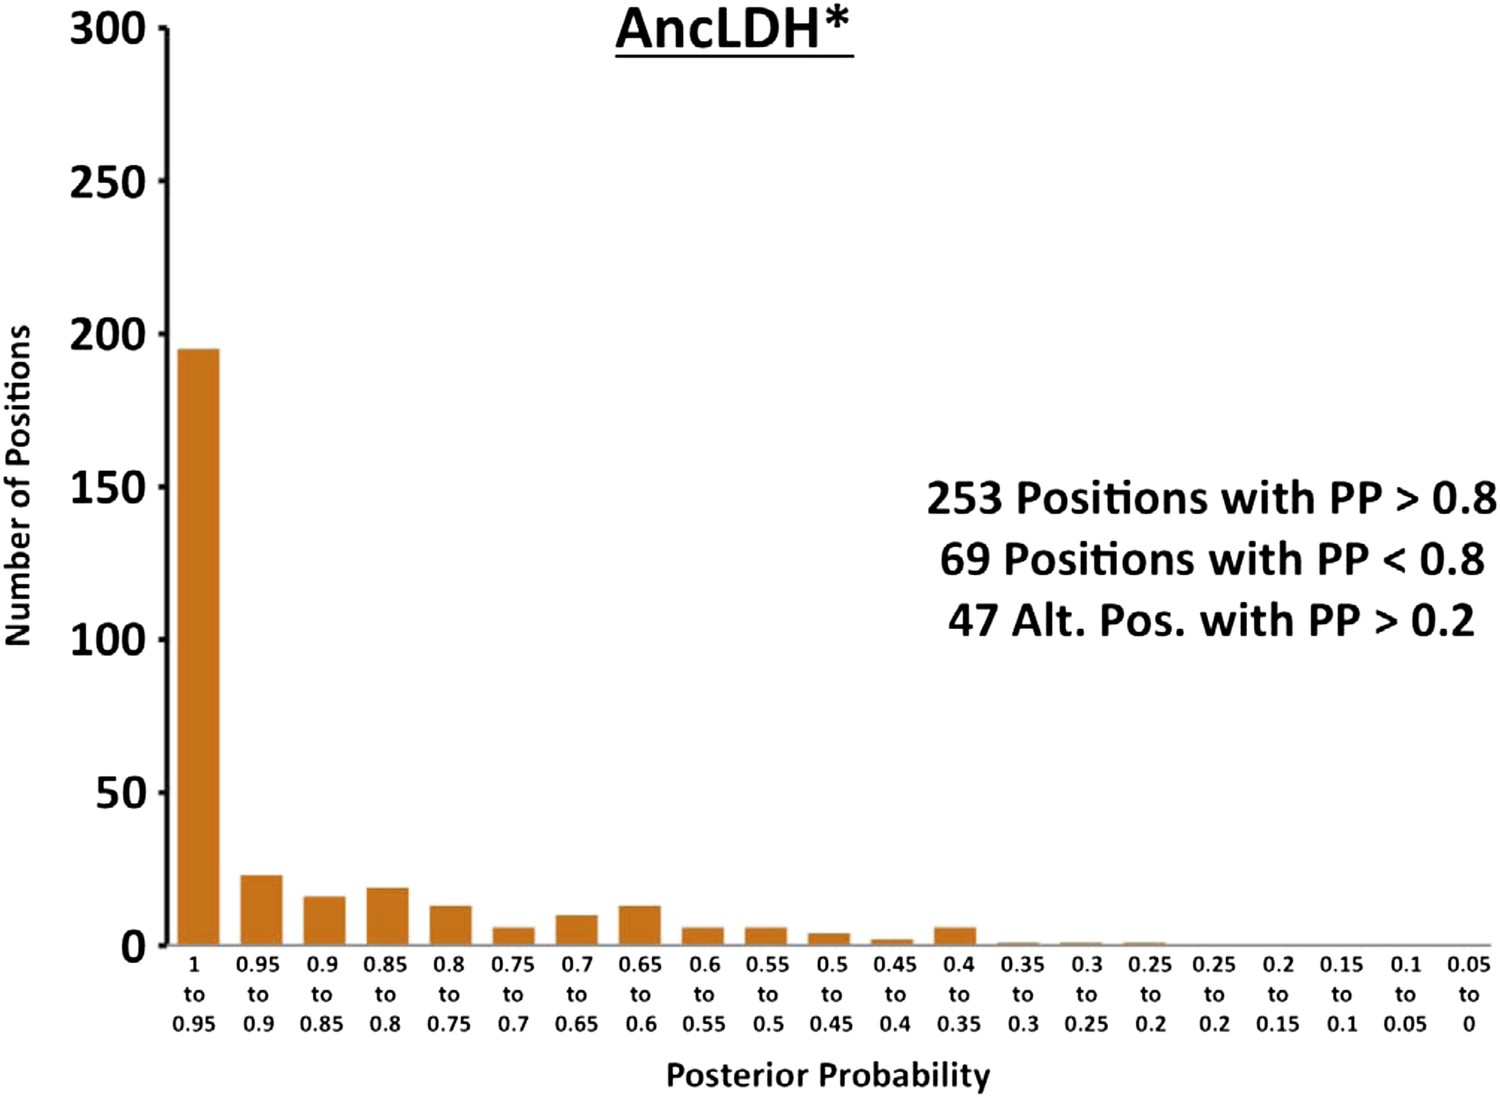
Figure 6—figure supplement 1
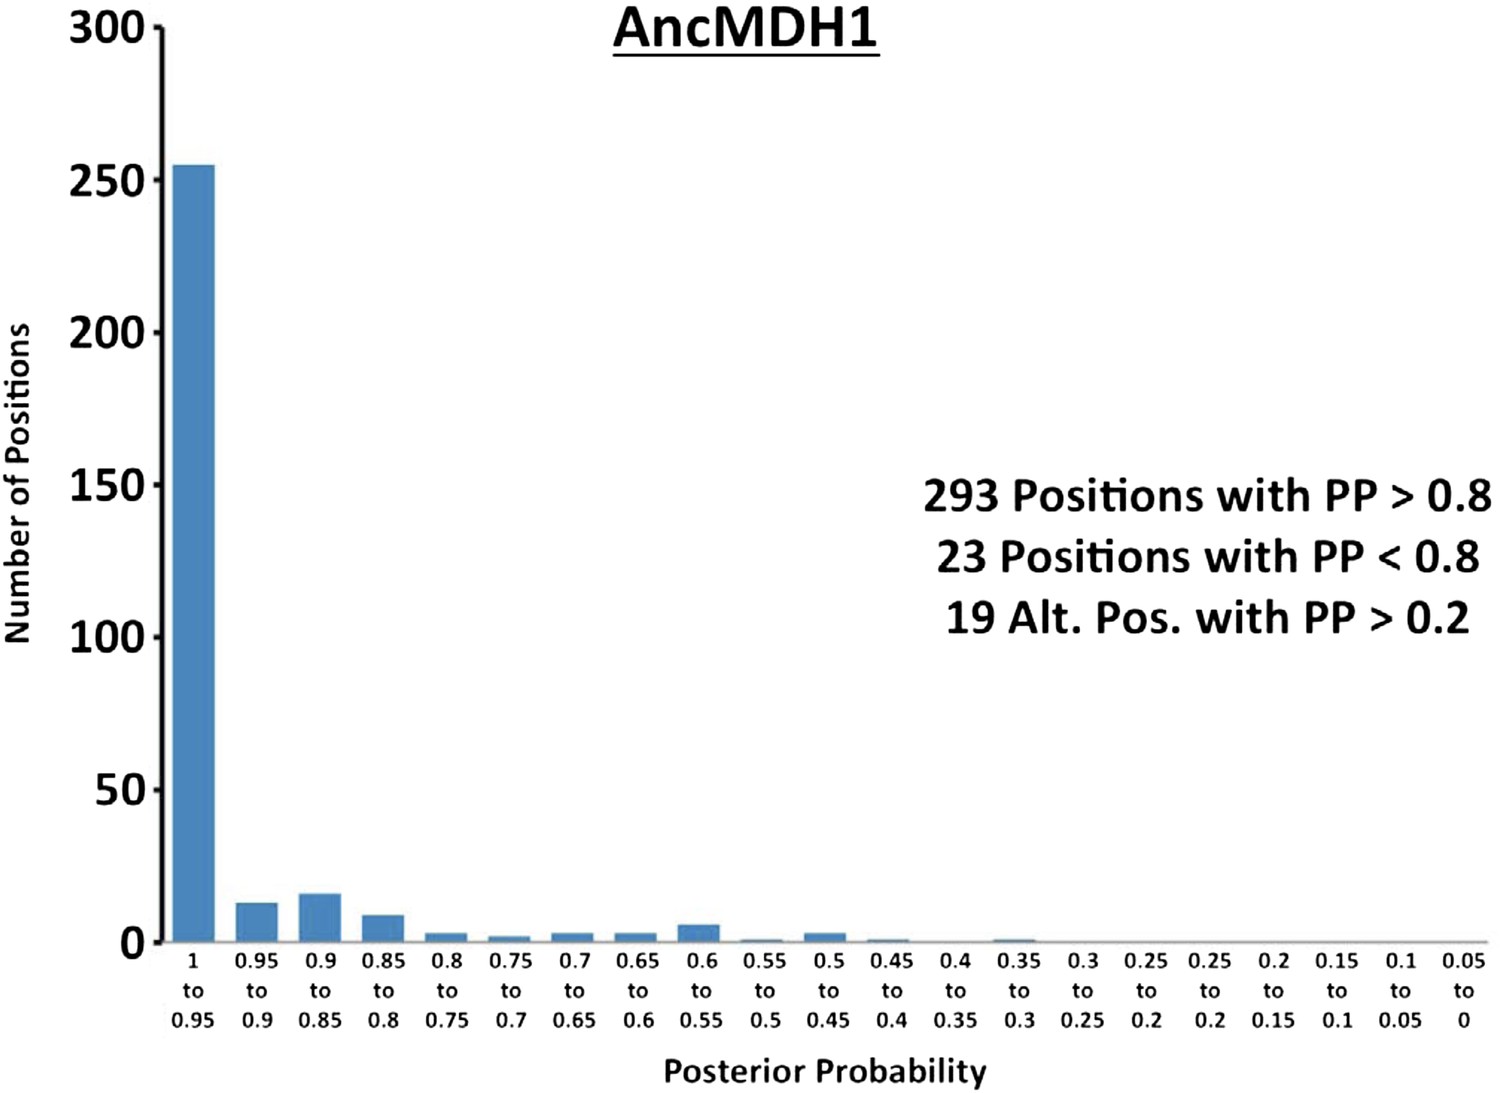
Histogram of ancestral reconstructions.
Reconstructed residues binned according to posterior probability (PP) of the predicted residue.
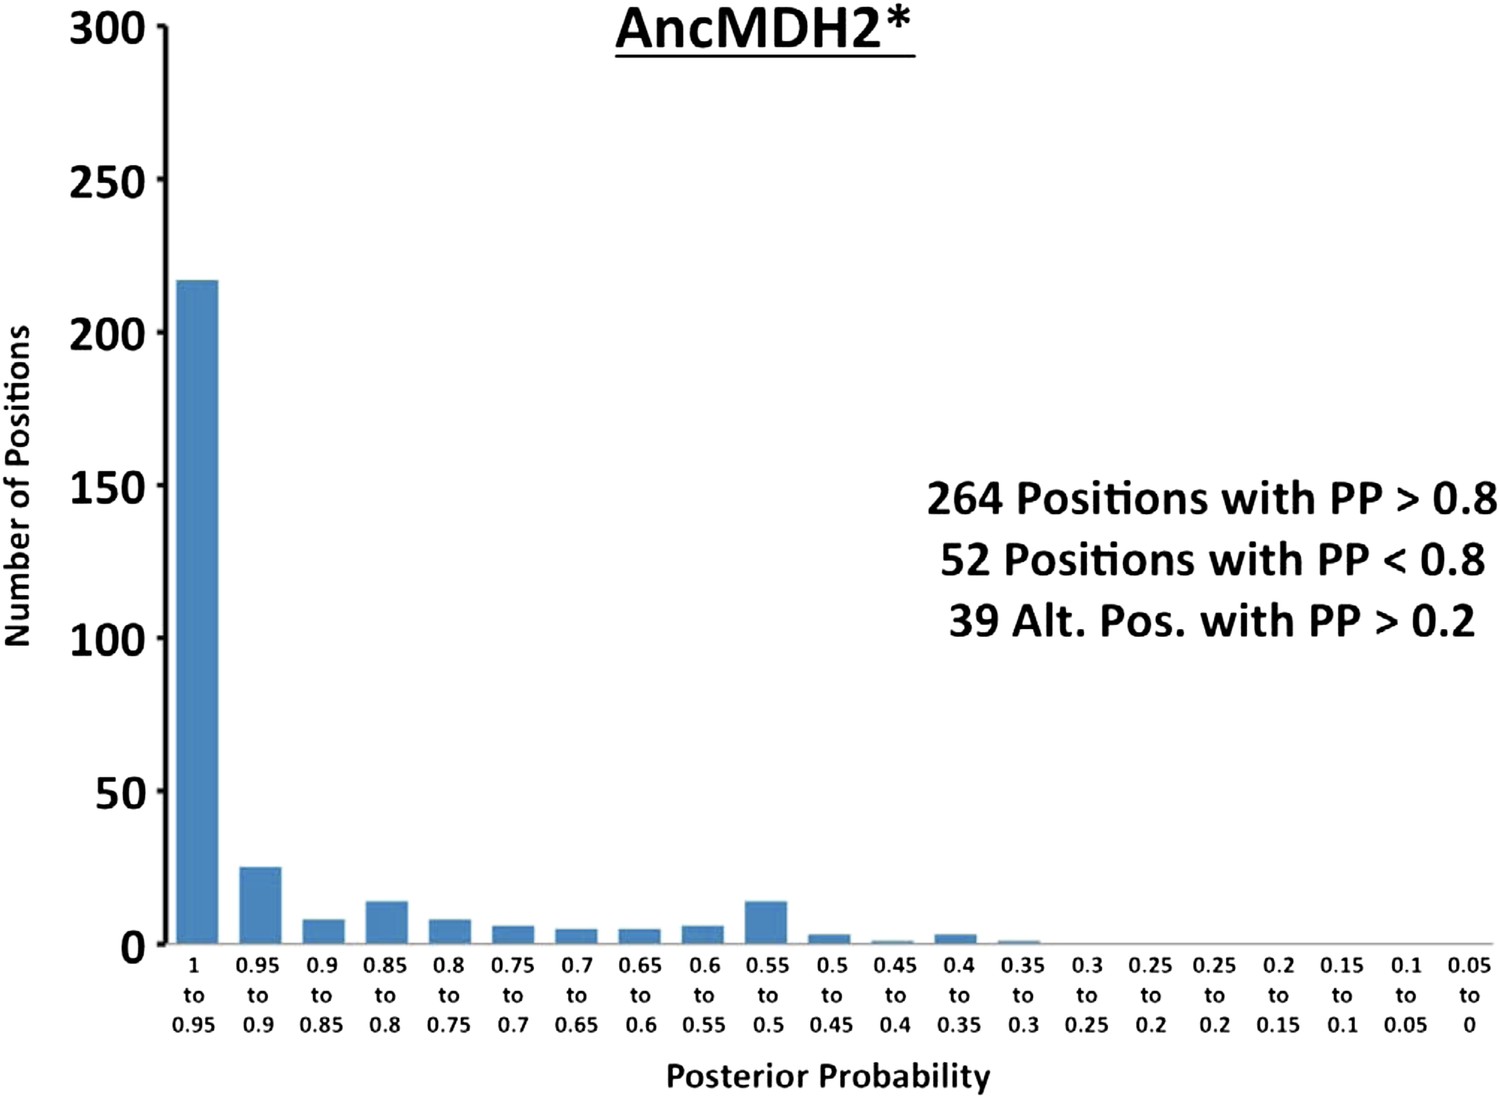
Figure 6—figure supplement 2
Histogram of ancestral reconstructions.
Reconstructed residues binned according to posterior probability (PP) of the predicted residue.
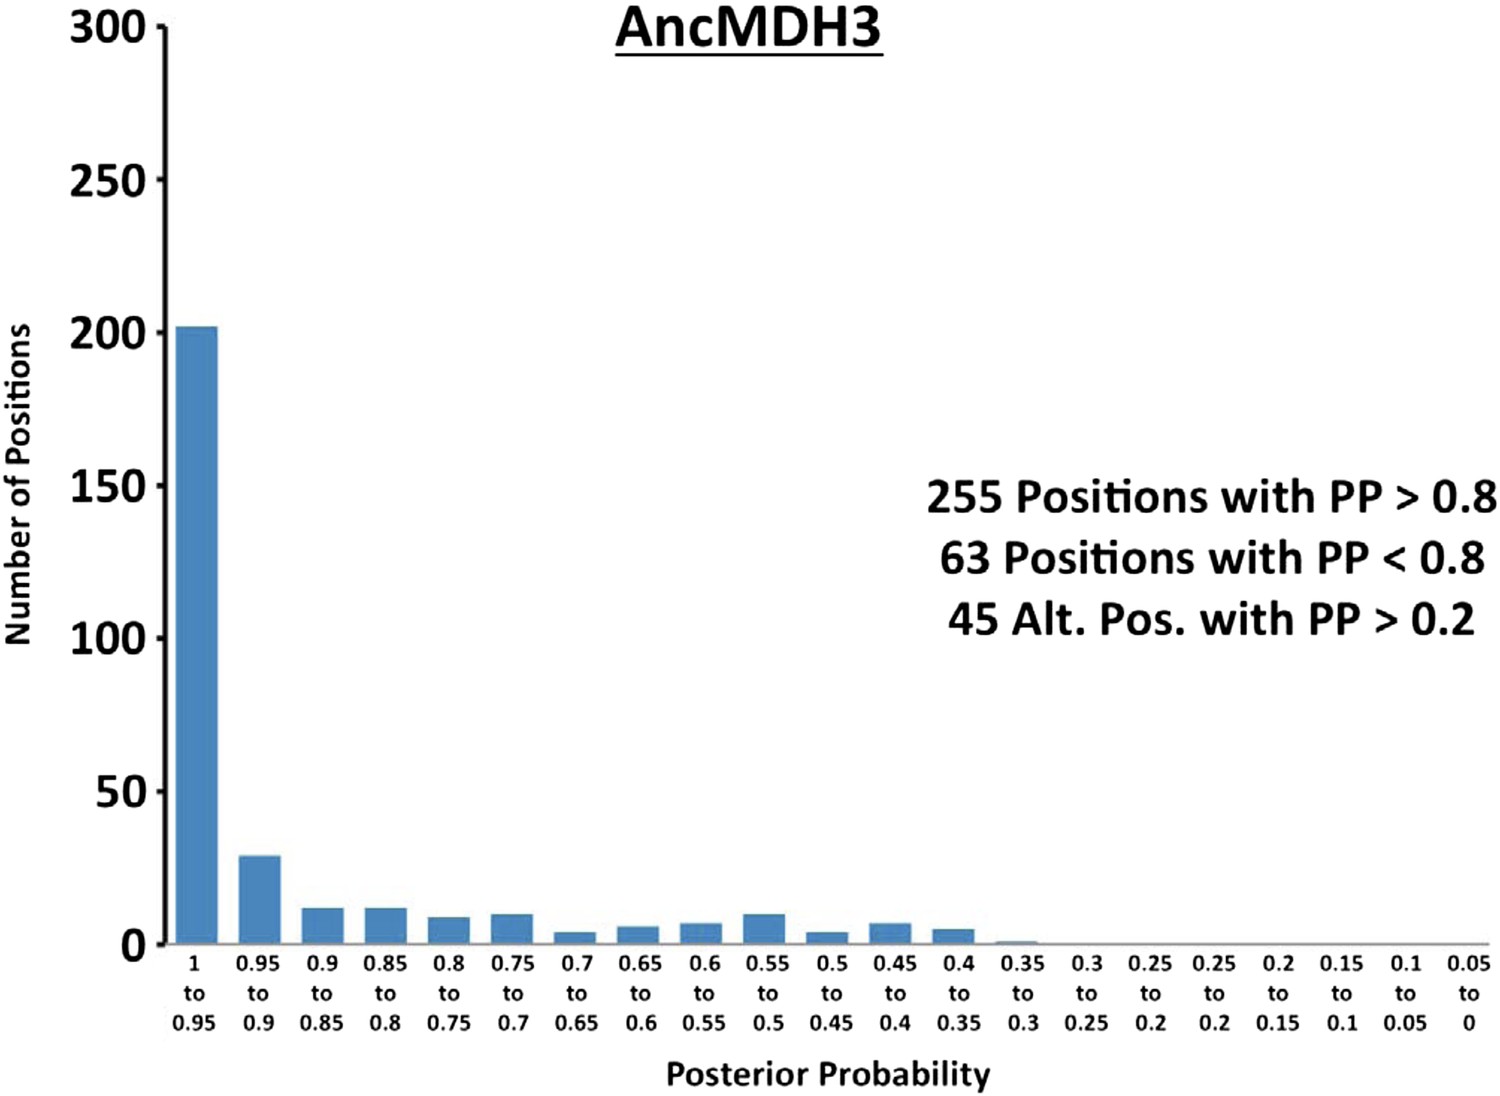
Figure 6—figure supplement 3
Histogram of ancestral reconstructions.
Reconstructed residues binned according to posterior probability (PP) of the predicted residue.
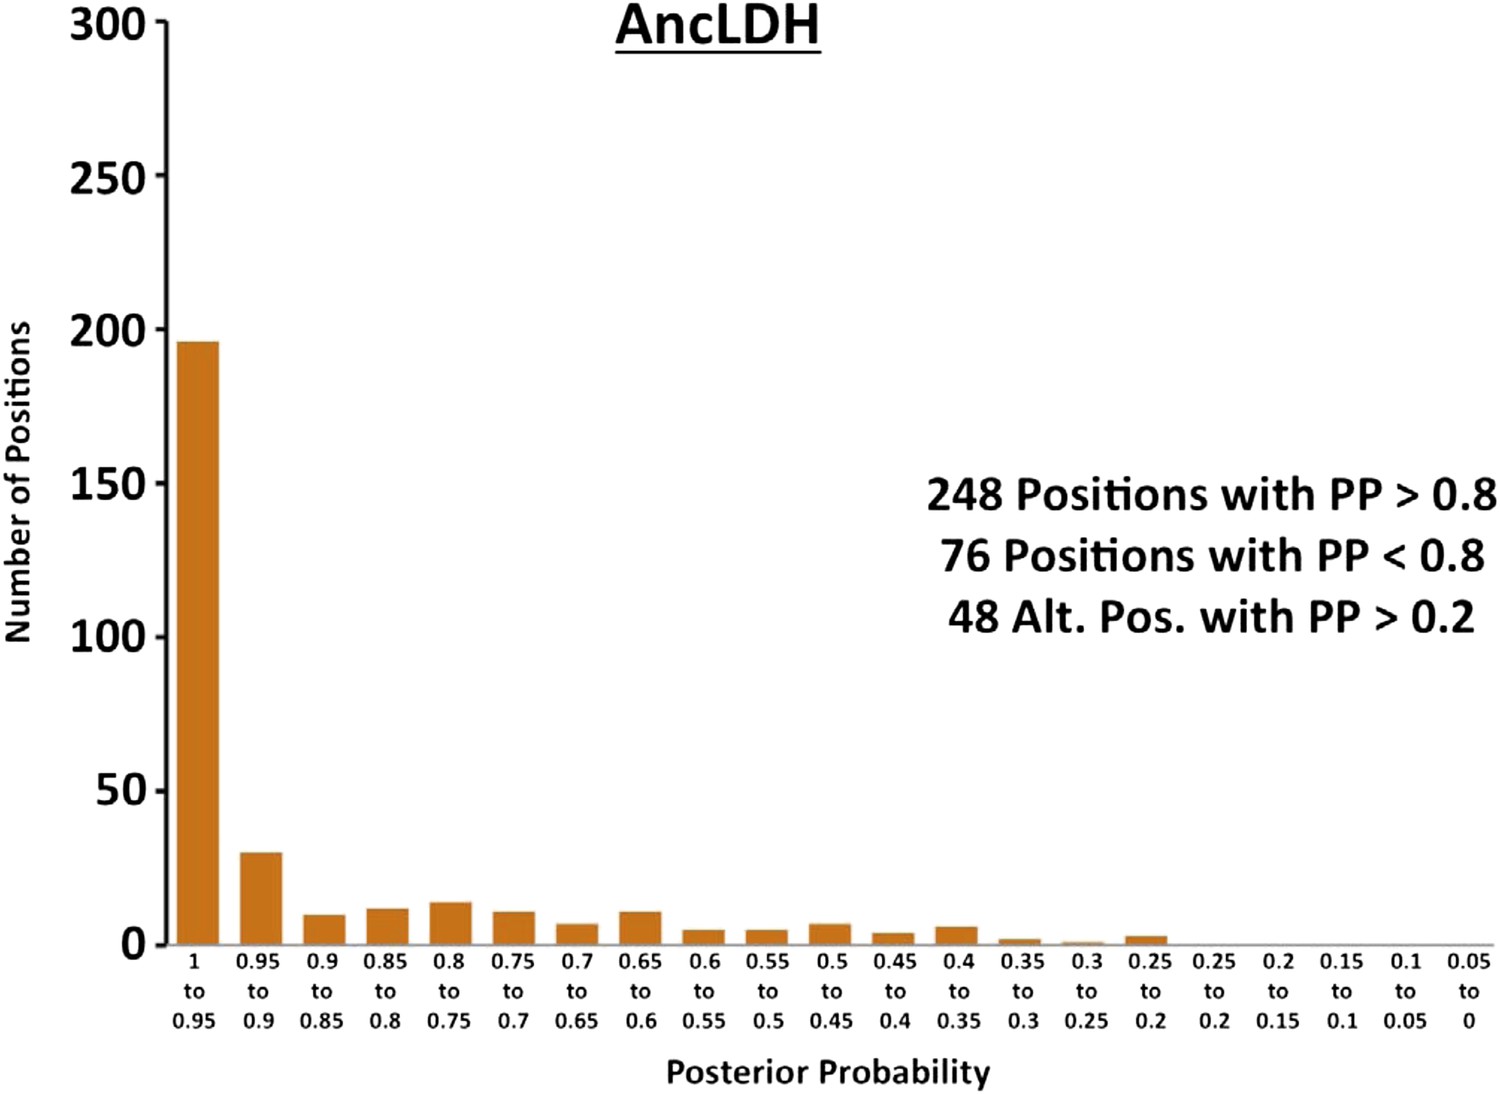
Figure 6—figure supplement 4
Histogram of ancestral reconstructions.
Reconstructed residues binned according to posterior probability (PP) of the predicted residue.
Figure 6—figure supplement 5
Histogram of ancestral reconstructions.
Reconstructed residues binned according to posterior probability (PP) of the predicted residue.
Figure 6—figure supplement 6
Histogram of ancestral reconstructions.
Reconstructed residues binned according to posterior probability (PP) of the predicted residue.
Figure 6—figure supplement 7
Alternative ancestral enzymes.
INS refers to the reconstructed six amino acid insertion from AncLDH*. 58Mut refers to remaining residue differences between AncMDH* and AncLDH* that are not R102K or INS. Relative specificity (RS) is described in legend of Figure 4.
Figure 7 with 1 supplement

Ancestral and modern dehydrogenase structures.
(A) Superposition of CpMDH and AncMDH2. Superposition of AncMDH2 structure (blue, 4plw, chain C) and CpMDH (aquamarine, 2hjr, chain A). Ligands from AncMDH2 are shown in gray; ligands from CpMDH are in white. (B) Active site detail of Cp MDH and AncMDH2. Side chains of catalytic residues highlighted as sticks. (C) Superposition of apicomplexan LDHs and AncLDH*. Superposition of AncLDH* structure (vermilion, 4plg, chain A) and four apicomplexan LDHs (deep olive, PfLDH, 1t2d, chain A, Plasmodium berghei (Pb) LDH, 1oc4, chain B, TgLDH1, 1pzh, chain A, TgLDH2, 1sow, chain B). Ligands from AncLDH* are shown in gray, ligands from apicomplexan LDHs are in white. The ‘opposing loop’ and residues 236 and 246 (discussed in text) are highlighted in cyan. (D) Active site detail of apicomplexan LDHs and AncLDH*. Side chains of catalytic residues highlighted as sticks. (E) Superposition of ancestral dehydrogenases. Superposition of AncMDH2 (blue, 4plw, chain C), AncLDH* (vermilion, 4plg, chain A), and AncMDH2-INS (magenta, 4ply, chain F and 4plv, chain B). Ligands are shown in gray. (F) Active site detail of ancestral dehydrogenases. Side chains of catalytic residues highlighted as sticks.
Figure 7—figure supplement 1
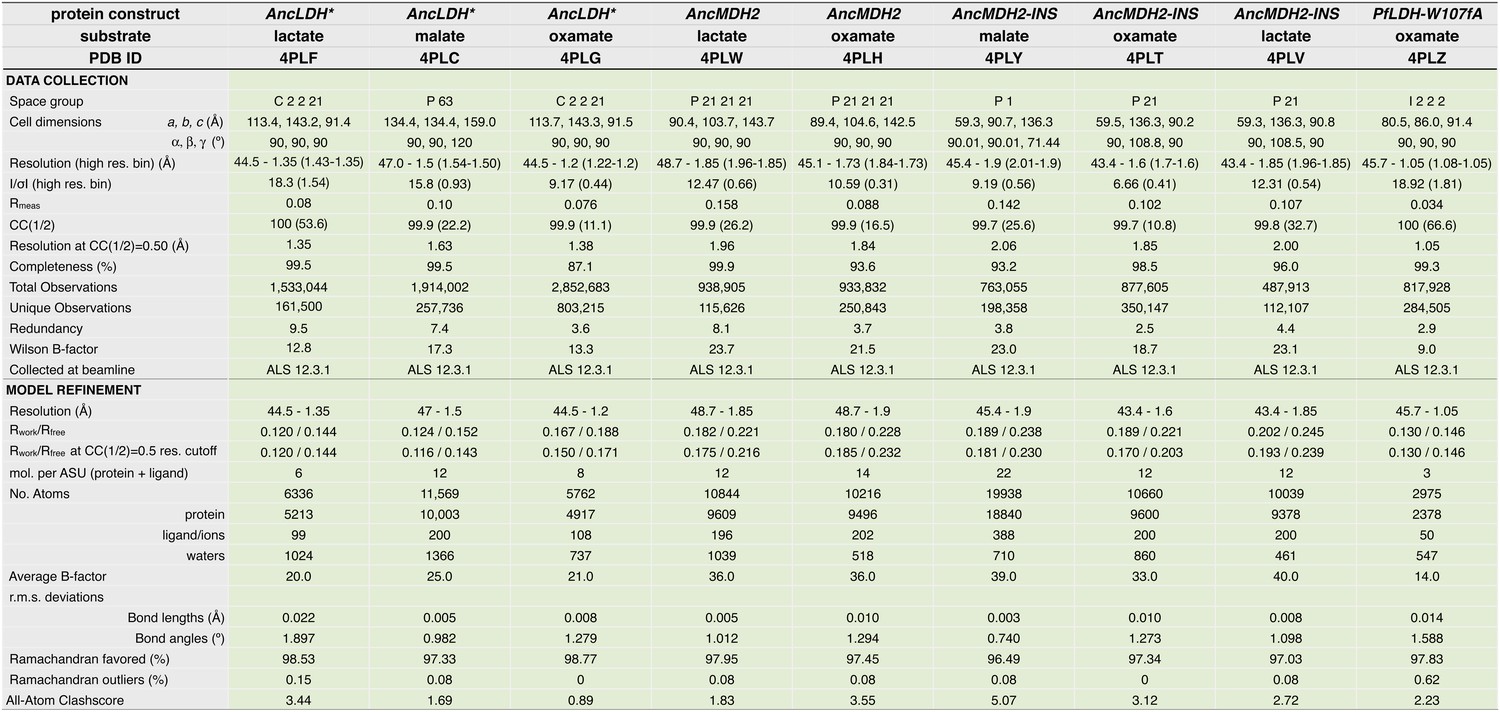
Crystallographic statistics table for AncLDH*, AncMDH2, AncMDH2-INS, and PfLDH-W107fA structures.
https://doi.org/10.7554/eLife.02304.030
Figure 8
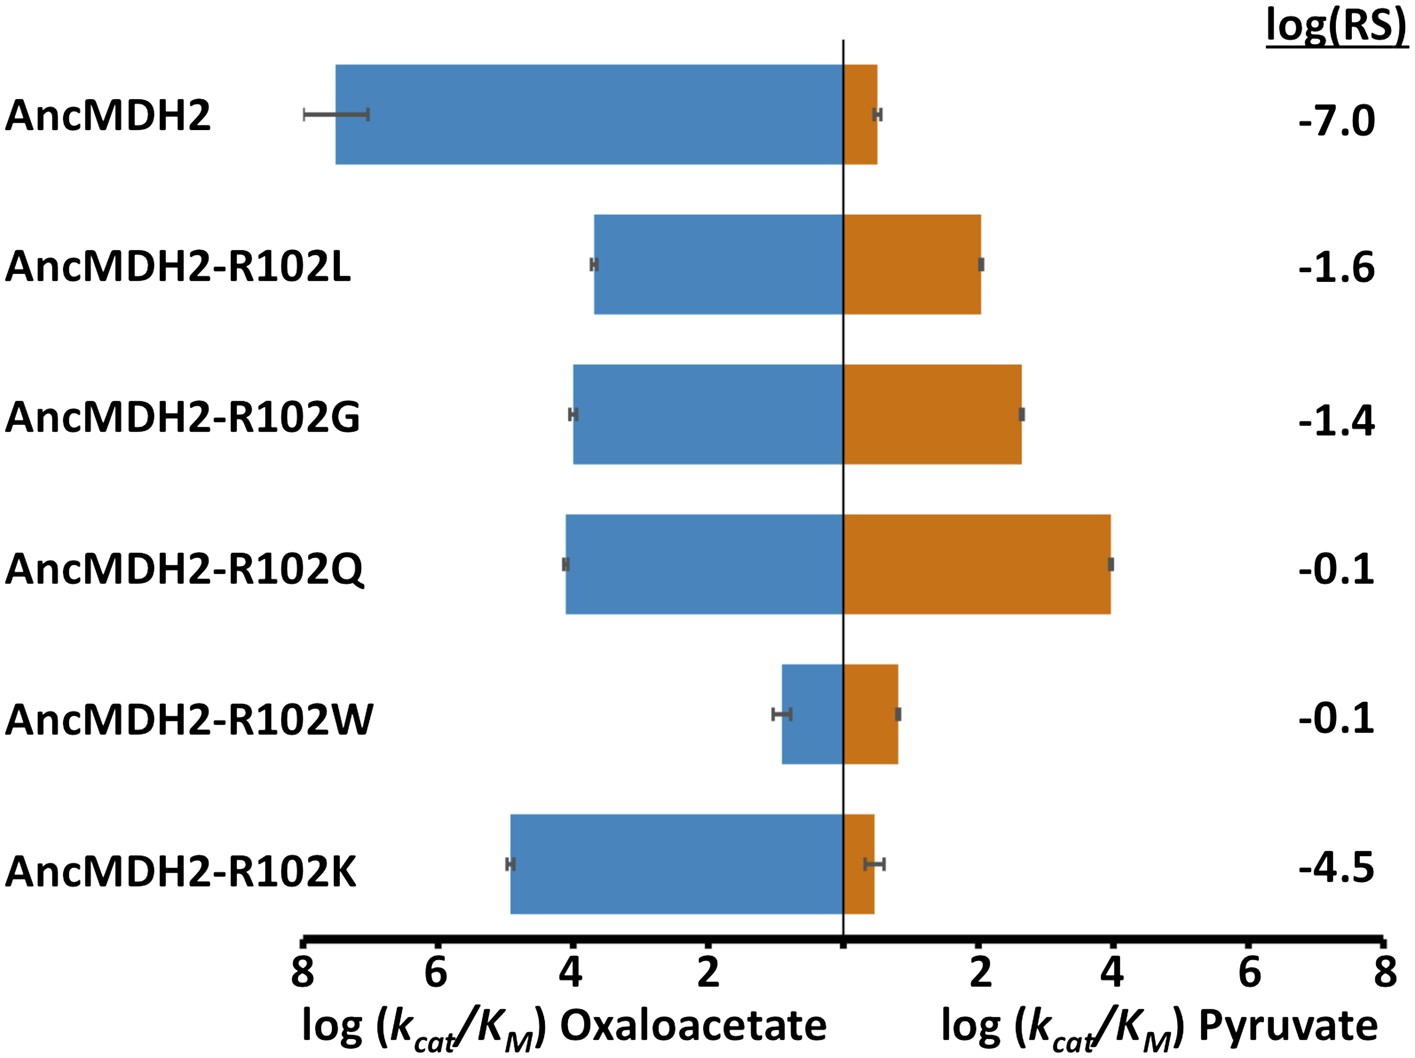
Alternative LDH mutations in AncMDH2.
Relative specificity (RS) is described in legend of Figure 4.
-
Figure 8—source data 1
Kinetic parameters for specificity residue mutants.
- https://doi.org/10.7554/eLife.02304.032
Additional files
-
Supplementary file 1
Sequences, alignments, and trees. Alignments and tree files for both the original (Figure 3) and the alternative phylogeny. Alignment for Figure 5—figure supplement 1. Ancestral FASTA files and posterior probabilities for each ancestral sequence (parsed in Figure 6—figure supplements 1–6).
- https://doi.org/10.7554/eLife.02304.033
-
Supplementary file 2
Molecular weights and extinction coefficients. ExPASy calculated molecular weights and extinction coefficients for all proteins used within this study.
- https://doi.org/10.7554/eLife.02304.034
Download links
A two-part list of links to download the article, or parts of the article, in various formats.
Downloads (link to download the article as PDF)
Open citations (links to open the citations from this article in various online reference manager services)
Cite this article (links to download the citations from this article in formats compatible with various reference manager tools)
An atomic-resolution view of neofunctionalization in the evolution of apicomplexan lactate dehydrogenases
eLife 3:e02304.
https://doi.org/10.7554/eLife.02304


