Genome-wide dynamics of Pol II elongation and its interplay with promoter proximal pausing, chromatin, and exons
- Cornell University, United States
- University of Michigan, United States
Figures
Figure 1 with 2 supplements
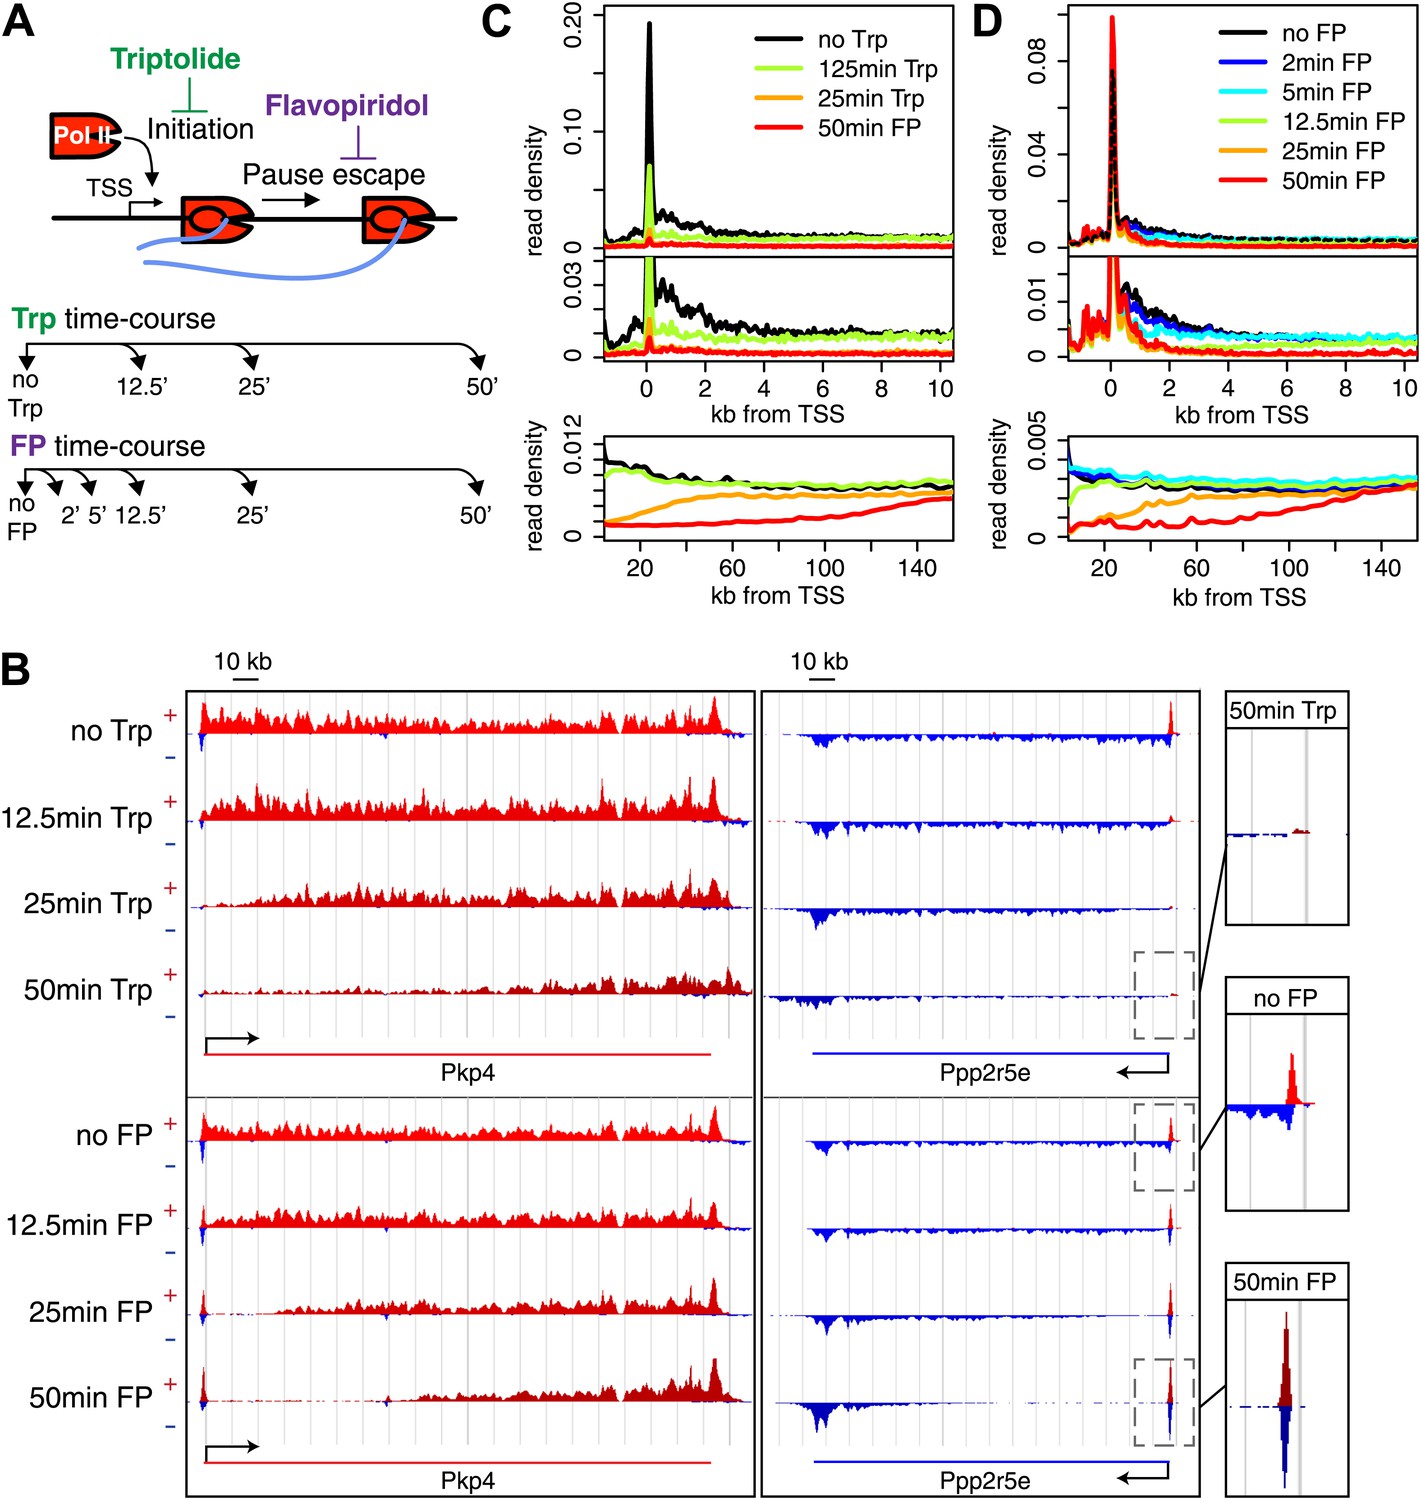
Timed inhibition of pause escape (P-TEFb) or initiation (TFIIH) has similar effects on the gene body Pol II distribution, but opposite effect at the promoter-proximal region.
(A) Experimental set-up, 300 nM flavopiridol (FP) and 500 nM of triptolide (Trp) were used to block pause escape or transcription initiation in mES cells. Nuclei were isolated for GRO-seq at timepoints after treatment as specified. (B) Screenshot of genes Pkp4 and Ppp2r5e with or without Trp or FP treatment for 12.5, 25 or 50 min, with sense reads in red and antisense reads in blue. (C) Composite profile of GRO-seq read density of all genes >12.5 kb (top panel) or >150 kb (bottom panel) after treatment with Trp for various durations of time. The middle panel is a zoom-in of the top panel. The bottom panel shows the region downstream of the TSS for genes longer than 150 kb. (D) As (C), but after timed treatment with FP.
-
Figure 1—source data 1
Sequencing and alignment of GRO-seq replicates in the Trp and FP time courses.
The top tables depict the total reads sequenced, and the alignment to the spike-in controls, ribosomal, reference genomes for each replicate. One of the 25 min Trp replicates was of poor quality due to RNA degradation during the library preparation and wasn’t included in further analysis.
- https://doi.org/10.7554/eLife.02407.006
-
Figure 1—source data 2
Pearson correlation of GRO-seq replicates in the Trp and FP time courses.
Pearson correlations between the replicates for each time course after drug treatment in either the gene body or promoter regions.
- https://doi.org/10.7554/eLife.02407.007
-
Figure 1—source data 3
Spearman correlation of GRO-seq replicates in the Trp and FP time courses.
Spearman correlations between the replicates for each time course after drug treatment in either the gene body or promoter regions.
- https://doi.org/10.7554/eLife.02407.008
Figure 1—figure supplement 1
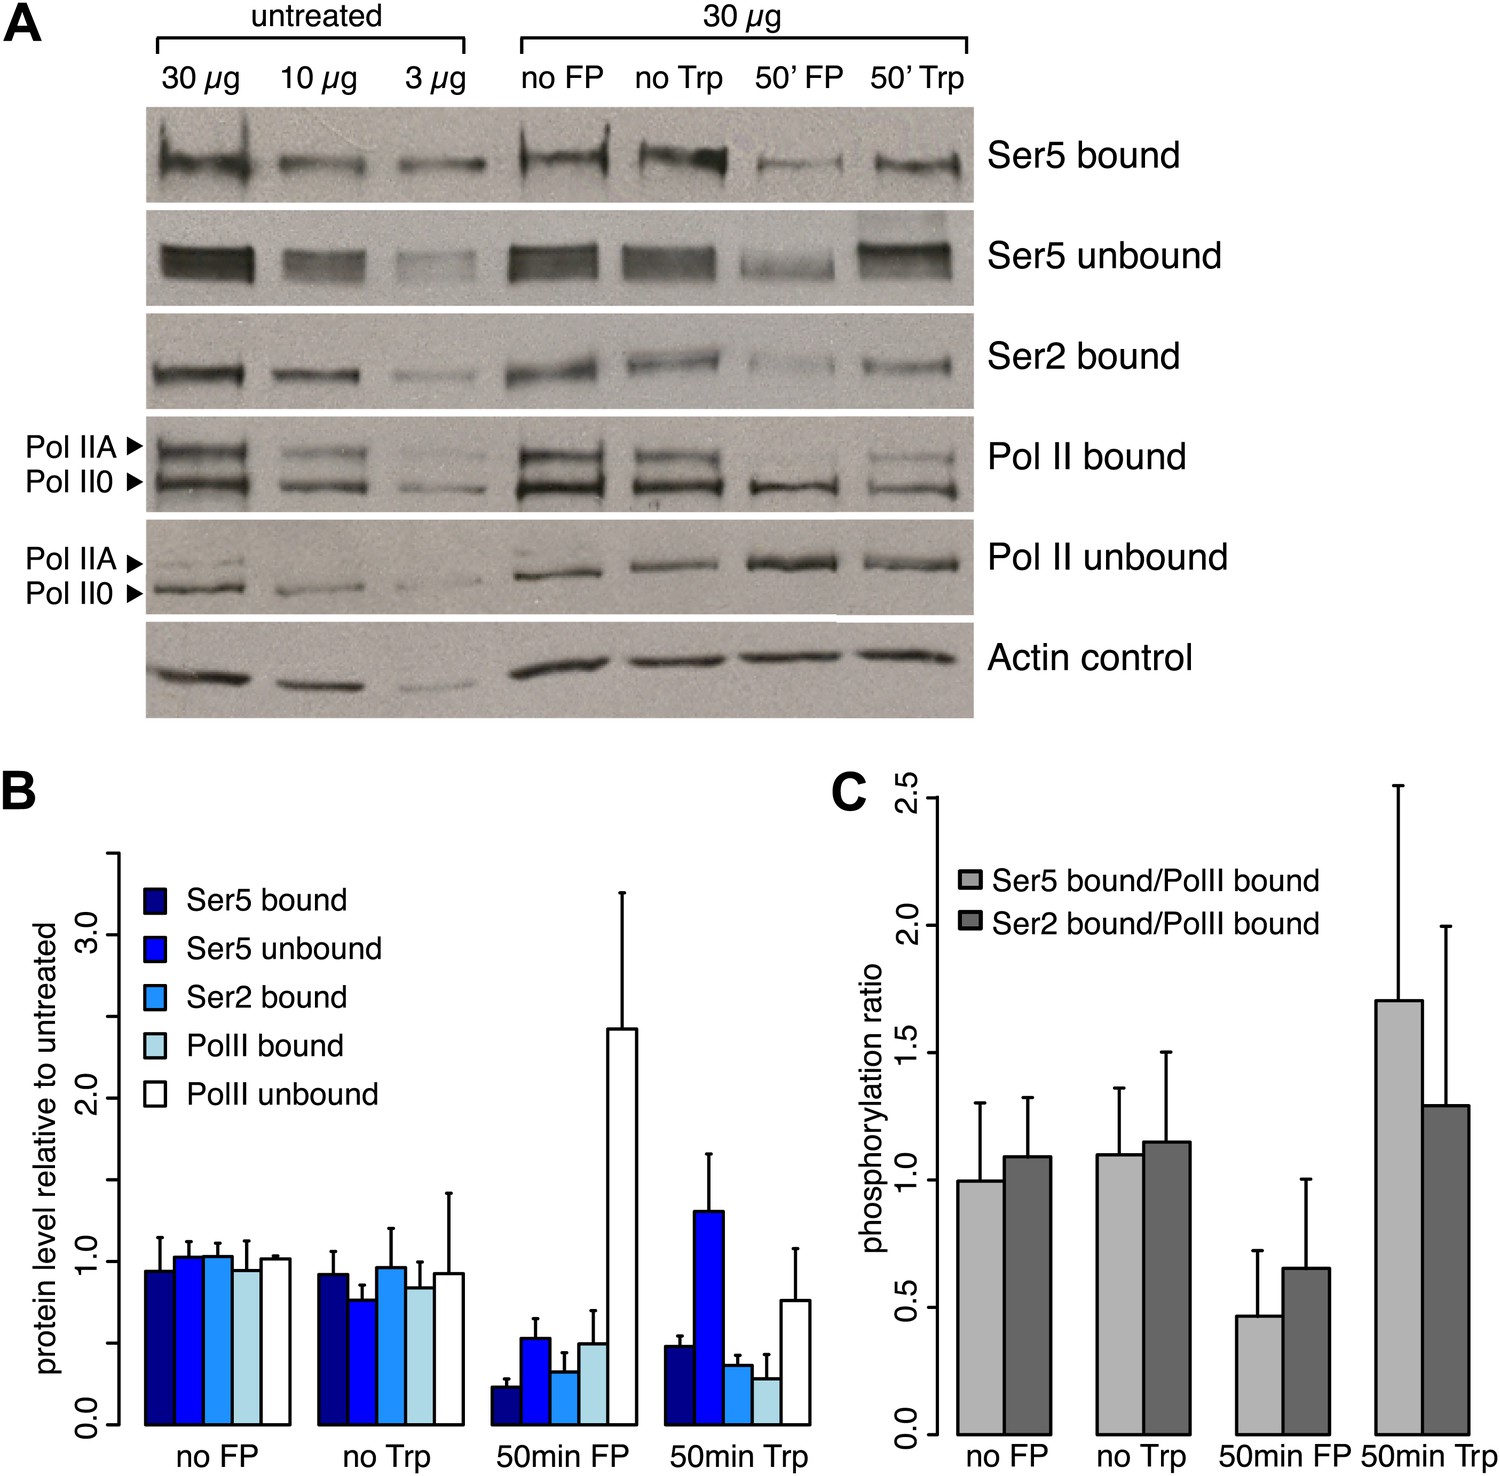
Inhibition of the P-TEFb kinase by Flavopiridol.
(A) Western blots of chromatin bound or unbound protein fractions of mES cells after 50 min of Trp, FP or DMSO (no Trp) treatment or no treatment (no FP), with antibodies against Ser2-, and Ser5-phosphorylated CTD, or N-terminal Pol II. (B) Analysis of triplicate of western blots as shown in A. After FP or Trp treatment the bound fraction of total Pol II was reduced to ∼50 and 30%, respectively, while the free fraction was increased after treatment with FP, but not with Trp. (C) Fraction of Pol II bound to chromatin that is phosphorylated at Ser2 or Ser5 of the CTD after 50 min of Trp or FP treatment. FP treatment causes an overall ∼50% reduction of phosphorylation of bound Pol II at both Ser2 and Ser5.
Figure 1—figure supplement 2

Stability of Pol II elongation after the inhibition of initiation or pause escape.
(A) Composite profile of Pol II GRO-seq density from 230 to 240 kb downstream of the TSS in genes larger than 250 kb after treatment with Trp for 0, 12.5, 25 or 50 min shows that levels downstream of the inhibition wave are unaffected. (B) As in (A), but for FP time course.
Figure 2 with 1 supplement
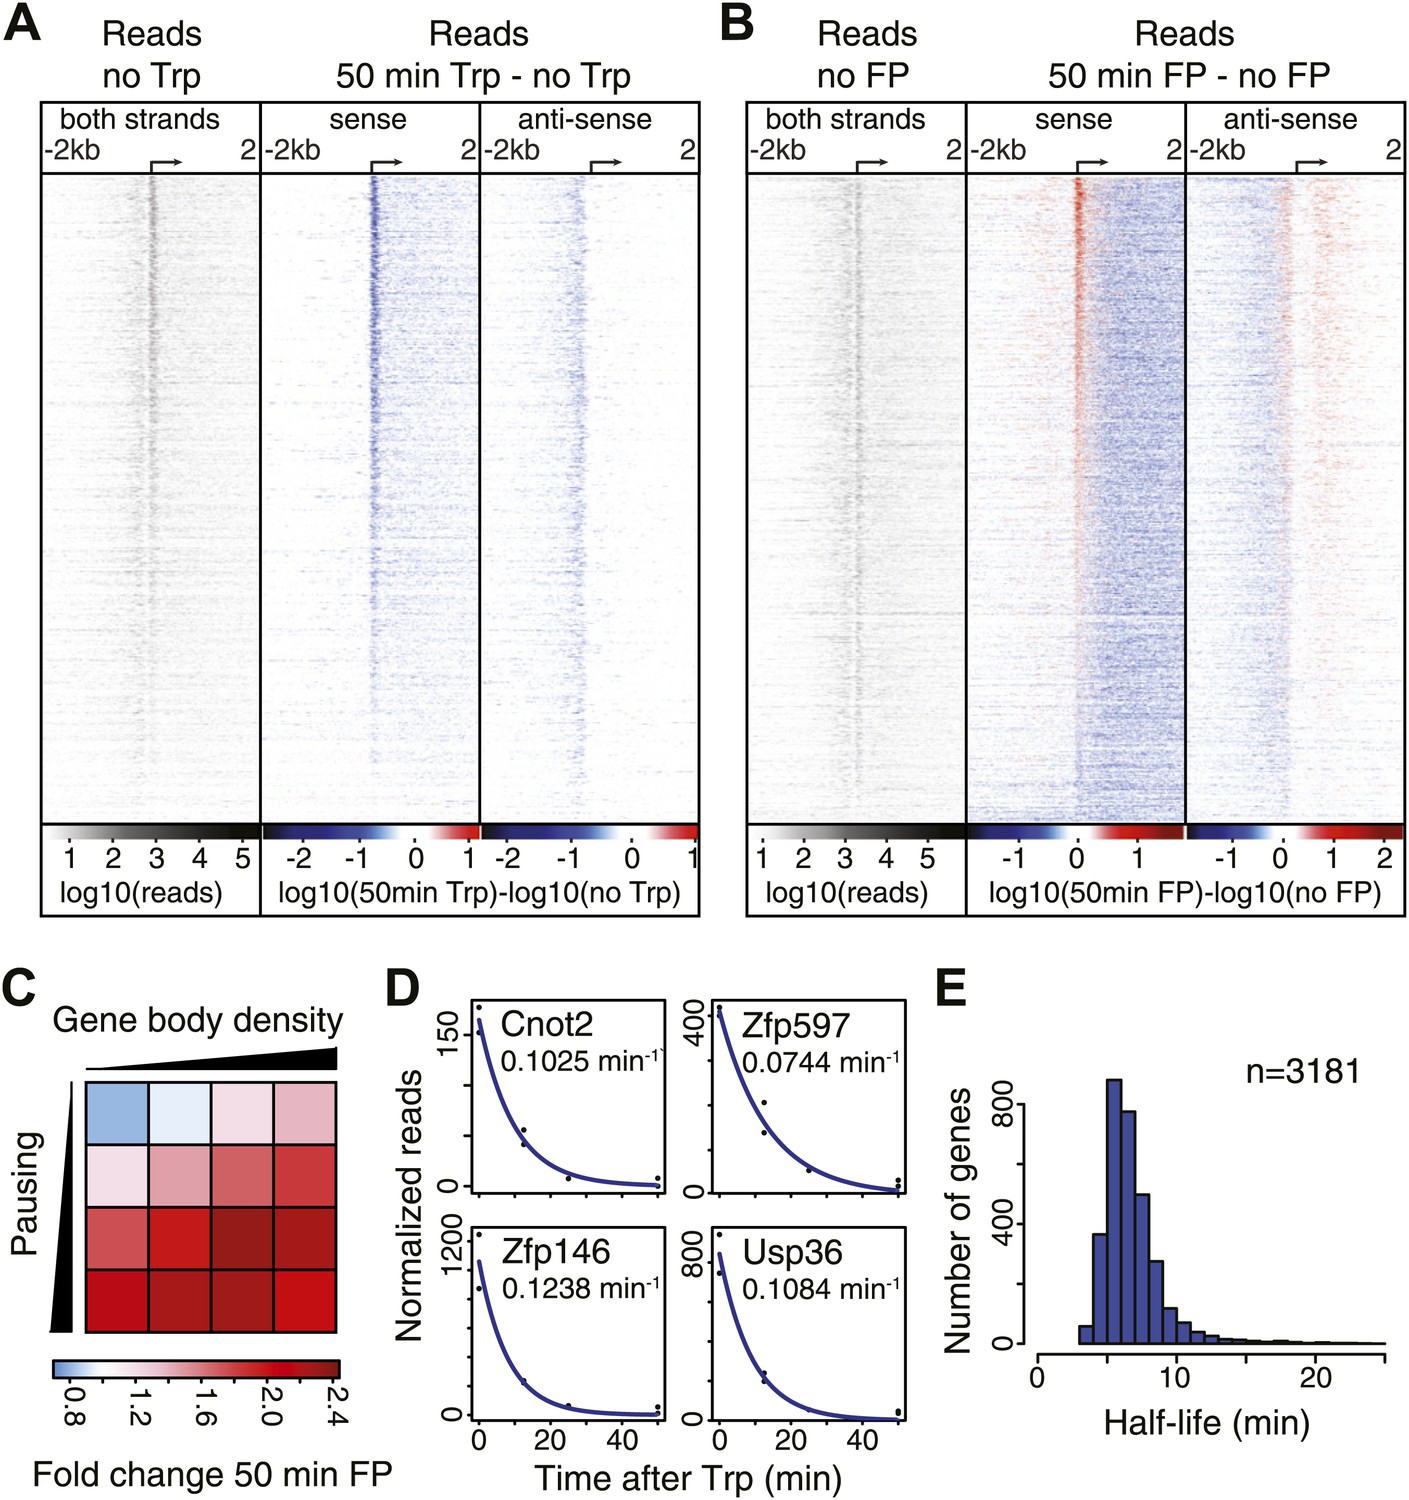
Pol II distribution and change at the TSS region of active genes after pause escape (P-TEFb) or initiation (TFIIH) inhibition.
(A) Left panel shows a density plot of the log10 of reads of the no Trp dataset, in 10 bp windows ±2 kb around TSSs of active genes. The two right panels show the log10 difference in 10 bp windows between 50 min Trp treatment and no treatment for the sense strand (middle) and antisense strand (right panel) with decrease in blue and increase in red. Genes are ordered by the maximum decrease after Trp treatment at the promoter-proximal region. The density scales and color keys for each panel are depicted the bottom. (B) As in (A), log10 reads in 10 bp windows around the TSS of the no FP control dataset (left panel), and the log10 difference in reads between 50 min FP treatment and no treatment for the sense (middle panel) and antisense strand (right panel). Genes are ordered by maximum increase after FP treatment at the promoter-proximal region. (C) The average fold change of promoter proximal Pol II in a 250 bp region in the sense direction after 50 min FP treatment in quartiles of pausing, as measured by the pausing index (y-axis), and activity, as measured by GRO-seq gene body density (x-axis). (D) Paused Pol II decay rates are calculated by non-linear regression with an exponential decay model over the read counts in the promoter-proximal region of each replicate time point in the Trp time course for each individual gene. Four examples of decay rate measurement with the standard deviation and the regression are shown, with the reads per time point per replicate shown as black dots, and the blue line as the regression of the decay. (E) The half-life’s of Pol II in promoter proximal regions of 3181 genes that have a high confidence decay rate with standard deviations (<0.5 times the decay rate).
-
Figure 2—source data 1
Change in promoter proximal and gene body read density, and pausing index after treatment with FP or Trp in time.
The gene body change was measured in the region from 1 to 3.5 kb downstream of the TSS for each timepoint, and was called significantly increased when the read density ratio was greater then 1 with a Fisher Exact p-value <0.05, or significantly decreased when the read density ratio was smaller then 1 with a Fisher Exact p-value <0.05. The same for the pause peak increase and decrease, but using a 250 bp region with maximal read density in a window of ±500 bp around the annotated TSS. The divergent peak was found by using a 250 bp region with maximal read density in a window of −1000 to +500 bp around the annotated TSS on the antisense strand, and change was defined similarly as the gene body change. Pausing indexes (PI) are the ratio between gene body and promoter proximal Pol II density, and the change in PI has therefore no Fisher Exact p-value associated with it. PI’s are increased or decreased when the ratio between untreated and treated PI’s is greater or smaller then 1, respectively.
- https://doi.org/10.7554/eLife.02407.011
Figure 2—figure supplement 1

Differential dynamics of paused Pol II upon the inhibitions of initiation or the pause escape.
(A) Scheme of selection process of active, long and well-resolved genes. (B) Log10 of GRO-seq read count in 10 bp bins ± 2 kb around the TSSs of active genes (n = 6380) before and after 50 min treatment with Trp (left panel), or before and after 50 min of FP treatment (right panel).
Figure 3 with 3 supplements
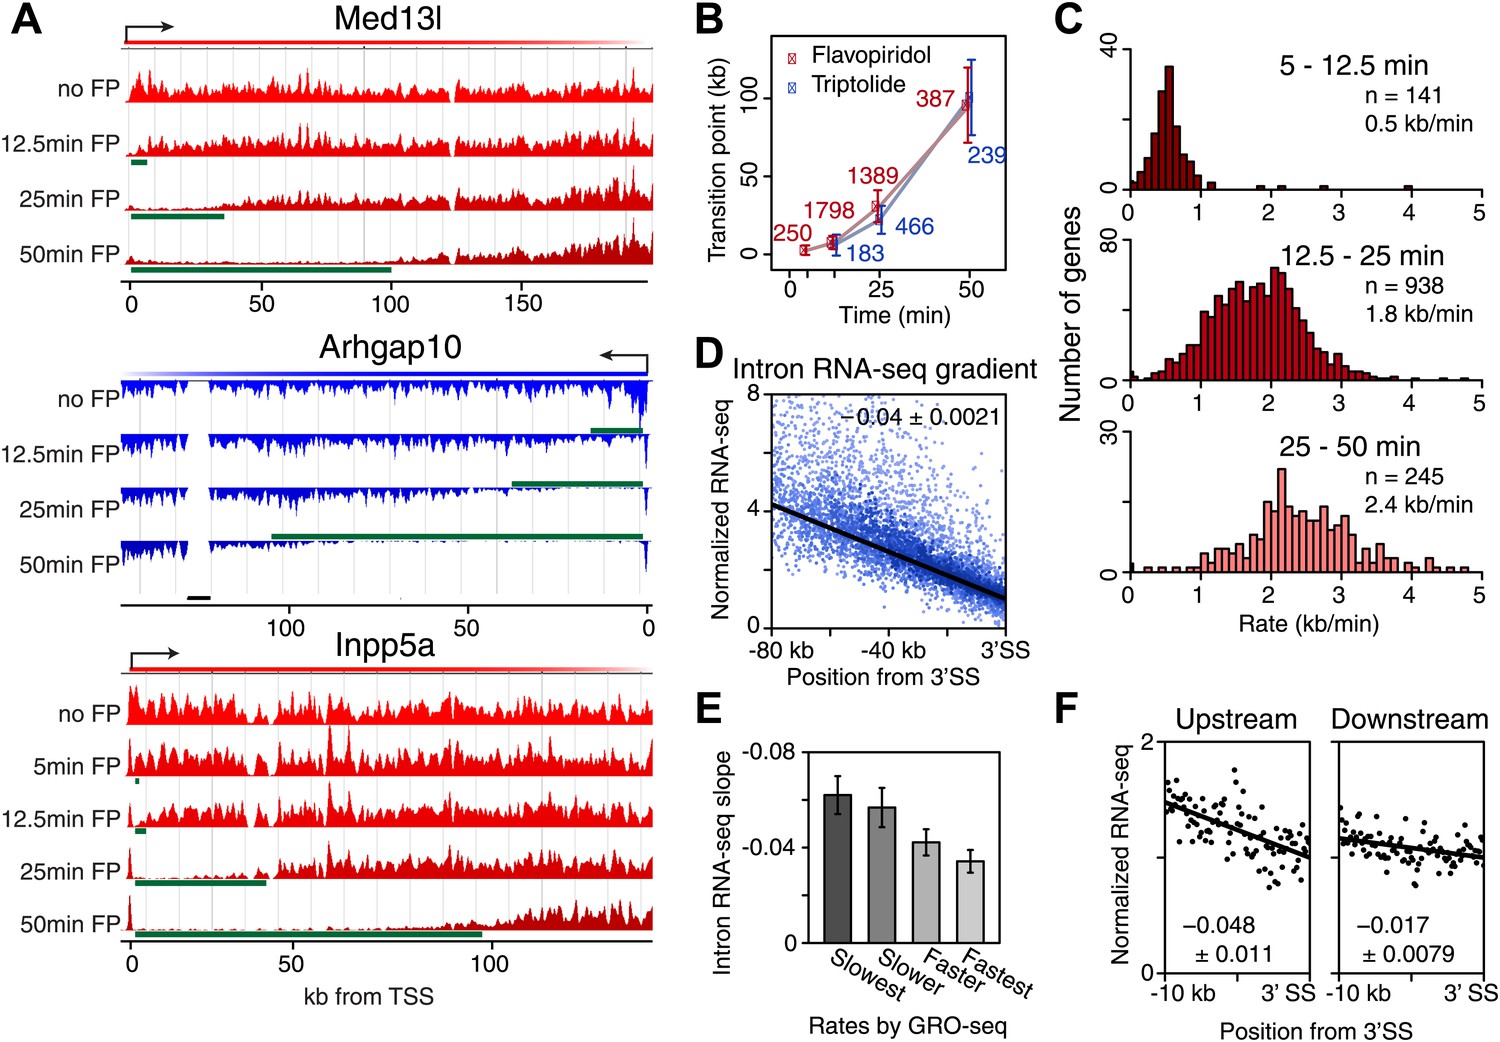
Genome-wide determination of Pol II elongation rates after FP and Trp treatment.
(A) Three representative genes used for measurement of transition points with the HMM. In green, the affected region after FP treatment as established by the HMM, the transition point being the endpoint of this region. In black, repeat regions where reads couldn’t be aligned uniquely. (B) Average of HMM derived transition points of the FP timecourse (red) or Trp timecourse (blue) plotted against the time of drug treatment. Error bars are standard deviation from the mean. The numbers of the genes with high confidence HMM measurements are next to each data point. (C) Elongation rates derived from the FP time course. Elongation rate is the distance traveled in the time spanning 5–12.5 min (top; n = 141), 12.5–25 min (middle; n = 938) and 25–50 min (bottom; n = 245). All elongation rates can be found in the Figure 3—source data 1. (D) RNA-seq intron gradient relative to the 3′ splicing site (3′SS). Introns longer than 10 kb (n = 17,828) in the refseq gene list are grouped by their sizes, and the average RNA-seq read count per 100 bp bins are plotted by the distance from the 3′SS for each group. Read density in the windows is normalized to the level of reads at the 3′ SS, to compensate for expression differences between genes. The average and the standard deviation of the slope are shown. (E) The RNA-seq gradients of the mid elongation rate genes (12.5–25 min) in the introns (1650 introns longer than 10 kb in 938 genes) grouped by the quartiles of the elongation rate (n = 413, 415, 411, 411 respectively for the slowest, slower, faster, and the fastest). Note that the slower genes have greater negative slope than the faster genes. (F) The RNA-seq intron gradients of the refseq introns upstream of 25 kb from TSS (n = 380) and introns downstream of 50 kb (n = 854) on the same gene for a smaller region.
-
Figure 3—source data 1
Full list of elongation rates derived after FP treatments between times spanning 5–12.5 min, 12.5–25 min, and 25–50 min.
- https://doi.org/10.7554/eLife.02407.013
Figure 3—figure supplement 1
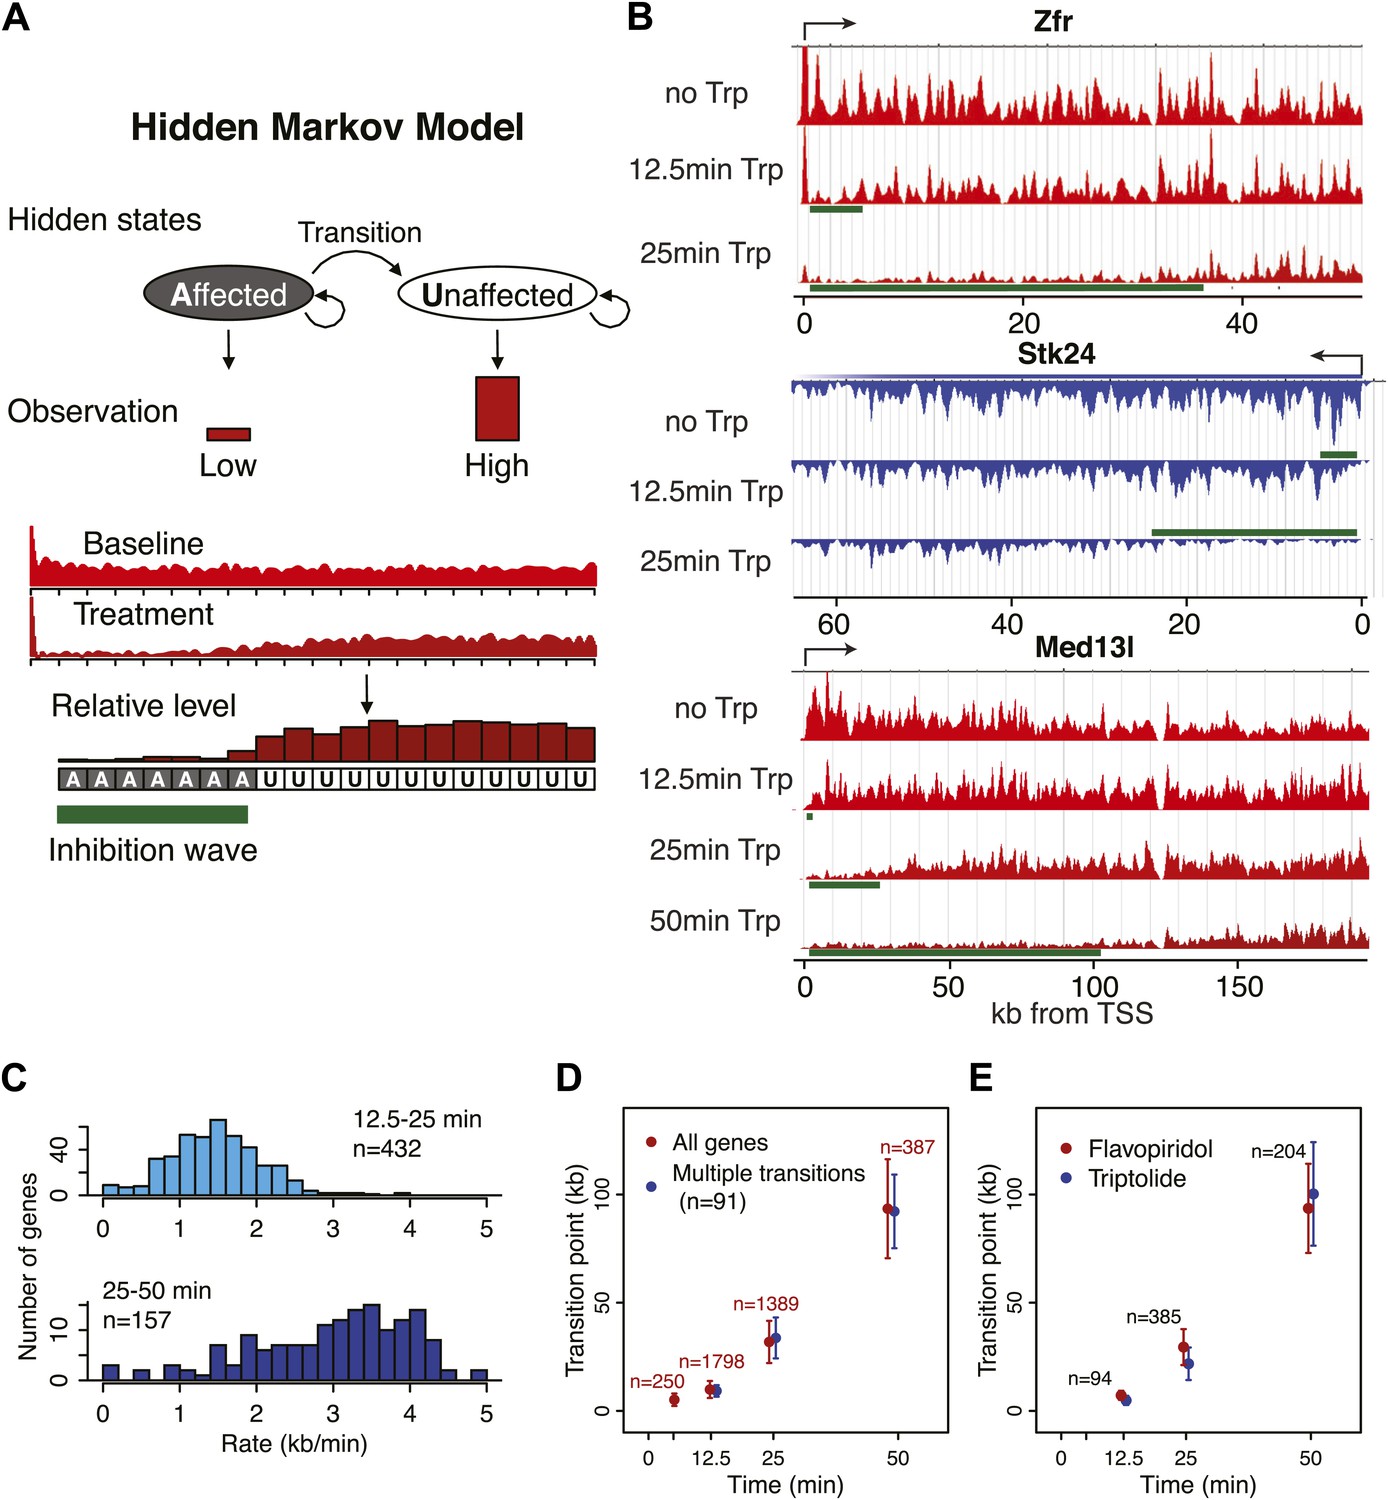
Determination of elongation rates using the Hidden Markov Model of inhibition time-points.
(A) Scheme of the Hidden Markov Model (HMM), in which each hidden state follows a binomial distribution B of 20 observed states n of the read ratio. We assumed two hidden states as ‘inhibition affected’ and ‘inhibition unaffected’, with two emission probabilities that leads to low or high levels of Pol II densities, respectively. The transition probabilities between the ‘affected’ and ‘unaffected’ states is unidirectional. (B) Three representative genes used for measurement of transition points with the HMM. In green, the affected region after Trp treatment as established by the HMM, the transition point being the endpoint of this region. (C) Elongation rates derived from the Trp time course. Elongation rate is the distance traveled in kb divided by the time spanning 12.5 to 25 min (top; n = 466) or 25 to 50 min (bottom; n = 239). (D) Average of HMM derived transition points of all the transition points in the FP time course (red) or of genes (n = 91) that had three consecutive transition points (blue) plotted against the time of drug treatment. Error bars are standard deviation from the mean. (E) Average of HMM derived transition points of the FP time course (red) or Trp time course (blue) plotted against the time of drug treatment of genes we derived transition points for in both the Trp and FP time course. Error bars are standard deviation from the mean.
Figure 3—figure supplement 2
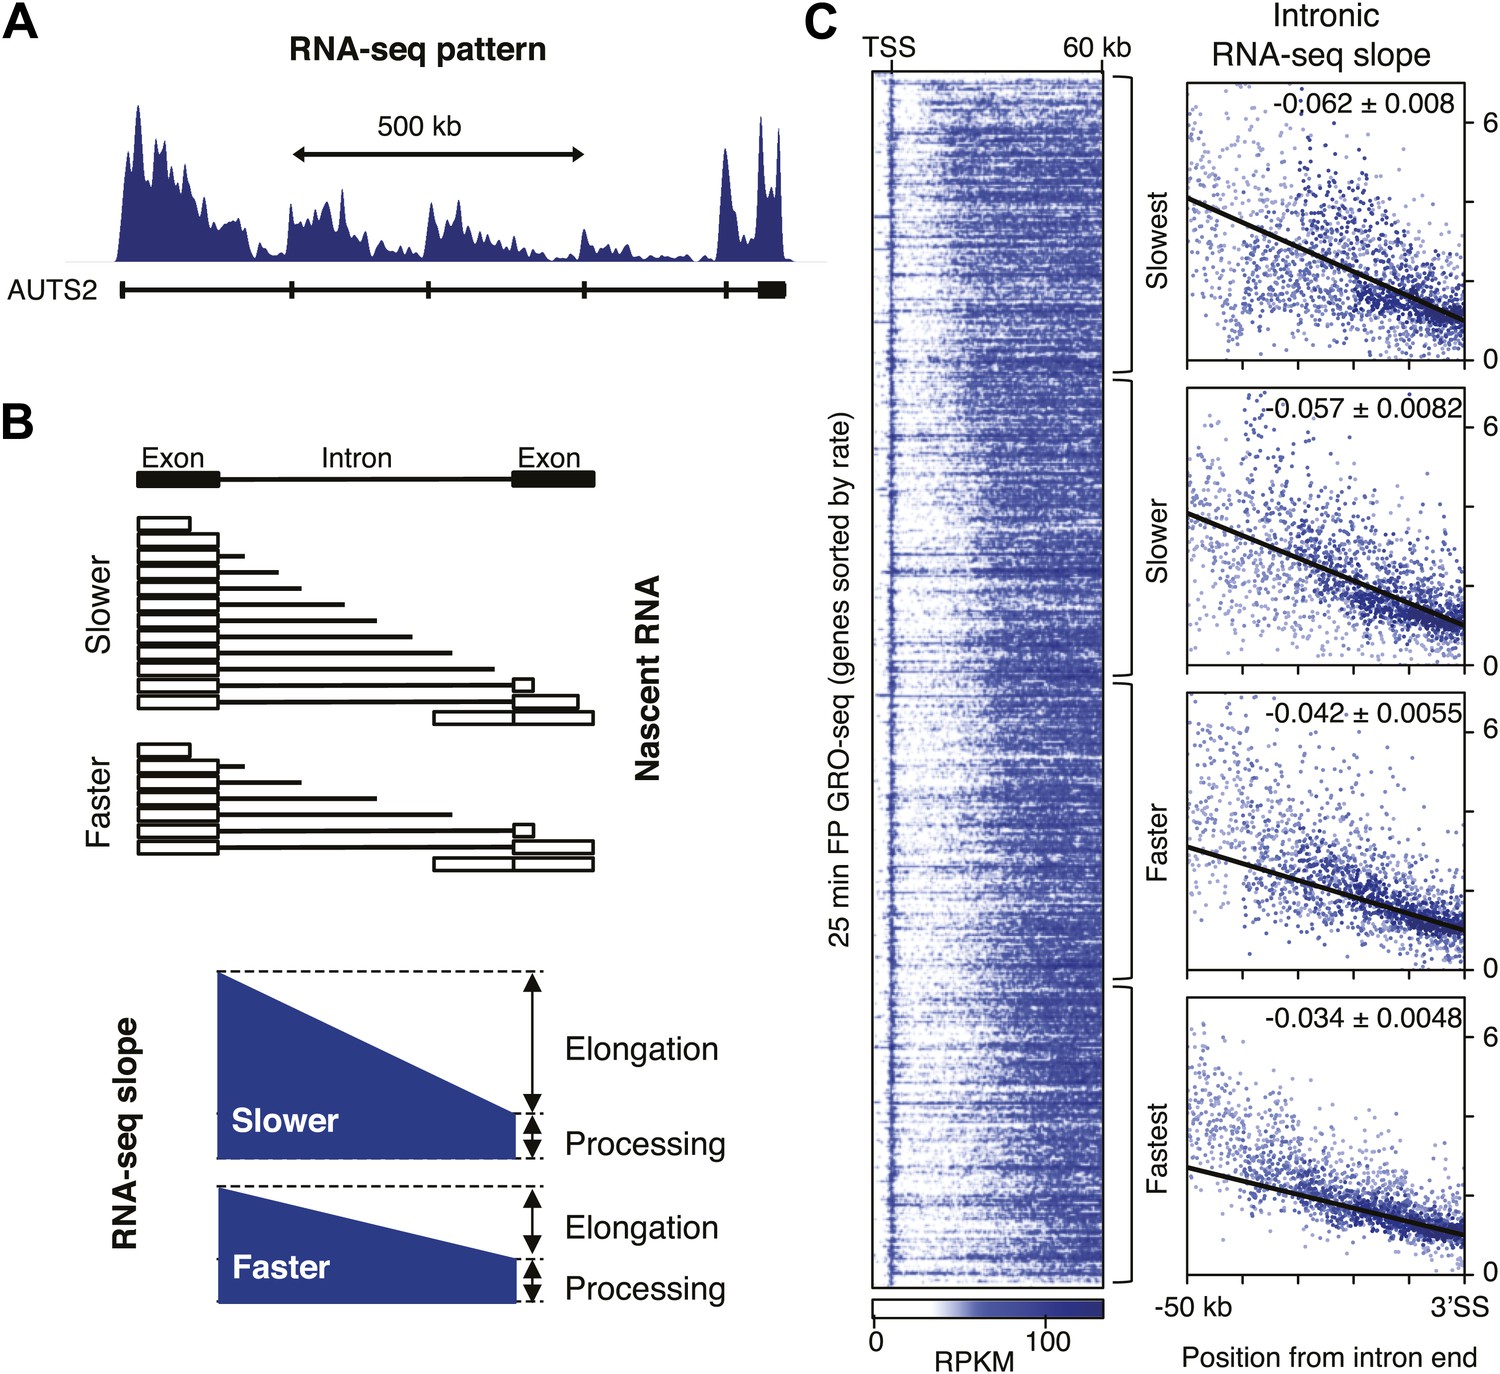
Determination of elongation rates using the intron RNA-seq gradients.
(A) PolyA(−) RNA-seq pattern in genes with long introns display a ‘saw-tooth’ pattern as shown by Ameur et al. (2011) and represented here for a typical gene (AUTS2). (B) Intronic reads of poly(A)- RNA-seq form a gradient as a consequence of co-transcriptional splicing and elongation rates. Slow Pol II (top) will take longer than fast Pol II (bottom) to reach the nearest exon, allowing for a larger build-up of intronic reads and a steeper gradient before the intron is spliced out and degraded (top) than will fast Pol II (bottom) (C) The GRO-seq density after 25 min FP treatment of genes with a transition point from the TSS to 60 kb is shown on the left. Genes are ordered by distance traveled after 25 min FP treatment and grouped in quartiles. On the right, intron reads of the genes in the rate quartiles are plotted with read density in bins within introns >10 kb as a function of the distance to the 3′ SS. Read density in the windows is normalized to the level of reads at the 3′ SS, to compensate for expression differences between genes. The slope of a linear regression model of the data points is depicted with standard deviation in the right hand corner.
Figure 3—figure supplement 3

Acceleration of Pol II and its accompanying CTD phosphorylation.
(A) Elongation rates of genes from which more than one elongation rate could be determined. p-values are calculated using Wilcox test. (B) Acceleration constant calculated in genes that have at least two elongation rates, see (A). Early acceleration is from early elongation rates to mid elongation rates, and late acceleration is from mid to late elongation rates. Elongation rates were corrected for exon density in the regions where elongation rates were measured. (C) As in (B), but for genes that have three elongation rates, and both acceleration constants are calculated within the same gene (n = 6). (D) Mid elongation rates (12.5–25 min), but not late elongation rates (25–50 min), correlate negatively with pausing. Boxplots of mid elongation rates (left) or late elongation rates (right) in quartiles of pausing index. (E) Composite profile of total Pol II, Serine 2 and Serine 5 phosphorylated Pol II ChIP-seq in mid elongation rate genes shows that total and Serine 5 phosphorylated Pol II accumulate near the TSS, while Serine 2 phosphorylated Pol II gradually increases in the gene body. (F) Same as (E), but normalized to total Pol II levels, showing that Serine 2 phosphorylation increase is independent from total Pol II levels. The most dramatic increase in Serine 2 phosphorylation is over the first 10 kb and is the interval corresponding to the largest increase in Pol II acceleration.
Figure 4 with 1 supplement

Elongation rate explains transcriptional stability and the steady-state output.
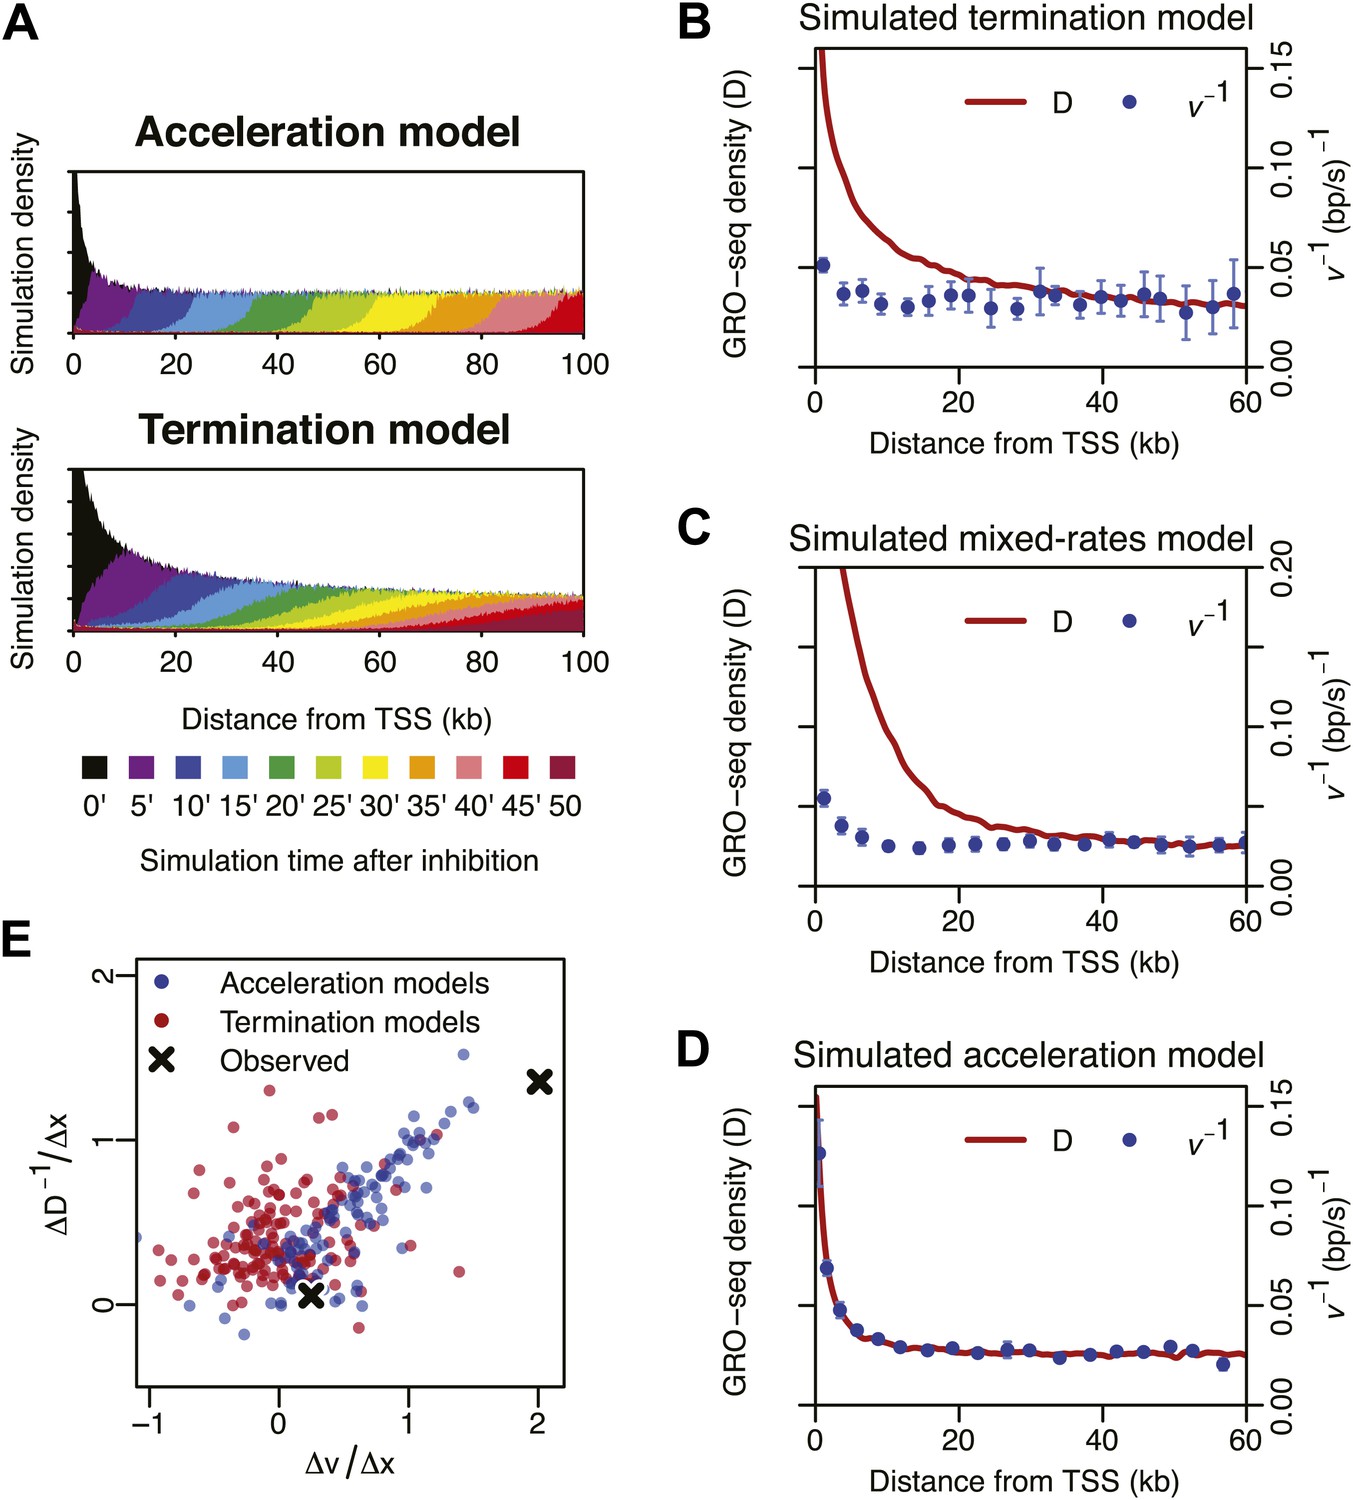
(A) Models of Pol II elongation (left), and the expected steady-state GRO-seq density (D) and the inverse elongation rates (v−1) for each model (right). The termination model proposes that the decrease in D is a combination of Pol II termination and increasing elongation rate, while the acceleration proposes that the decrease in D is primarily a consequence of increasing elongation rate. (B) The steady-state GRO-seq density (D) and inverse elongation rates (v−1) from average transition points of the FP measurements. (C) Stages of transcription determining the mRNA level following the productive elongation stage. (D) Correlation plot between GRO-seq gene body density as a measure of nascent transcription and RNA-seq as a measure of mRNA steady state level. (E) Non-linear correlation between nascent transcription level and mRNA level in highly transcribed genes. To determined the monomial degree of the correlation, a LOESS fit was used for the scatterplot in D, and the slopes of the LOESS fit in the higher 50 percentile and the lower 50 percentile were derived. (F) Elongation rate correlates with GRO-seq density. Correlation plot was determined from the z-scores of the elongation rates and the gene body GRO-seq densities. (G) Correlation of mRNA steady state level and GRO-seq of the 938 mid elongation rate genes (12.5–25 min), and the monomial degree of the correlation derived from the slope. (H) Correlation plot of the mRNA production rate (GRO-seq density multiplied by the elongation rate) and mRNA steady state level of the same genes, and the monomial degree of the correlation.
Figure 4—figure supplement 1
Monte-Carlo modeling of the acceleration and the termination hypotheses.
(A) Simulation time-course of change in Pol II distribution after a block of Pol II entry into the gene body assuming an intrinsic acceleration model (top) and a termination model (bottom). See supplementary methods for the details of the simulation. (B) Pol II density D and inverse elongation rate v−1 plot of a simulation assuming a termination model as explained in the top panel of Figure 4A. (C) Pol II density D and inverse elongation rate v−1 plot of a simulation assuming a mixed rates model. In this model, slower and faster populations of Pol II co-exists, and slower Pol II terminates more frequently leaving the faster Pol II more abundant in more downstream regions. (D) Pol II density D and inverse elongation rate v−1 plot of a simulation assuming a intrinsic acceleration model as explained in the bottom panel of Figure 4A. (E) Scatterplot of the slope of v and the slope of D−1 for multiple acceleration models and termination models. See supplementary methods for the details of the simulation.
Figure 5 with 1 supplement
Genome-wide features that associate with the elongation rates.
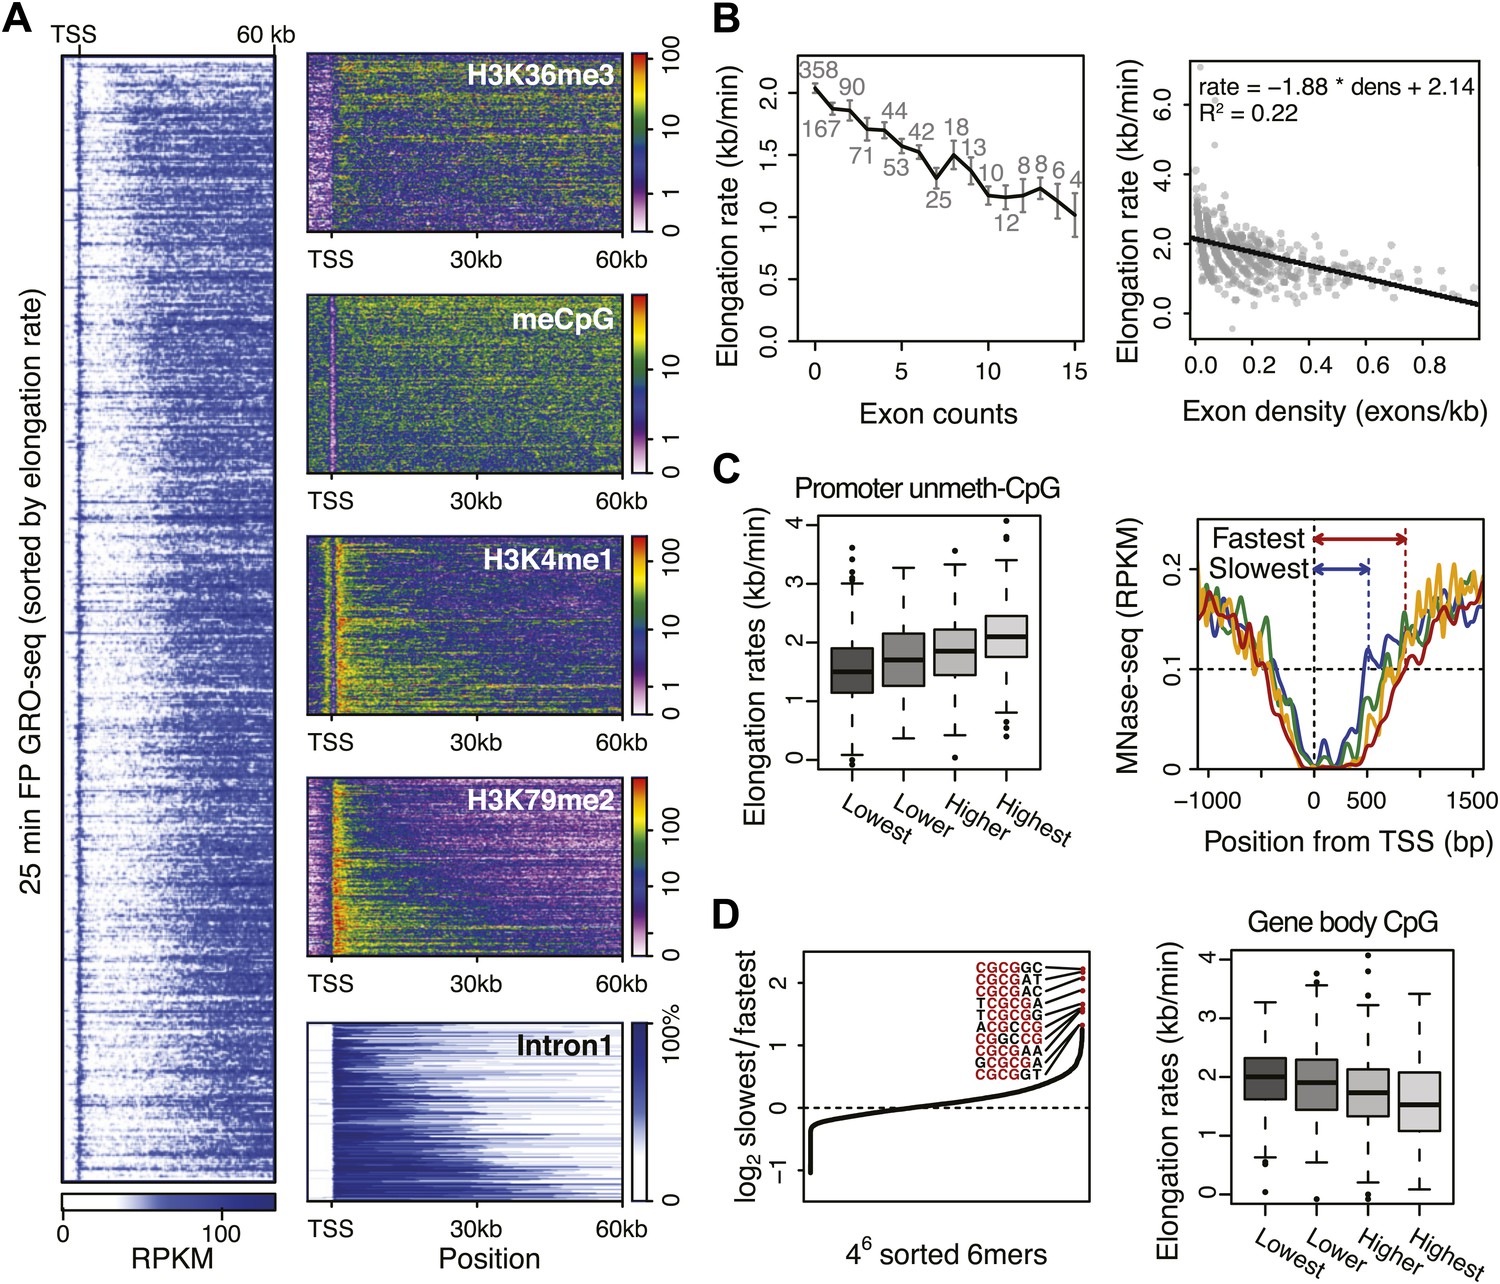
(A) Profile of the 25 min FP GRO-seq data in mid elongation rate genes (n = 938), ordered by increasing rate (left panel). Right panels depict genomic features in the same gene order (but more compact) from top to bottom: H3K36me3, CpG methylation, H3K4me1, H3K79me2 and intron1 size. (B) Elongation rates strongly correlate with exon density. (Left) Mean elongation rates of mid rate genes plotted as a function of the exon count within the average mid transition region (12.5–25 min, or 7.5–30 kb). (Right) Elongation rate as a function of exon density in individual mid transition regions of genes with 1 or more exons, with linear regression. (C) (Left) Boxplots of the elongation rates in quartiles of unmethylated CpG content at promoters. (Right) Nucleosome pattern around the TSS for rate quartiles; Nucleosome density at promoters correlates with downstream mid elongation rates. (D) CpG content reduces elongation rate. (Left) 6-mer combinations from ‘AAAAAA’ to ‘UUUUUU’ ordered by relative occurrence in the slowest quartile of the mid-elongation rate genes compared to the fastest quartile (n = 234 each). (Right) Boxplots of the elongation rates, in quartiles of CpG content in the average mid transition regions of genes.
-
Figure 5—source data 1
ChIP-seq datasets used in this study.
Complete table of all the ChIP-seq data and references taken into account in the correlation study between mid elongation rates (n = 938) and promoter or gene body occupancy of each of the listed factors. The references to the GEO datasets are shown in the “Major datasets” section.
- https://doi.org/10.7554/eLife.02407.019
Figure 5—figure supplement 1
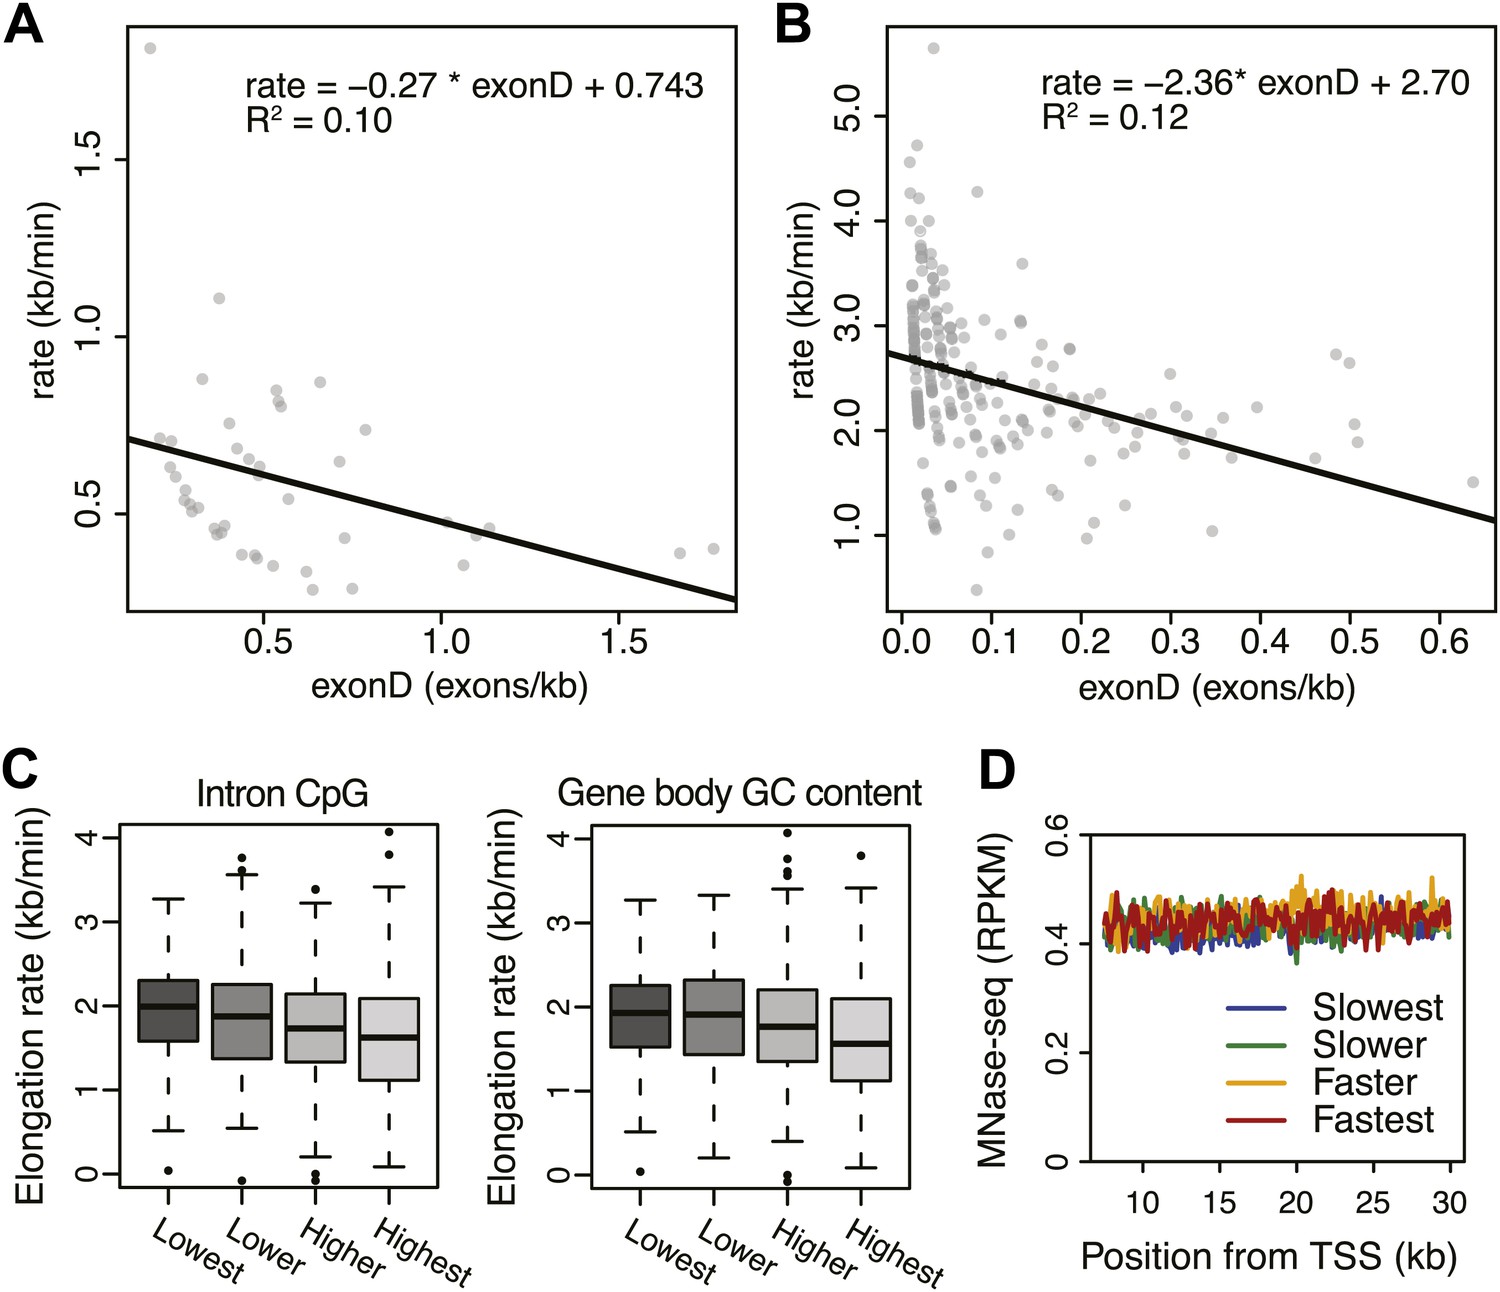
Effects of exon density and CpG on elongation rates.
(A) Elongation rates plotted against exon density within the transition region for early elongation rates (5–12.5 min; n = 44). (B) As in (A) for late elongation rates (25-50 min; n = 199). Linear regressions are drawn in black, and linear regression model is shown in the plot. (C) Boxplots of elongation rates in lowest to highest qsuartiles of CpG content within introns (left panel) and overall CpG density (right panel). (D) Gene body nucleosome density within the average mid transition region for mid elongation rate quartiles.
Figure 6 with 1 supplement
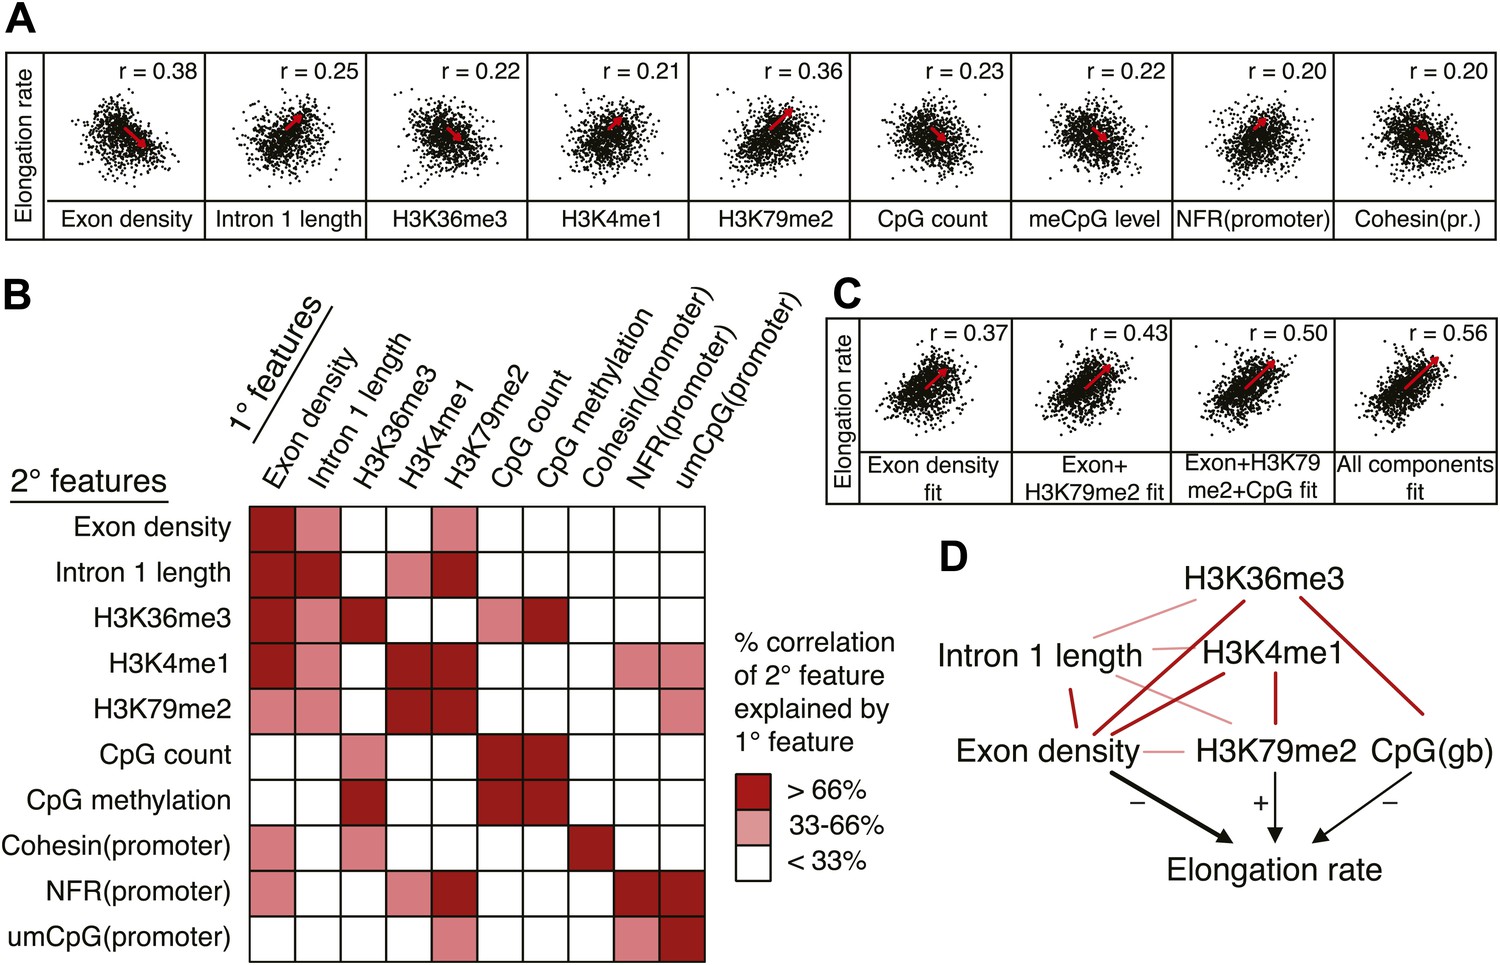
Variations in elongation rates are largely explained by exon density, H3K79me2 and CpG content.
(A) Most prominent correlations between mid elongation rates (n = 938) and various features of mid rate genes after transformation to a rank-order based z-score assuming a Gaussian distribution. (B) Iterative assessment to establish how much of each feature in A is explained by a second feature from A. If a 1° feature explained >66% of the correlation of a 2° feature, the 2° feature was deemed dependent of the 1° feature, and did not contribute individually to the elongation rate model. (C) Correlation of the elongation rate with the linear prediction model using exon density only (first panel), exon density/H3K79me2 (second panel), exon density/H3K79me2/CpG content (third panel), and all components (last panel) shows that the exon density, H3K79me2 and CpG content explains most variation in elongation rates, and that addition of other components improves the correlation only slightly. (D) Interaction plot of major gene body features that influence elongation rates, either directly, or indirectly. Color key of (B) is applicable to the color of the interaction lines, the boldness of the arrows indicates individual contribution to elongation rate modulation, and the plusses and minuses indicate a positive or negative effect.
Figure 6—figure supplement 1
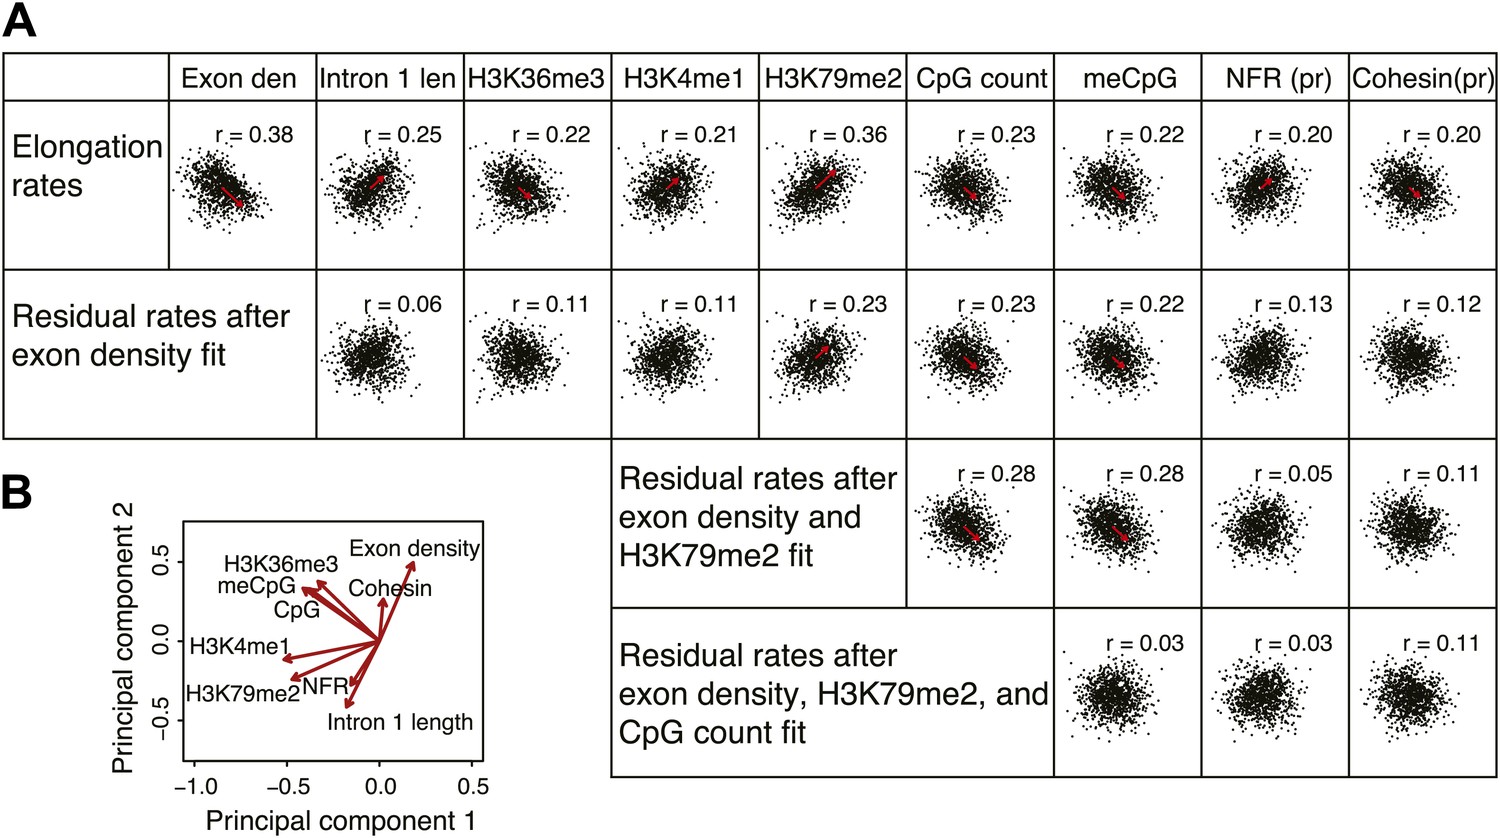
Comprehensive linear models of the elongation rates using multiple genomic features.
(A) Correlation plots of the most highly correlated genomic features and the elongation rates or the residuals of the elongation rates after fitting to exon density; exon density and H3K79me2; exon density, H3K79me2, and CpG counts. The red arrows represent the direction and the strength of the correlation. The arrows are omitted for the correlations with the p-values <0.01. n = 938 mid elongation rate genes. (B) Principal component analysis of the major features correlated to the elongation rates. Note that the exon density and the intron 1 length are on the opposite direction but on the same axis indicating that they co-variate with each other.
Author response image 1
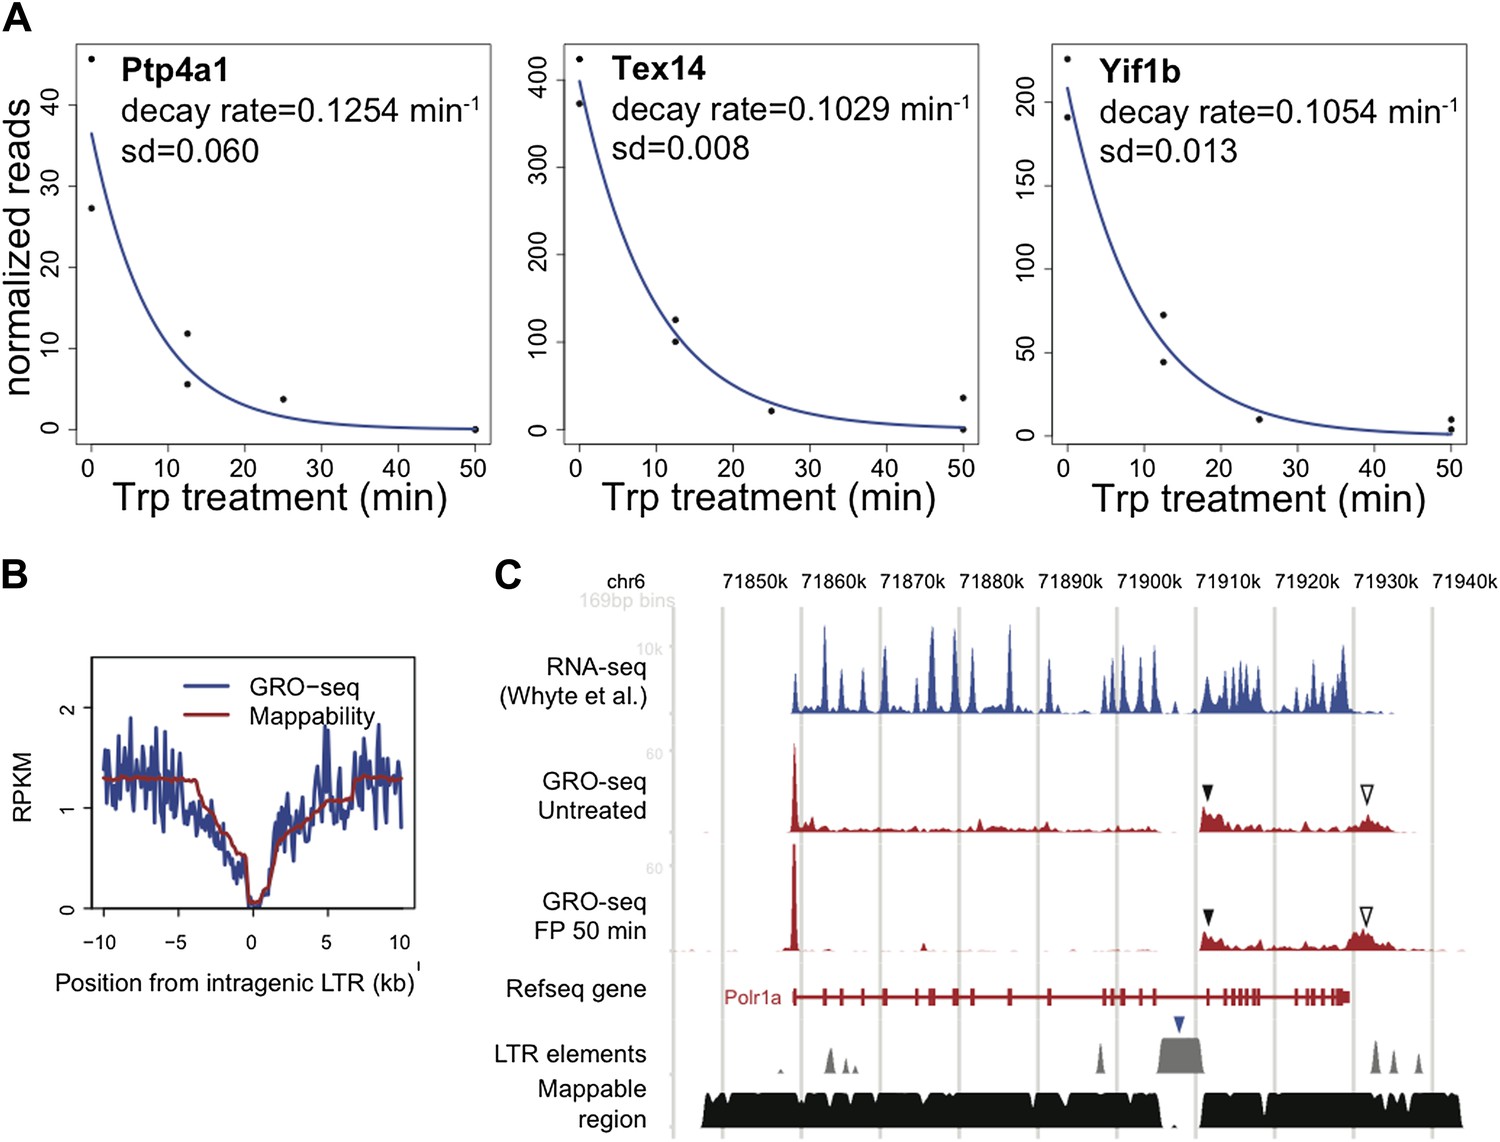
LTR.
A. The decay rate plots of the three active genes identified by Wagschal et al. to be regulated at the level of termination of Pol II at the promoter or within the gene body in Hela cells. B. The composite profile of GRO-seq density around intragenic LTR sites genome wide in blue, compared to the mappability of these sites in red. C. The GRO-seq density profile before and after FP treatment and the RNA-seq profile of the LTR containing gene Polr1a shows a potential example of genic termination mediated by the IAP LTR (blue rectangle) recruited microprocessor and Xrn2. The black rectangle indicates the GRO-seq pattern consistent with premature nascent RNA cleavage and post-cleavage Pol II accumulation, while the empty triangle indicates the post poly-A accumulation of Pol II.
Author response image 2

TFIIH sensitivity.
The genes assayed by ChIP-qPCR of Ser5 phosphorylated Pol II in Figure 5F of Tee et al. Cell 2014 were examined. In the top box, two Trp sensitive control genes taken from this figure are shown, and in the bottom box, four examples of Trp “insensitive” genes are displayed. The tracks shown are Ser2 (green), Ser5 (purple) and N-terminal Pol II (black) ChIP-seq datasets from Rahl et al. 2010 Cell. The y-axis in RPKM is identical for the three ChIP-seq tracks. Below, the control DMSO and 25 min Trp treated GRO-seq datasets are displayed, with the sense strand in red and the antisense strand in blue. The y-axis for the GRO-seq data is in red and blue also and identical for both GRO-seq datasets, but different from the ChIP-seq y-axis due to different normalization done with Spike-in control instead of total reads as with ChIP-seq. Location of the genes is shown in red or blue at the bottom of each screenshot, and the location of the qPCR amplification product, as reported by Tee et al., is shown in green above the gene. Note that the Trp sensitive control genes Klf2 and Trim28 are over ∼10x higher expressed than the Trp “insensitive” developmental genes. The expression as measured by both GRO- and ChIP-seq of the HoxC5 and T genes was negligible. Despite the low activity of the developmental genes Gata4 and Fgf5, a Trp dependent block of initiation and loss of transcription after 25 min Trp treatment could clearly be detected.
Download links
A two-part list of links to download the article, or parts of the article, in various formats.
Downloads (link to download the article as PDF)
Open citations (links to open the citations from this article in various online reference manager services)
Cite this article (links to download the citations from this article in formats compatible with various reference manager tools)
Genome-wide dynamics of Pol II elongation and its interplay with promoter proximal pausing, chromatin, and exons
eLife 3:e02407.
https://doi.org/10.7554/eLife.02407


