MicroRNAs shape circadian hepatic gene expression on a transcriptome-wide scale
- University of Lausanne, Switzerland
- Vital-IT, Swiss Institute of Bioinformatics, Switzerland
Figures
Figure 1 with 2 supplements
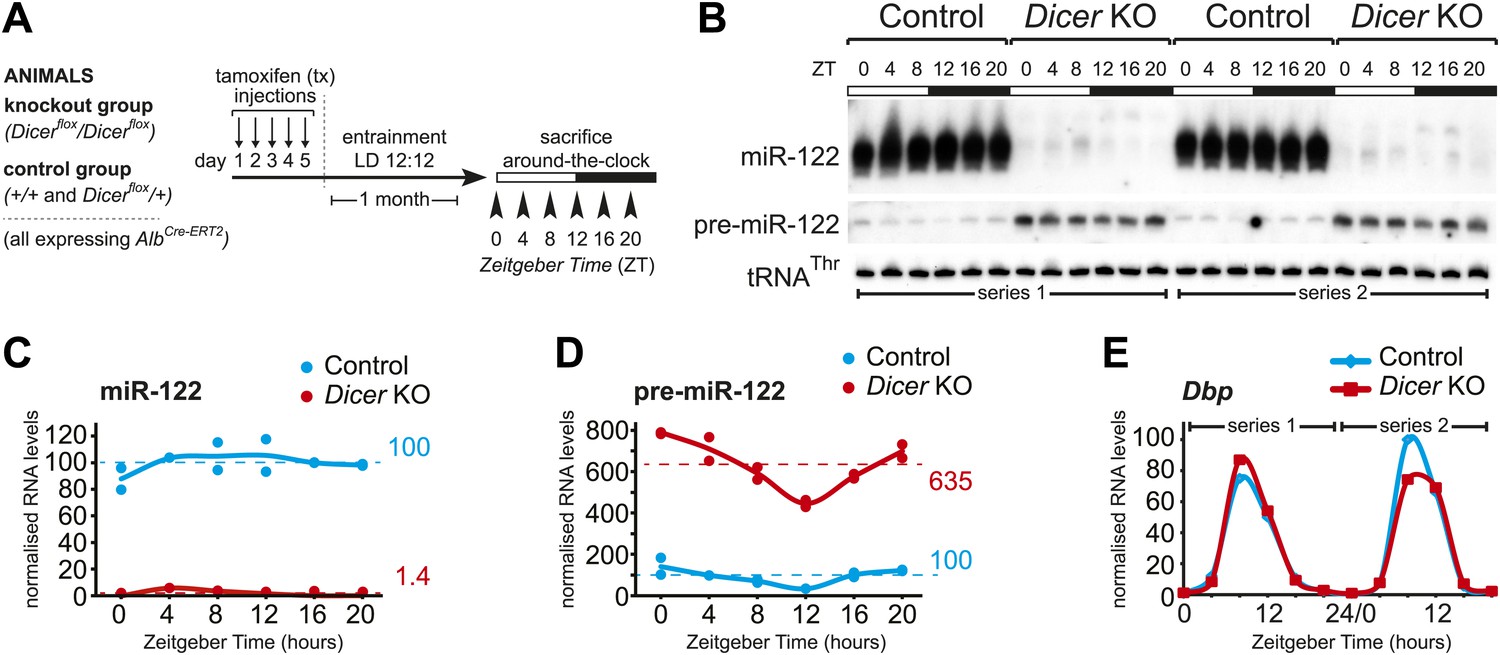
Analysis of hepatic Dicer knockout using miR-122 as a diagnostic marker.
(A) Schematic of the Dicer knockout protocol used throughout the study. Conditional knockout and control littermates (heterozygotes and wild-type) carrying the AlbCre–ERT2 allele that ensures hepatocyte-specific expression were injected with tamoxifen, entrained to 12-hr light/12-hr dark cycles for a month, and sacrificed at the indicated Zeitgeber Times. (B) Northern blot analysis demonstrating that miR-122 is virtually undetectable in knockout animals. In contrast, the Dicer substrate, pre-miR-122, accumulates to higher levels due the lack in turnover by Dicer. Each loaded sample is a mix of RNAs prepared from 3 to 4 independent animals. The two series are the same as used for the RNA-seq analysis. tRNAThr served as a loading control. (C) Quantification of miR-122 abundance from northern blot shown in (B) after normalisation to tRNAThr. In the knockouts, mean miR-122 levels only reached 1.4% of control levels. (D) Quantification of pre-miR-122 expression (normalised to tRNAThr) from northern blot shown in (B). On average, pre-miR-122 accumulates to >sixfold higher levels than in controls due to the absence of Dicer processing. Note that even in the knockout, pre-miR-122 still shows the rhythmic accumulation that is the result of cyclic transcription at the mir122 locus. (E) Quantitative real-time PCR analysis of Dbp, a typical core clock output gene, clearly indicates that rhythmic gene expression per se still occurs in Dicer knockout livers.
Figure 1—figure supplement 1
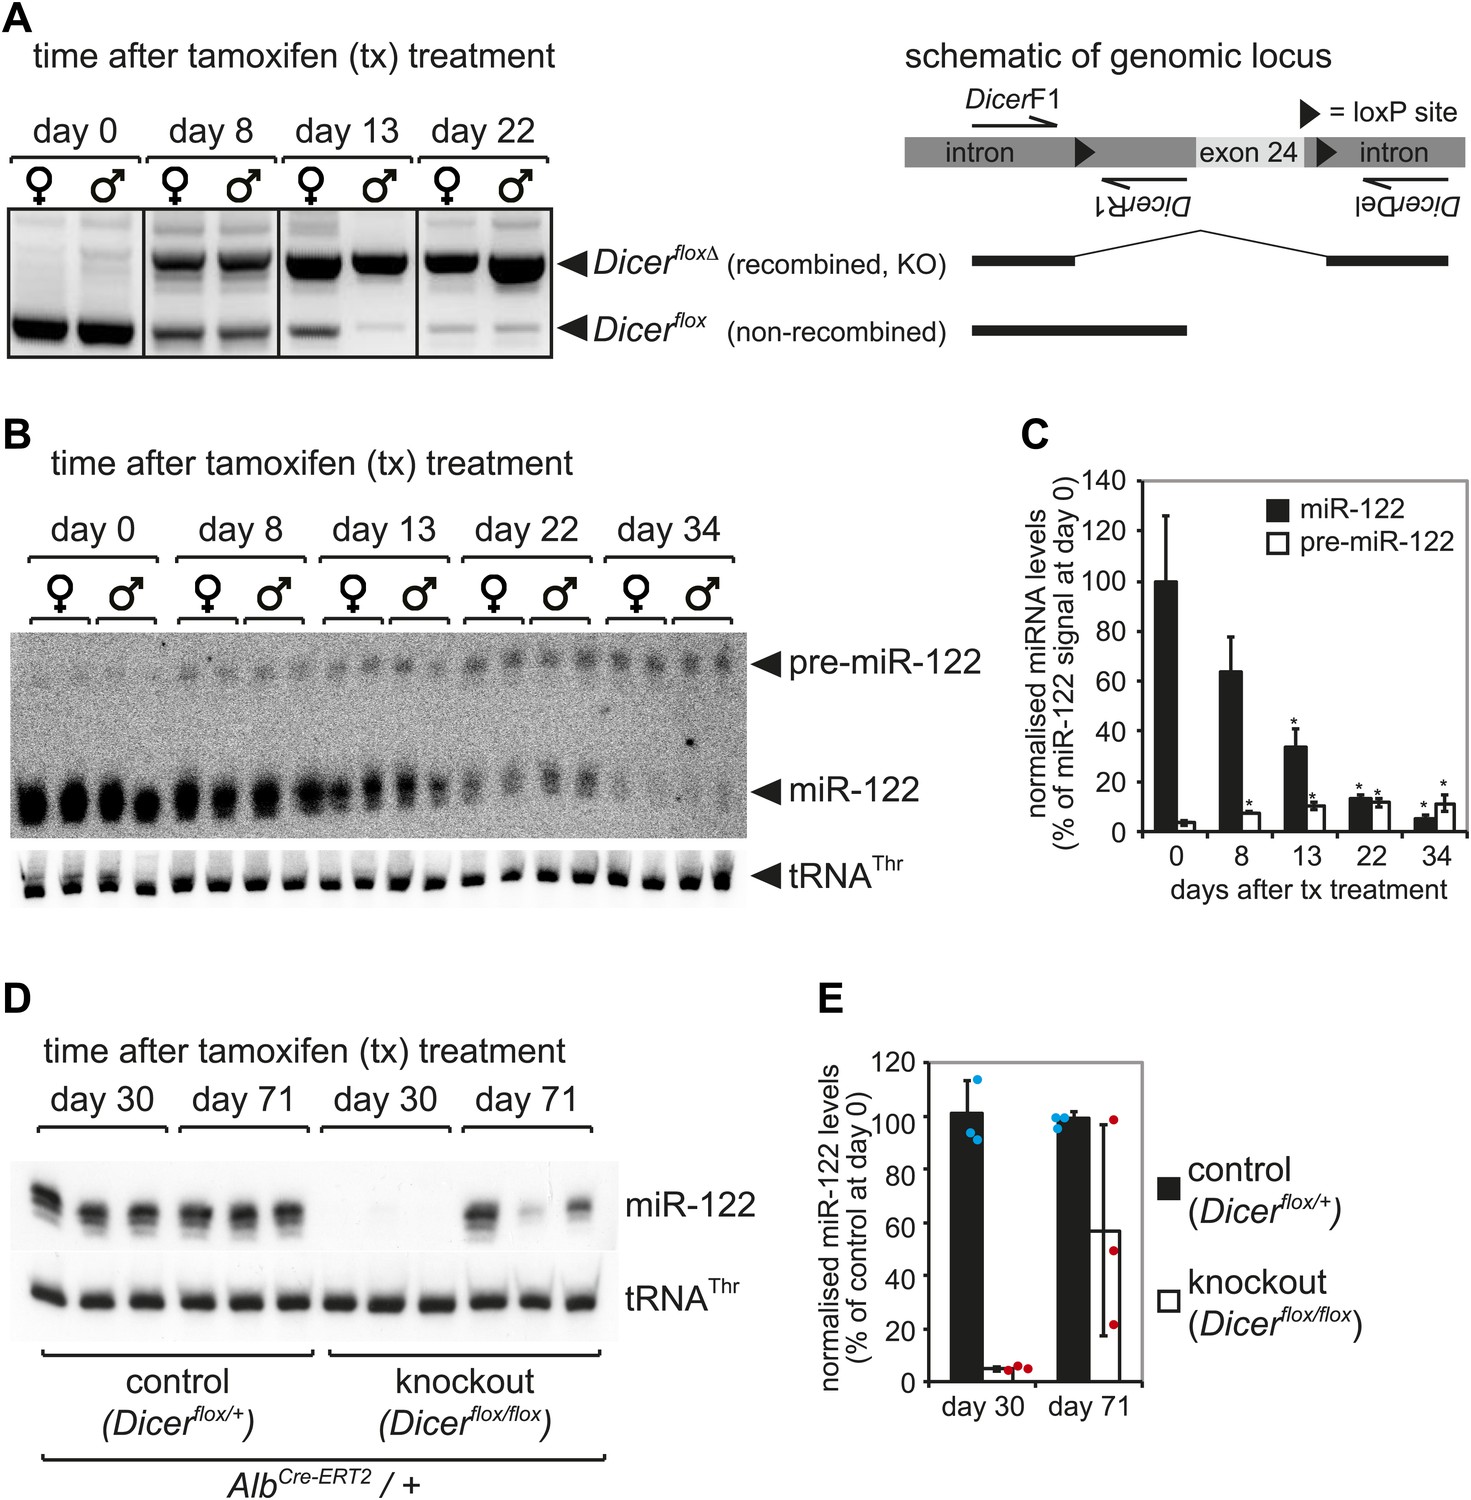
Kinetics of Dicer knockout in liver.
(A) PCR analysis of recombination kinetics at the Dicer locus. Male and female mice homozygous for the Dicerflox allele (also carrying AlbCre-ERT2) were injected with tamoxifen on five consecutive days and sacrificed 0, 8, 13, 22 days after the first injection. Cre-mediated deletion of exon 24 of the Dicer locus was detected using PCR with three primers that produce different products for floxed and floxed-deleted alleles (the location of the primers relative to the floxed exon 24 is schematically represented at the right of the figure). High efficiency of deletion thus occurred from 2 to 3 weeks after tamoxifen treatment. (B) Northern blot analysis confirms that 2–3 weeks after tamoxifen treatment miR-122 abundance strongly decreased. After around 1 month, miR-122 was virtually undetectable, whereas pre-miR-122 accumulated to higher levels due to the lack in Dicer processing. (C) Quantification of the northern blot shown in (B). miR-122 levels (normalised to tRNAThr) on day 0 were set to 100%. (D) Male mice heterozygous (control) and homozygous (knockout) for the Dicerflox allele were injected with tamoxifen as in (A–C) and sacrificed 30 days and 71 day after the first injection. As in (B), 1 month after injection miR-122 was undetectable in the knockouts. Interestingly, 2–3 months after tamoxifen treatment, miR-122 expression recovered. This effect was independent of whether the animals carried a single or two copies of the AlbCre-ERT2 allele (data not shown). (E) Quantification of the northern blot shown in (D). miR-122 levels (normalised to tRNAThr) in controls at day 30 were set to 100%.
Figure 1—figure supplement 2
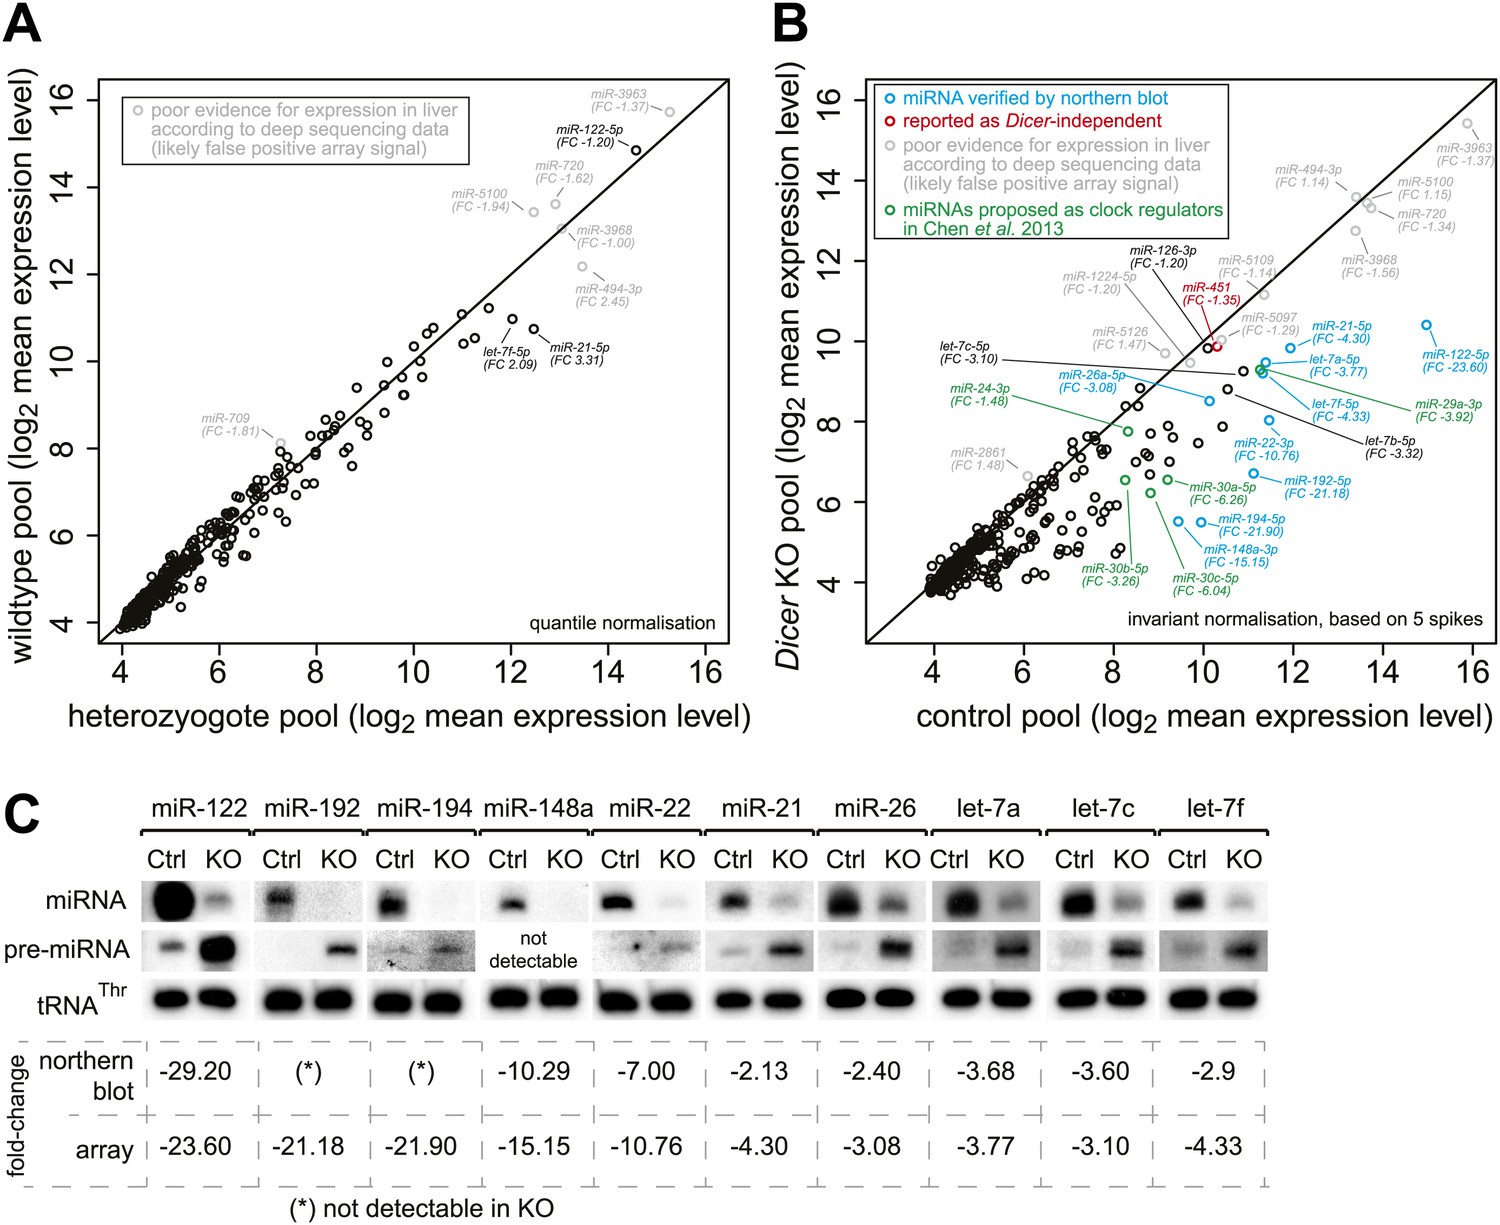
Global analysis of miRNA depletion in Dicer knockout livers.
(A) miRNA microarray analysis of wild-type vs heterozygote knockout liver RNA shows that a single functional copy of Dicer is sufficient to process miRNAs to wild-type levels. No significantly different miRNA species was detected (FDR-corrected for multiple testing). The seemingly highly expressed miRNAs labelled in grey correspond to probes that consistently give signal on the microarrays, but whose expression is dubious as they are not detectable in liver small RNA-seq and thus may rather represent false positive signals from the array. (B) miRNA microarray analysis of knockout vs control liver RNA shows that miRNAs are globally downregulated in the knockout. Pools over all time points from the RNA-seq series were used. The apparently highly expressed and unchanged miRNAs labelled in grey correspond to probes that consistently give signal on the microarrays, but whose expression is doubtful as they are not detectable in liver small RNA-seq and thus may rather represent false positive signals from the array. miRNAs in blue were confirmed by northern blot in (C), miRNAs in green are those proposed by Chen et al. (2013) to be regulators of Per1 and Per2. miR-451 (red) has been reported for its Dicer-independent processing (‘Discussion’). Known hepatocyte-enriched miRNAs (e.g., miR-122, miR-148a, miR-192 and miR-194) were thus virtually undetectable in knockouts. Known ubiquitous miRNAs (e.g., miR-21, miR-26a, or let-7 family members) decreased less strongly, probably owing to their expression also in non-hepatocyte cells, which make up ca. 20% of the liver. miRNAs with a particularly strong expression in non-hepatocytes (e.g., miR-126 in hepatic stellate cells) were almost unchanged (see main text). Quantile normalisation used for microarrays in (A) and invariant normalisation for (B). FC, fold-change difference. (C) Northern blots using the same RNA pools as in (B) confirm the downregulation of miRNAs, which is accompanied by higher pre-miRNA levels. Values below the northern blots show how their quantification compares to the microarrays. See (B) for comments on liver cell-type specific expression.
Figure 2 with 3 supplements
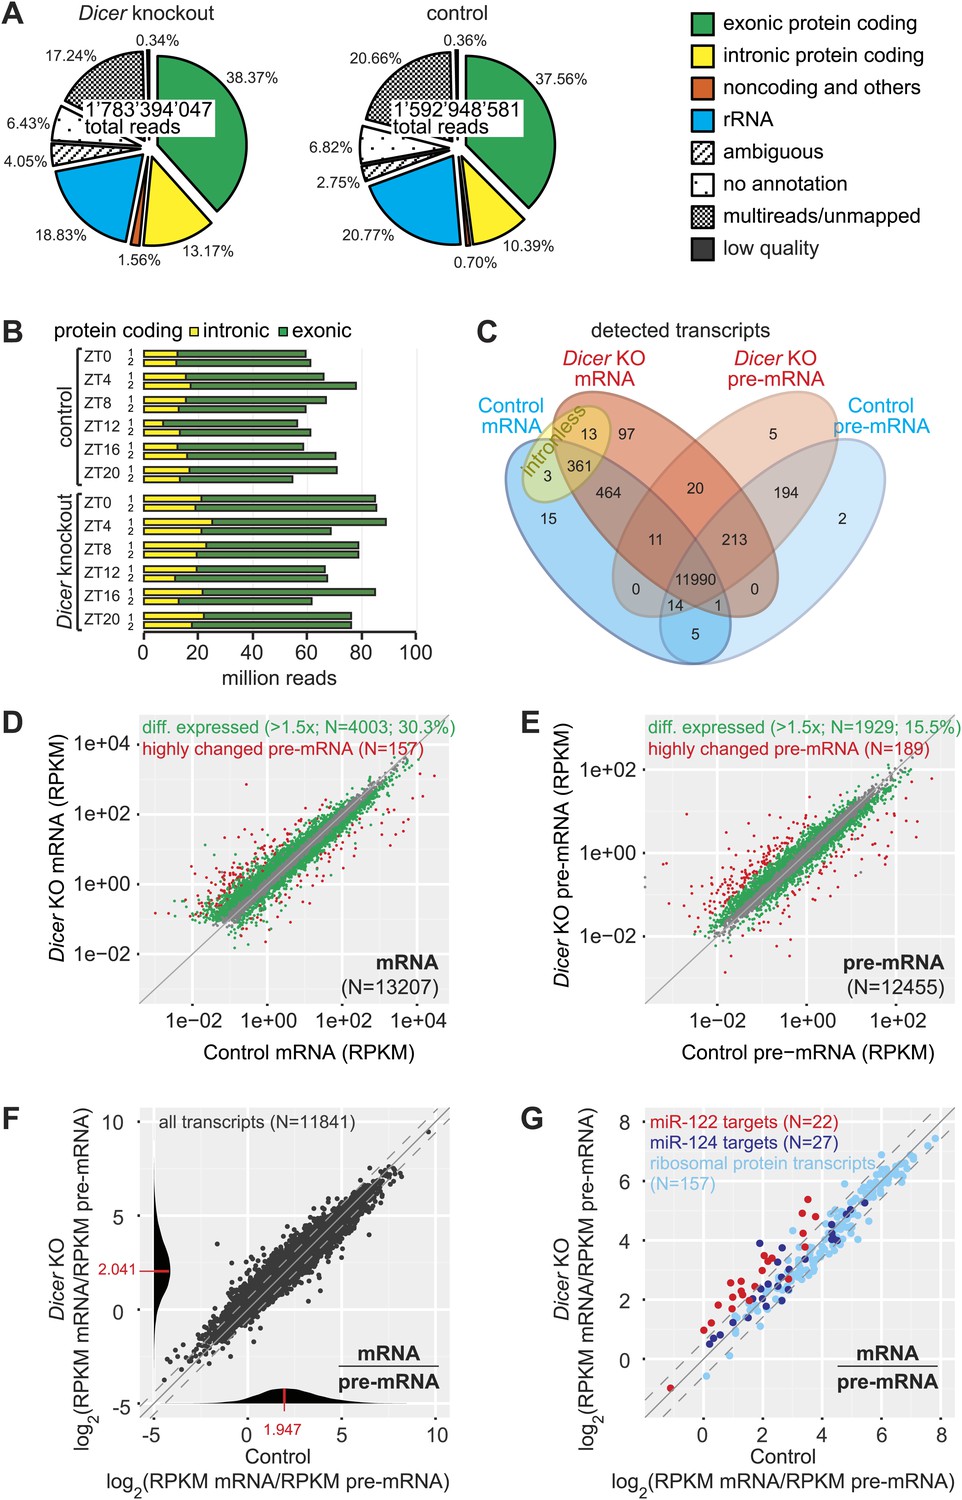
Genome-wide quantification of pre-mRNA and mRNA abundance by RNA-seq.
(A) Summary of RNA-seq results from Dicer KO (left) and control (right). Percentages are relative to total reads across all time points. (B) Time-resolved analysis of intron- (yellow) and exon-mapping (green) RNA-seq reads in the two series of knockout and control mice. (C) Venn diagram indicating the number of genes whose expression was detectable in Dicer knockout and control animals on the mRNA (exon) and pre-mRNA (intron) levels (threshold: 0.1 RPKM for mRNA, 0.01 RPKM for pre-mRNA in at least 1/3 of samples). (D) Comparison of mRNA expression (RPKM) of protein coding genes in Dicer knockouts vs controls (averaged over all time points). Green dots correspond to transcripts whose levels are statistically significantly >1.5-fold different between genotypes and considered as differentially expressed. The red mRNAs are highly different on the transcriptional (pre-mRNA) level and were excluded from circadian analyses; see (E). (E) Comparison of pre-mRNA expression (RPKM) of protein coding genes in Dicer knockouts vs controls. Green dots correspond to transcripts whose levels are statistically significantly >1.5-fold different between genotypes and considered as differentially expressed. Red dots correspond to genes with higher pre-mRNA fold-change than the 90% quantile of differentially expressed pre-mRNAs (corresponding to >4.1-fold expression differences between knockout and control); due to the highly different transcription rates, they were excluded from circadian analyses. (F) Analysis of transcriptome-wide mRNA/pre-mRNA ratios (as a measure of mRNA stability) between Dicer knockouts and controls. Note that in the Dicer KO, mRNAs become globally more stable (modes of distributions indicated in red). (G) mRNA/pre-mRNA ratio changes are predictive for direct miRNA targets. Known targets of liver-specific miR-122 (red) thus have overall increased mRNA/pre-mRNA ratios in the knockout, in contrast to targets of miR-124 (dark blue), which is not expressed in liver. Transcripts encoding ribosomal proteins (pale blue) seem to be overall excluded from miRNA regulation, as expected.
-
Figure 2—source data 1
RNA-seq read statistics.
- https://doi.org/10.7554/eLife.02510.007
Figure 2—figure supplement 1
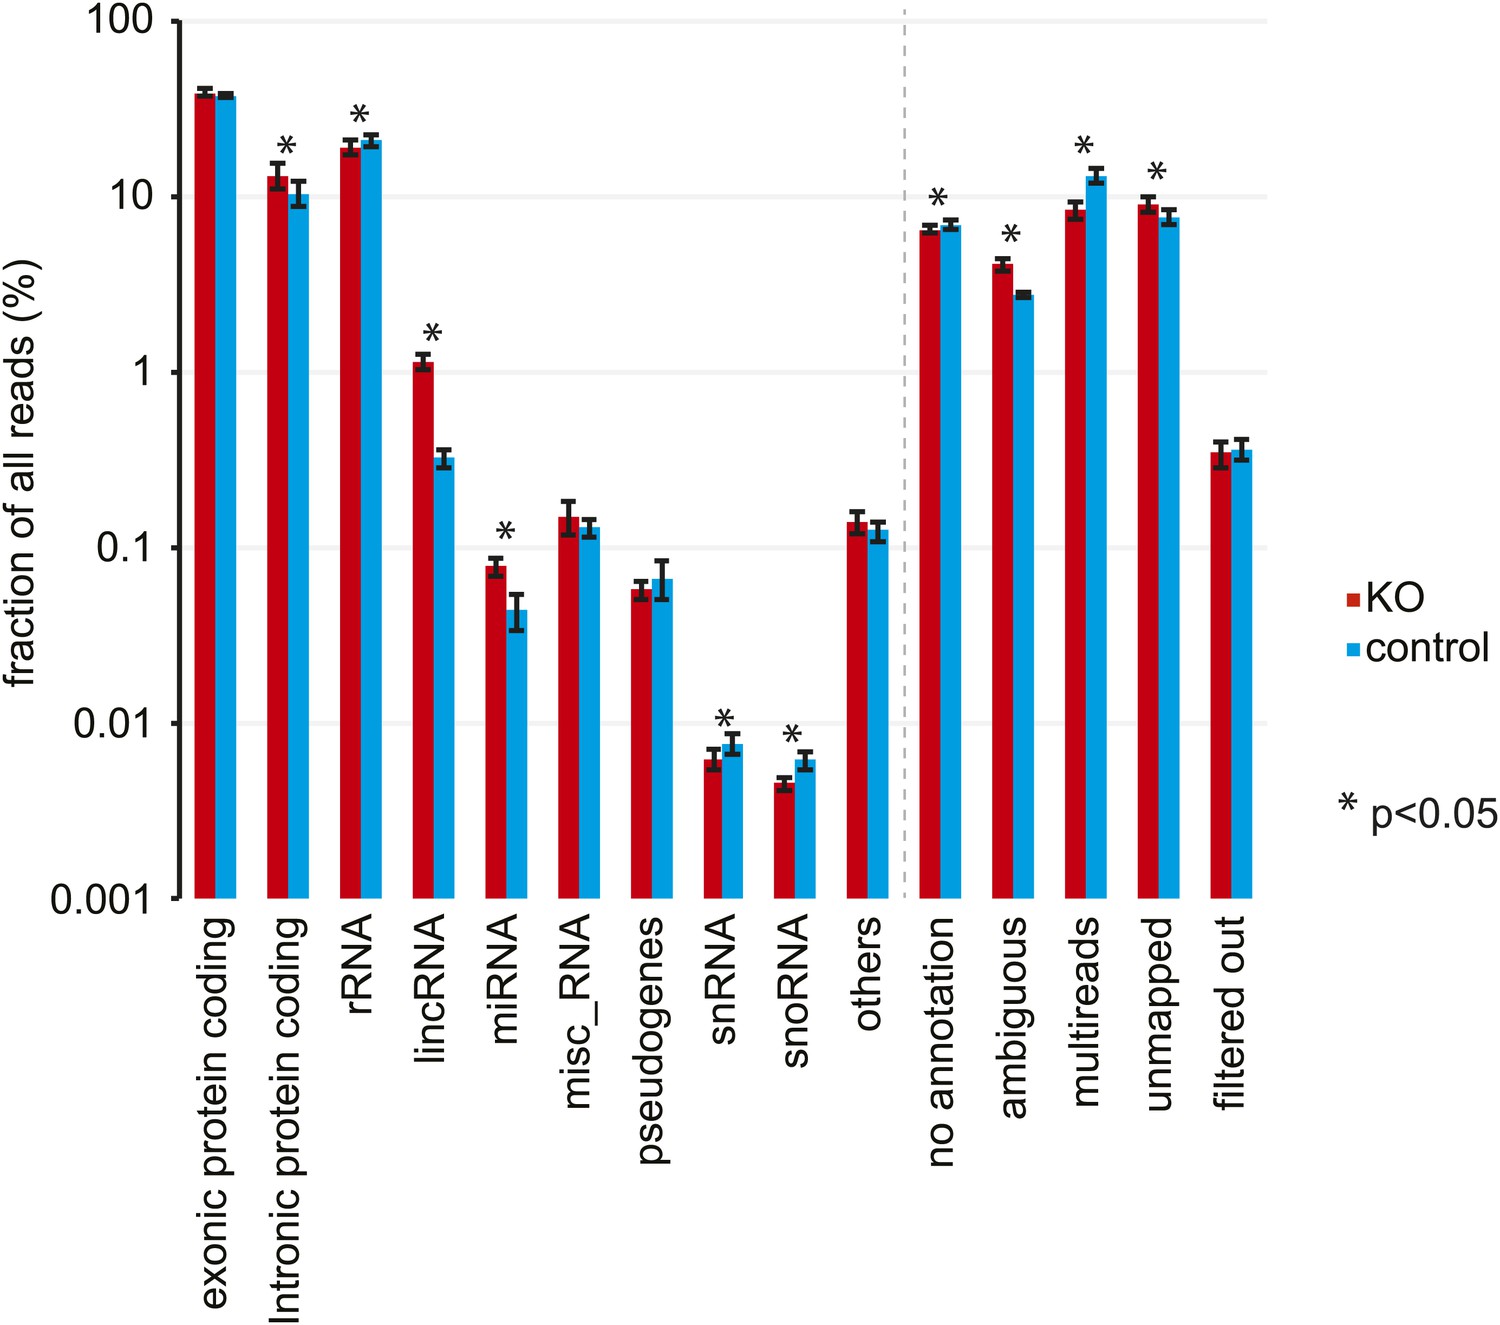
Analysis of RNA-seq data by RNA classes.
Distribution of RNA-seq reads in Dicer knockout (red) and control mice (blue) to different RNA classes. Percentages represent mean ± standard deviation across the 12 samples per genotype. Significant differences (p<0.05, student's t test) are indicated. See Figure 2—source data 1 for exact numbers.
Figure 2—figure supplement 2
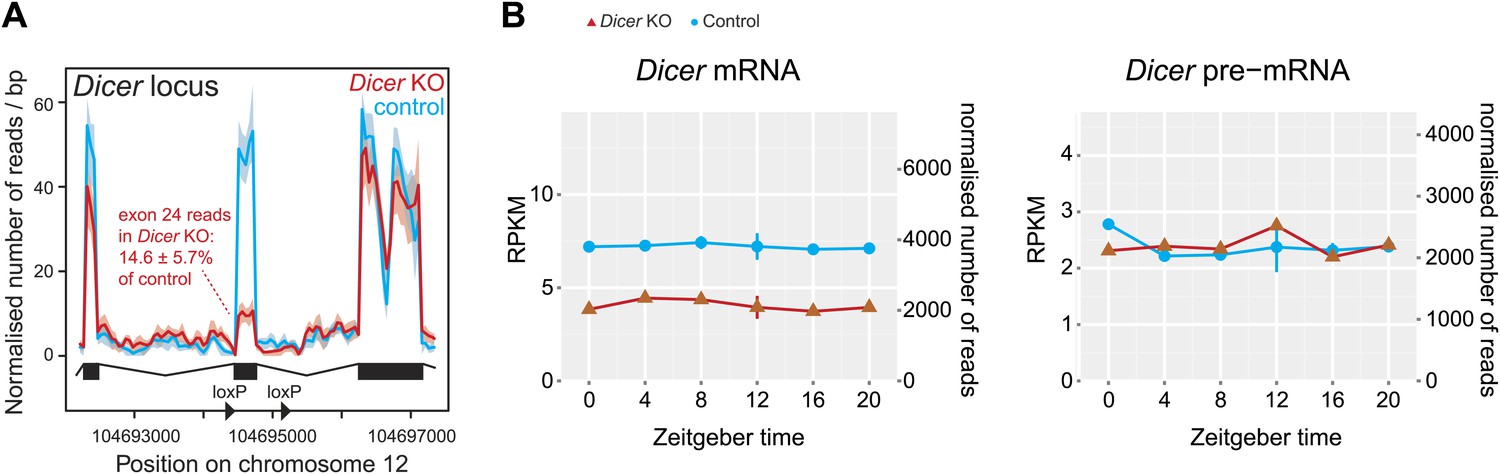
Reads mapping to the Dicer locus confirm high knockout efficiency.
(A) Distribution of RNA-seq reads in knockouts (red) and controls (blue) across the portion of the Dicer locus that carries the loxP-flanked exon 24, which contains part of the catalytic domain of Dicer (Harfe et al., 2005). The quantification of reads shows that in Dicer knockout livers, exon 24 has 14.6 ± 5.7% of the read level of control. Given that hepatocytes make up ca. 80% of the liver, this means that the knockout in these cells must be close to 100%. (B) Expression plots of Dicer mRNA (left panel) and pre-mRNA (right panel) in Dicer knockouts (red) and control (blue). The two time series are plotted together in the same graph (vertical lines connect the data points from the two series). Abscissas show Zeitgeber Time, left ordinates RPKM values, right ordinates raw read number only normalised to sequencing depth in the samples. Since exon 24 that is deleted after knockout induction is relatively short, reads accumulated over the whole locus on the pre-mRNA level barely change and reads on the mRNA level drop to ca. 50%. Note that Dicer expression is non-circadian in liver.
Figure 2—figure supplement 3
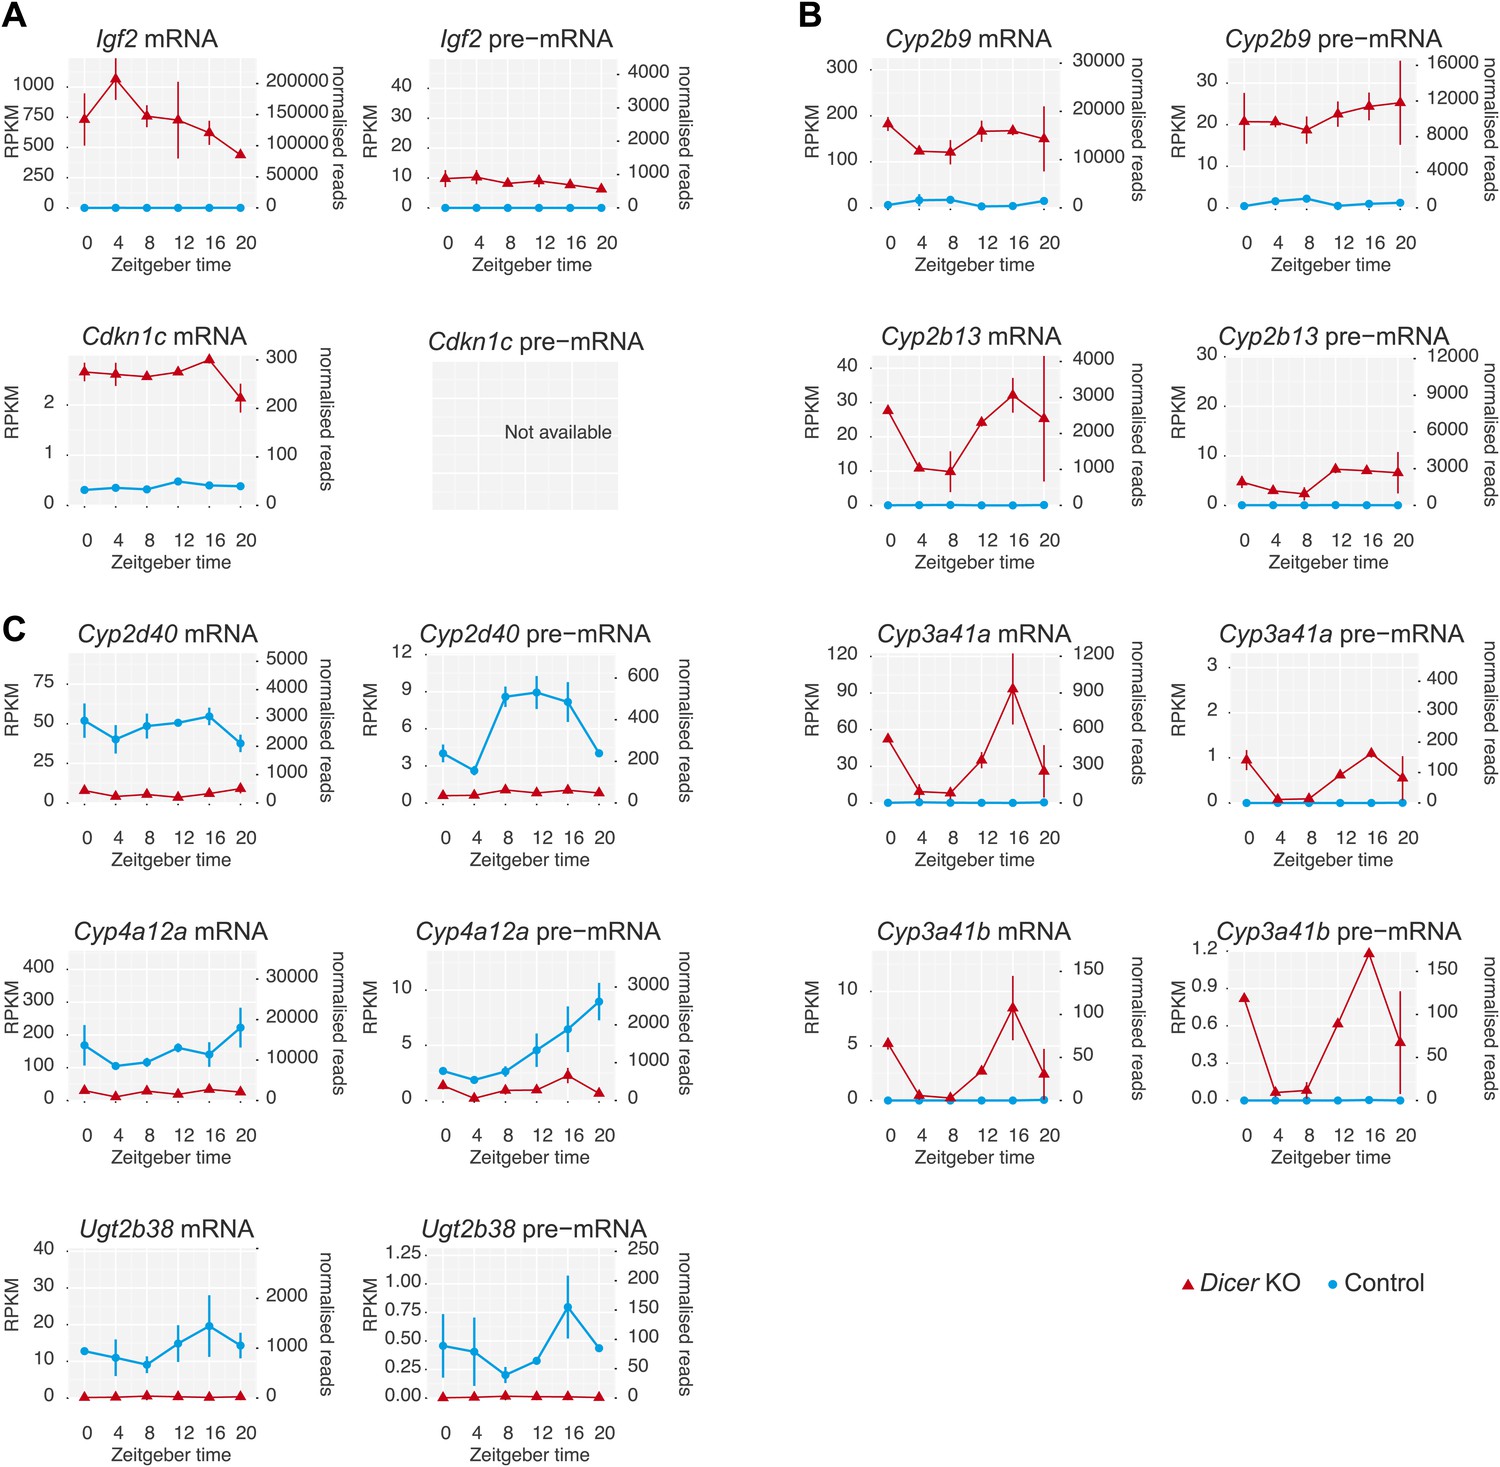
Several genes show extreme transcriptional changes in Dicer knockouts.
(A) A number of genes showed strikingly different transcription in Dicer knockouts, including several imprinted loci such as Igf2 or Cdkn1c. (B) Strong up-regulation was observed for a group of genes known for their development-specificity and sexual dimorphism with usually low expression in adult male livers, such as certain members of the cytochrome P450 (Cyp) superfamily (Wiwi et al., 2004; Buckley and Klaassen, 2009), for example Cyp2b9, Cyp2b13, Cyp3a41a and Cyp3a41b. (C) Conversely, several male-specific transcripts were strongly downregulated, for example Cyp2d40, Cyp4a12a, Ugt2b38. These gene expression signatures have previously been reported from Dicer knockouts and could indicate that hepatocytes turn to a more fetal-like state upon miRNA loss (Hand et al., 2009; Sekine et al., 2009a).
Figure 3 with 1 supplement
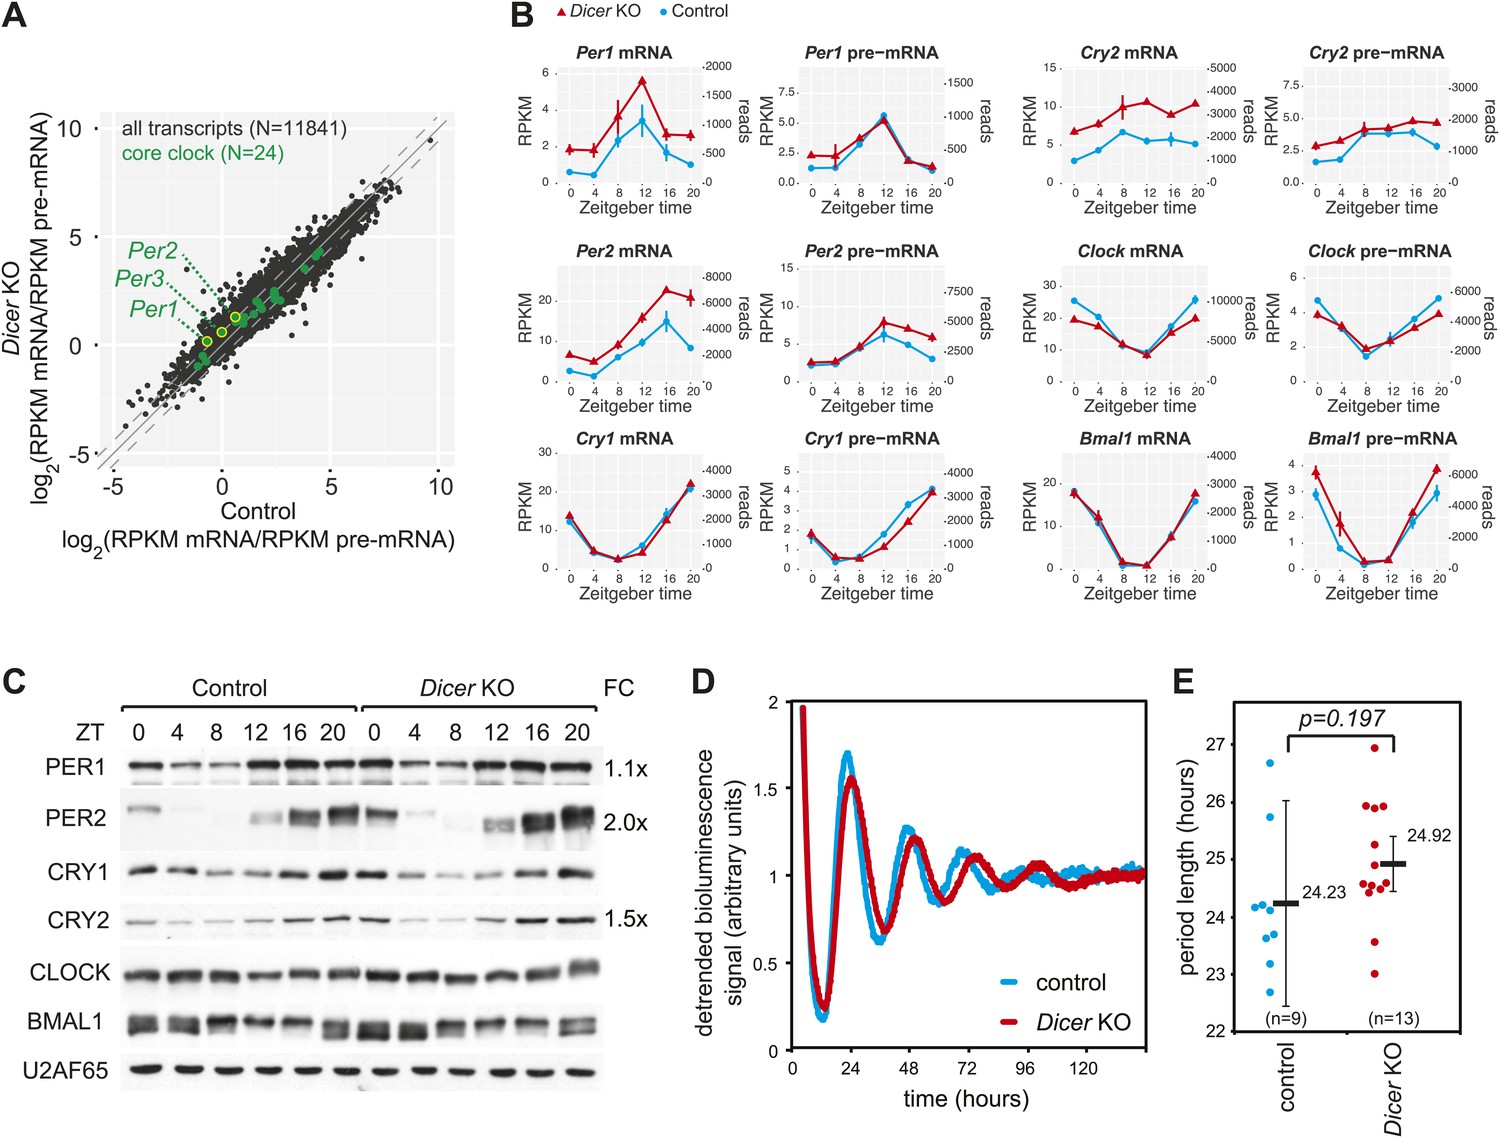
The hepatic core clock is remarkably resilient to miRNA loss.
(A) mRNA/pre-mRNA ratio analysis of core clock transcripts indicates that Per1, Per2, and Per3 have a significantly increased ratio in Dicer knockouts. (B) Time-resolved RNA-seq data for selected core clock transcripts with Dicer knockouts (red), controls (blue), mRNA (left panels), pre-mRNA (right panels), and the two time series plotted together in the same graph (vertical lines connect the data points from the two series). Abscissas show Zeitgeber Time, left ordinates RPKM values, right ordinates raw read numbers only normalised to sequencing depth in the samples. Per1, Per2, and Cry2 thus show post-transcriptional upregulation in the Dicer KO, but other core clock transcripts such as Clock, Bmal1 and Cry1 do not. (C) Western blot analysis of core clock protein expression in liver nuclear extracts. For each sample, liver nuclear extracts from three mice were pooled. U2AF65 served as a loading control. Quantfication revealed that in the knockout the fold-change (FC) of up-regulation was ca. 2x for PER2 protein, 1.5x for CRY2, and 1.1x for PER1. Overall, the core clock appears to be fully functional. (D) Example of free-running rhythms measured from liver explants of Dicer knockout and control animals carrying the mPer2Luc reporter gene. In these mice, a PER2-LUCIFERASE fusion protein is expressed from the endogenous Per2 locus and allows for the real-time recording of circadian bioluminescence rhythms; importantly, the mPer2Luc 3′ UTR is identical to that of wild-type Per2. Raw bioluminescence was detrended using a 24-hr moving average. In this example, the knockout has a clearly longer period than the control. (E) Summary of several experiments as in (D) from a total of 9 control and 13 knockout mice. Although there is a trend to period lengthening upon miRNA loss, this effect is statistically not significant (p=0.197; student's t test).
-
Figure 3—source data 1
Core clock genes.
- https://doi.org/10.7554/eLife.02510.012
Figure 3—figure supplement 1
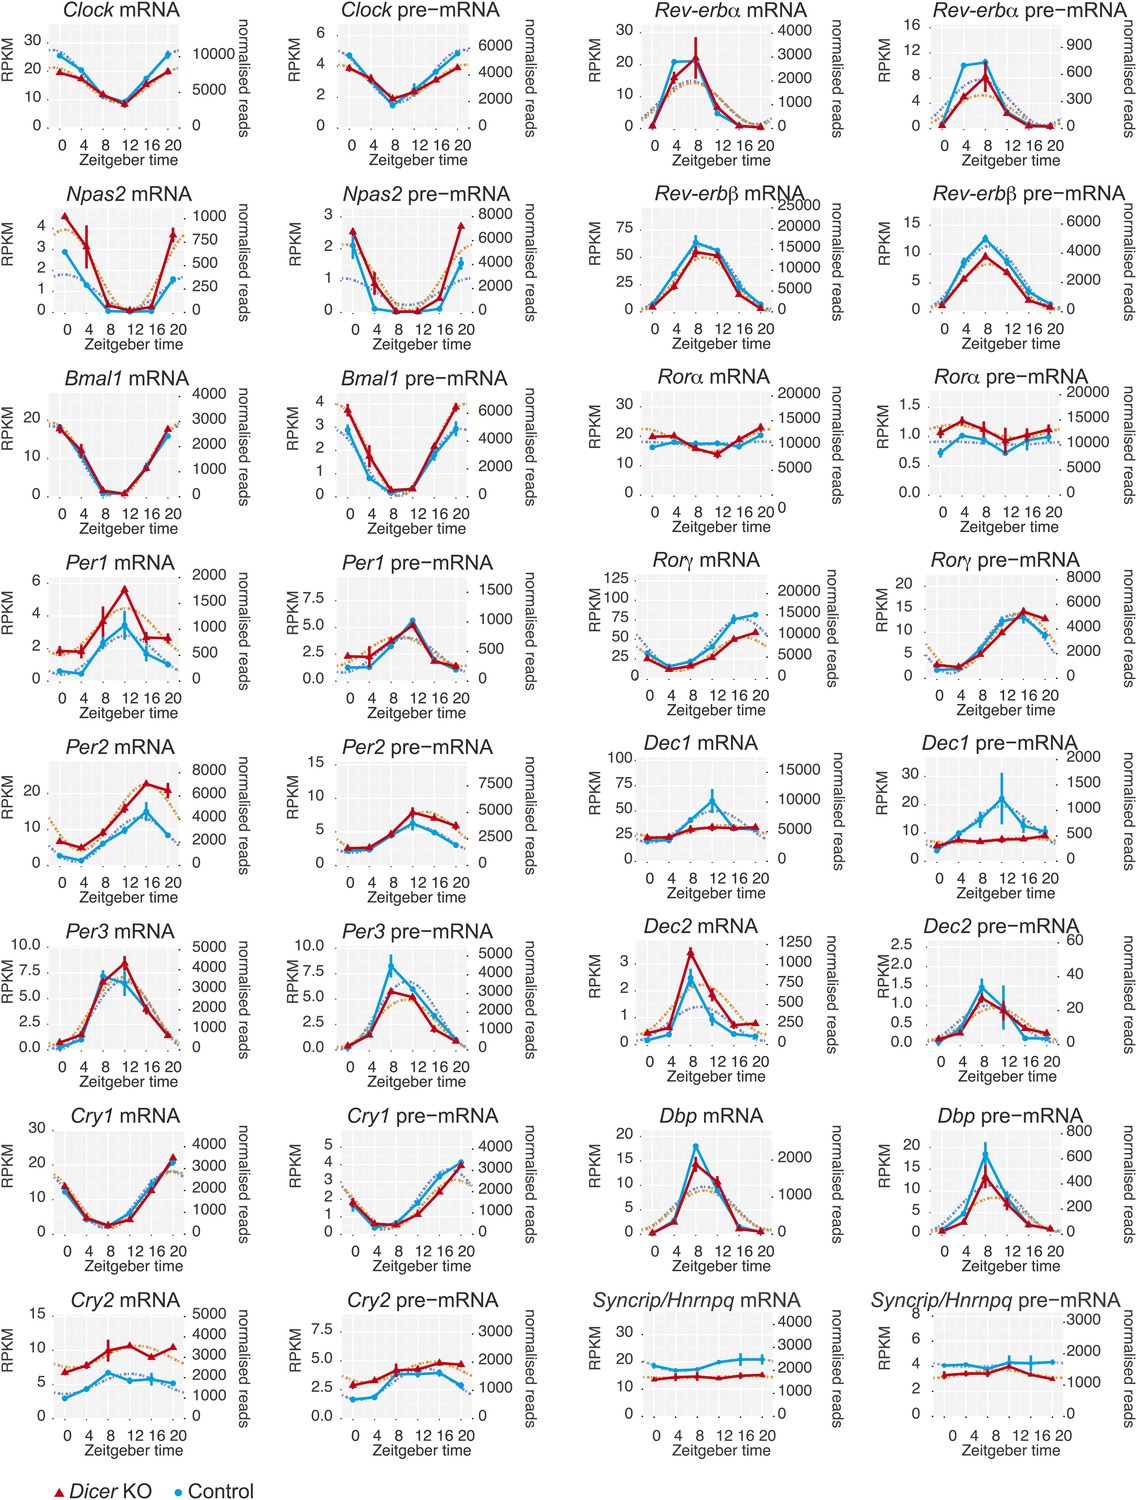
Core clock gene expression in Dicer knockouts.
Apart from Per1, Per2, and Cry2, core clock gene expression shows very little post-transcriptional changes upon miRNA loss, indicating that these transcripts are not miRNA targets in the liver. Note that some transcripts show transcriptional alterations, for example Nr1d1/Rev-erbα or Dec1. Syncrip/Hnrnpq encodes an RNA binding protein involved in Per1 translation whose down-regulation may contribute to the discrepancy between Per1 mRNA and protein (see main text for details). Dotted lines respresent cosine curve fits to the data.
Figure 4 with 5 supplements
miRNAs may drive the rhythmic accumulation of a small set of transcripts.
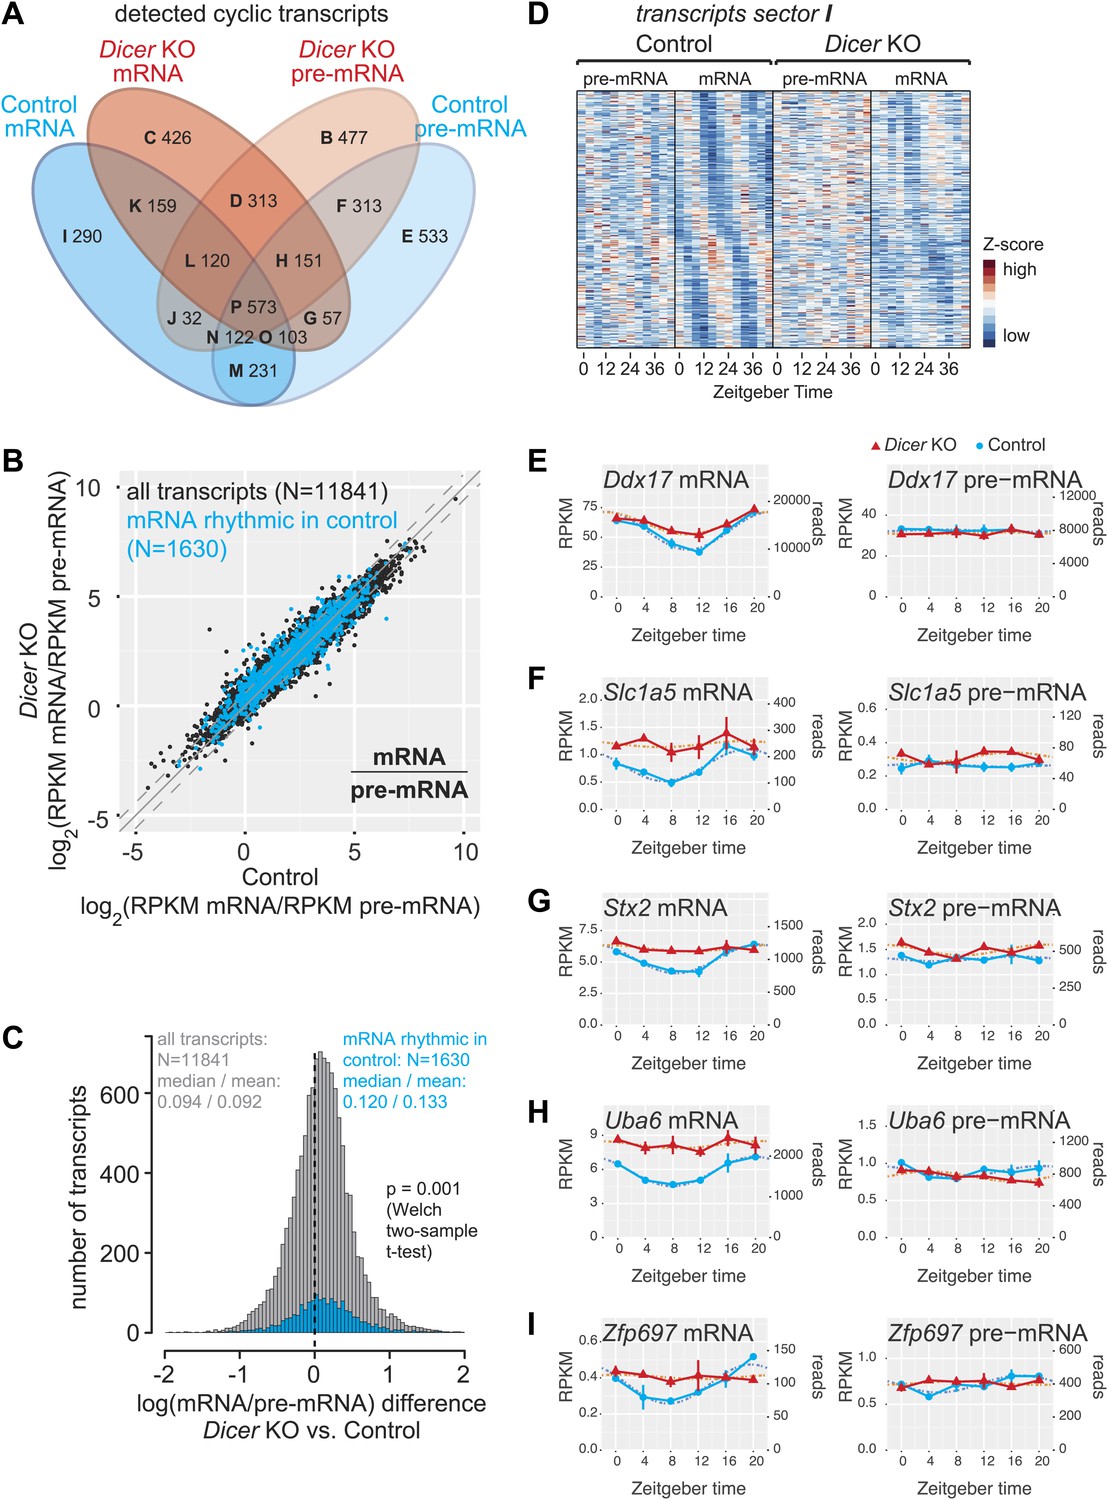
(A) Venn diagram summarising the extent of rhythmicity detected on all levels, that is mRNA and pre-mRNA in Dicer KO and control. A 1.5-fold threshold on peak-to-trough ratio amplitudes estimated from cosine fits was imposed. Sectors are named B–I for further reference. Sector A (not shown) corresponds to transcripts that were not rhythmic on any level. (B) mRNA/pre-mRNA ratio analysis for all transcripts that were detected as rhythmic in control (N = 1630). Globally, rhythmic transcripts thus appear to distribute similarly to all transcripts. (C) The distribution of the change in mRNA/pre-mRNA ratio between Dicer knockout and control is globally similar for rhythmic transcripts as compared to all transcripts. Although there is a slight statistically significant upshift in the cyclic transcripts (p=0.001, Welch two-sample t test), rhythmic transcripts do not seem to be specifically enriched for or excluded from miRNA regulation. (D) Heatmap of sector I transcripts, for which rhythmicity is only detected on the level of the mRNA in control animals. Note that although rhythms are clearly most pronounced for control mRNAs, as expected, the visual impression is that there are still underlying, but noisier rhythms present on the pre-mRNA level and in Dicer knockouts. pre-mRNAs (knockout and control) are on a common scale, as are the mRNAs. (E–I) Ddx17, Slc1a5, Stx2, Uba6 and Zpf697 are examples of transcripts that are transcriptionally non-rhythmic, but show mRNA rhythms that are Dicer-dependent, indicating that miRNAs could be involved in driving their post-transcriptional cycling. Note that all examples have relatively shallow rhythmic amplitudes. Interestingly, their rhythms fall into a similar phase, which could indicate that a common (rhythmic) miRNA could be involved. Dicer knockouts are shown in red, control in blue, mRNAs are on panels to the left, pre-mRNAs to the right; the two time series are plotted together in the same graph (vertical lines connect the data points from the two series). Abscissas show Zeitgeber Time, left ordinates RPKM values, right ordinates raw read number only normalised to sequencing depth in the samples. Dotted lines are the cosine fits to the data.
-
Figure 4—source data 1
Rhythm parameters transcriptome-wide.
- https://doi.org/10.7554/eLife.02510.015
-
Figure 4—source data 2
GO term analysis Dicer rhythmic transcripts.
- https://doi.org/10.7554/eLife.02510.016
Figure 4—figure supplement 1
Transcriptome-wide rhythmicity detection in Dicer knockouts and controls.
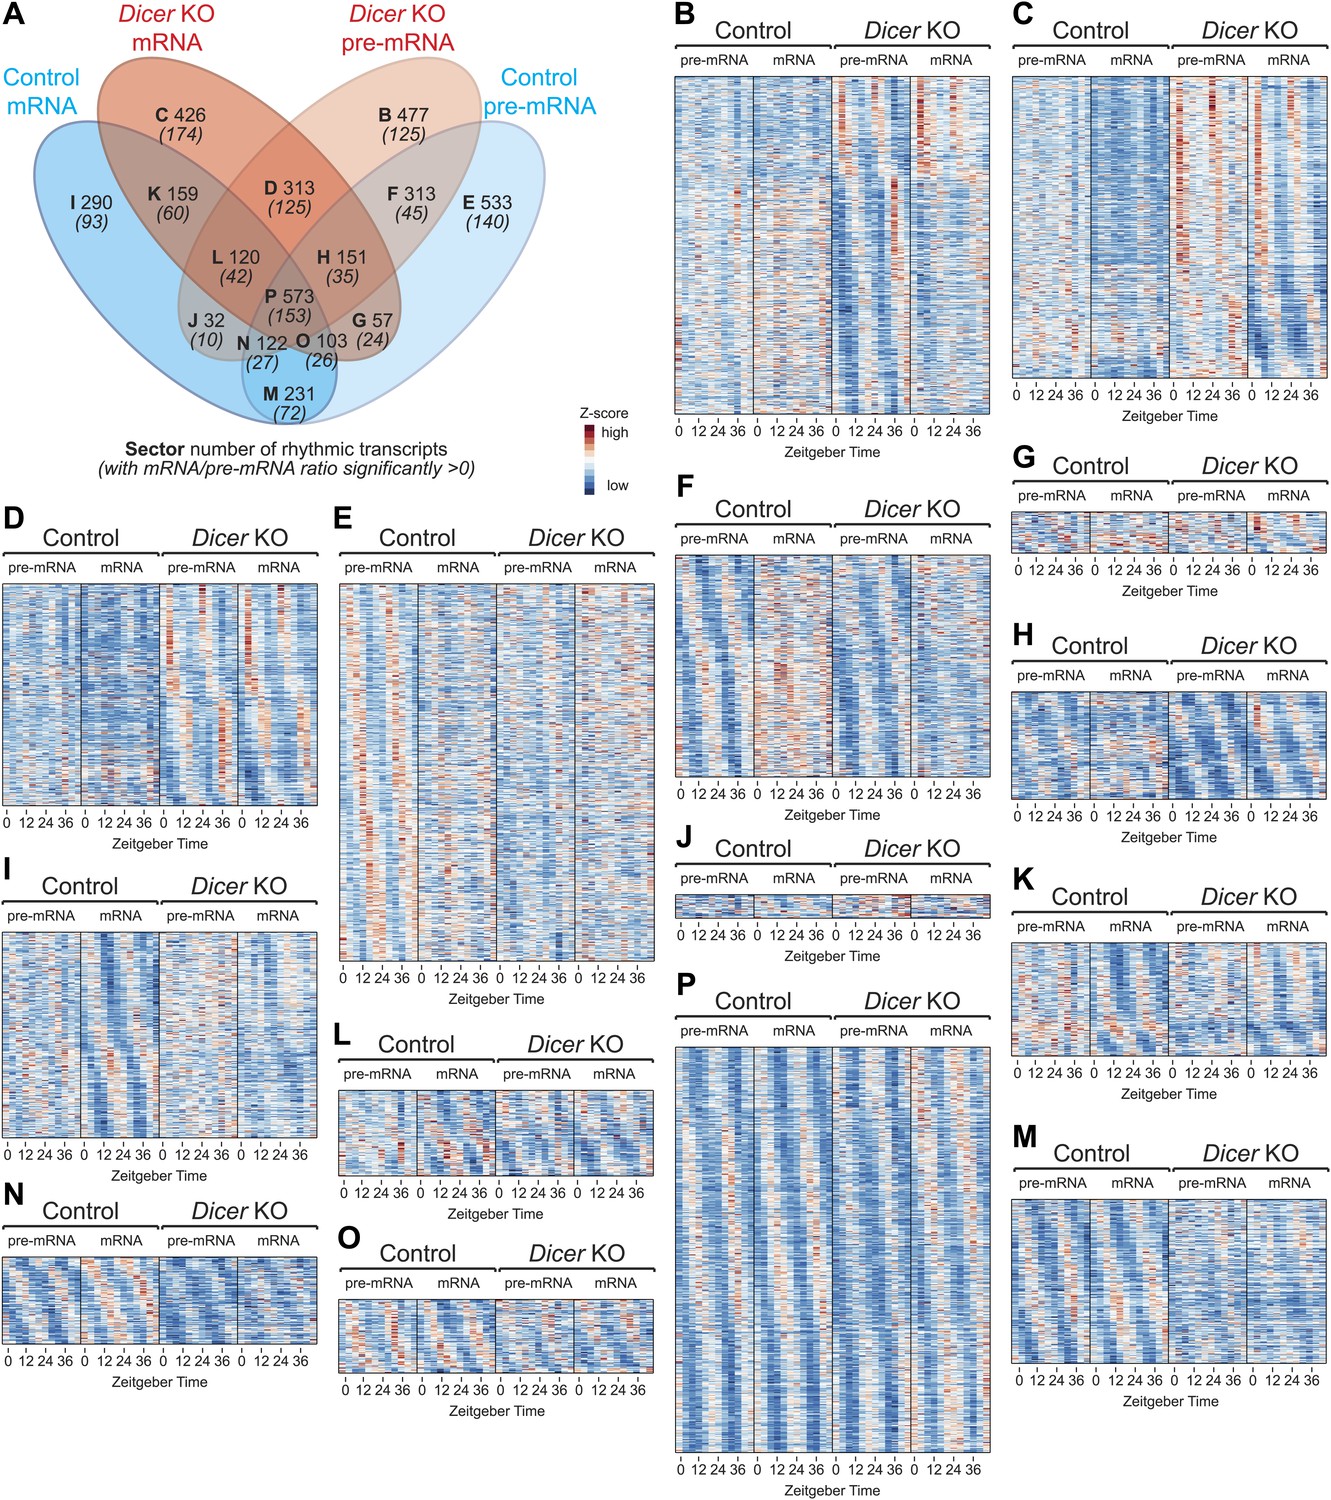
(A) Venn diagram summarising the extent of rhythmicity detected at all levels, that is mRNA and pre-mRNA in Dicer KO and control. A 1.5-fold threshold on peak-to-trough ratio amplitude estimated from cosine fits was imposed. Numbers in brackets and italics refer to how many of the transcripts found in the sector also have significantly increased mRNA/pre-mRNA ratios in Dicer knockouts. (B–P) Heatmaps for transcripts found in sectors B to P. Scales are independent for each panel; however, for each individual heatmap, pre-mRNAs (knockout and control) are on a common scale, as are the mRNAs, and can thus be directly compared.
Figure 4—figure supplement 2
Differences in detected rhythmic transcripts between Dicer knockout and control are not caused by too low stringency rhythm detection.
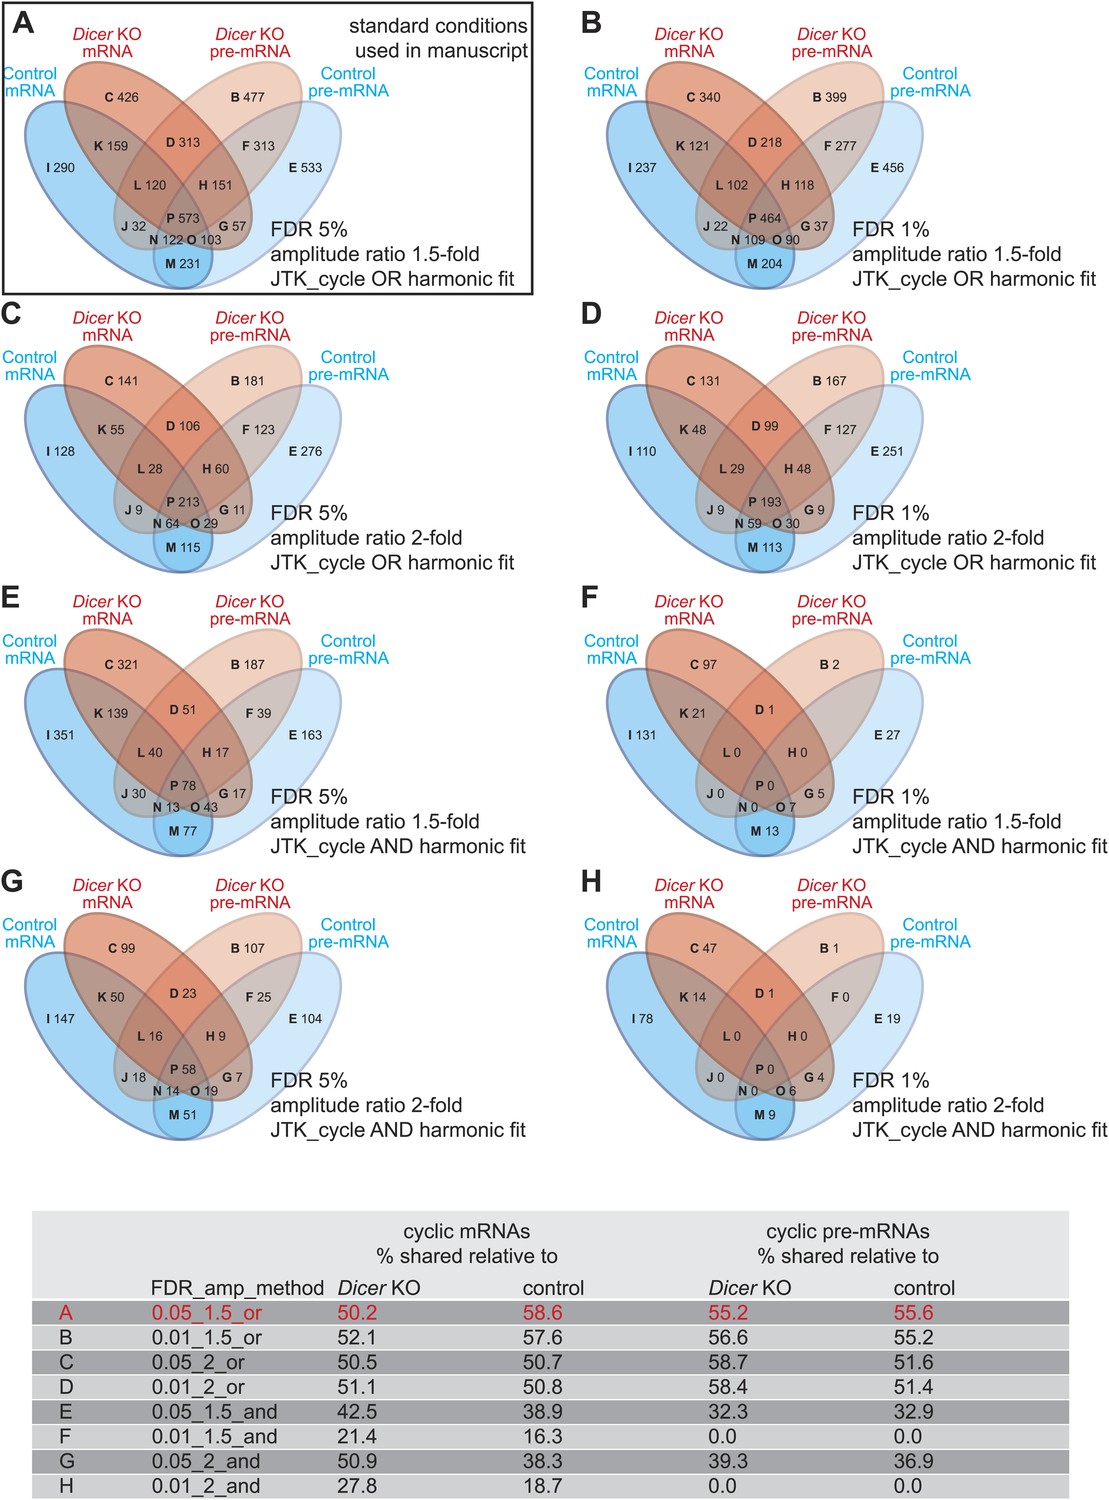
(A–H) Venn diagrams summarising the extent of rhythmicity detected on all levels, that is mRNA and pre-mRNA in Dicer KO and control, using different parameters for rhythm detection. Variables were: FDR (0.05 vs 0.01), amplitude ratio (1.5- vs 2-fold) and the combination of two methods, JTK_cycle and harmonic fit as an AND or OR operation. The conditions shown under (A) are those used throughout the manuscript. The numbers in the Venn diagram segments and those in the summarising table below indicate that the relatively poor overlap between rhythmic events in the two genotypes is not caused by the comparably low stringency of rhythm detection applied in the study—on the contrary, higher stringency (i.e., decreasing FDR, imposing higher amplitudes, or only taking into account transcripts whose rhythm is detected by both methods, JTK_cylce AND the harmonic fit) leads in some cases even to lower percentages in shared rhythmic transcripts.
Figure 4—figure supplement 3
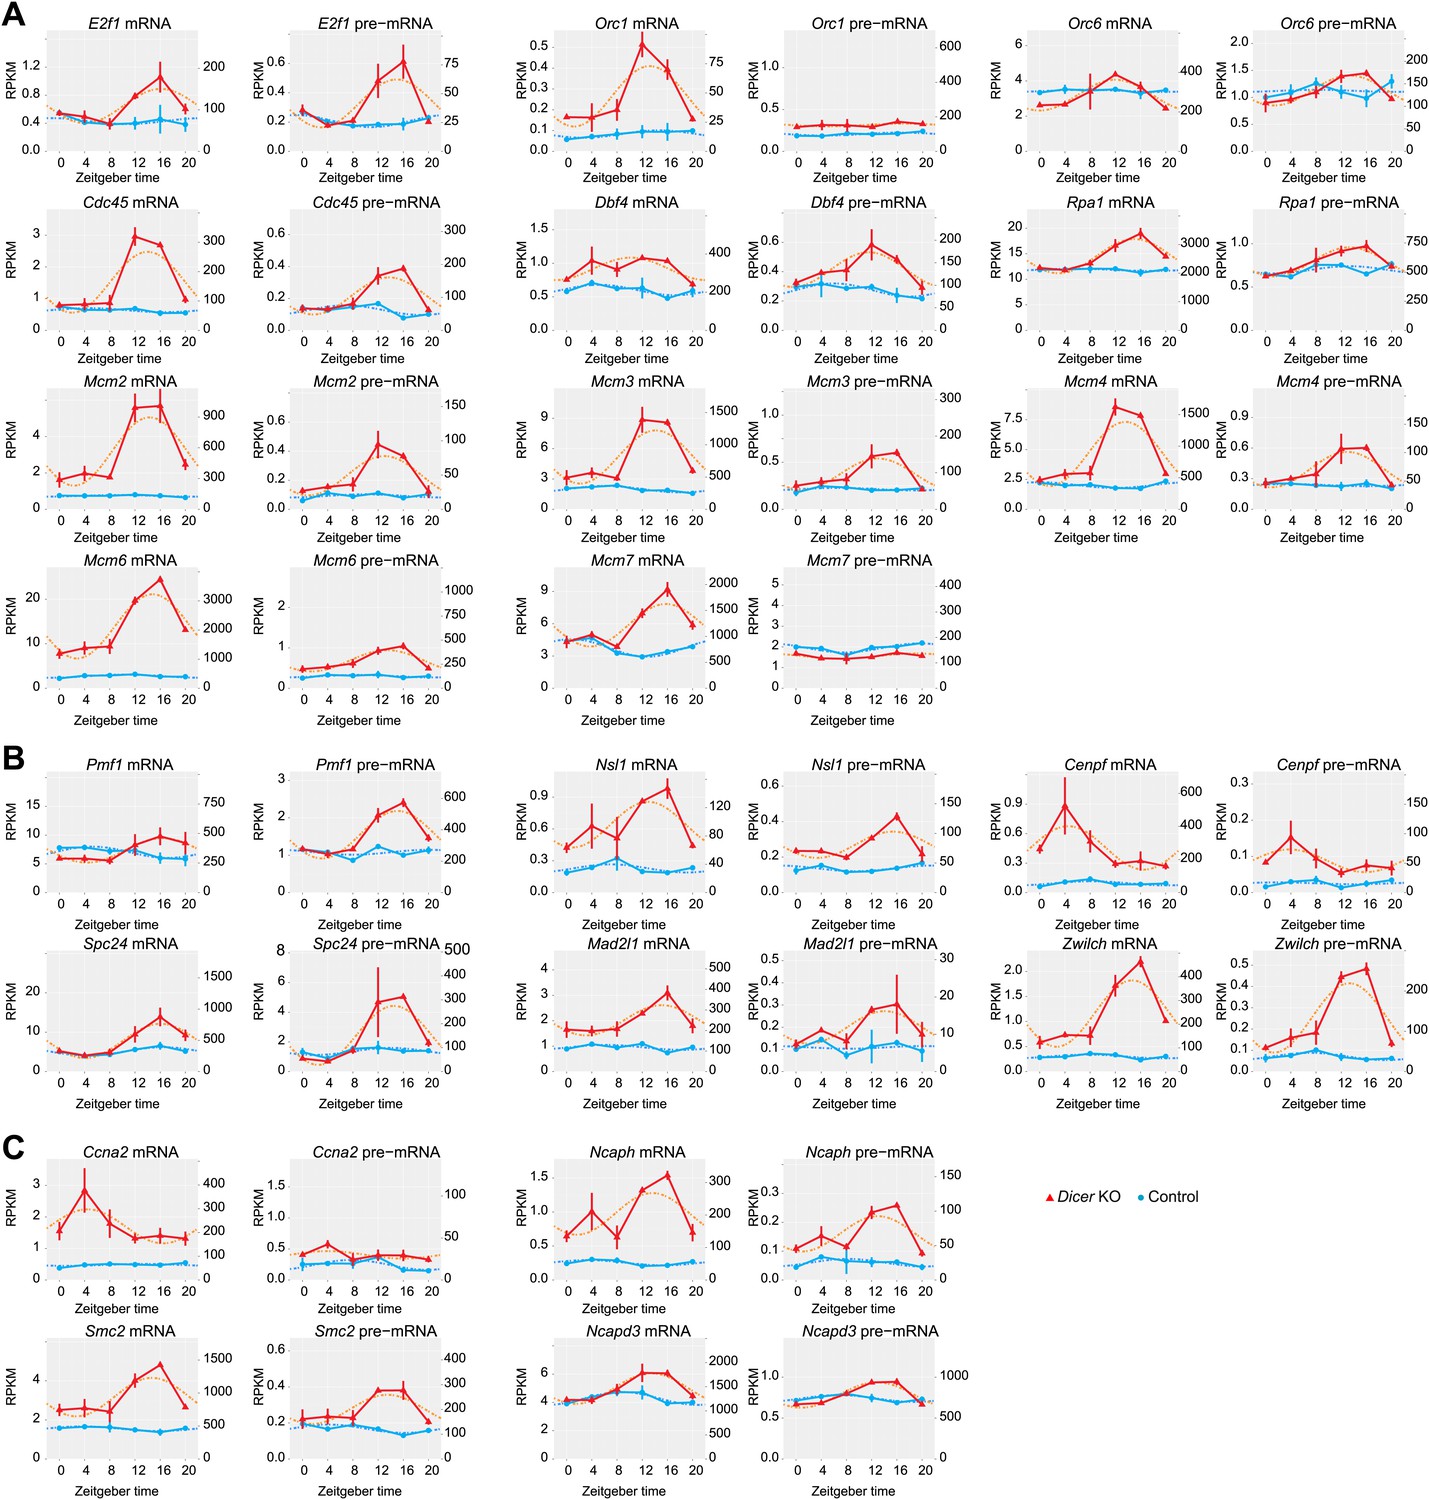
The expression of genes linked to the cell cycle/DNA replication becomes rhythmic in Dicer knockout livers.
Likely due to the higher cellular turnover and regeneration rate in Dicer knockout livers, the expression of many genes involved in the regulation of the cell cycle is increased and their rhythms are more pronounced. (A) Many genes encoding proteins involved in the initiation of DNA replication, especially members of the MCM complex, are up-regulated and become rhythmic in Dicer knockouts. (B) Components of the metaphase checkpoint show rhythms in Dicer knockouts. (C) Several genes that are required for chromosome condensation have rhythmic transcripts in Dicer knockouts.
Figure 4—figure supplement 4
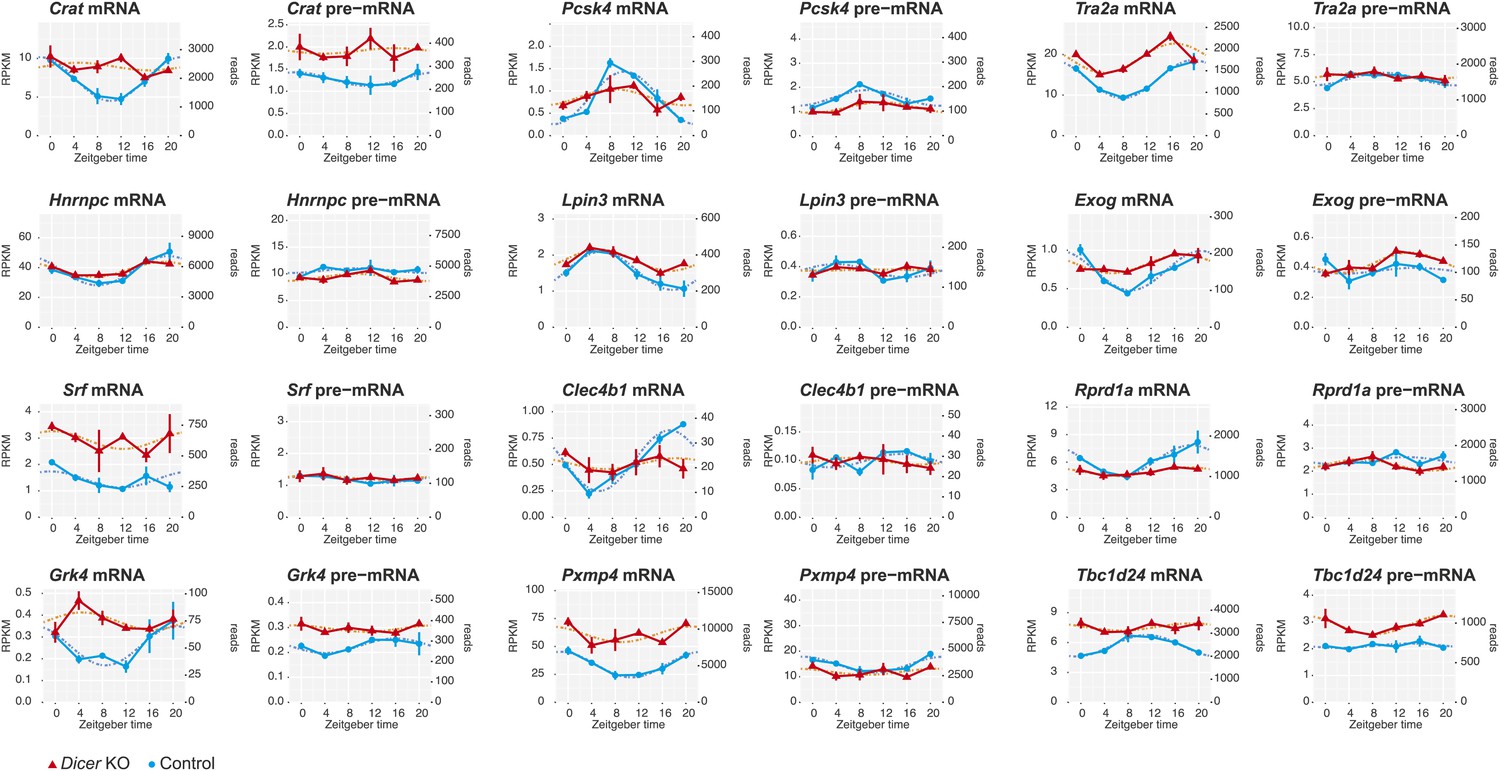
miRNAs as potential drivers of rhythmic mRNA accumulation.
Shown are further examples (next to those in Figure 4) of transcripts that are transcriptionally non-rhythmic, but show mRNA rhythms that are Dicer-dependent, indicating that miRNAs could be involved in driving their post-transcriptional cycling. Note that these transcripts have relatively shallow rhythmic amplitudes.
Figure 4—figure supplement 5
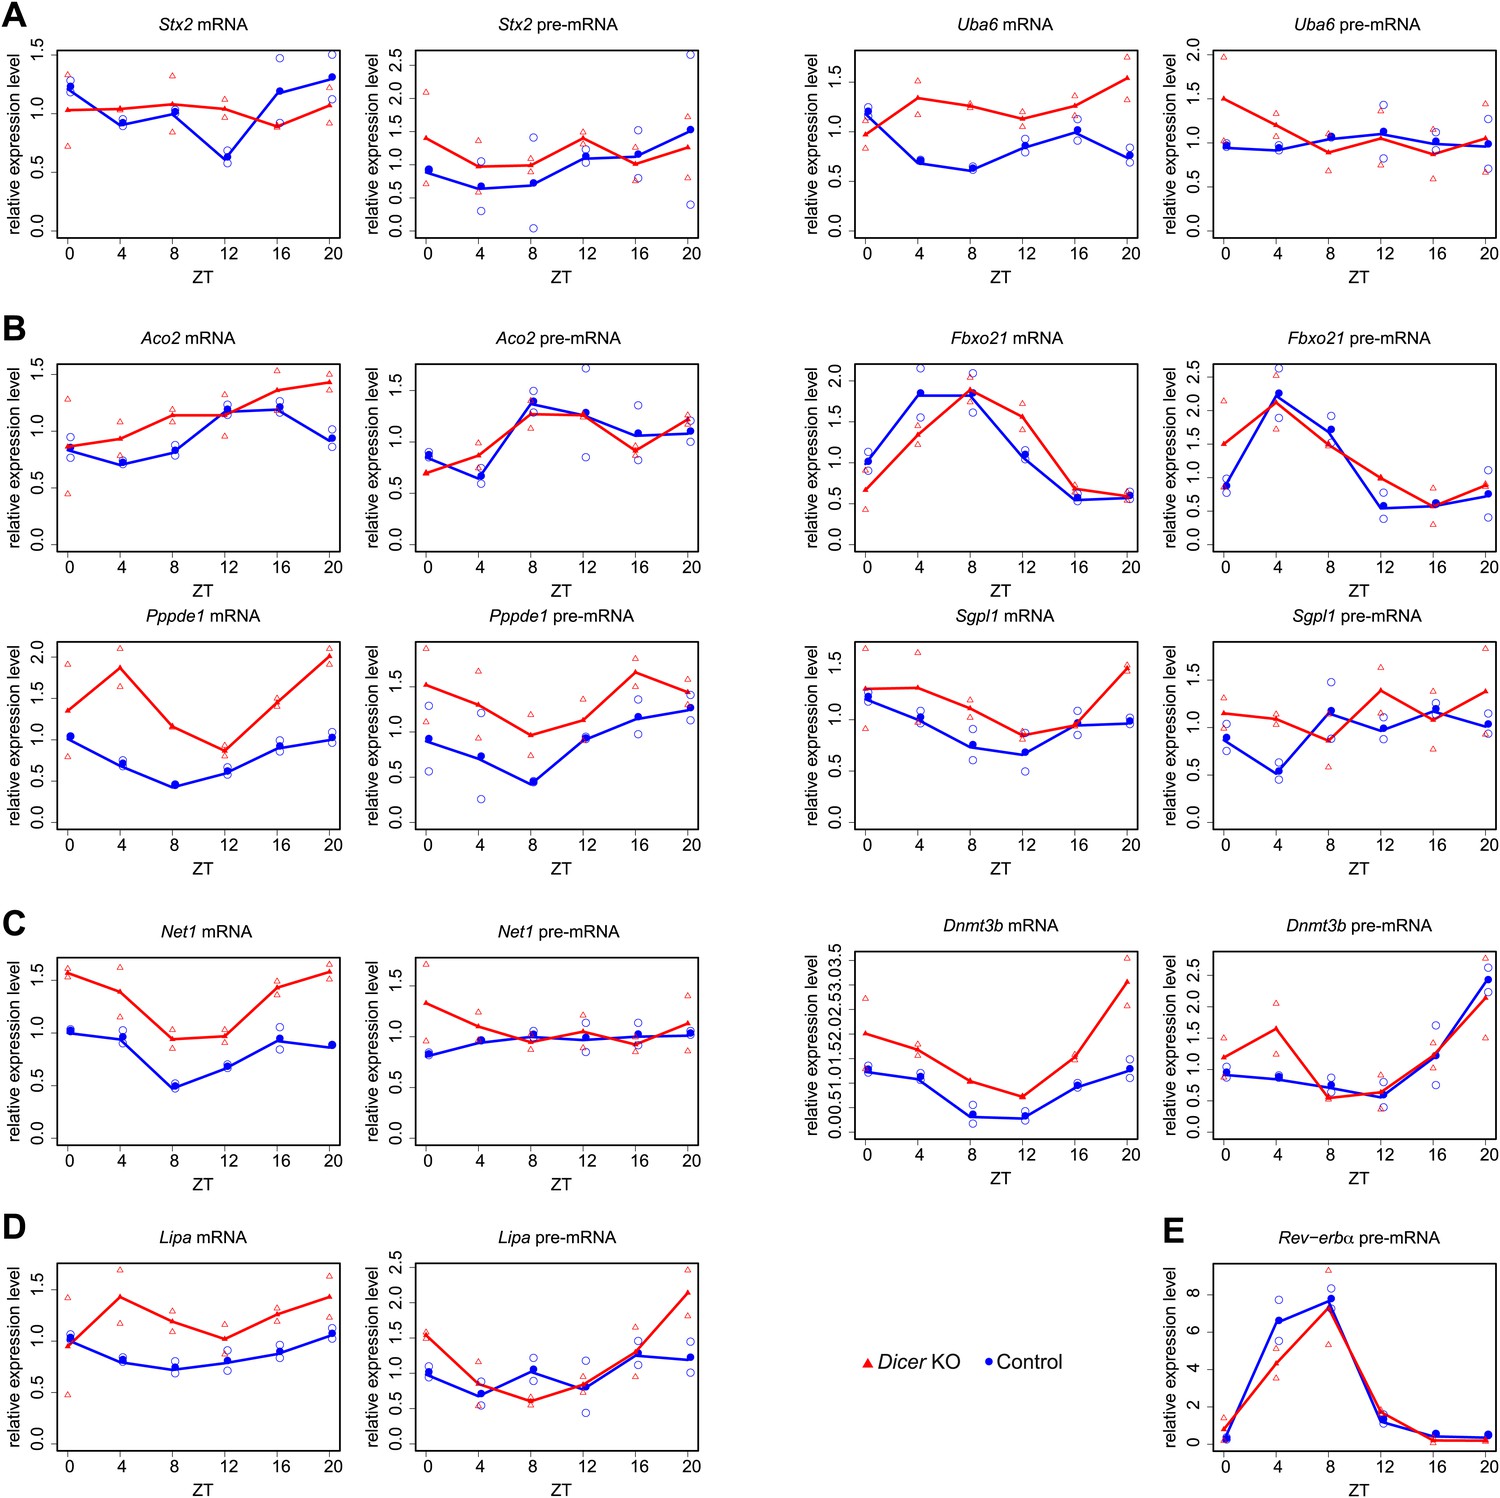
Quantitative real-time PCR analysis of several transcripts shown in main Figures 4 and 5.
Shown are mean values of two time series (filled circle and triangle), and the individual data points (open circle and triangle) plotted together in the same graph. (A) Stx2 and Uba6 are candidates for transcripts whose post-transcriptional rhythms are miRNA-dependent (see main Figure 4G,H). (B) Aco2, Fbxo21, Ppppde1 and Sgpl1 show post-transcriptional phase delays in Dicer knockouts (main Figure 5E). (C) Dnmt3b and Net1 show post-transcriptionally altered amplitudes in Dicer knockouts (main Figure 5F). (D) Lipa becomes essentially non-rhythmic in the absence of miRNAs (main Figure 5G). (E) Nr1d1/Rev-erbα pre-mRNA served as a control example for a rhythmically transcribed gene. cDNA were synthesised from 3 μg of DNase-treated total RNA using random hexamers and PCR-amplified using a SYBR green method as described in ‘Materials and methods’. Mean levels were calculated from triplicate PCR assays for each sample and normalised to those obtained for the five control transcripts Csnk1a1, Ctsd, Nudt4, Smg1 and Trip12. Oligonucleotides used for qPCR are listed in Supplementary file 2 (Du et al., 2014).
Figure 5 with 2 supplements
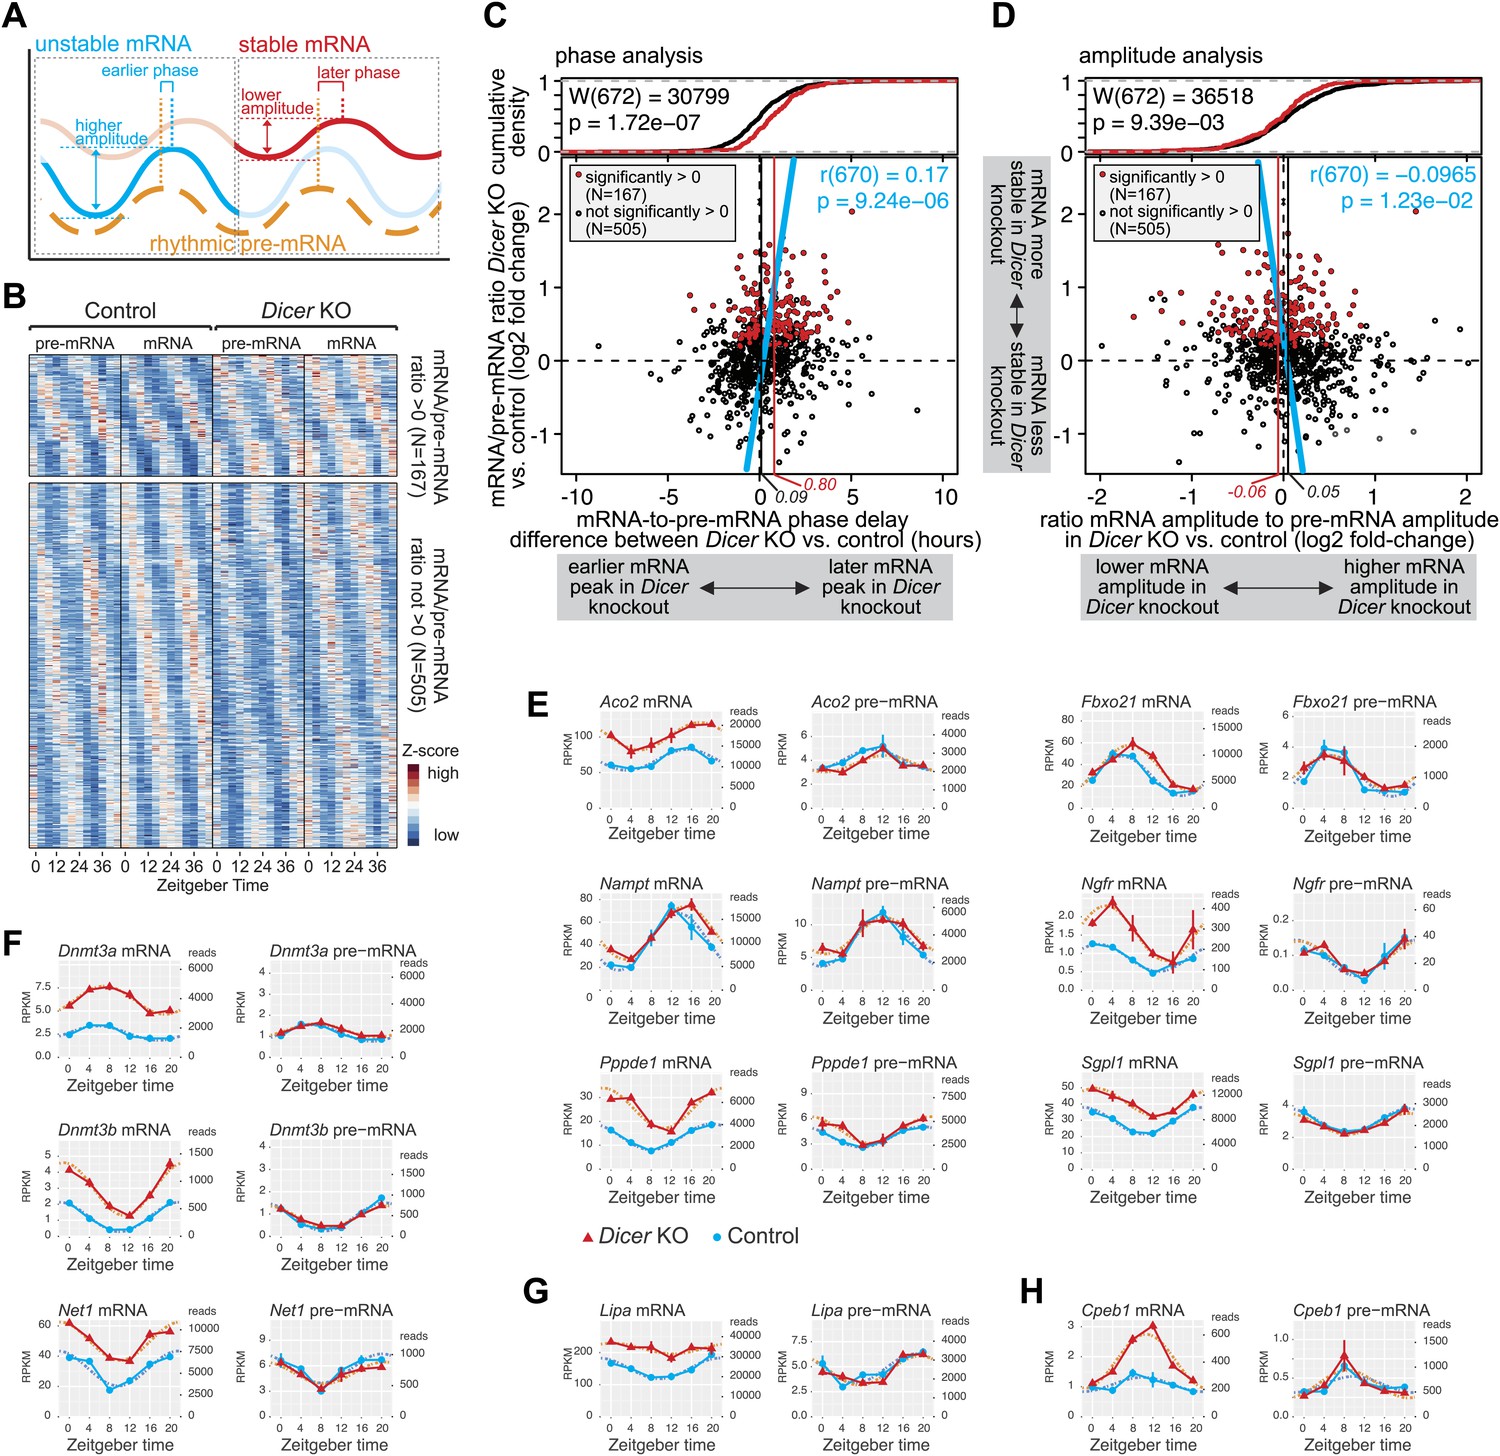
miRNAs adjust the mRNA phases and amplitudes of rhythmically transcribed genes.
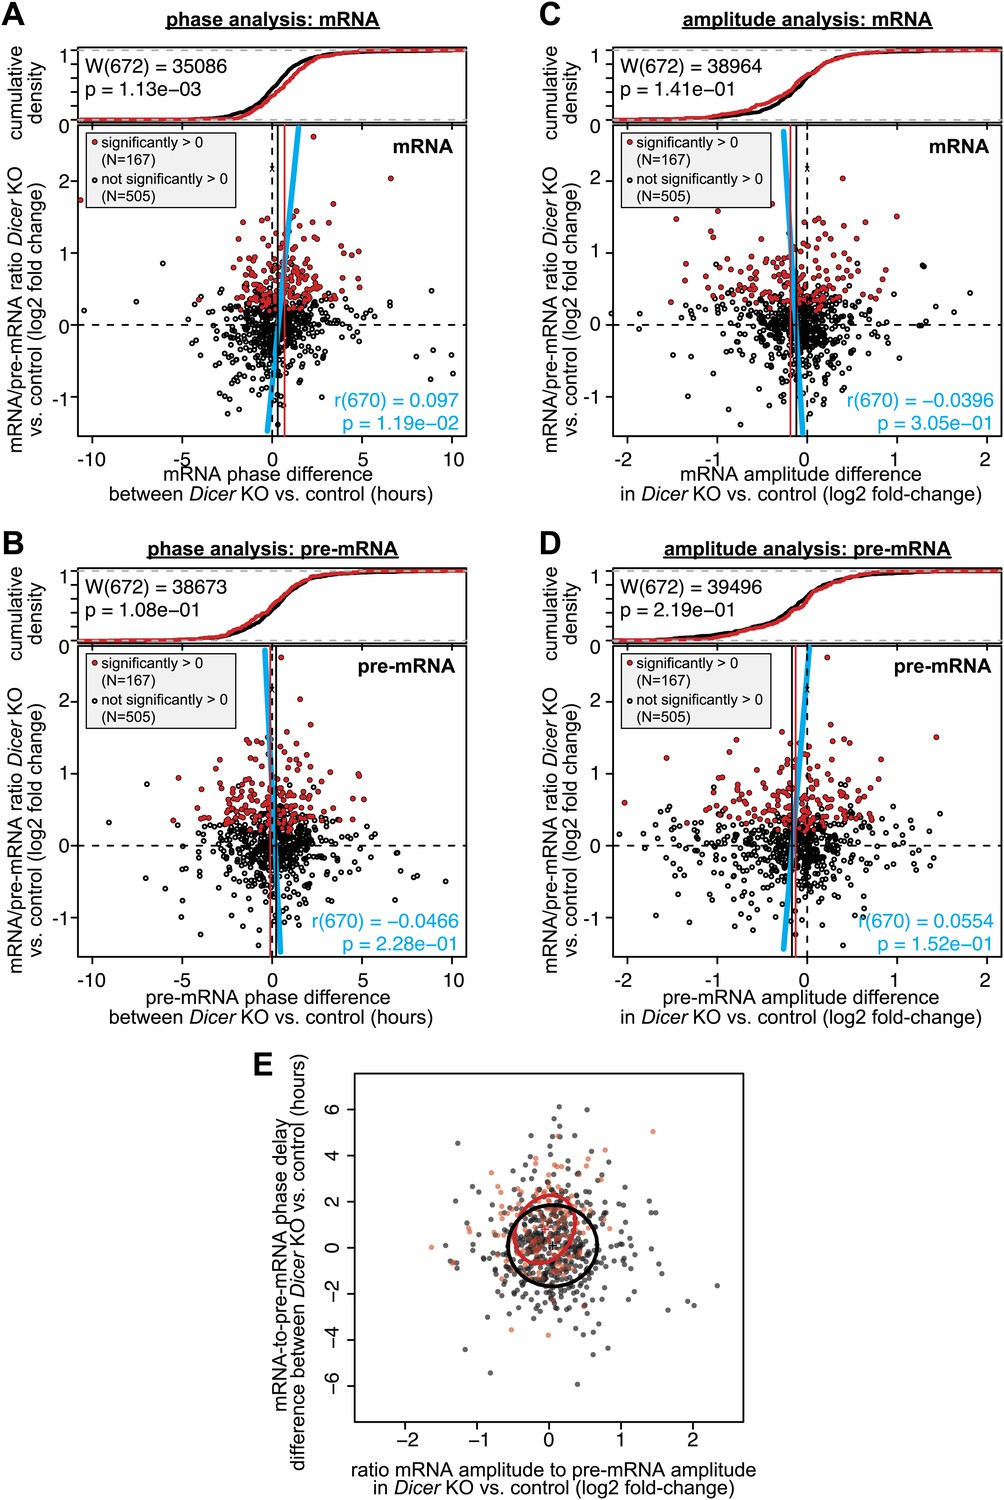
(A) Schematic representation of how mRNA stability affects circadian transcript accumulation. mRNAs with short half-lives (blue) will thus peak relatively early after the transcriptional peak (orange) and show higher peak-to-trough amplitudes than mRNAs with long half-lives (red). (B) Heatmap representation of analysed transcripts that all show rhythmic transcription (>1.5-fold amplitude) and rhythmic mRNA accumulation (no amplitude cut-off, in order to avoid biasing against transcripts whose amplitudes are regulated by miRNAs) in Dicer knockouts and controls. The top and lower panels show the transcripts with (N = 167) and without (N = 505), respectively, significantly increased mRNA/pre-mRNA ratios in Dicer knockouts. (C) Analysis of how the Dicer knockout changes the phases of rhythmic mRNA accumulation. Rhythmic transcripts from (B) are plotted according to the difference of the phase delay between mRNA and pre-mRNA peak in Dicer knockout vs control (abscissa; the further to the right a transcript is located, the later its mRNA is shifted in Dicer knockouts) and according to the change in mRNA/pre-mRNA ratio (ordinate; transcripts at the top of the panel thus become more stable in Dicer knockouts). Transcripts with significantly higher mRNA/pre-mRNA ratios in Dicer knockouts are marked in red. Red and black vertical lines correspond to mean phase shifts for the two groups of transcripts. The blue line shows the correlation of phase delay and mRNA/pre-mRNA ratio over all transcripts (Pearson's r(670) = 0.17; p=9.24e−06). Difference in phase delays between the two groups of transcripts was tested using Wilcoxon rank sum test (W(672) = 30,799; p=1.72e−07). At the top of the graph, the cumulative density plot shows that the two groups of transcripts are clearly separated. (D) Analysis of how the Dicer knockout changes the amplitudes of rhythmic mRNA accumulation. Rhythmic transcripts from (B) are plotted according to how the ratio of the mRNA amplitude divided by the pre-mRNA amplitude is changed between Dicer knockout and control (abscissa; the further to the left a transcript is located, the lower the amplitude becomes in Dicer knockouts) and according to the change in mRNA/pre-mRNA ratio on the ordinate, as in (C). Red and black vertical lines correspond to mean amplitude changes of transcripts with and without increased mRNA/pre-mRNA ratios. The blue line shows the correlation of amplitude change over all transcripts (Pearson's r(670) = −0.0965; p=1.23e−02). Difference in amplitudes between the two groups of transcripts was tested using Wilcoxon rank sum test (W(672) = 36,518; p=9.39e−03). (E) Expression plots for six examples of transcripts whose phases are post-transcriptionally delayed in the absence of miRNAs. Aco2, Fbxo21, Nampt, Ngfr, Pppde1 and Sgpl1 thus all have similar phases of rhythmic transcription (pre-mRNA) in Dicer knockout (red) and control (blue) (right panels), but their mRNA accumulation is shifted to later times in the knockouts (left panels). Dotted lines represent the cosine curve fits. (F) Examples of transcripts showing amplitude effects. Dnmt3a, Dnmt3b and Net1 thus all have similar transcriptional amplitudes in Dicer knockout (red) and control (blue) (right panels), but the loss of miRNAs reduces the mRNA amplitudes (left panels). (G) For rhythmically transcribed Lipa, the loss of miRNAs prevents rhythmic mRNA accumulation altogether. (H) Cpeb1 mRNA shows the expected phase effect (later in Dicer knockout), but contrary to expectation, the mRNA amplitude is increased in the knockout.
-
Figure 5—source data 1
Rhythmic transcripts used in Figure 5.
- https://doi.org/10.7554/eLife.02510.023
Figure 5—figure supplement 1
Analysis of phase and amplitude changes occurring upon Dicer knockout.
Similar to Figure 5C,D (which shows the differences in mRNA-to-pre-mRNA phase delay and mRNA/pre-mRNA amplitude change, respectively, in Dicer knockout vs control), these graphs analyse mRNAs only (A and C) and pre-mRNAs only (B and D). The figures use the same set of rhythmic transcripts as in Figure 5B–D. Overall, the data confirm that the effects of later phases and shallower amplitudes in Dicer knockouts are indeed generated on the mRNA, and not on the pre-mRNA level. (A) Changes in mRNA phases (Dicer knockout vs control) on the abscissa are plotted against the change in mRNA/pre-mRNA ratio (Dicer knockout vs control) on the ordinate. (B) Changes in pre-mRNA phases (Dicer knockout vs control) on the abscissa are plotted against the change in mRNA/pre-mRNA ratio (Dicer knockout vs control) on the ordinate. (C) The ratios of the mRNA amplitude in the Dicer knockout vs the amplitude in control on the abscissa are plotted against the change in mRNA/pre-mRNA ratio (Dicer knockout vs control) on the ordinate. (D) The ratios of the pre-mRNA amplitude in the Dicer knockout vs the amplitude in control on the abscissa are plotted against the change in mRNA/pre-mRNA ratio (Dicer knockout vs control) on the ordinate. (E) Plot of the effect on phase against the effect on amplitude (i.e., both abscissas of Figure 5C,D plotted against each other). The crosses show the centre of the data for transcripts with (red) and without (black) higher mRNA/pre-mRNA ratio in the Dicer knockouts. The circles show the standard deviation of the data points. Overall there is no statistically significant correlation between later phases and lower amplitudes.
Figure 5—figure supplement 2
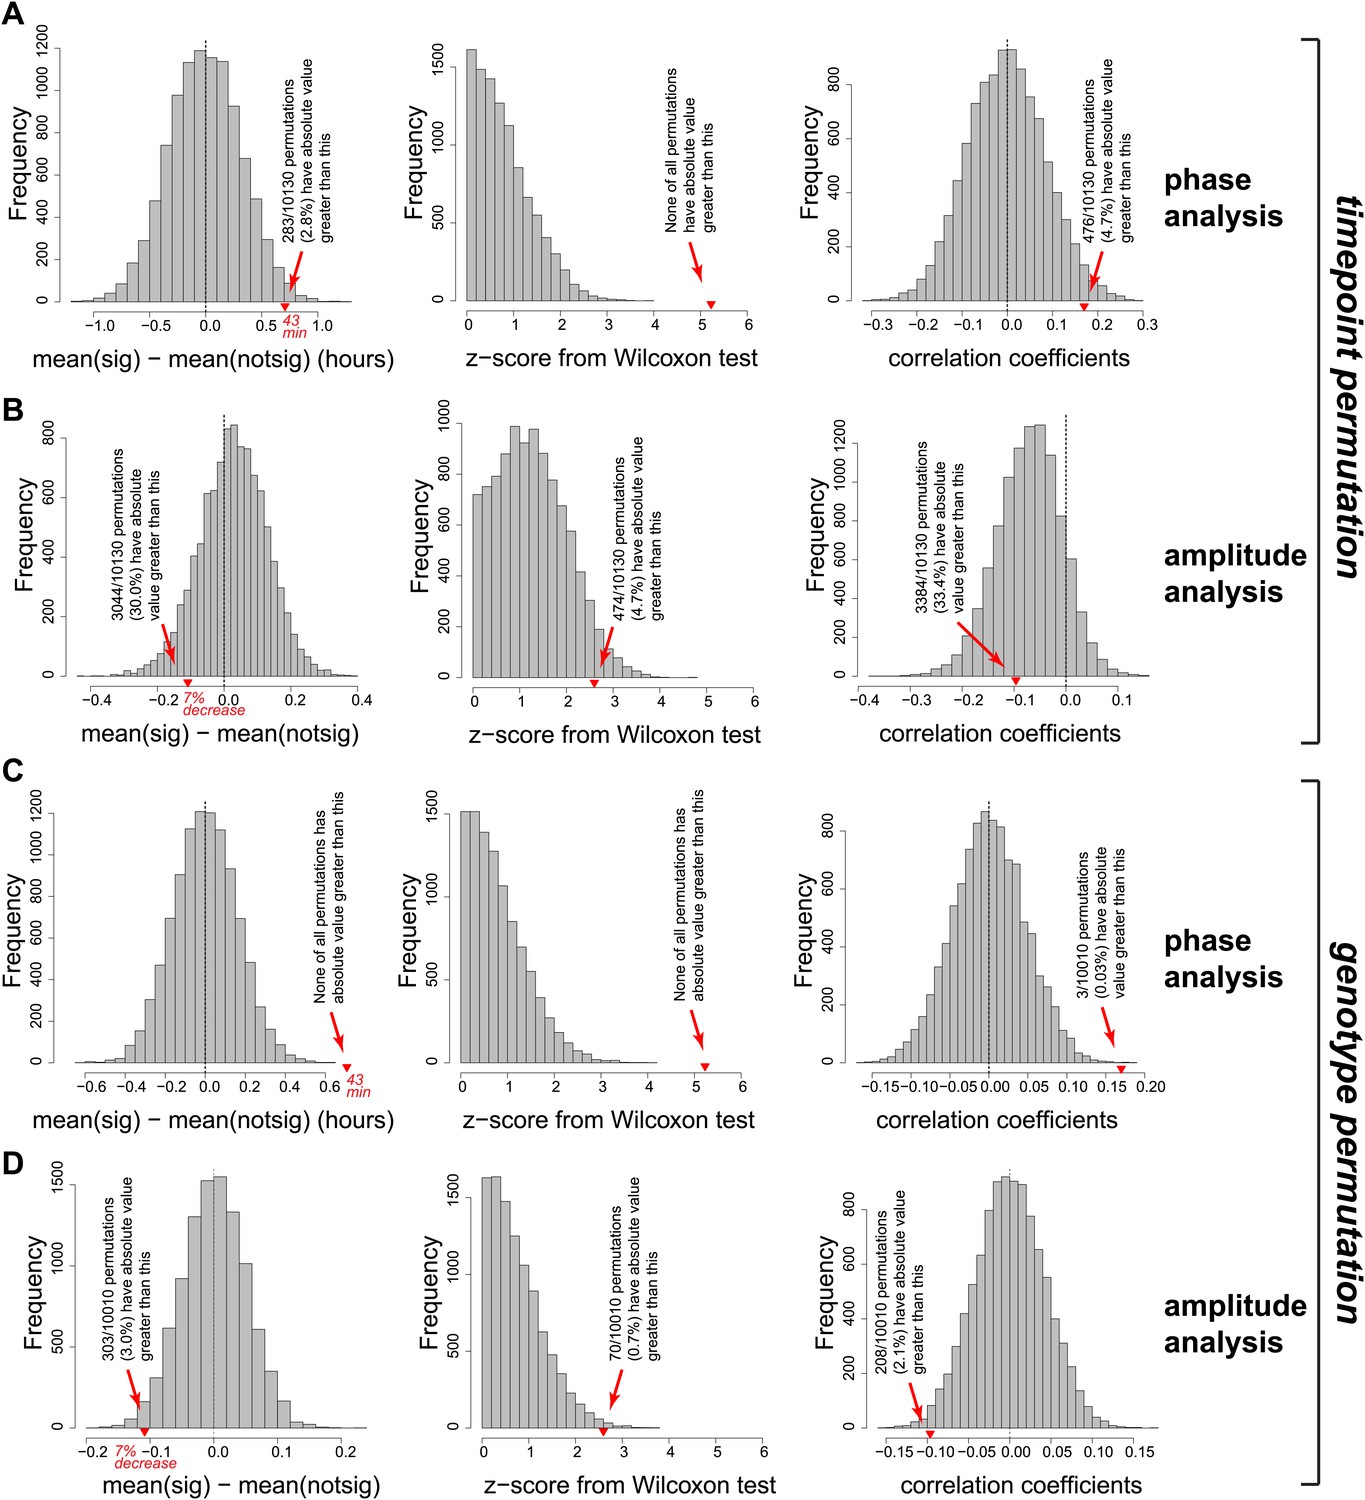
Permutation of the RNA-seq data set confirmed that the effects observed on the phases and amplitudes (main Figure 5C,D) are highly significant and specific to the Dicer knockout.
Two different permutation analyses were performed. First (panels A and B), independently for each gene the 12 timepoints were randomly permutated 10,130 times. For each individual permutation, the same newly shuffled order was applied genewise identically across control/knockout and mRNA/pre-mRNA. In the newly created data sets, rhythm detection, and analysis (phase and amplitude determination) were performed in an identical fashion to the analysis of the orginal data shown in the manuscript. Red triangles on the abscissa represent where the original data is located in the distribution of the random data sets. Collectively, these analyses show that there is not per se a trend in the data or its distribution that would lead to similar findings (later phases, shallower amplitudes upon miRNA loss) just by chance. (A) Left panel shows the distribution of phase delay differences between ‘higher mRNA/pre-mRNA ratio in Dicer KO’ and ‘other’ rhythmic transcripts from the permutated data and in the original data (reported values correspond to difference between vertical black and red lines in Figure 5C). Only in 2.8% of cases did random permutations give a global phase delay difference effect that was as distant from 0 as the experimental data. Moreover (middle panel), none of the permutations had a similarly high Wilcoxon statistics (reported in top left corner of Figure 5C) as the experimental data; Wilcoxon test statistics were converted to z-scores in order to ensure comparability between experimental and permutated data sets, which differ in the number of rhythmic transcripts (N = 182.1 ± 10.6; mean ± SD). Finally (right panel), similarly good Pearson's coefficients of the correlation between phase delay difference and mRNA/pre-mRNA ratios (shown in blue in Figure 5C) only occurred in 4.7% of permutations. (B) Analogous analysis as in (A), but for amplitudes. Since the Dicer KO and control data sets kept their genotype identities in the reshuffling of time points, amplitude effects were overall conserved even after permutation, as expected. In a second permutation analysis (panels C and D), time points were kept in the original order, but the assignment to ‘Dicer KO’ or ‘control’ was switched randomly. Downstream analyses as in (A) and (B). (C) None of the 10,010 permutations had a comparable or stronger phase difference (left panel) analogous to that shown by vertical black and red lines in Figure 5C or a comparable Wilcoxon test z-score (middle panel). Similar or stronger Pearson's correlation coefficients were only found in 0.03% of permutated data sets. (D) Amplitude analysis showing that only 3% of permutations led to a similar effect on the amplitude as the original data.
Figure 6 with 1 supplement
Regulation of circadian output pathways by specific miRNAs.
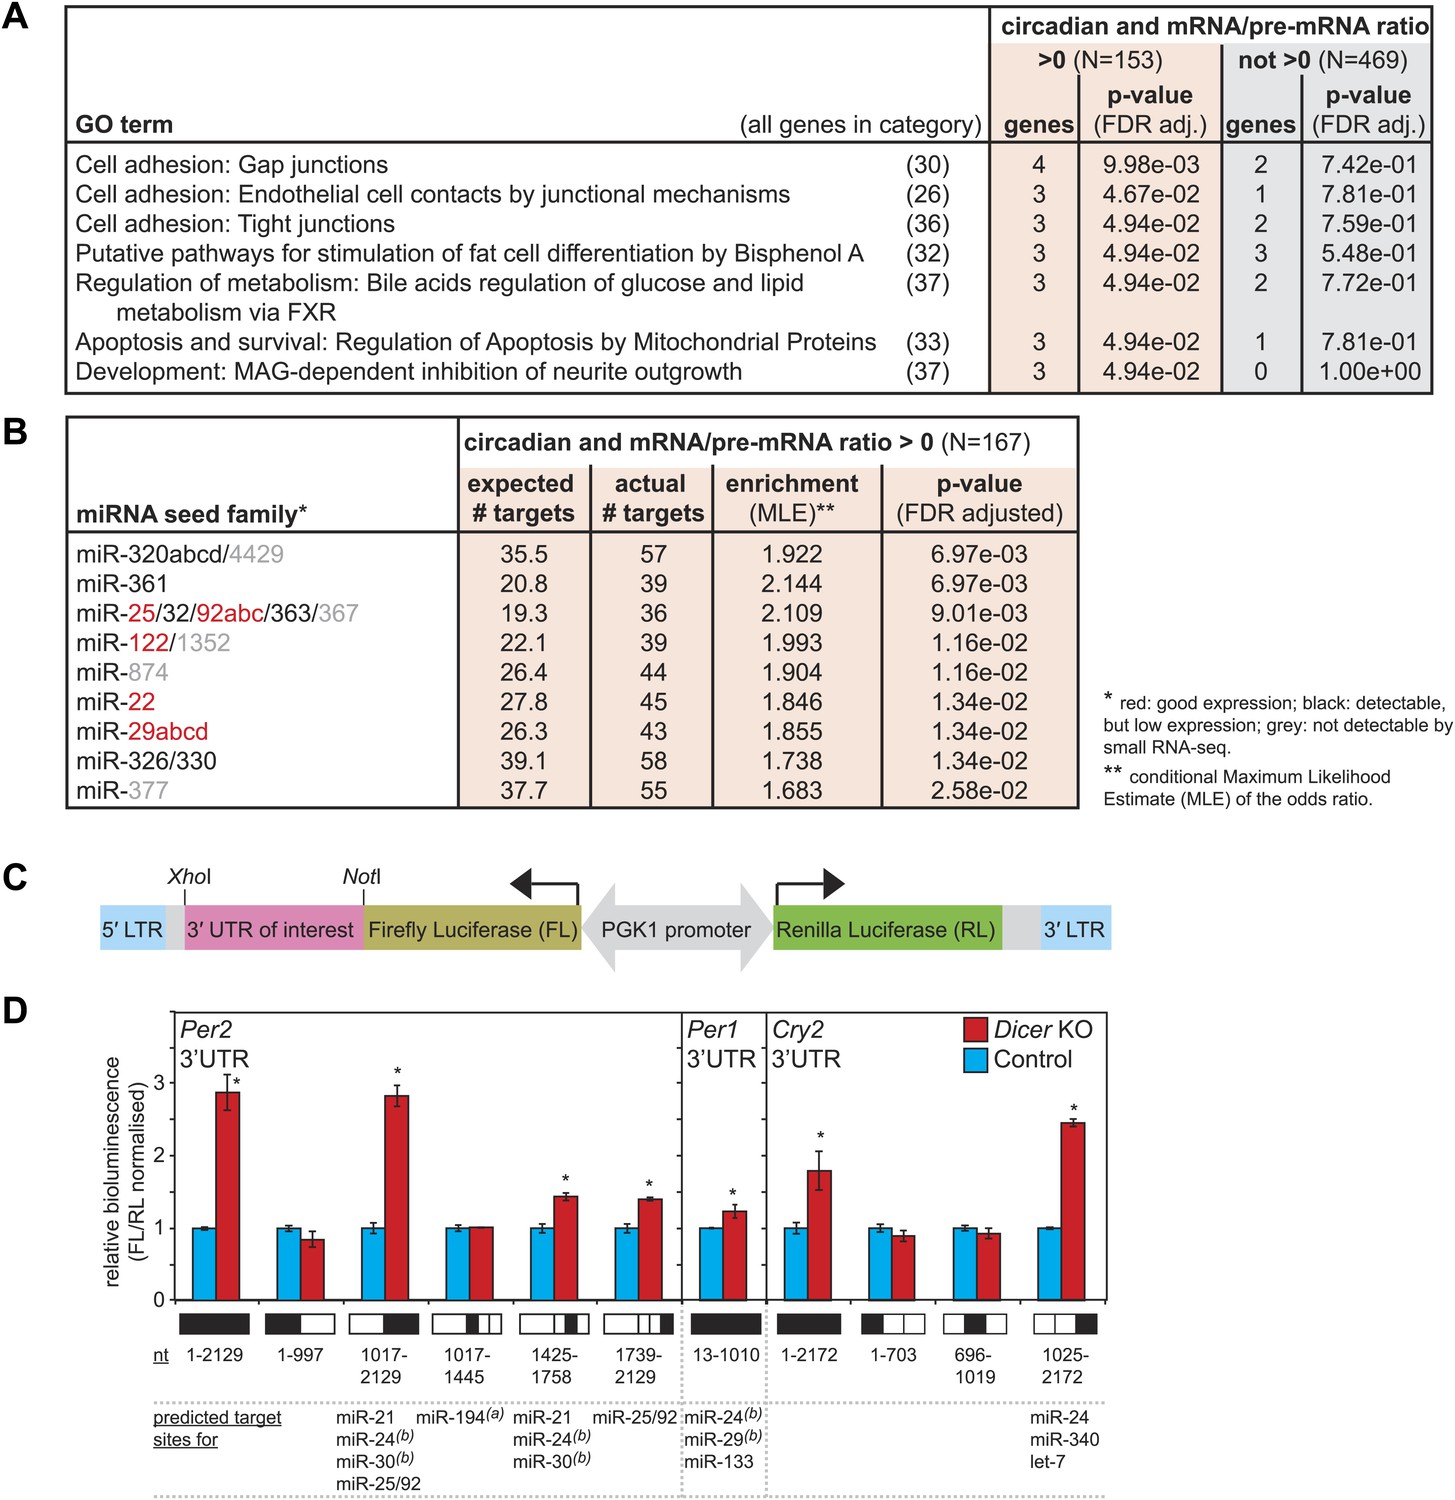
(A) GO term analysis identifies specific pathways enriched in the group of circadian transcripts that are likely miRNA-regulated (higher mRNA/pre-mRNA ratio in Dicer knockouts) but not so in the remainder of rhythmic mRNAs; p-values are corrected for FDR due to multiple testing. Deviations from transcript numbers in Figure 5 are due to genes without associated GO term. (B) List of miRNAs for which more predicted targets than expected are found in the group of circadian transcripts with higher mRNA/pre-mRNA ratios in Dicer knockout. The miRNAs marked in red are expressed at readily detectable levels in liver; those in black were identified in liver by small RNA-seq, but only at very low levels. For miRNAs in grey, we found no evidence for expression in liver by RNA-seq. miRNA predictions performed with targetscan (‘Materials and methods’). (C) Reporter construct to study the function of 3′ UTRs sequences. Within a lentiviral expression cassette (defined by the long terminal repeats, LTRs, in blue), two different luciferase mRNAs are transcribed from the bidirectional Pgk1 promoter. Firefly luciferase serves as the reporter gene to test the effect of a particular 3′ UTRs (pink), whereas renilla luciferase serves as a control for internal normalisation. (D) Effect of Per2, Per1 and Cry2 3′ UTRs on reporter expression in control (blue) and Dicer knockout (red) primary hepatocytes. Lentivirally delivered full-length Per2 3′ UTRs-containing reporter (nt 1–2129) is thus de-repressed in Dicer knockouts; this effect is mediated by the second half of the UTR (1017–2129), probably in synergy through fragment 1425–1758, which contains the predicted miR-24 and miR-30 sites from Chen et al. (2013), and fragment 1739–2129, which contains a predicted site for the miR-25/92 family. Per1 UTR is only slightly de-repressed in Dicer knockout hepatocytes. Cry2 appears to be miRNA-regulated by sites located in the 3′-terminal portion of the UTR, which contains predicted sites for miR-24, miR-340 and let-7. The miRNAs listed below the graph represent targetscan predictions filtered for those detected in liver by small RNA-seq. (A) and (B) identify miRNA regulation reported by Nagel et al. (2009) and Chen et al. (2013), respectively. Data correspond to mean ± standard deviation from triplicate assays from independent lentiviral transductions using hepatocytes from the same mice. Each experiment was confirmed at least twice using hepatocytes from independent animals.
Figure 6—figure supplement 1
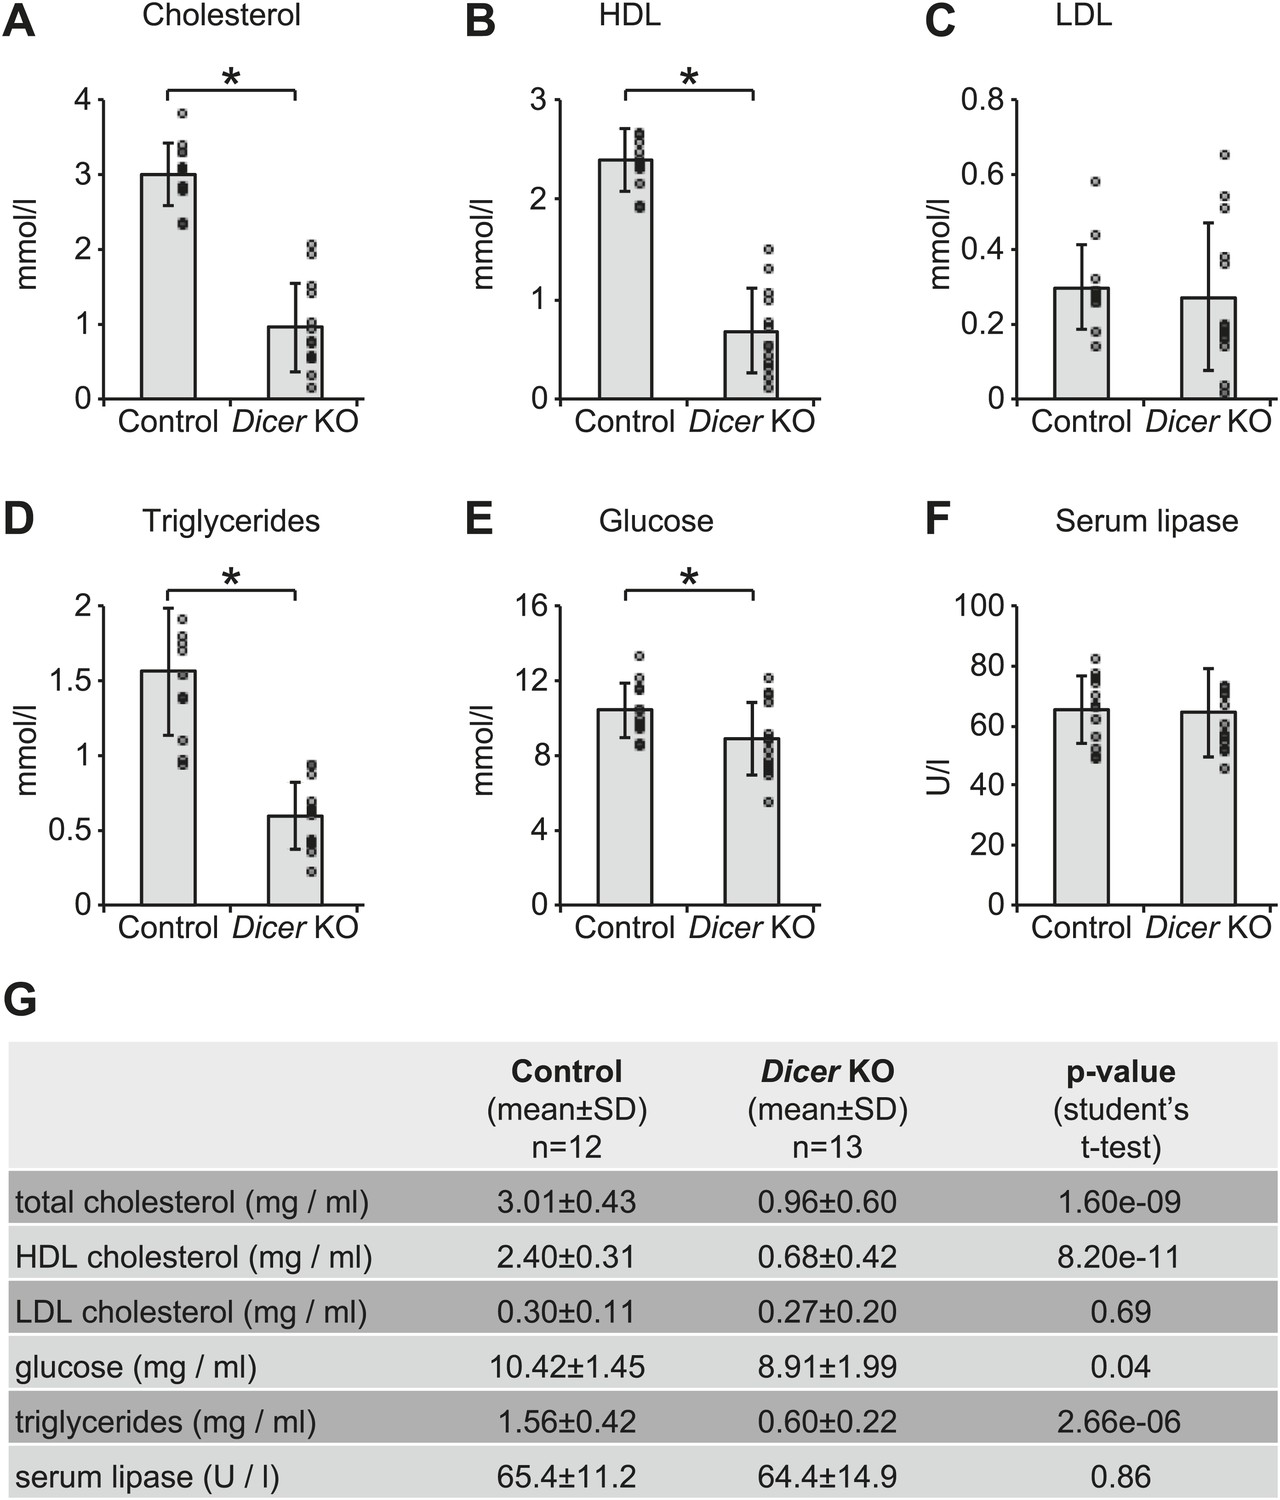
Serum analyses in Dicer knockouts indicate metabolic defects.
Analysis of (A) total cholesterol, (B) HDL cholesterol, (C) LDL cholesterol, (D) triglycerides, (E) glucose, and (F) serum lipase activity in the serum of 12 control and 13 Dicer knockout animals. Similar phenotypes on lipid metabolism have already been described for the single inactivation of miR-122 (Krutzfeldt et al., 2005; Esau et al., 2006; Gatfield et al., 2009), and are thus probably due to the lack of this particular miRNA. (G) Summary of data shown in (A–F).
Figure 7
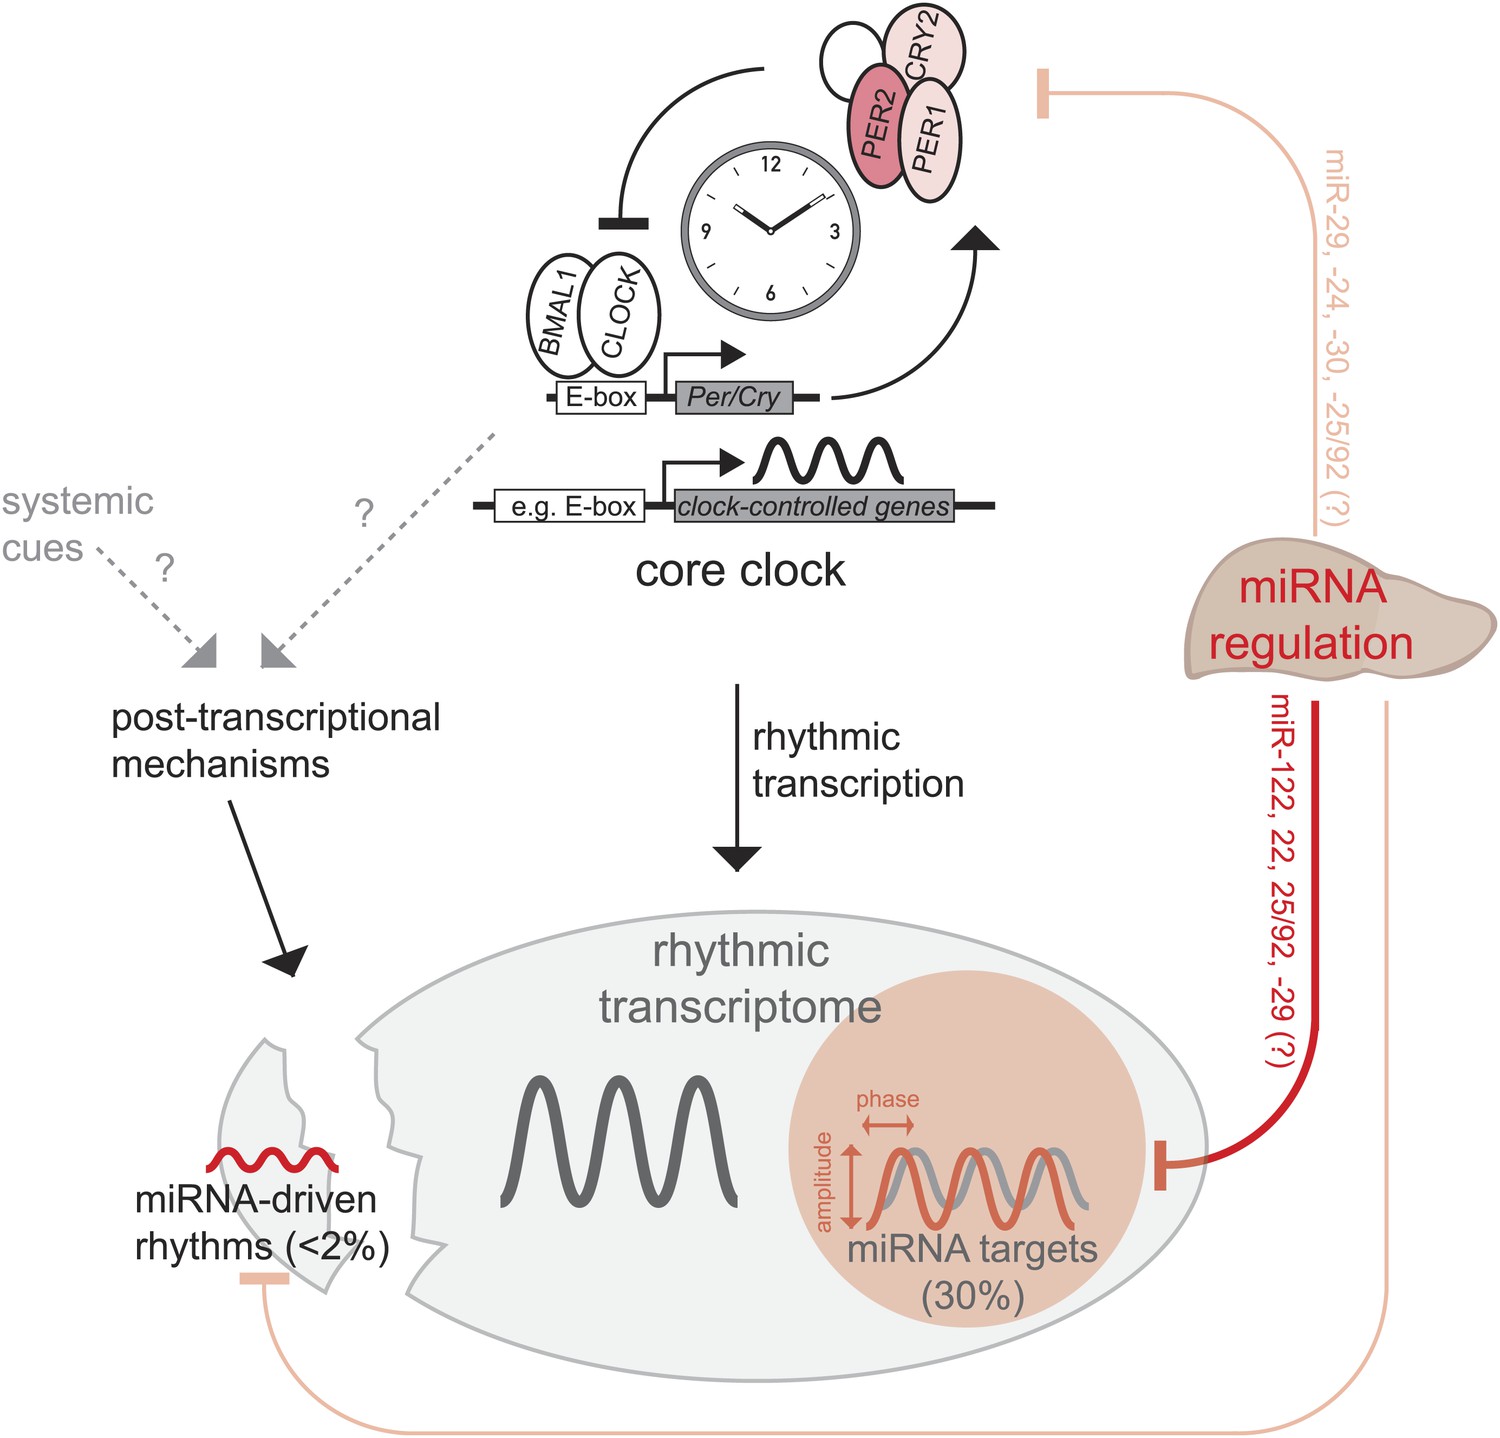
Model, summary, and speculations.
In the liver, we propose that miRNAs play three distinct roles in the regulation of rhythmic gene expression. First, around 30% of rhythmically transcribed genes appear to be also regulated by miRNAs, which tunes the phases and amplitudes of mRNA accumulation. This group of transcripts is enriched for predicted binding sites for several miRNAs (Figure 6B), such as miR-122, miR-22, miR-25/92, and others. Second, for a very small group of transcripts (<2% of all rhythmic mRNAs) rhythms may be driven by miRNAs, but miRNA activity is unlikely to underlie major discrepancies between the rhythmic transcriptome and rhythmic transcription. Finally, miRNA activity seems to be dispensable for a functional hepatic core clock. Nevertheless, it is conceivable that under conditions where the clock is brought out of equilibrium and has to readjust (e.g., jet lag, food shifting) the identified miRNA-mediated regulation in particular of Per2 (but also of Per1 and Cry2) would be of functional importance.
Download links
A two-part list of links to download the article, or parts of the article, in various formats.
Downloads (link to download the article as PDF)
Open citations (links to open the citations from this article in various online reference manager services)
Cite this article (links to download the citations from this article in formats compatible with various reference manager tools)
MicroRNAs shape circadian hepatic gene expression on a transcriptome-wide scale
eLife 3:e02510.
https://doi.org/10.7554/eLife.02510


