Pharmacological inhibition of cystine–glutamate exchange induces endoplasmic reticulum stress and ferroptosis
- Columbia University, United States
- Brain Science Institute, Johns Hopkins Medicine, United States
- Johns Hopkins Medicine, United States
- Howard Hughes Medical Institute, Columbia University, United States
Figures
Figure 1

Cell death is triggered by erastin and related compounds in different cell lines under a variety of physiological conditions.
(A and B) Modulatory effect (Me) profiles of erastin- and SAS-induced death in five different cell lines (143B, BJeHLT, BJeLR, Calu-1, and HT-1080) in response to six different cell death inhibitors (U0126, Trolox, Fer-1, CPX, CHX, β–ME) or the vehicle DMSO. Me >0 indicates rescue from cell death. (C and D) Relative viability of MCTSs formed over 72 hr from HT-1080 (C) or Calu-1 (D) cells in response to erastin, RSL3 or staurosporine (STS) ±β-ME or ferrostatin-1 (Fer-1). Viability was assessed by Alamar blue and represents mean ± SD from three independent biological replicate experiments. Data were analyzed by two-way ANOVA with Bonferroni post-tests, *p<0.05, **p<0.05, ***p<0.001, ns = not significant. (E and F) Viability of HT-1080 (E) and DU145 (F) cells cultured under 1% or 21% O2 levels in response to erastin (5 μM) ±Fer-1 (1 μM) or CPX (5 μM). Viability was assessed by Alamar blue and represents mean ± SD from three independent biological replicate experiments.
Figure 2 with 1 supplement
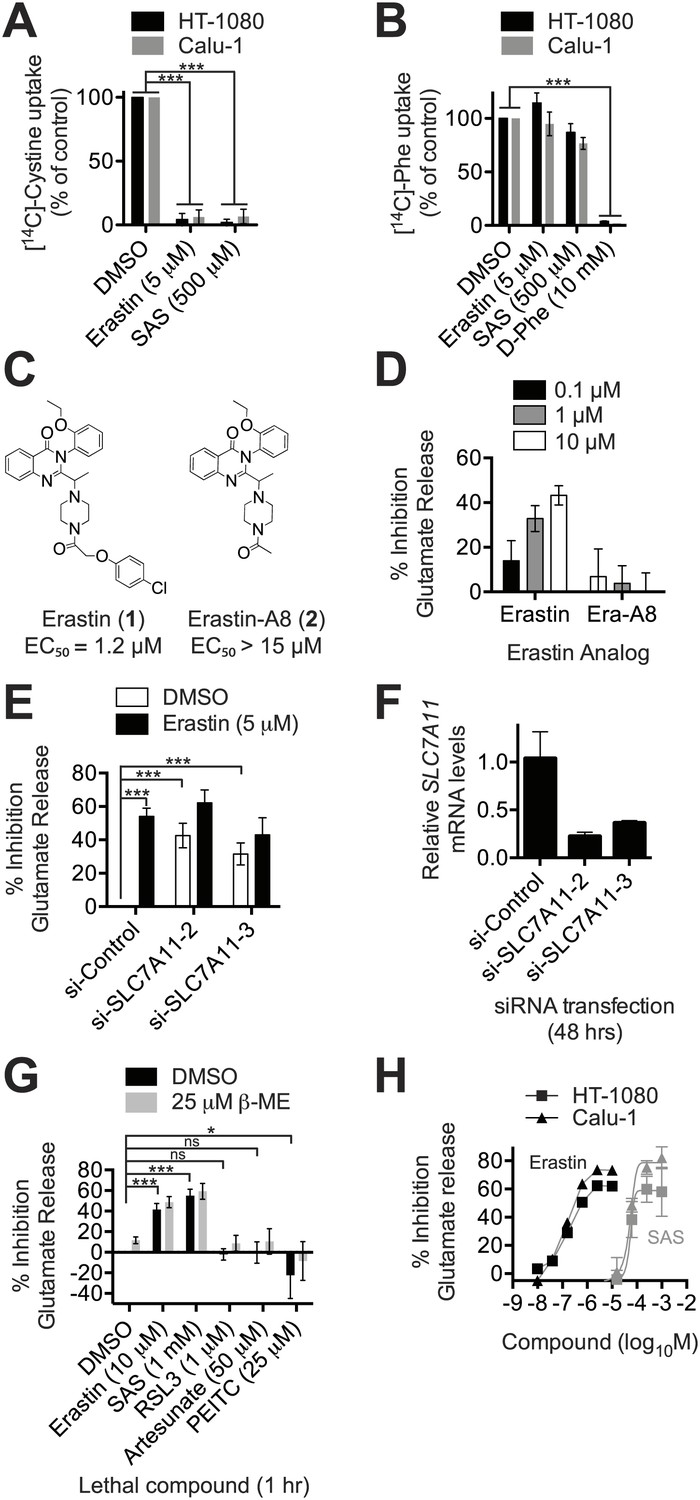
Erastin inhibits system xc− function potently and specifically.
(A and B) Na+-independent uptake of 14C-cystine (A) and 14C-L-phenylalanine (Phe) (B) over 5 min in HT-1080 and Calu-1 cells treated with erastin or SAS. D-Phe was included as a positive control in B. (C) Structure and lethal potency (EC50 in HT-1080 cells) of erastin and the inactive erastin analog erastin-A8. (D) Dose-dependent inhibition of glutamate release by erastin and erastin-A8 (Era-A8). (E) Glutamate release ±erastin in HT-1080 cells in which SLC7A11 was silenced for 48 hr using two independent siRNAs. (F) SLC7A11 mRNA levels assayed using RT-qPCR in si-SLC7A11-transfected cells. (G) Glutamate release in response to erastin, SAS, RSL3 artesunate and PEITC, ±beta-mercaptoethanol (β-ME). (H) Dose-response analysis of glutamate release from HT-1080 and Calu-1 cells in response to erastin and SAS. All data are from three independent biological replicates. Data are presented as mean ± SD. Data in A and B are normalized to DMSO controls (set to 100%). Data in A, B, E and G were analyzed by ANOVA with Bonferroni post-tests, *p<0.05, ***p<0.001, ns = not significant.
Figure 2—figure supplement 1
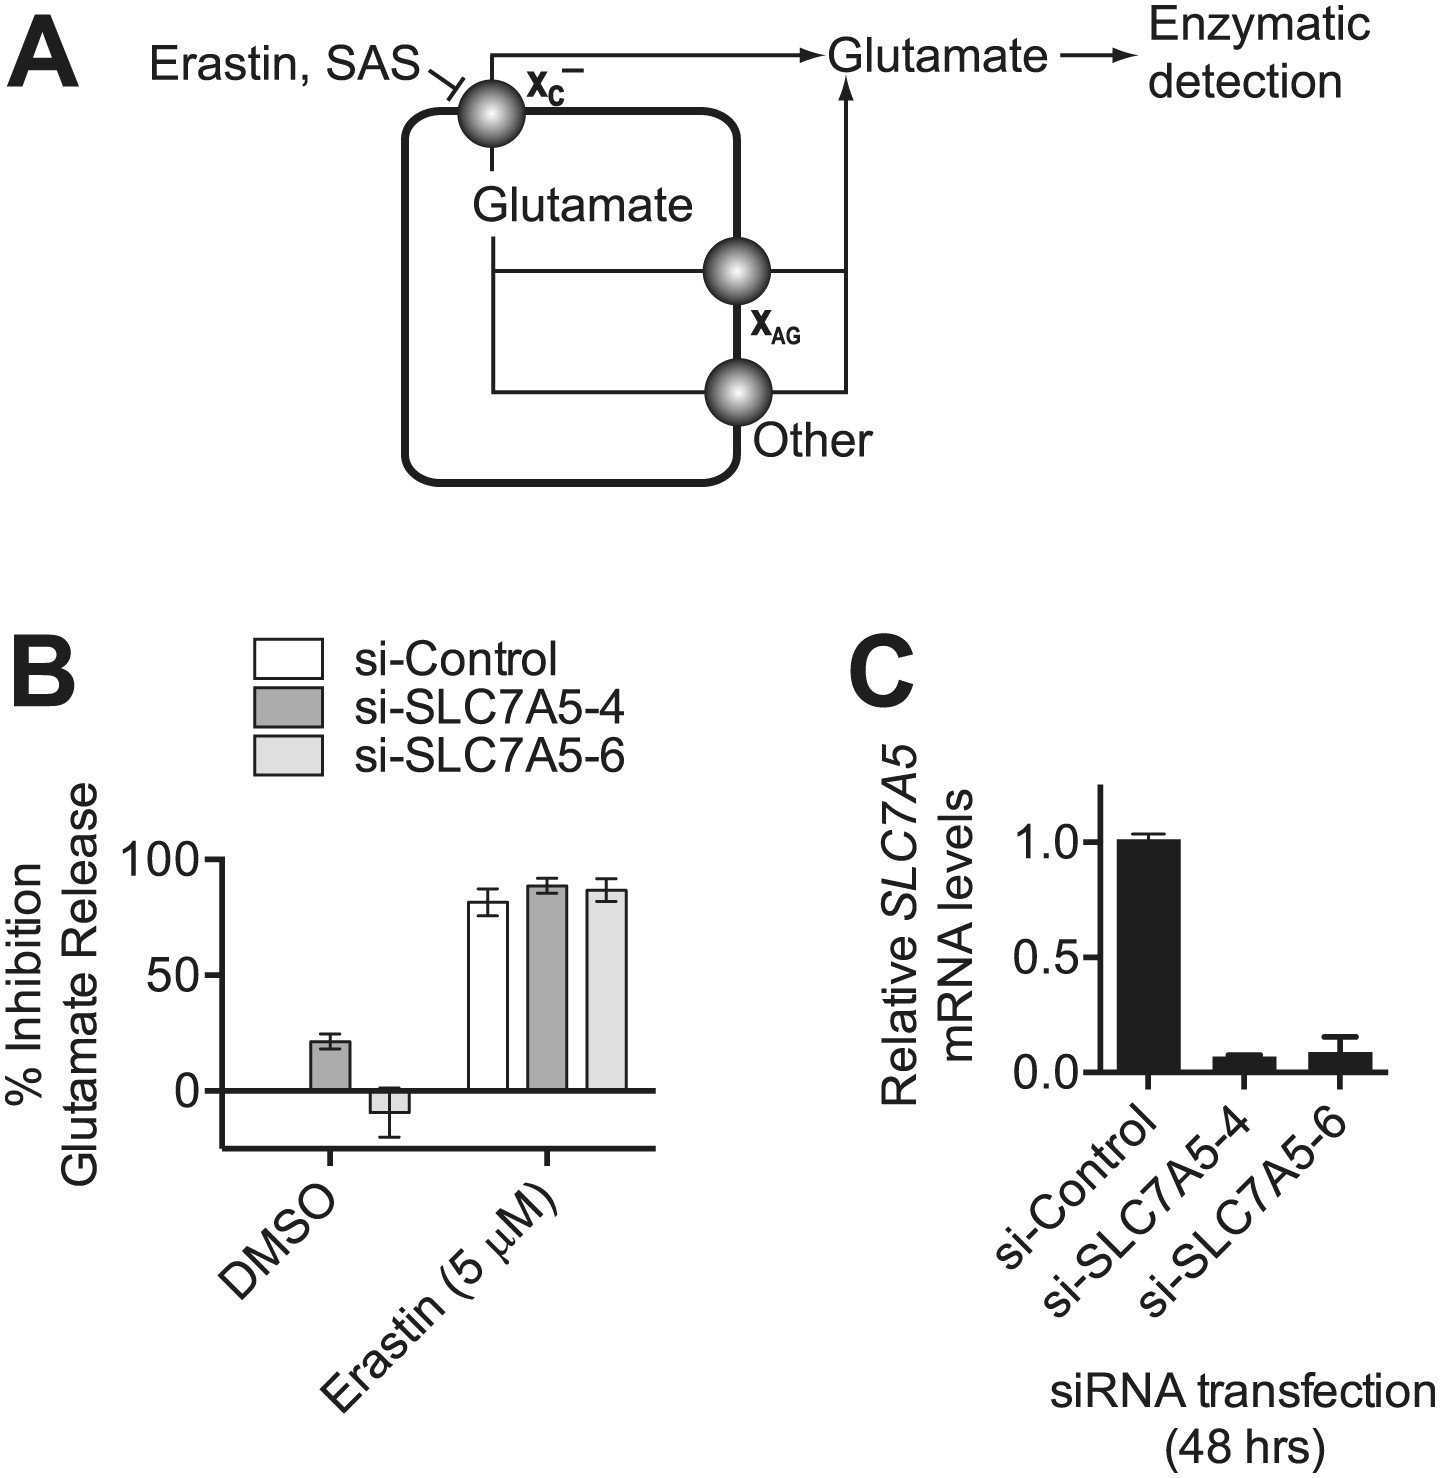
Monitoring system xc− activity by following glutamate release.
(A) Overview of the assay design. Glutamate released by the cell is detected by an enzyme-linked reaction. Erastin and SAS inhibit glutamate release from system xc−, but not other transporters. System xc− is one of several transporters that can release glutamate, including system XAG and others. (B) SLC7A5 expression was silenced in HT-1080 cells for 48 hr using two independent siRNAs and then glutamate release was assayed ±erastin. (C) SLC7A5 mRNA levels in HT-1080 transfected as in (B). Data in B and C represent mean ±SD from three independent biological replicates.
Figure 3
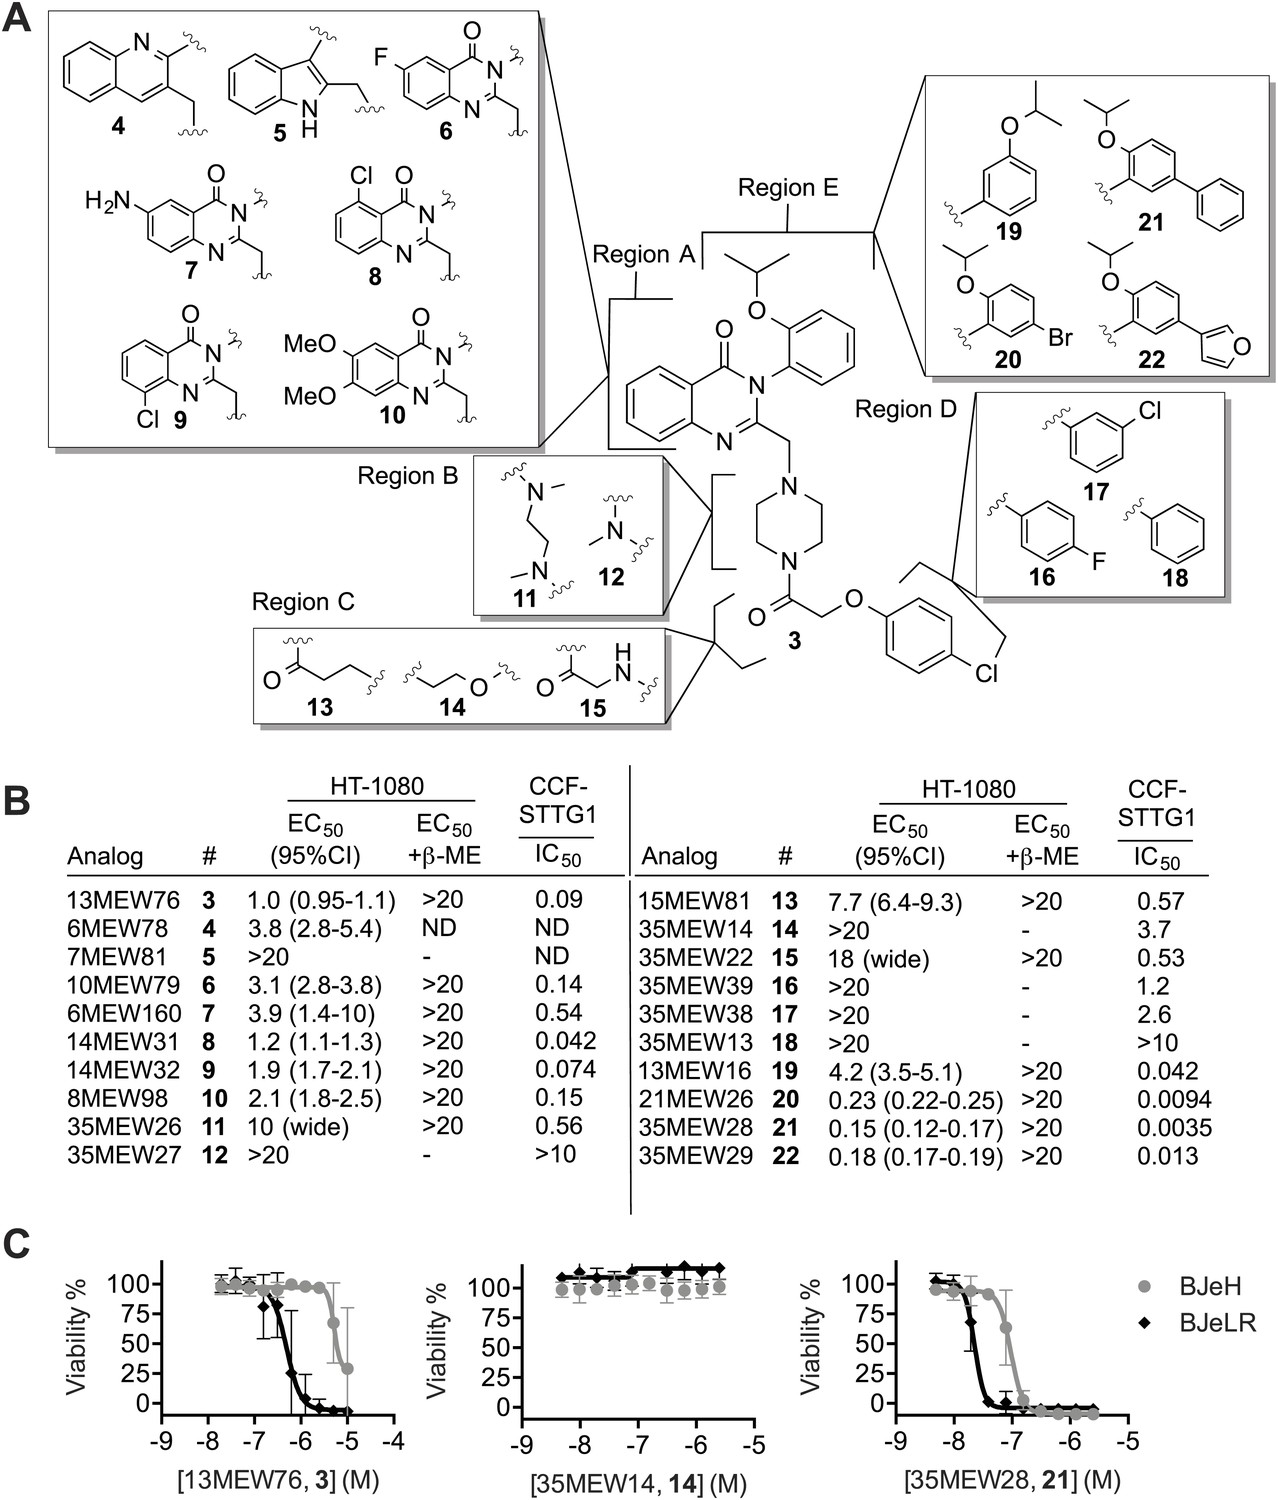
Structure activity relationship (SAR) analysis of erastin.
(A) Structures of 20 erastin analogs. (B) Lethal EC50 for each analog determined in HT-1080 cells in a 10-point, twofold dilution assay, starting at a high concentration of 20 μM, ±β-ME (18 μM). Data represent mean and 95% confidence interval (95% C.I.) from three independent biological replicate experiments. Also reported are IC50 values for inhibition of glutamate release as determined in CCF-STTG1 cells. These data represent the average of two experiments. All values are in μM. ND: not determined. (C) Dose-response curves for selected erastin analogs (3, 14 and 21) in BJeLR and BJeH cells. Data represent mean ± SD from three independent biological replicates.
Figure 4 with 1 supplement

Analysis of erastin effects using RNA-Seq.
(A and B) List of genes upregulated (A) and downregulated (B) by erastin treatment, as detected in HT-1080 cells using RNA Seq. The number of fragments per kilobase of exon per megabase of sequence (FPKM) was counted and is expressed as a fold-change ratio between the different conditions. E/D: Erastin/DMSO expression ratio. E+β-ME/D: Erastin+β-ME/DMSO ratio. ATP6V1G2*: ATP6V1G2-DDX39B read-through transcript. Data represent the average of two independent biological replicates for each condition. (C and D) mRNA expression level of CHAC1 determined by RT-qPCR in HT-1080 and Calu-1 cells in response to erastin ±β-ME treatment for 5 hr. Data are from three independent biological replicates and represented as mean ± SD and were analyzed by one-way ANOVA with Bonferroni post-tests, **p<0.01, ***p<0.001, ns = not significant. In D significance is indicated relative to the DMSO control. (E) CHAC1 mRNA levels in 13 different erastin-sensitive cell lines treated with erastin or STS (6 hr). Results in E were analyzed using the Kruskal–Wallis test, ***p<0.001, ns = not significant.
Figure 4—figure supplement 1

Analysis of ER stress in response to erastin treatment.
(A) Western blot analysis of erastin (5 μM, 7 hr)—sorafenib (10 μM, 12 hr)—and thapsigargin (10 ng/ml, 6 hr)-treated cells reveals changes associated with ER stress including phosphorylation of eIF2alpha and up-regulation of ATF4 protein levels relative to unphosphorylated forms and total protein respectively. *: non-specific band in the ATF4 blot. (B) Splicing of XBP-1 mRNA analyzed by PCR and agarose gel electrophoresis. Treatment conditions are as in (A). (C) Viability of HT-1080 cells over time treated with DMSO or erastin ± actinomycin D or cycloheximide (CHX), as indicated. Cell counts were measured using a Vi-Cell analyzer. (E and F) CHAC1 mRNA levels measured in HT-1080 cells in response to the indicated erastin analogs. (E) AE, PE and MEII were reported previously in Yang et al. (2014). Results presented in A and B are representative of three independent experiments. Data shown in (D and E) is the average of three independent biological replicates, and in (C and F) the average of two replicates.
Figure 5 with 1 supplement
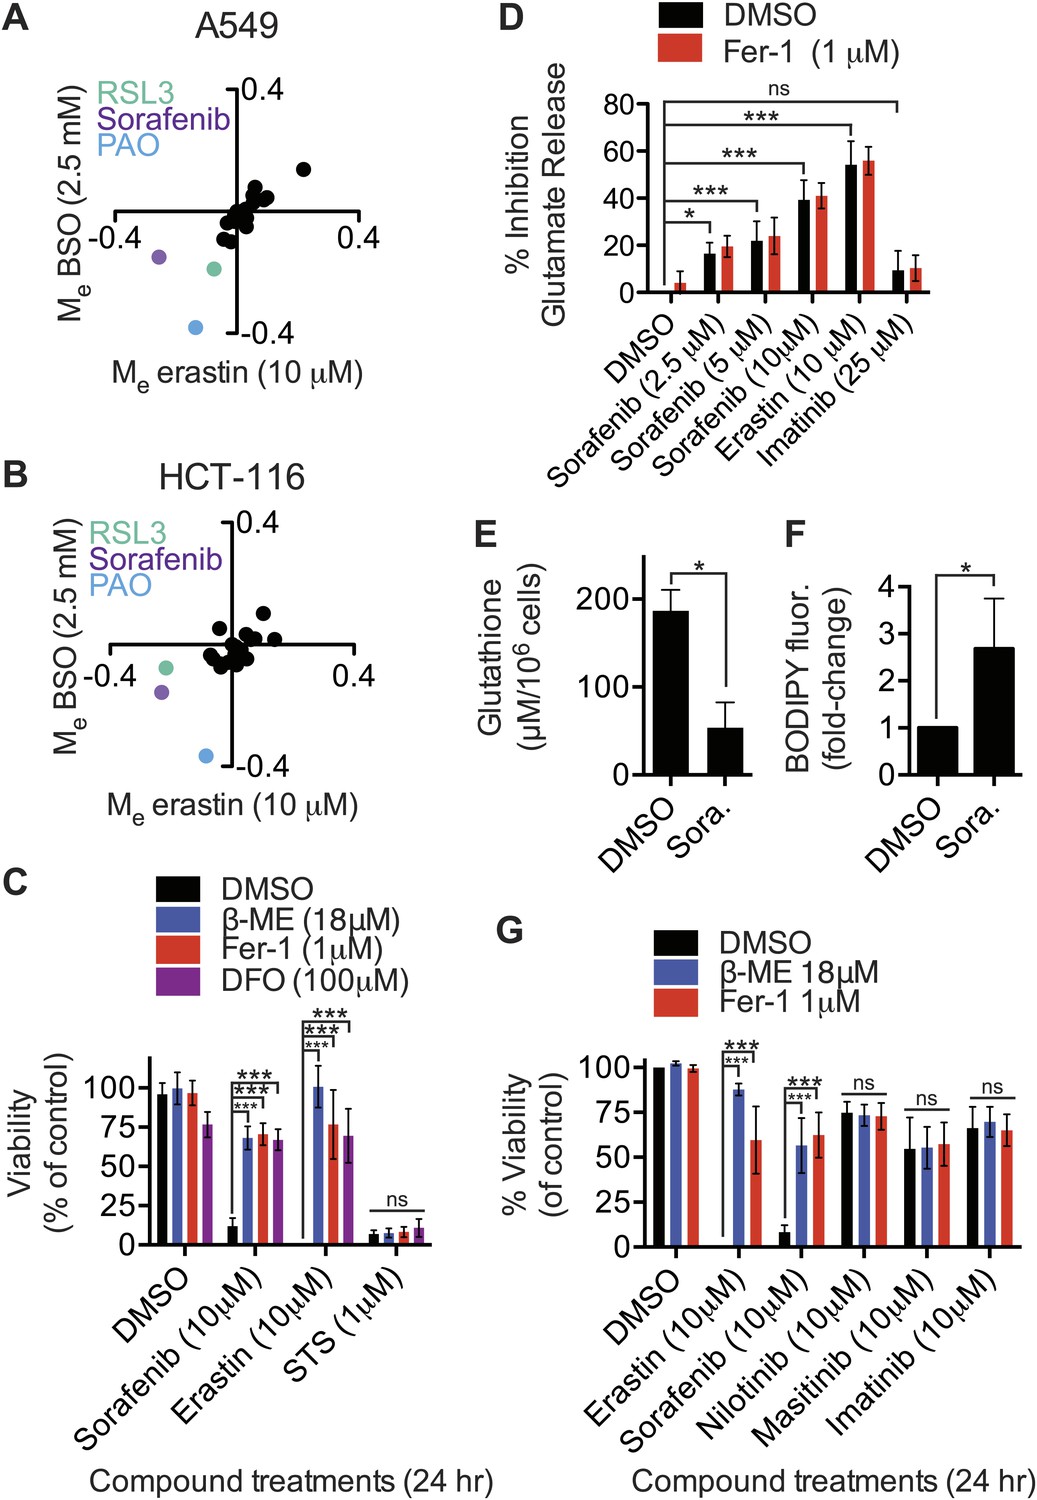
Identification of sorafenib as an inhibitor of system xc−.
(A and B) Modulatory profiling of (A) A549 and (B) HCT-116 cells in response to either buthionine sulfoximine (BSO) or erastin ±20 different lethal compounds (see ‘Materials and methods’ for the full list). (C) Viability of HT-1080 cells treated for 24 hr with ferroptosis inhibitors (β-ME, Fer-1, DFO) ±sorafenib, erastin or STS. (D) Quantification of the inhibition of glutamate release by sorafenib, erastin and imatinib ±Fer-1. (E and F) HT-1080 cells treated with control vehicle (DMSO) or sorafenib (10 μM) for 18 hr prior to the assay. (E) Total glutathione levels measured using Ellman's reagent. (F) Lipid ROS levels assayed using C11-BODIPY 581/591. (G) Viability of HT-1080 cells treated for 24 hr with erastin, sorafenib, nilotinib, masitinib or imatinib ±β-ME or Fer-1. Data in C–G represent mean ± SD from at least three independent biological replicates. Cell viability in C and G was quantified by Alamar blue. Data in C, D and G were analyzed by one- and two-way ANOVA with Bonferroni post-tests; data in E and F were analyzed using Student's ttest, *p<0.05, **p<0.01, ***p<0.001, ns = not significant relative to the indicated treatments. In (D), none of the comparisons between DMSO and Fer-1 treated samples were significant (p>0.05).
Figure 5—figure supplement 1
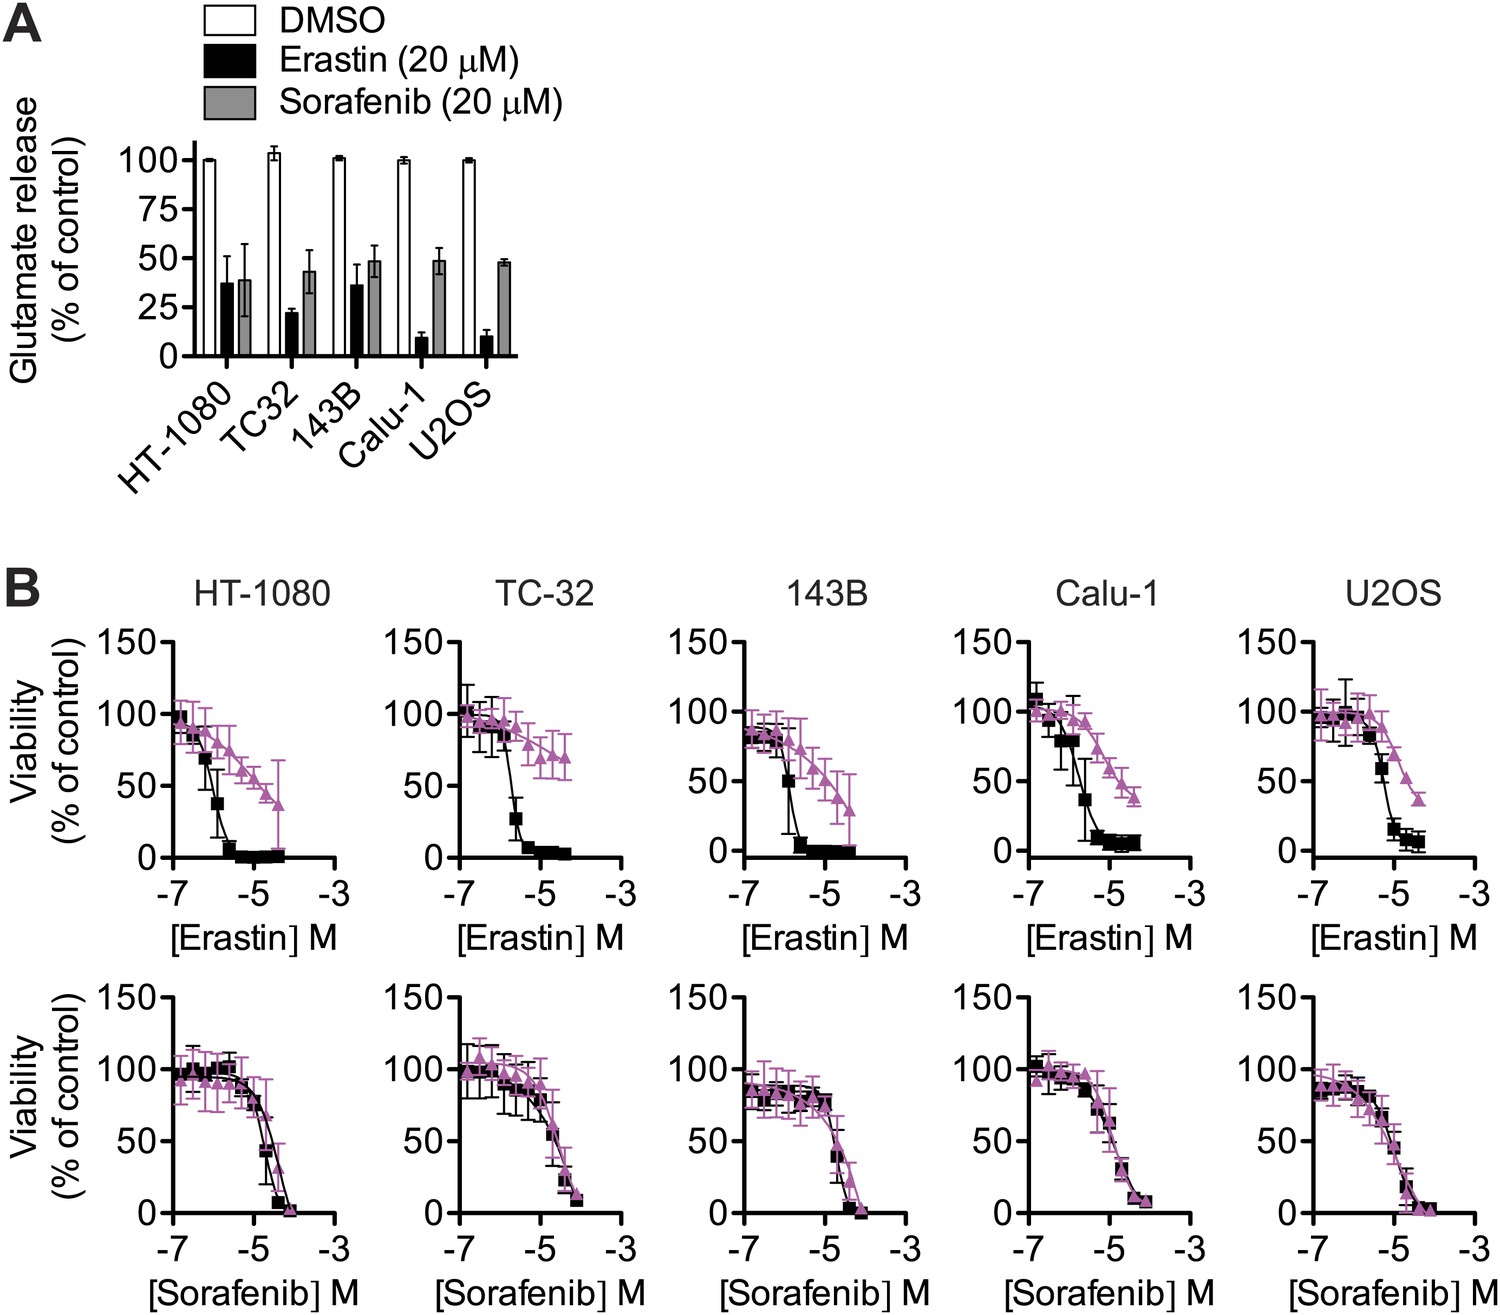
Effect of sorafenib on cell viability.
(A) Glutamate release from same cell lines in response to erastin or sorafenib. (B) Viability of five cell lines (HT-1080, TC-32, 143B, Calu-1 and U2OS) in response to 48 hr treatment with increasing doses of erastin or sorafenib ± DMSO (squares, black) or 5 μM Fer-1 (triangles, purple). Data shown is the average of three independent biological replicates.
Figure 6
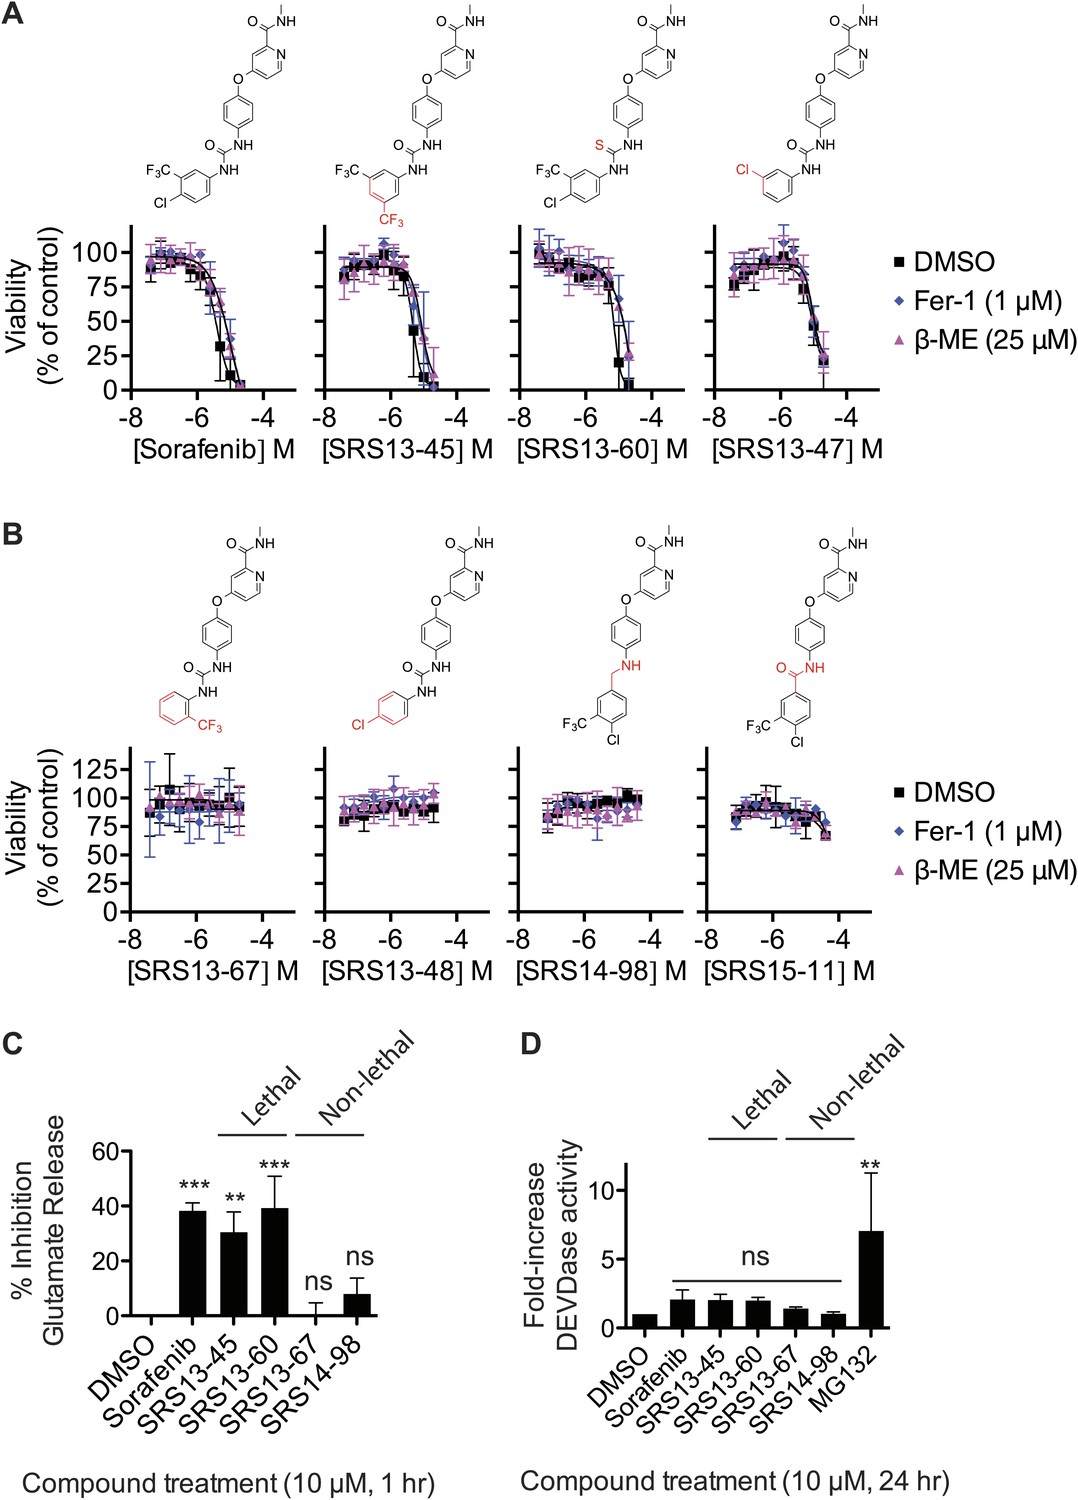
Analysis of sorafenib analog function.
(A and B) Sorafenib and 87 sorafenib analogs were prepared and tested in HT-1080 cells for the induction of cell death (EC50) and the suppression of this cell death by β-ME (18 μM) and Fer-1 (1 μM) over 48 hr. Representative data are shown for three analogs that retained lethal activity (SRS13-45, SRS13-60, SRS13-47) and four analogs that lost lethal activity (SRS13-67, SRS13-48, SRS14-98, SRS15-11) in the cell-based assay. (C) Glutamate release in response to sorafenib and select analogs. (D) DEVDase (caspase-3/7) activity in response to sorafenib and select analogs as measured by the cleavage of a fluorescent rhodamine-linked substrate.
Figure 7 with 1 supplement

Summary of adverse events reported with sorafenib and other kinase inhibitors.
Analysis of adverse events across 20 physiological system categories associated with kinase inhibitor treatment.
Figure 7—figure supplement 1
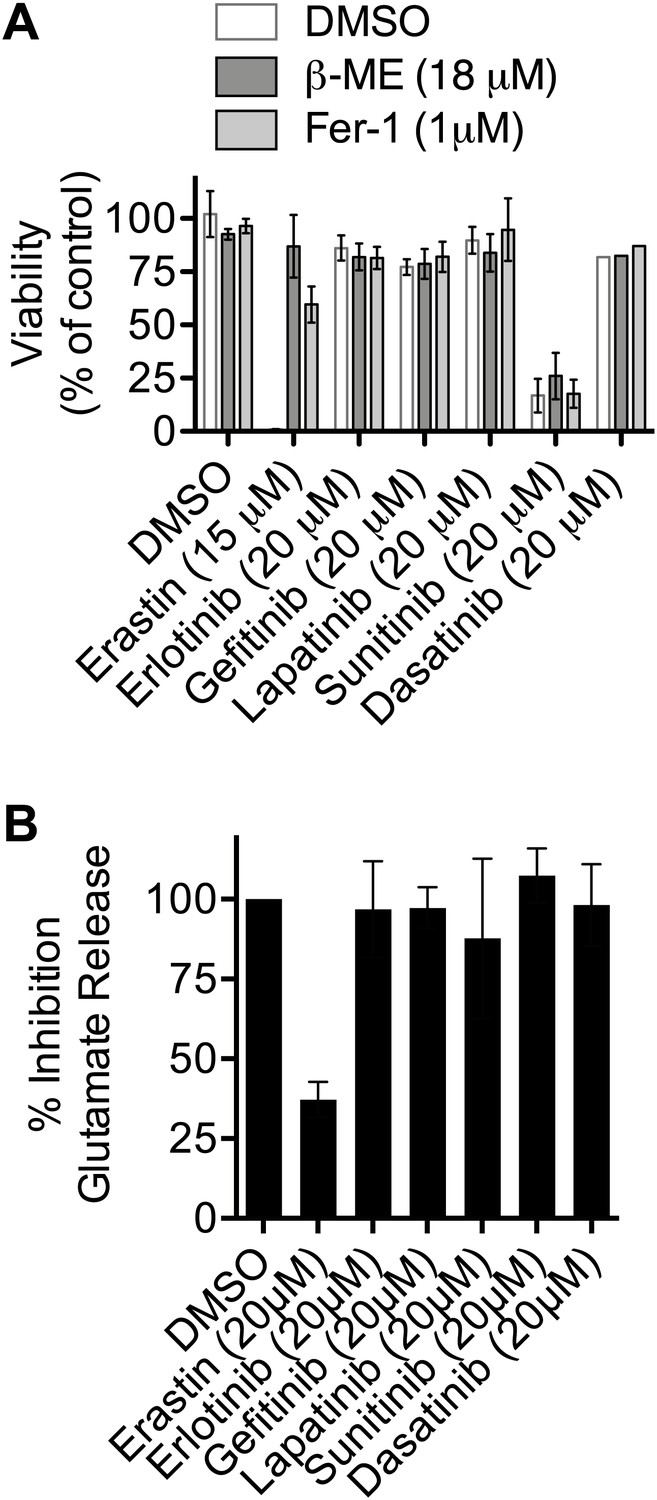
Test of the ability of various kinase inhibitors to induce ferroptosis and inhibit system xc−.
(A) Viability of HT-1080 cells in response to 48 hr treatment with erastin (as a control) or various kinase inhibitors ± β-ME and Fer-1. (B) Ability of kinase inhibitors to inhibit glutamate release in HT-1080 cells. Data represent the average of three experiments for all compounds except dasatinib in (A), which was tested only once.
Figure 8 with 1 supplement
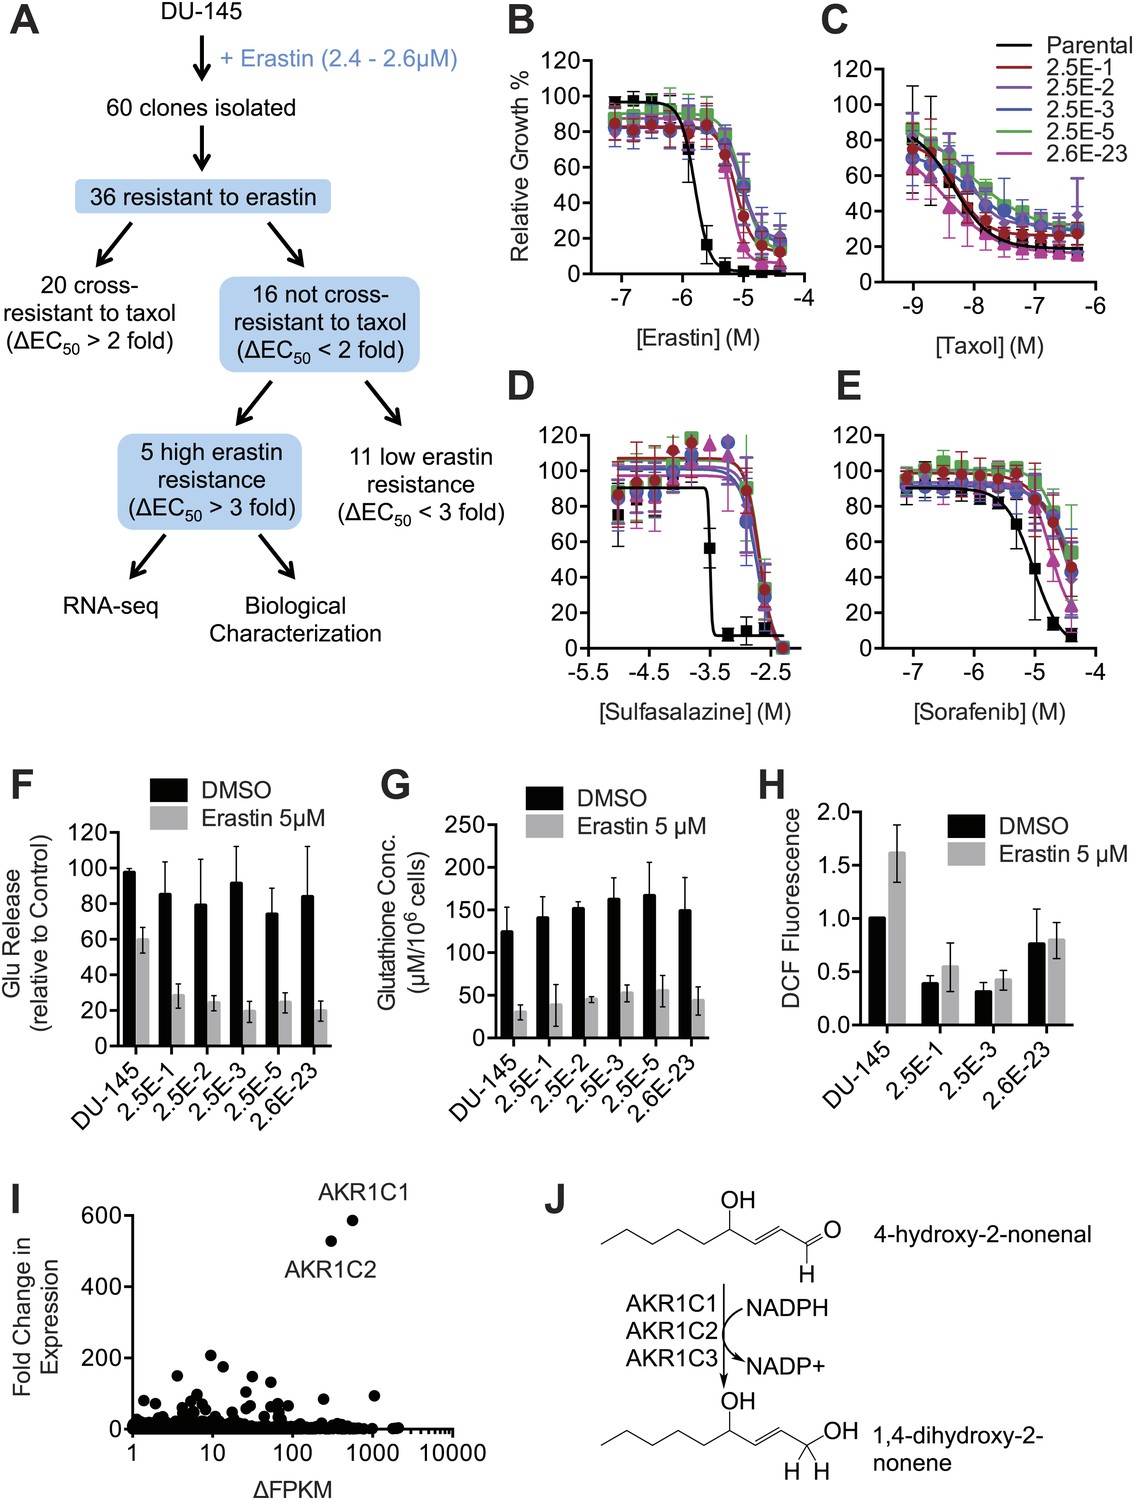
Isolation and analysis of erastin-resistant clones identifies AKR1C genes as mediators of resistance to system xc− inhibition.
(A) Outline of the isolation of DU-145 erastin-resistant clones. (B–H) Comparison of the parental DU-145 cell line and five erastin-resistant clonal lines to the indicated lethal compounds: (B–E), response to different lethal compounds, (F) Glutamate release, (G) Glutathione concentration, (H) DCF fluorescence. (I) Summary of RNA Seq analysis of the five erastin-resistant clones vs the parental DU-145 cells. Fold-change in expression (y-axis) and absolute change in FPKM (x-axis) is computed from the average of the five resistant cells lines vs parental. (J) Summary of AKR1C family member activity possibly relevant to ferroptosis.
Figure 8—figure supplement 1
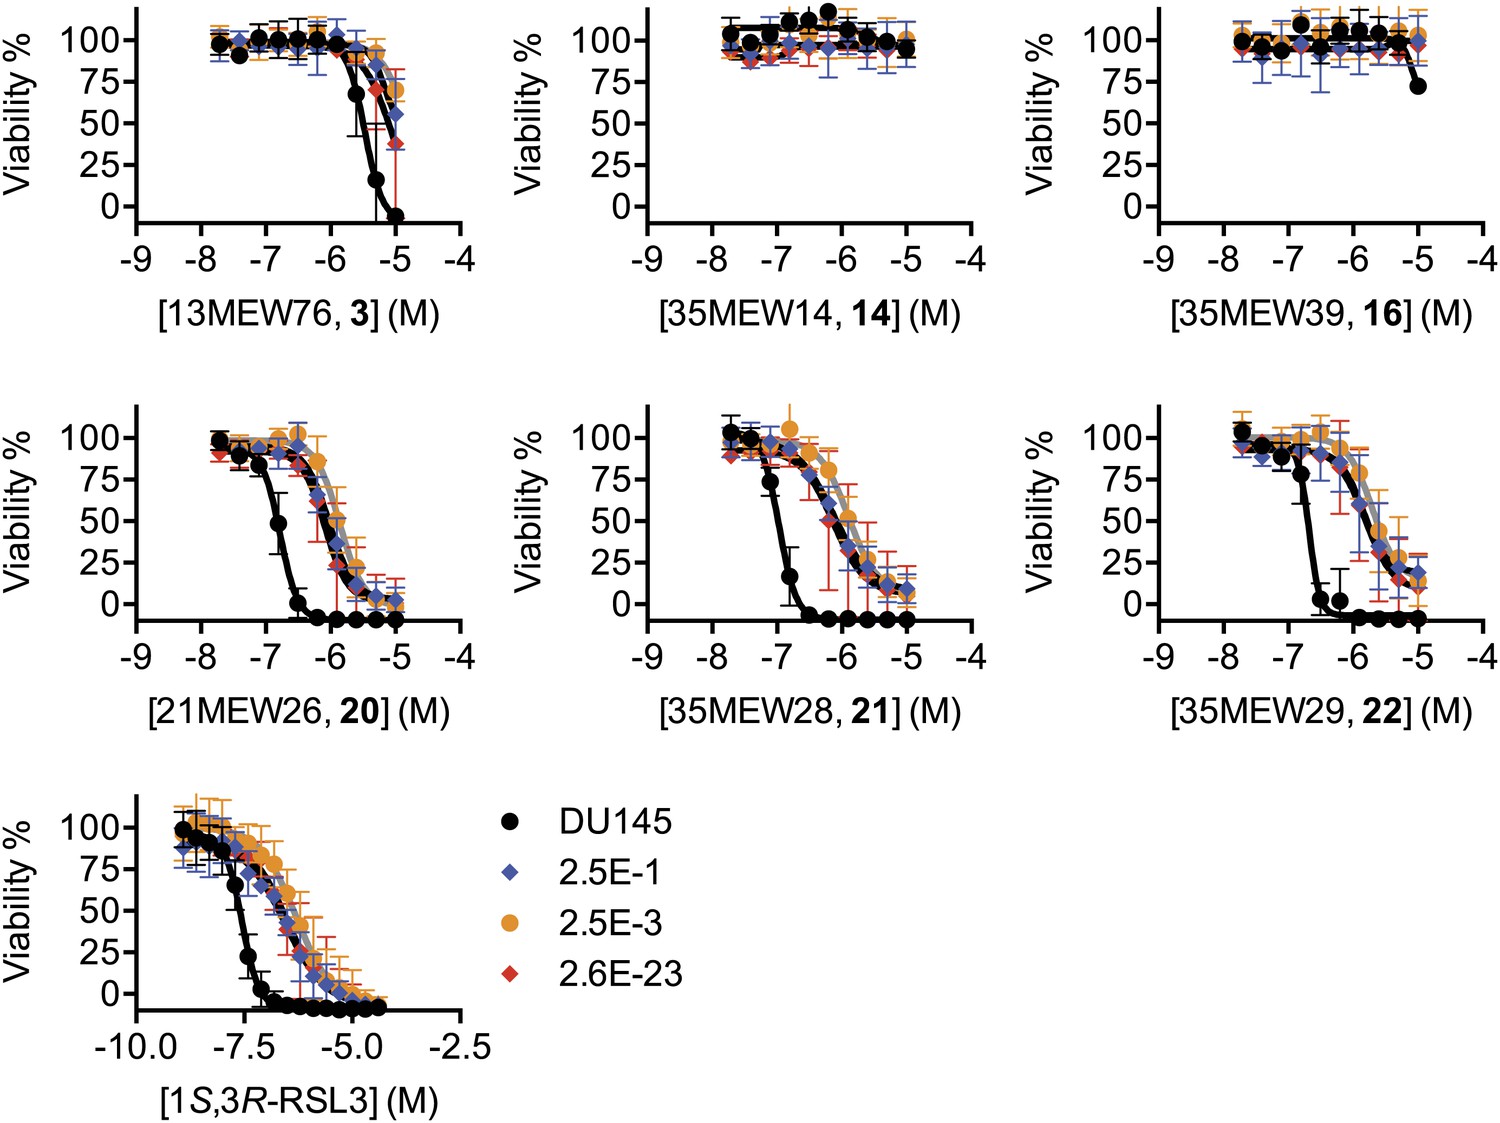
Test of the ability of additional ferroptosis inducers to cause death in parental DU-145 and erastin-resistant DU-145 cell lines.
Dose-response curves for parental DU-145 and erastin-resistant DU-145 clones treated with active (3, 20, 21, 22) and inactive (14, 16) erastin analogs and 1S,3R-RSL3. The color coding for all graphs is as shown in the legend of the 1S,3R-RSL3 graph. Data represent mean ± SD from three independent biological replicates.
Additional files
-
Supplementary file 1
Extended materials and methods. Description of chemical synthesis and characterization. Data also available as ‘Extended Materials and Methods’ from Dryad data Repository: http://dx.doi.org/10.5061/dryad.jp43c.
- https://doi.org/10.7554/eLife.02523.016
Download links
A two-part list of links to download the article, or parts of the article, in various formats.
Downloads (link to download the article as PDF)
Open citations (links to open the citations from this article in various online reference manager services)
Cite this article (links to download the citations from this article in formats compatible with various reference manager tools)
Pharmacological inhibition of cystine–glutamate exchange induces endoplasmic reticulum stress and ferroptosis
eLife 3:e02523.
https://doi.org/10.7554/eLife.02523


