Brassinosteroids control root epidermal cell fate via direct regulation of a MYB-bHLH-WD40 complex by GSK3-like kinases
- Fudan University, China
- The University of Tokyo, Japan
- Huazhong Agricultural University, China
Figures
Figure 1 with 1 supplement
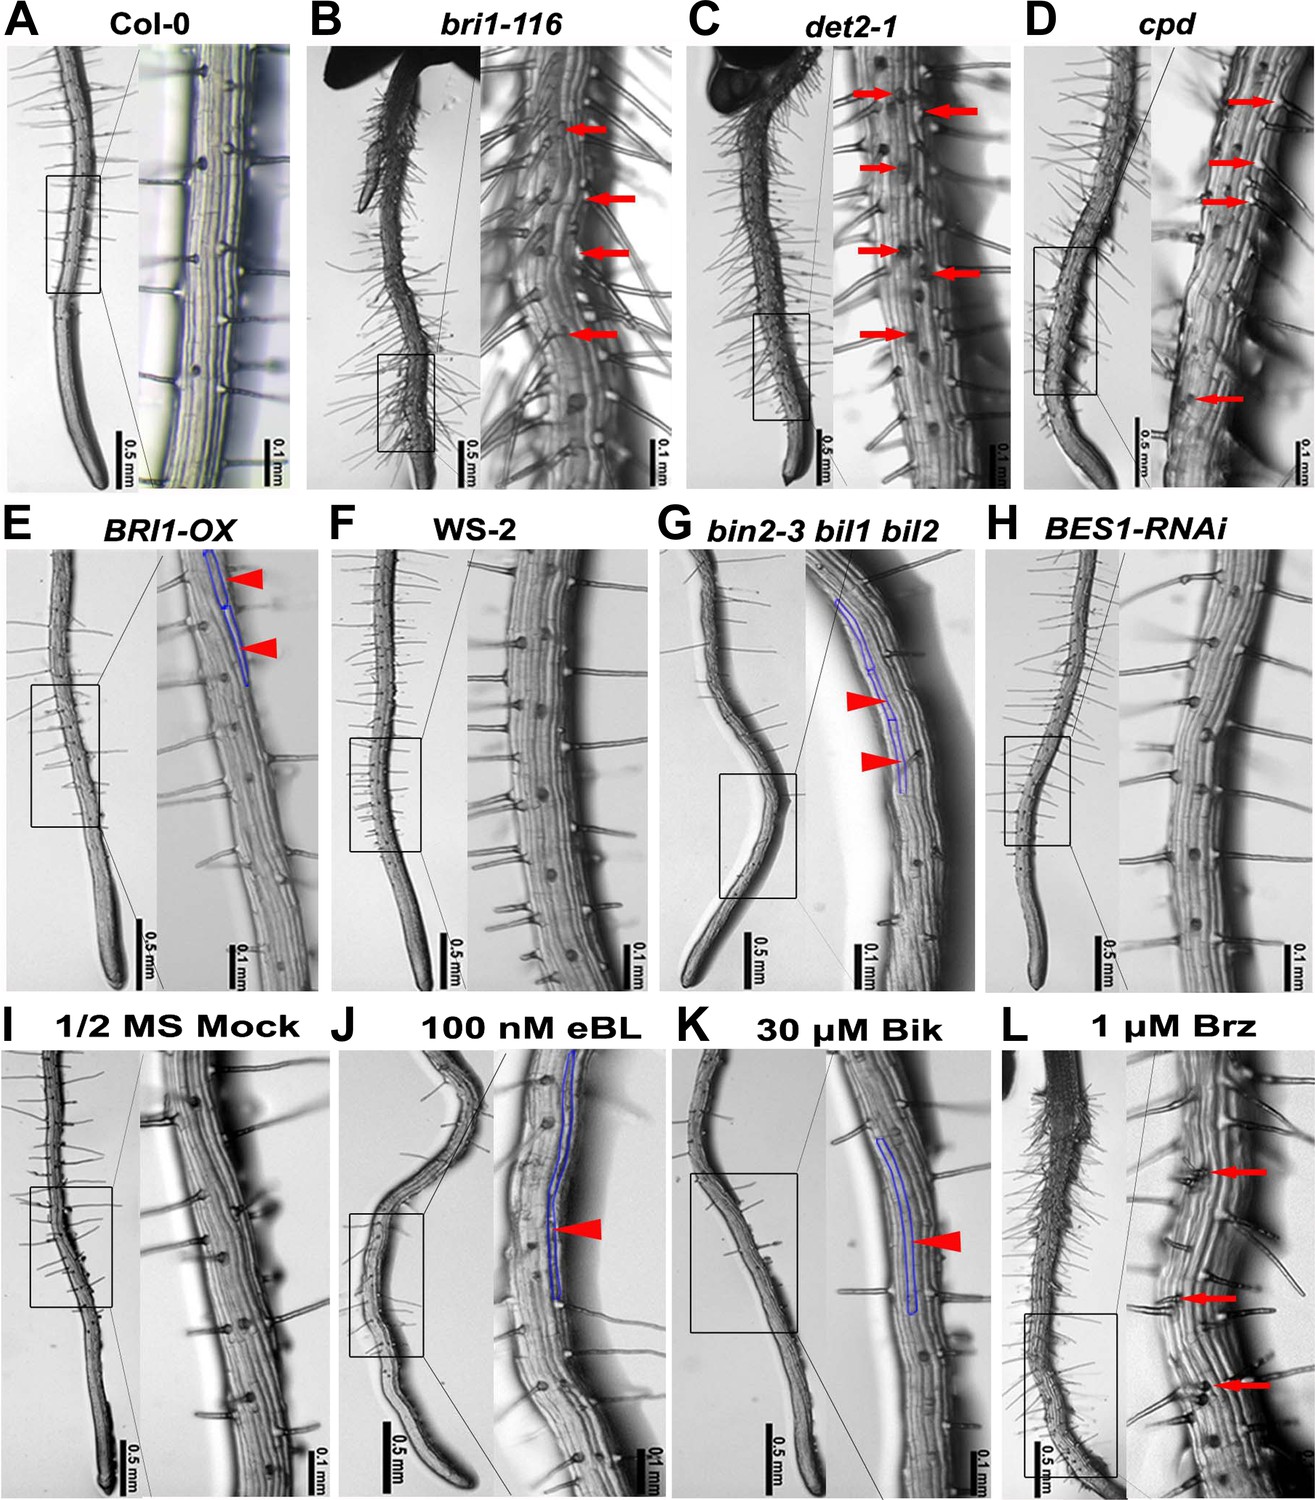
Root epidermal cell patterning is altered in the BR-related mutants.
(A–H) Root hair patterning of the BR-related mutants and their wild type counterparts. bin2-3 bil1 bil2 is in the WS-2 background, and all of the others are in the Col-0 background. (I–L) Root hair phenotype of the wild type plants grown on 1/2 MS (Murashige and Skoog) medium with DMSO (mock) (I), 100 nM epibrassinolide (eBL) (J), 30 μM bikinin (Bik) (K), or 1 μM brassinazole (Brz) (L). Right images are the outlined areas of left images with higher magnification. Arrows indicate ectopic root hair cells, and arrowheads indicate ectopic non-hair cells. Areas outlined with blue lines indicate the ectopic non-hair cells.
-
Figure 1—source data 1
Root hair density, cell length, and relative hair number of the BR-related mutants and wild type plants treated with eBL, bikinin, Brz, or DMSO
- https://doi.org/10.7554/eLife.02525.004
Figure 1—figure supplement 1
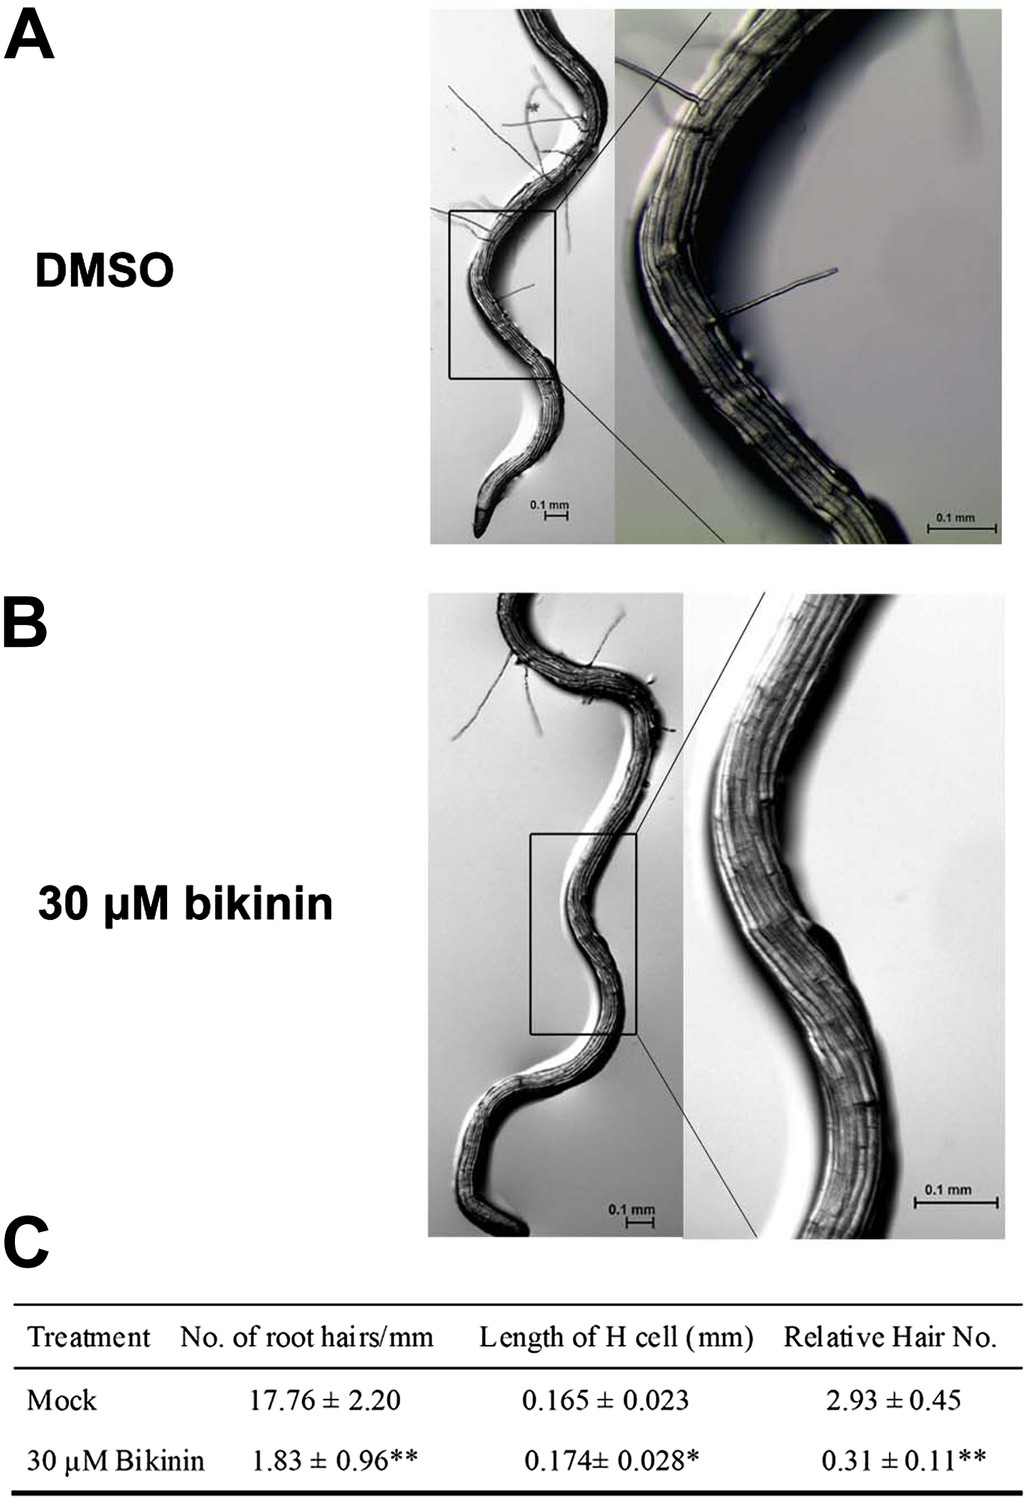
Bikinin treatment inhibited H cell fate in bin2-3 bil1 bil2 mutants.
Root hair phenotype of the bin2-3 bil1 bil2 mutants grown on medium with DMSO (mock) (A) or 30 μM bikinin (B); right images are the outlined areas of left images with higher magnification. (C) The root hair density, cell length, and relative hair number of the bin2-3 bil1 bil2 mutants treated with bikinin. Values are means ± SD. The two-tailed t test with equal variance or unequal variance was used to determine the significance level of the difference between the bin2-3 bil1 bil2 mutants treated with 30 μM bikinin and mock medium. *p<0.05; **p<0.01.
Figure 2
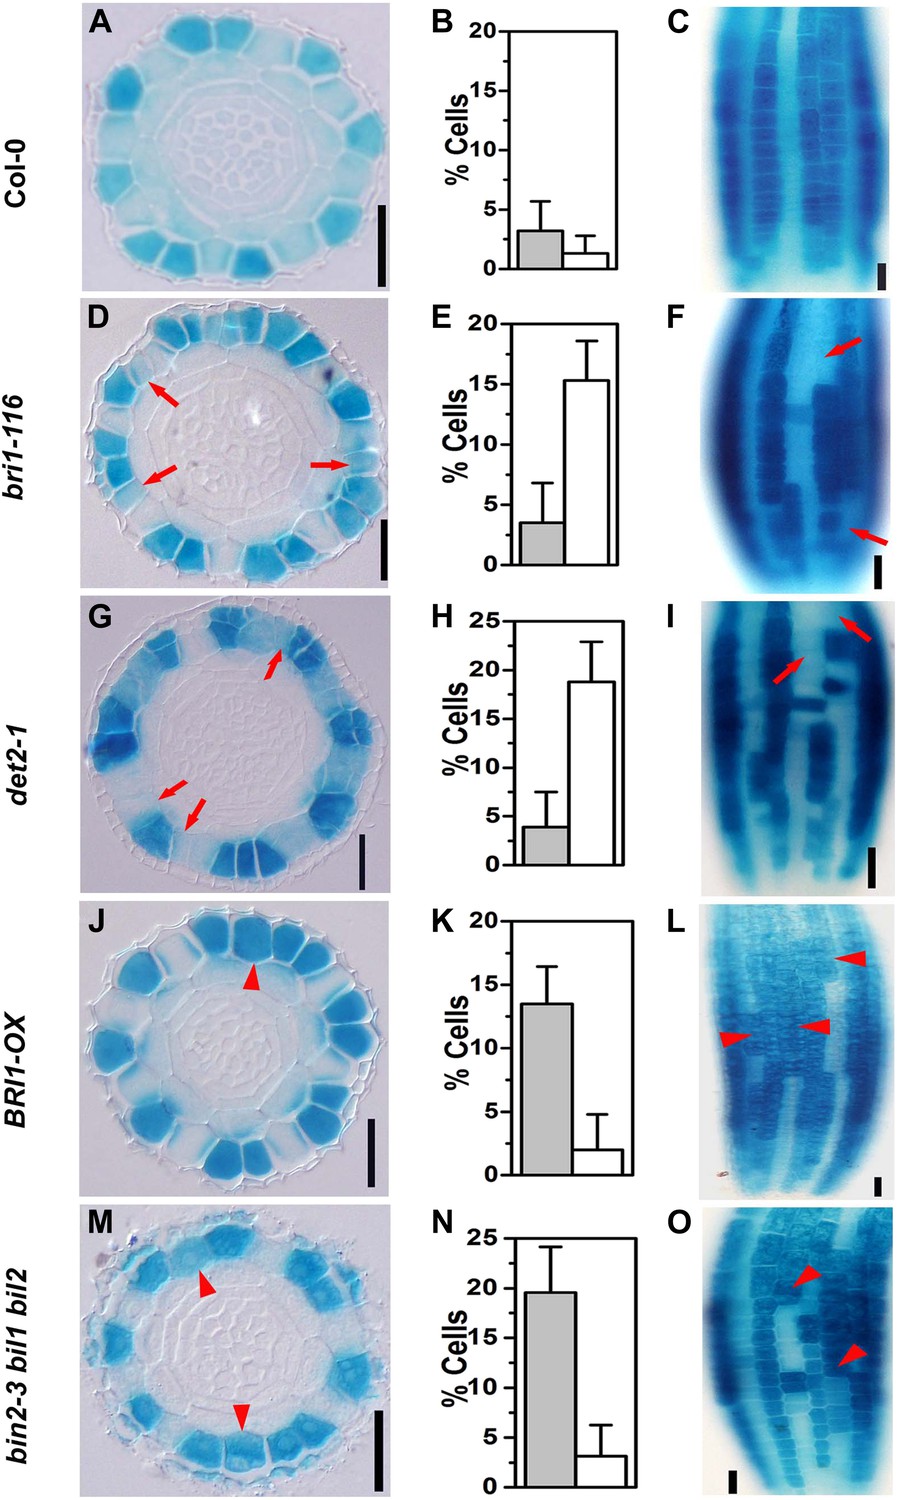
Expression pattern of PGL2::GUS is altered in the BR-related mutants.
Transverse sections from root meristem of Col-0 (A), bri1-116 (D), det2-1 (G), BRI1-OX (J), and bin2-3 bil1 bil2 (M). Frequency of cells without PGL2::GUS expression in the N cell position (open bars) and cells with ectopically expressed PGL2::GUS in the H cell position (solid bars) of Col-0 (B), bri1-116 (E), det2-1 (H), BRI1-OX (K), and bin2-3 bil1 bil2 (N). Longitudinal images of the root epidermal cells in Col-0 (C), bri1-116 (F), det2-1 (I), BRI1-OX (L), and bin2-3 bil1 bil2 (O). Scale bars, 25 μm. Red arrows indicate N cells without PGL2::GUS expression, and red arrowheads indicate H cells ectopically expressing PGL2::GUS. For each genotype, n = 8. Error bars indicate standard deviation (SD).
Figure 3
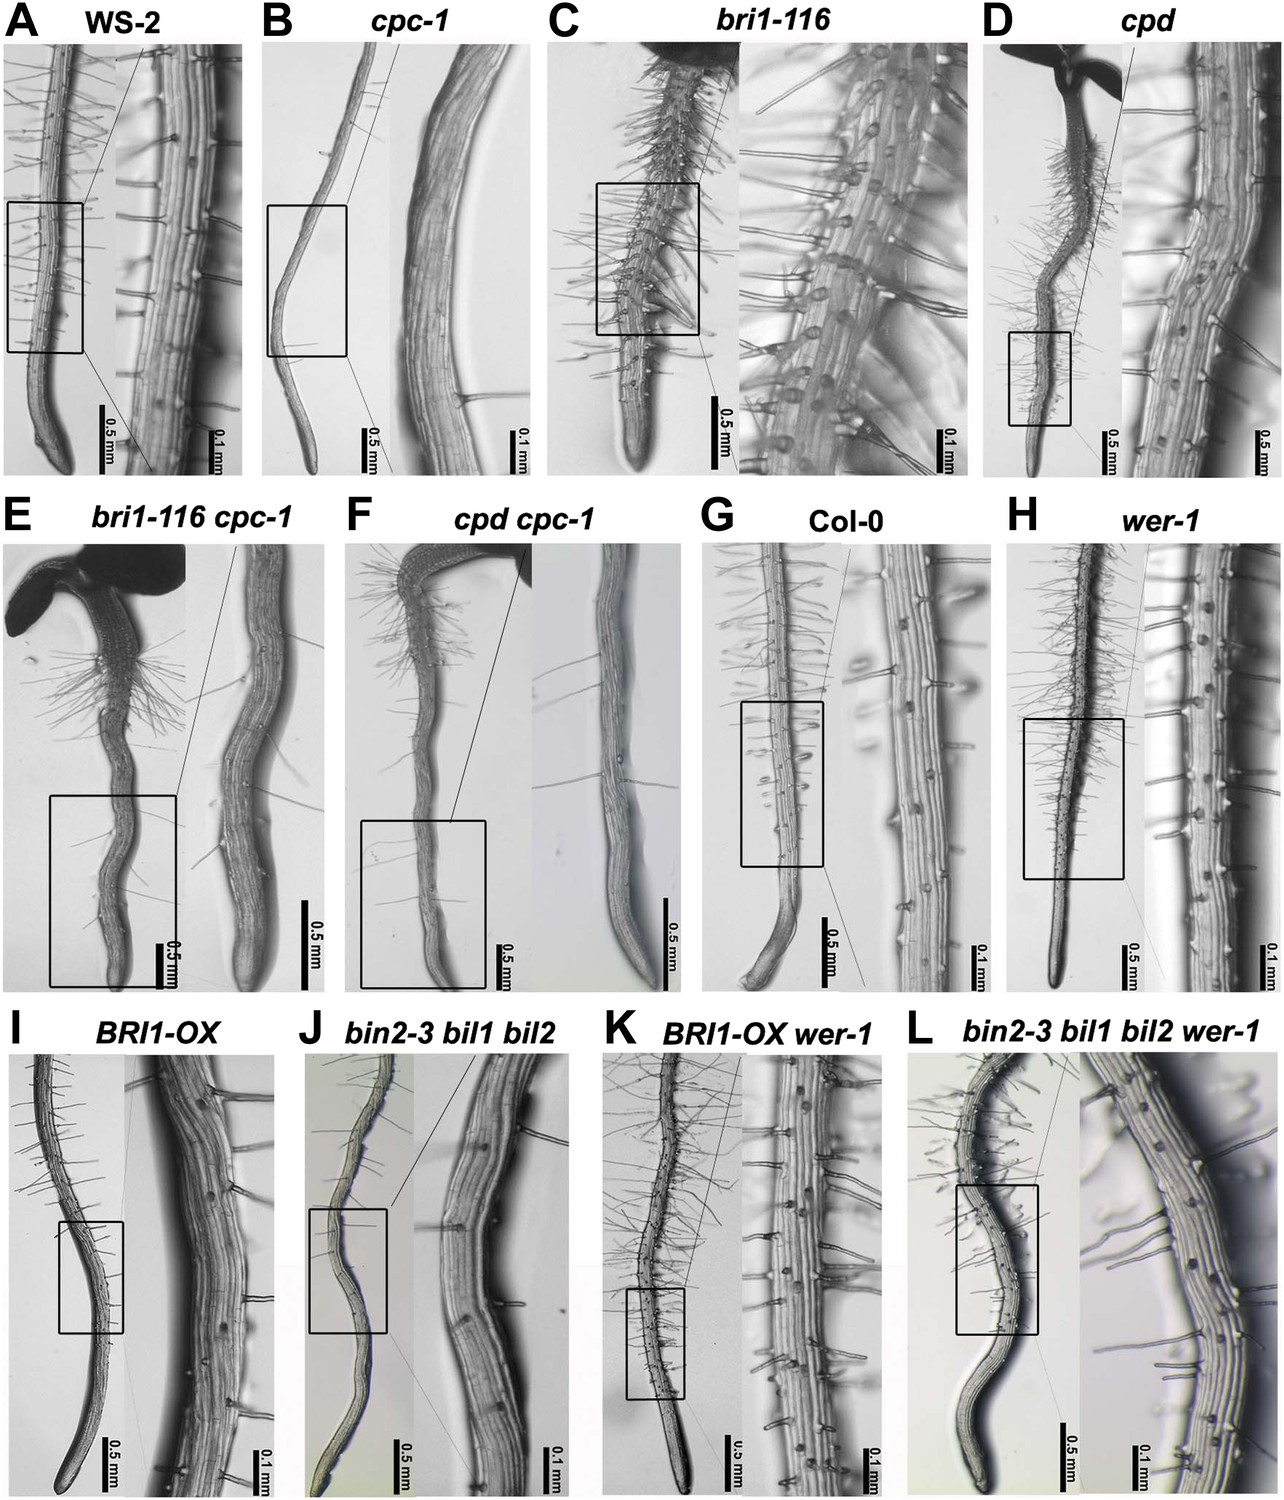
BR signaling acts upstream of CPC and WER to regulate root epidermal cell fate.
Root hair phenotype of the wild type WS-2 (A) and double mutants of cpc-1 (B) with bri1-116 (C) or cpd (D), including bri1-116 cpc-1 (E) and cpd cpc-1 (F). Root hair phenotype of the wild type Col-0 (G) and the double/multiple mutants of wer-1 (H) with BRI1-OX (I) or bin2-3 bil1 bil2 (J), including BRI1-OX wer-1 (K) and bin2-3 bil1 bil2 wer-1 (L). cpc-1 is in the WS-2 background. BR: brassinosteroid.
Figure 4 with 1 supplement
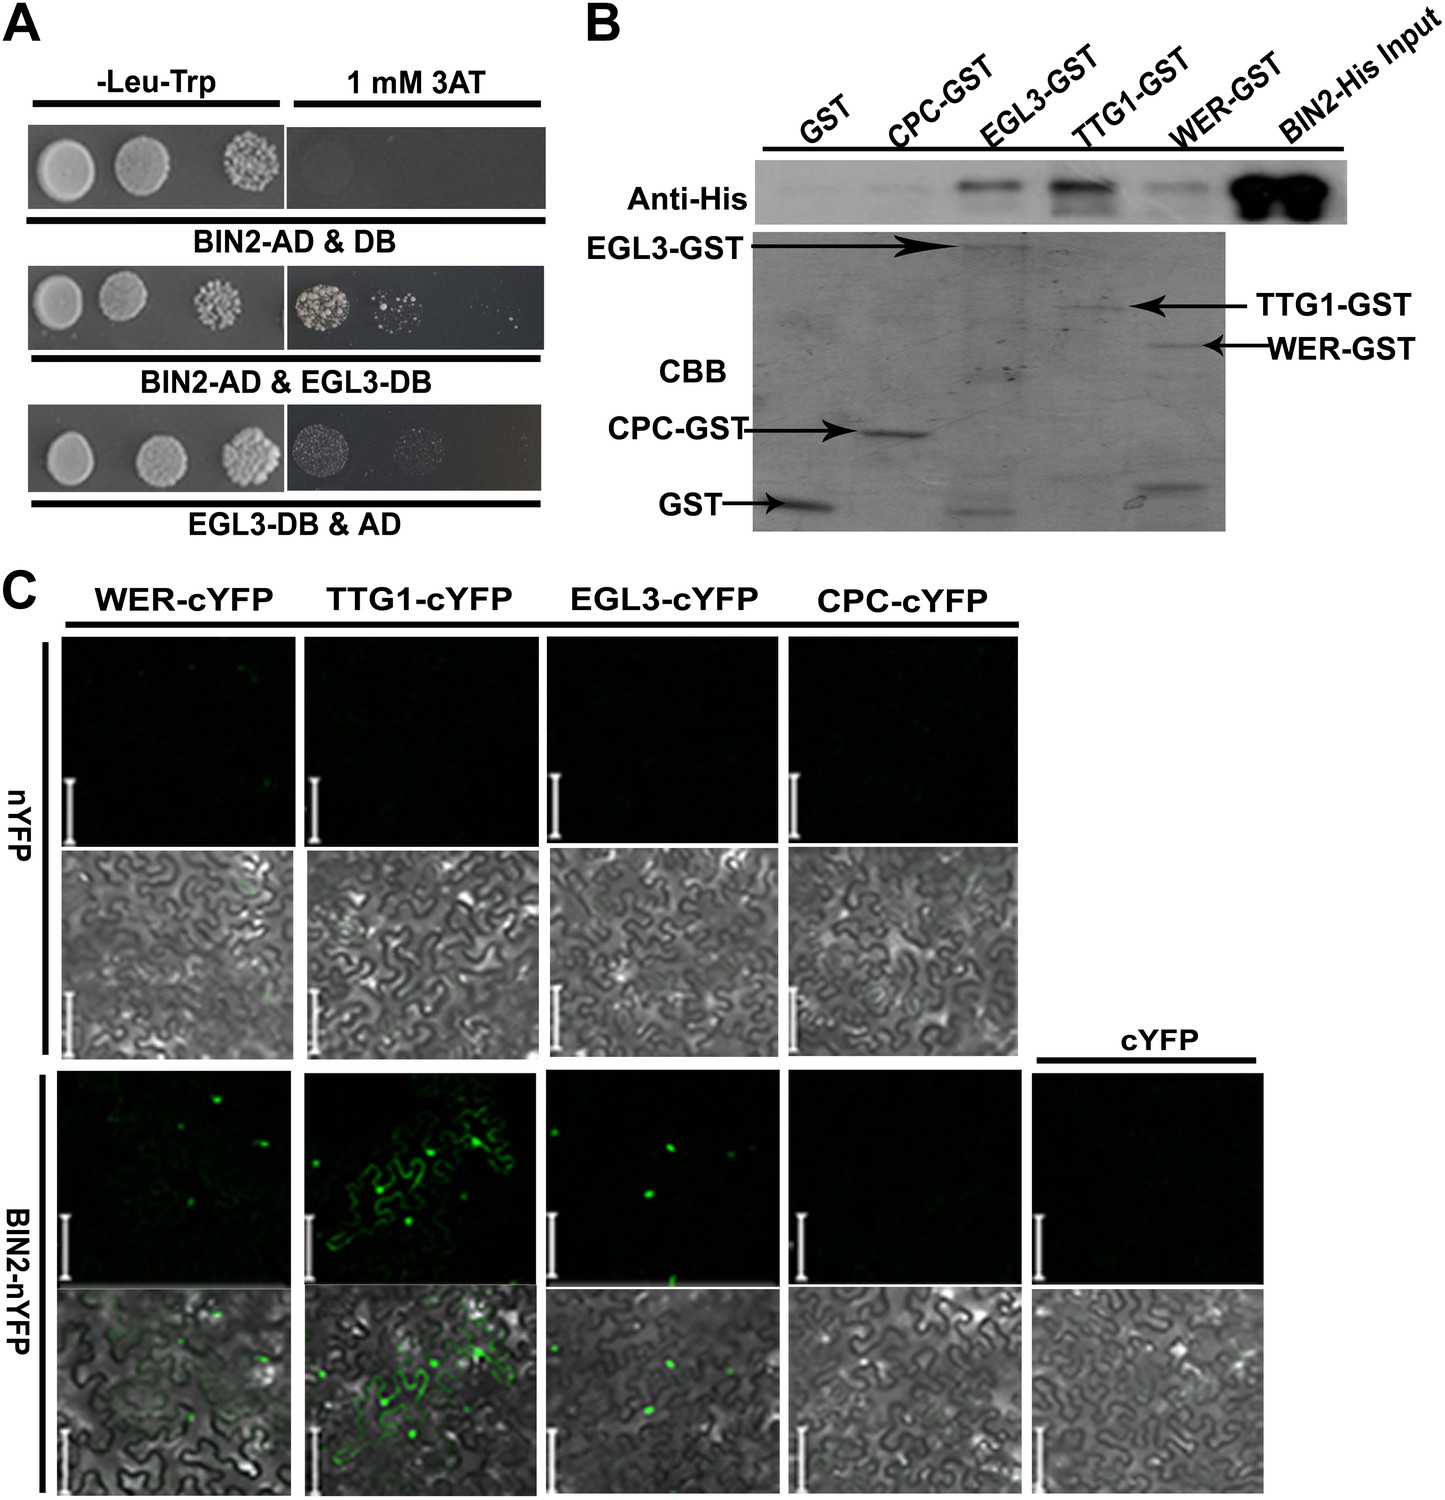
BIN2 interacts with EGL3, TTG1, and WER.
(A) BIN2 interacts with EGL3 in yeast two-hybrid assays. (B) The interaction of BIN2-His with CPC-GST, EGL3-GST, TTG1-GST, and WER-GST in vitro. The BIN2-His pulled-down by CPC-GST, EGL3-GST, TTG1-GST, and WER-GST, or GST was detected by western blotting with anti-His antibody (top). The purified BIN2-His protein was used as inputs. An equal loading of recombinant proteins was indicated by Coomassie brilliant blue (CBB) staining (bottom). (C) BiFC assays of the interaction between BIN2 with EGL3, TTG1, and WER. Scale bars, 20 μm.
Figure 4—figure supplement 1
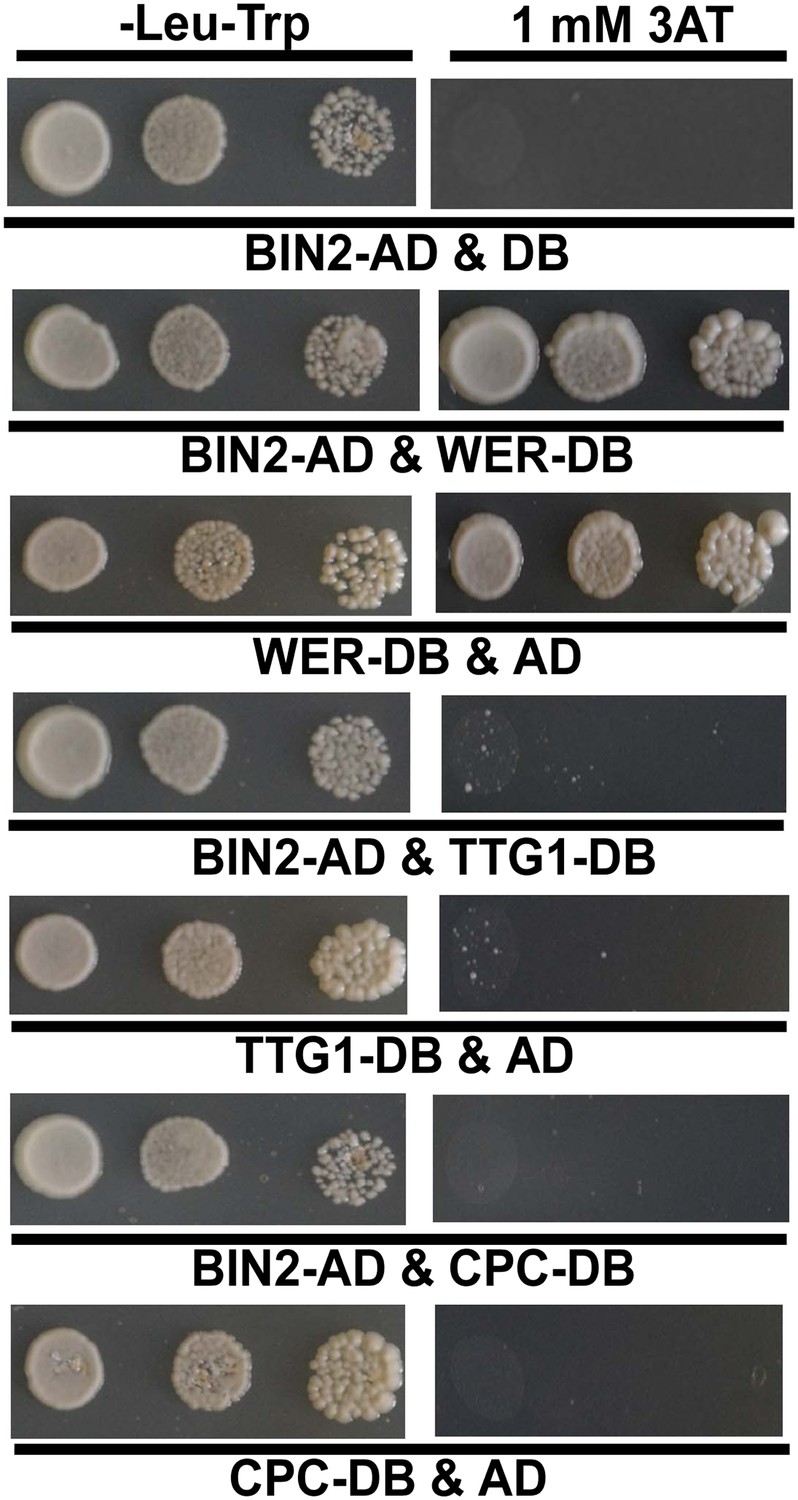
Yeast two-hybrid assays to test interactions of BIN2 with WER, TTG1, or CPC.
The full-length cDNA of each corresponding gene was fused with the GAL4-BD or AD domain. Yeast cells harboring the indicated constructs were grown on the synthetic media lacking Trp and Leu, or Trp, Leu, and His with an additional 1 mM 3AT.
Figure 5 with 1 supplement
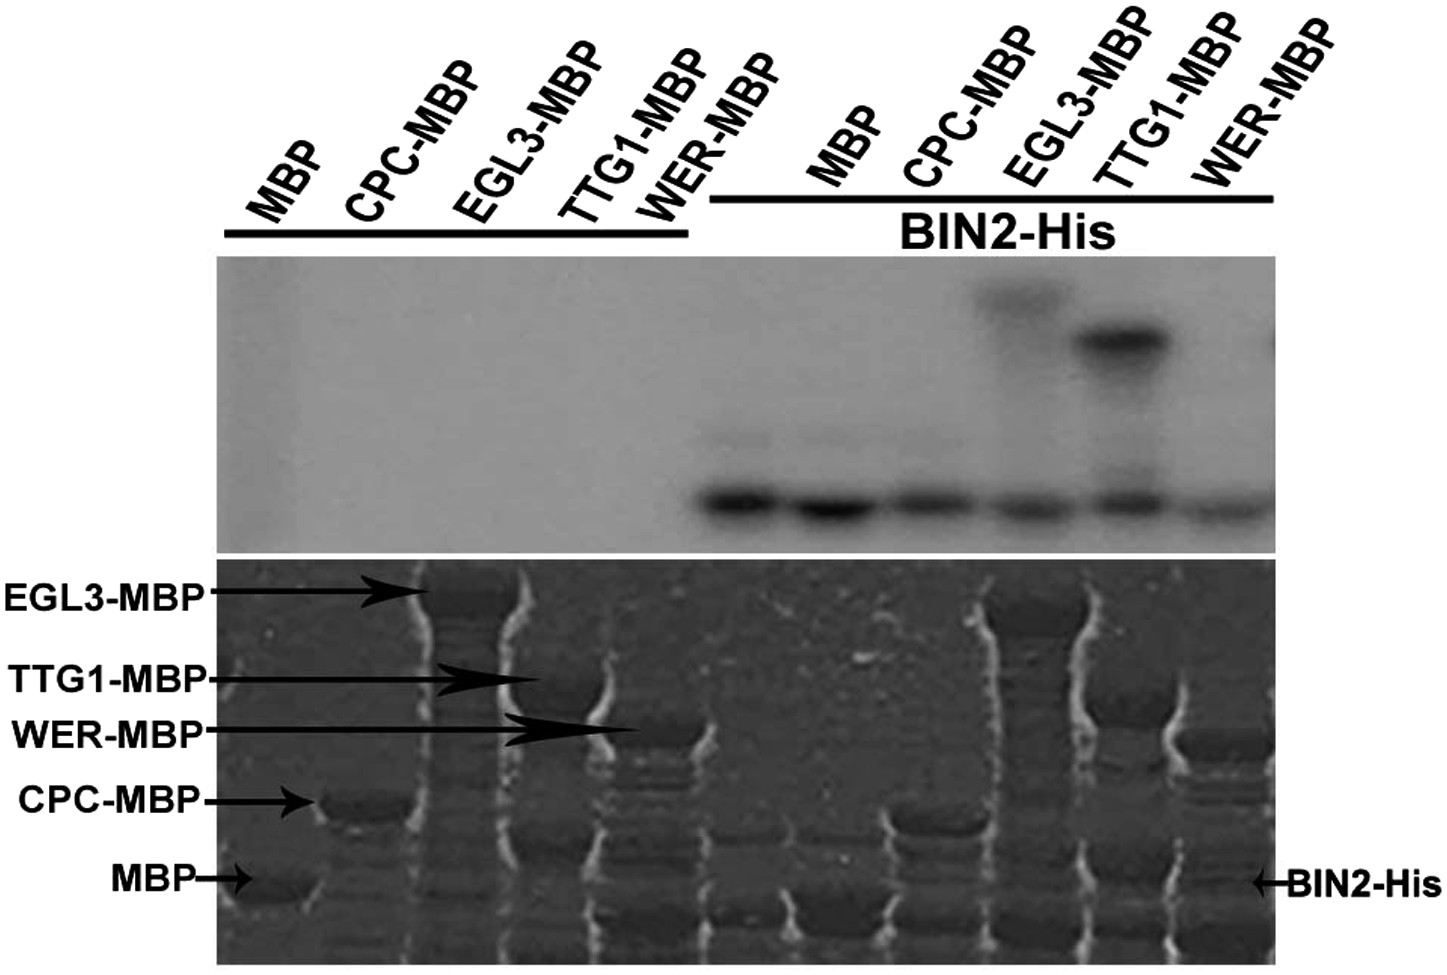
BIN2 phosphorylates EGL3 and TTG1, but not WER and CPC in vitro.
An equal amount of recombinant BIN2 kinase indicated by Coomassie brilliant blue (CBB) staining (bottom) was incubated with recombinant MBP, WER-MBP, CPC-MBP, EGL3-MBP, or TTG1-MBP, separated by SDS–PAGE, and followed by autoradiography (top).
Figure 5—figure supplement 1
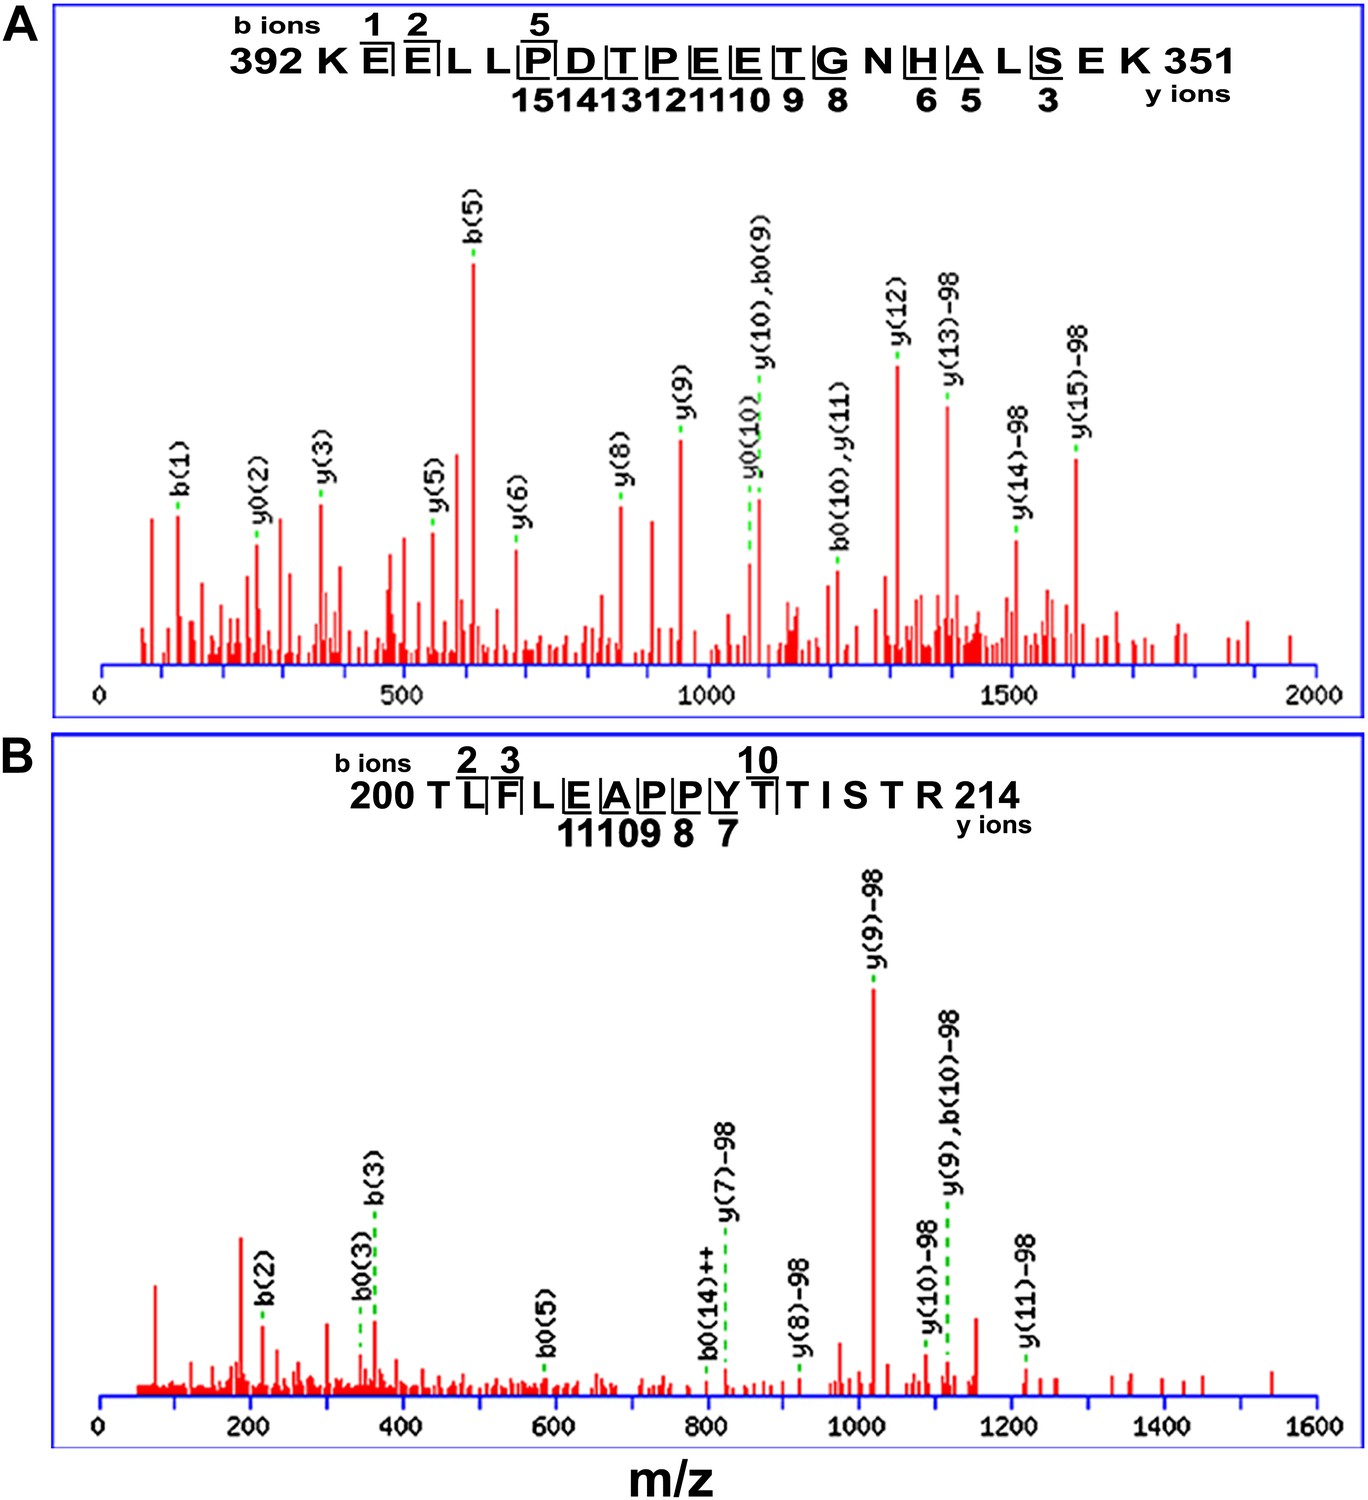
Mass spectrometry analysis of EGL3 phosphorylation sites.
Putative phosphorylation sites are in T399PEET403 (A) and T209TIST213 fragments (B).
Figure 6 with 1 supplement
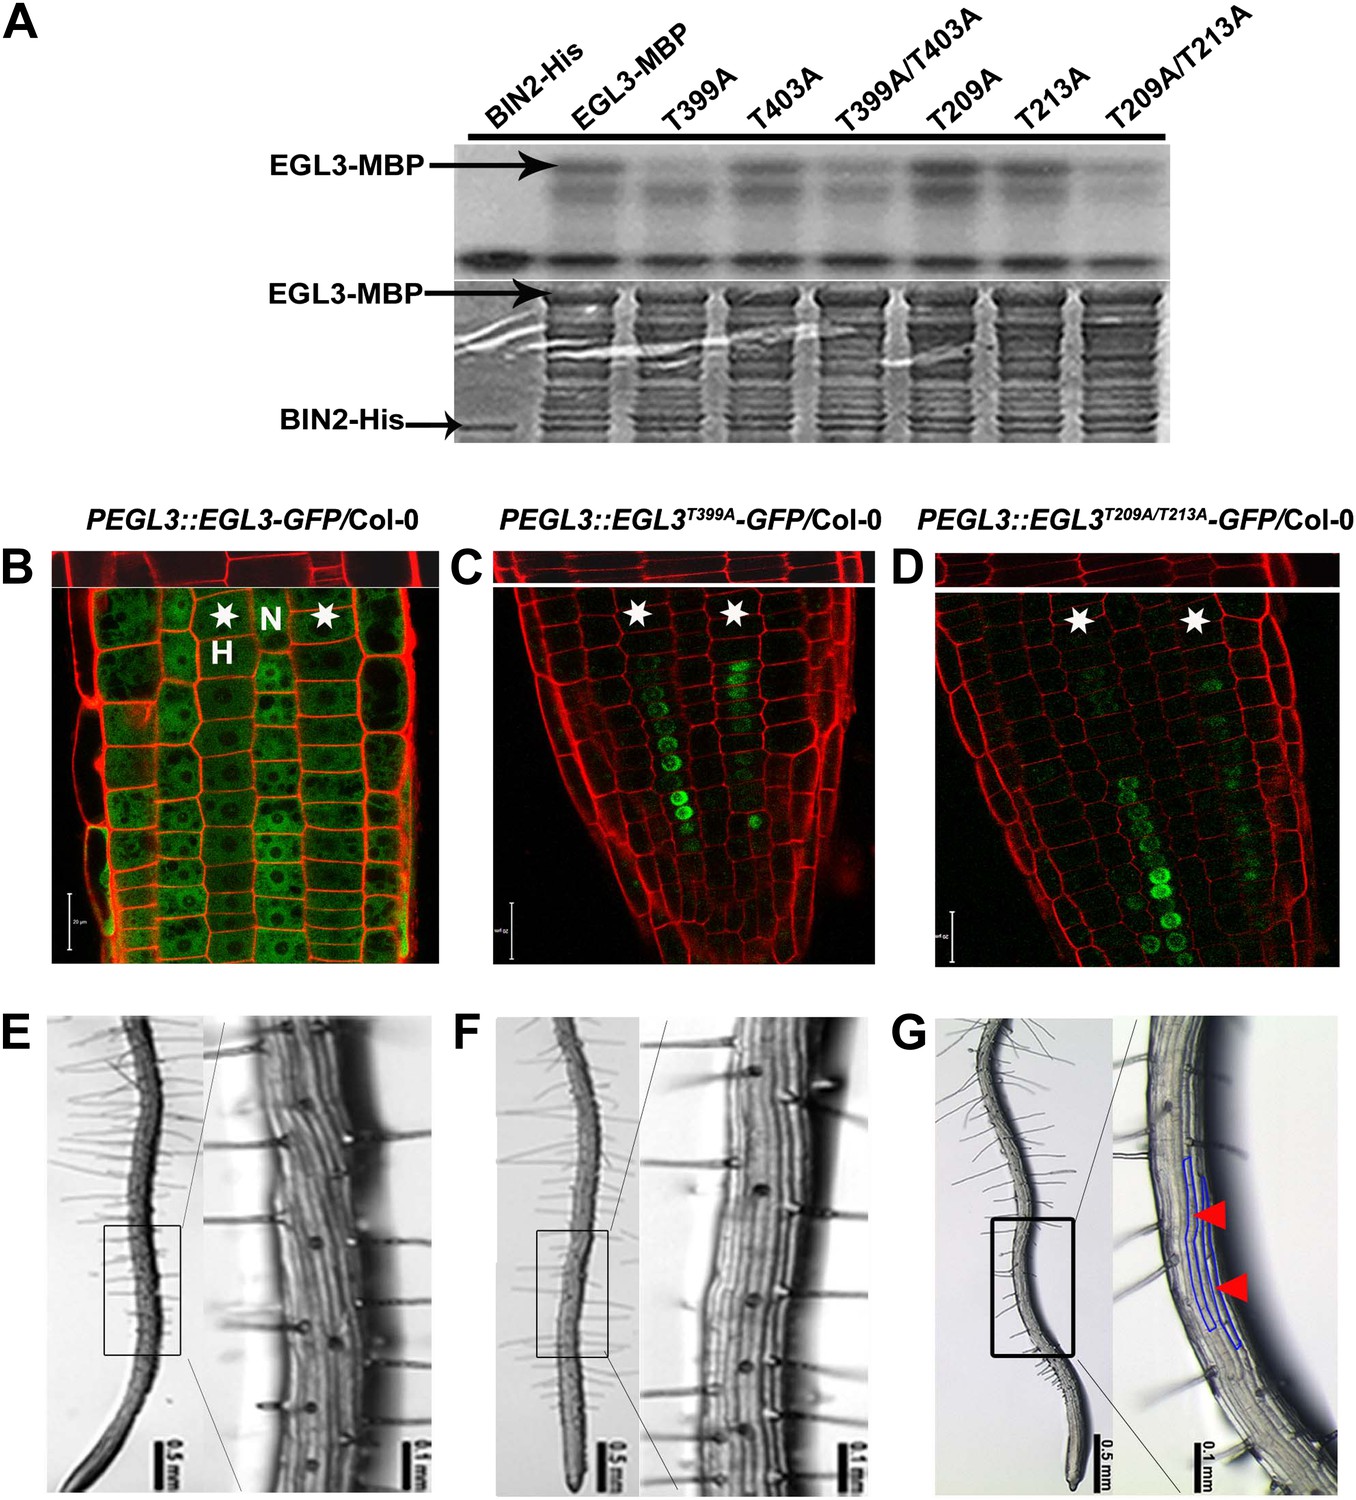
BIN2 phosphorylates EGL3 to regulate its subcellular localization and root epidermal cell fate.
(A) BIN2 phosphorylates EGL3 on T399 and T209/T213. An equal amount of recombinant protein, as indicated by Coomassie brilliant blue (CBB) staining (bottom panel), was incubated in phosphorylation buffer, separated by SDS–PAGE, and followed by autoradiography (top panel). (B) EGL3-GFP is predominantly localized in N cell nuclei. Both EGL3T399A-GFP (C) and EGL3T209A/T213A-GFP (D) are solely localized in H cell nuclei. For (B–D), the 5-day-old roots were stained with propidium iodide (red) for 10 s for visualizing the cell wall. The top panels show the underlying cortex. The stars indicate H cells. Scale bars, 20 μm. (E–G) Root hair patterns of EGL3-GFP (E), EGL3T399A-GFP (F), and EGL3T209A/T213A-GFP (G) transgenic plants. Outlined areas in the left images are magnified in the right images. Red arrowheads and areas outlined with blue lines indicate ectopic non-root hair cells in the H position.
-
Figure 6—source data 1
EGL3 amino acid sequence analysis
- https://doi.org/10.7554/eLife.02525.013
Figure 6—figure supplement 1
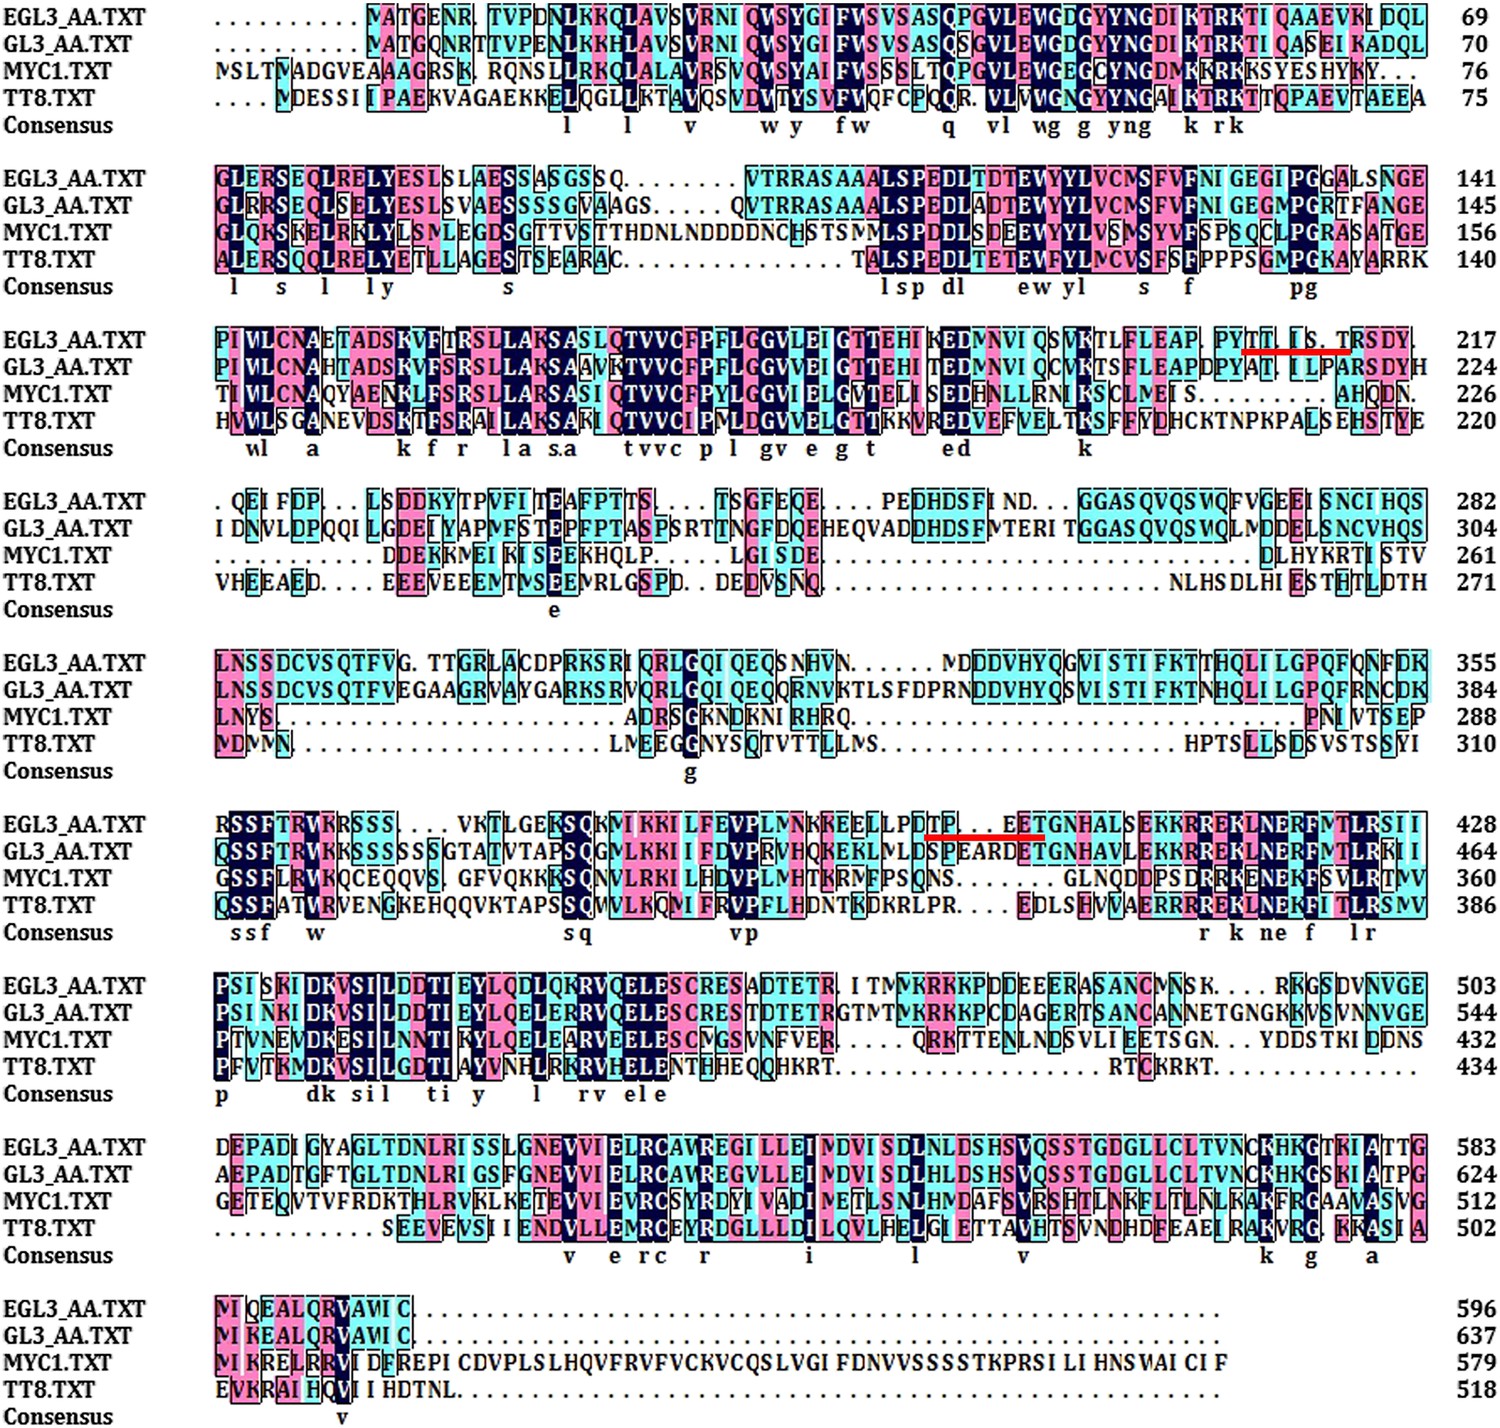
Alignment of EGL3 amino acid sequence with other bHLH homologues in Arabidopsis.
The sequences underlined in red indicate the 209TTIST213 and 399TPEET403 regions of EGL3.
Figure 7 with 1 supplement
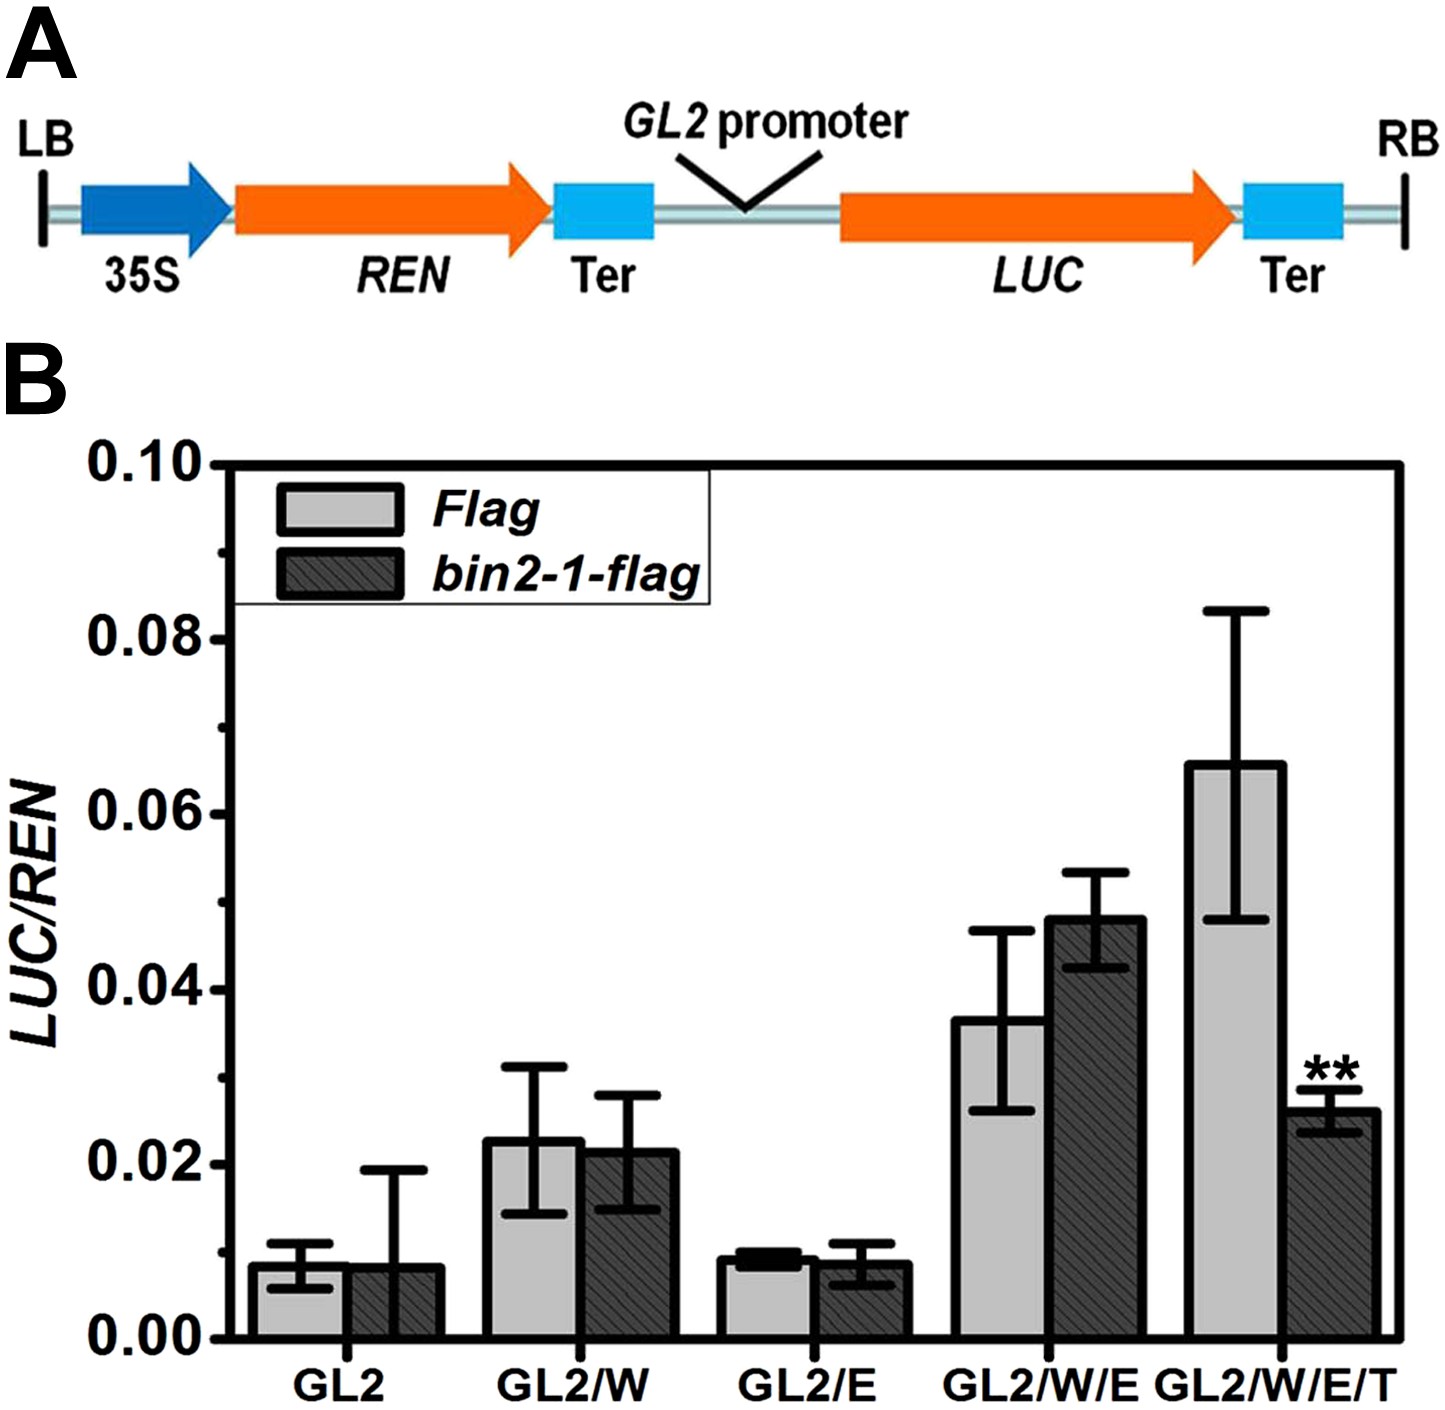
BIN2 inhibits the transcription activity of the WER-EGL3-TTG1 complex through TTG1.
(A) Schematic diagram of the dual-luciferase reporter construct. The firefly luciferase (LUC) reporter gene was driven by GL2 promoter. The Renillia luciferase (REN) reporter gene was controlled by Cauliflower mosaic virus promoter (35S) and terminator (Ter). (B) bin2-1 inhibits PGL2::LUC expression only when TTG1 is co-expressed with WER and EGL3. Relative reporter activity in Nicotiana benthamiana leaf cells transiently transformed with the indicated effector, reporter, and regulatory constructs. G, W, E, and T indicate GL2, WER, EGL3, and TTG1, respectively. Error bars indicate SD. **p<0.01 determined by the two-tailed Student's t test.
Figure 7—figure supplement 1
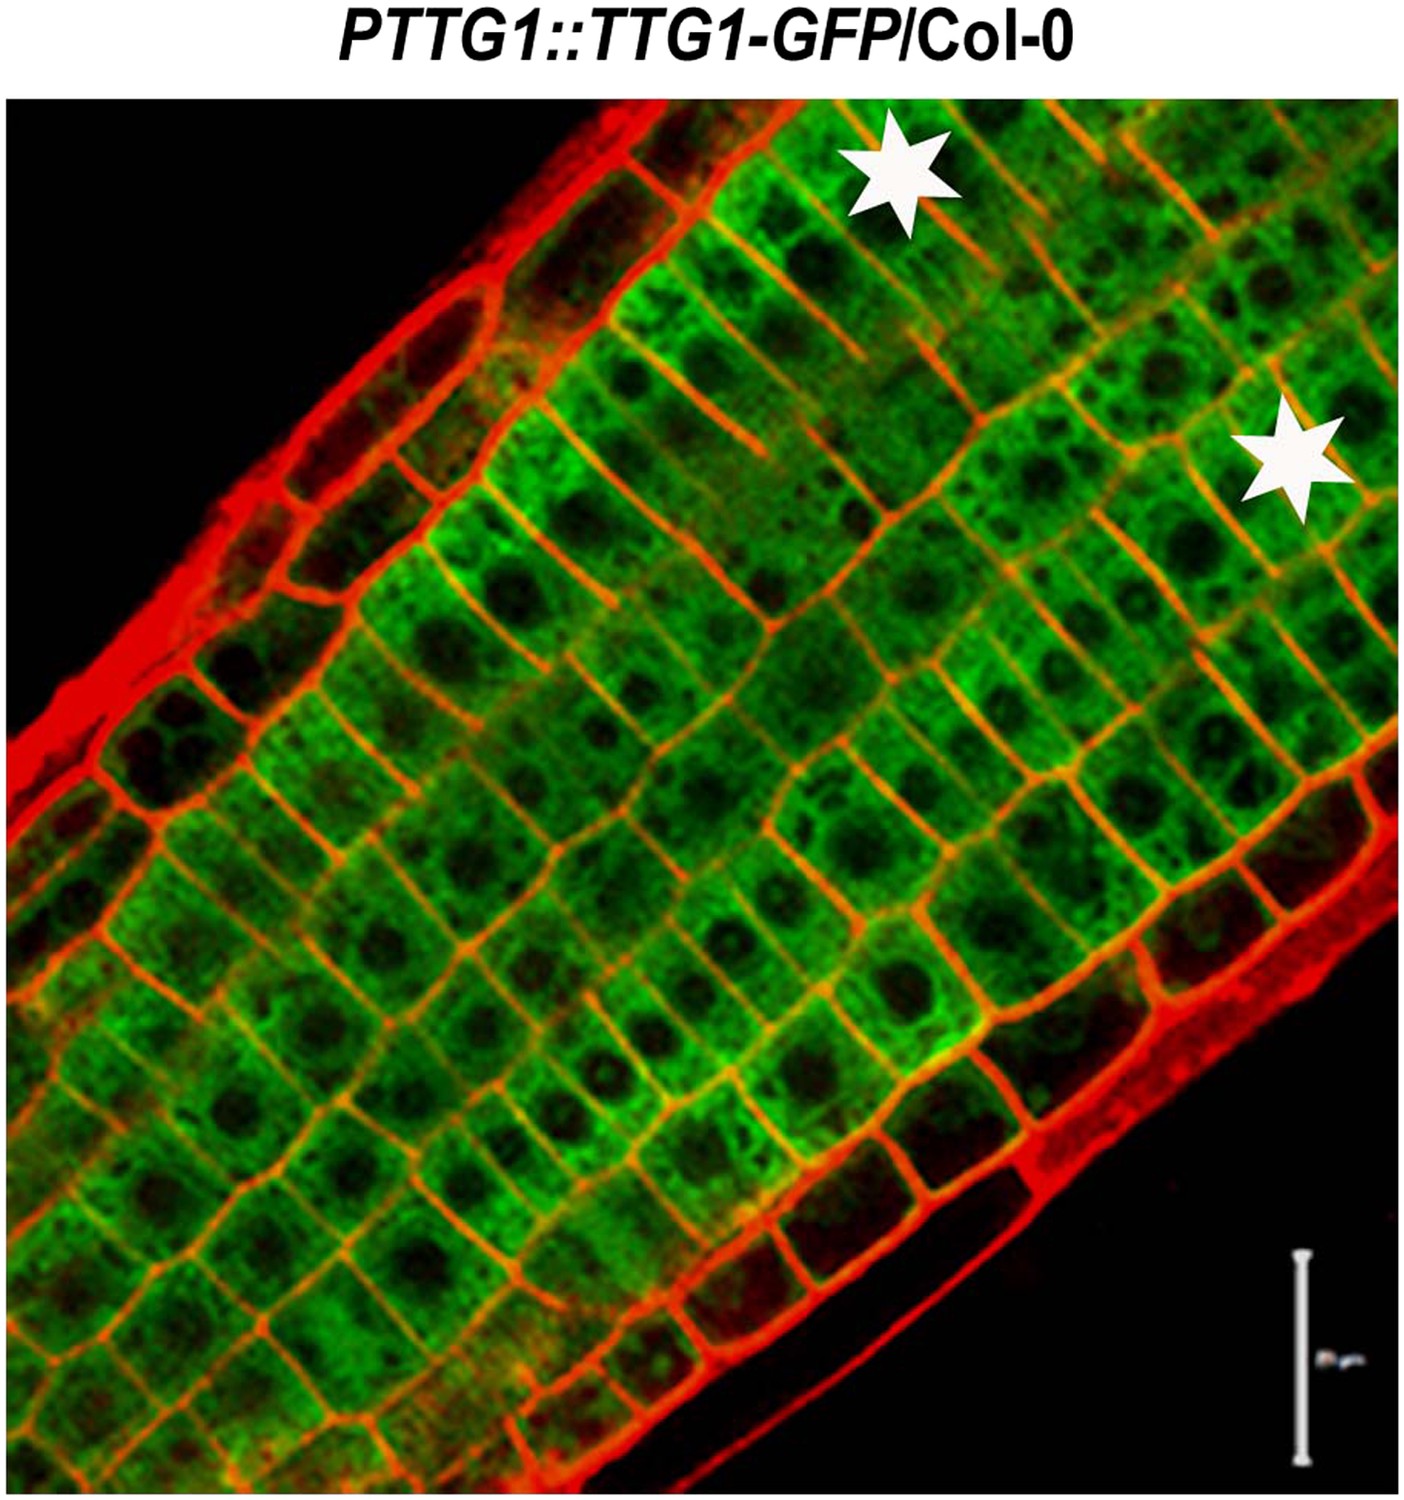
Subcellular localization of TTG1-GFP in Col-0 root epidermal cells.
Stars indicate H cells. Scale bars, 20 μm.
Figure 8 with 1 supplement

A proposed model to illustrate how BR signaling regulates root epidermal cell fate.
Without BR early signaling, WER expression is reduced, and the activated GSK3-like kinases phosphorylate EGL3 and TTG1 in both H and N cells, leading to reduced formation and/or activity of the WER-EGL3/GL3-TTG1 complex, which inhibits GL2 expression in some N cells. With enhanced BR early signaling, WER expression is enhanced in both H and N cells, and the GSK3-like kinases activity is inhibited, leading to reduced phosphorylation of EGL3 and TTG1 in both cell types. Thus, WER-EGL3-TTG1 and WER-GL3-TTG1 complexes with transcriptional activity are formed in H and N cells, respectively, to promote GL2 expression and non-root hair cell fate. BR: brassinosteroid.
Figure 8—figure supplement 1
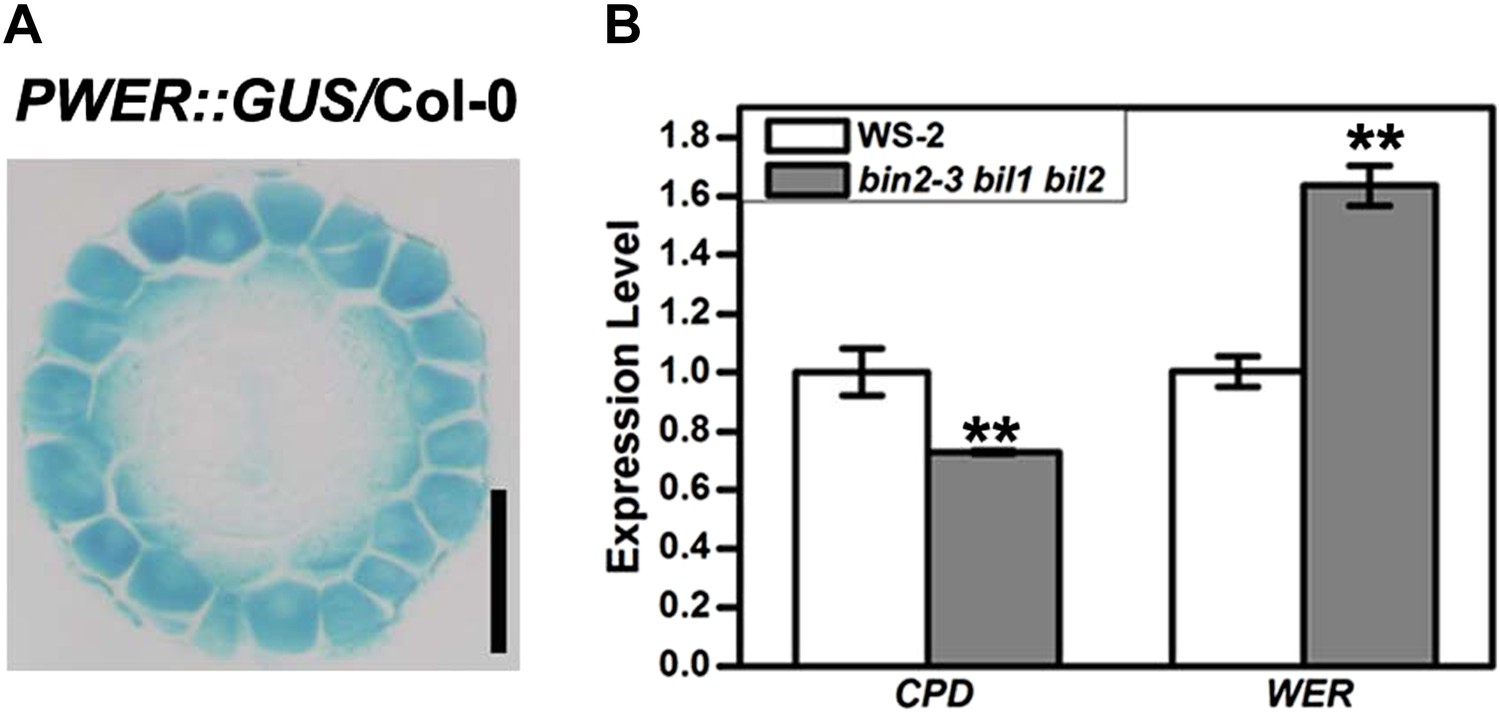
WER expression pattern in the root early meristem and its expression level in the bin2-3 bil1 bil2 and wild type Col-0.
(A) Transverse section from the root meristem of the PWER::GUS transgenic plant. Scale bar, 25 μm. (B) The WER expression level was enhanced in the bin2-3 bil1 bil2 mutant. CPD (CONSTITUTIVE PHOTOMORPHOGENIC DWARF), a BR biosynthetic gene feedback inhibited by BR signaling, was used as a control. The expression level of CPD and WER in WS-2 was normalized to ‘1’, and a U-BOX gene (At5g15400) was used as an internal control. Error bars indicate SD. **p<0.01 with a two-tailed Student's t test. BR: brassinosteroid.
Tables
Table 1
The effect of EGL3 and its two mutated forms on root epidermal cell pattern formation
| Genotype | Cells in the H position | Cells in the N position | ||
|---|---|---|---|---|
| Hair cells (%) | Non-hair cells (%) | Hair cells (%) | Non-hair cells (%) | |
| Col-0 | 98.9 ± 3.3 | 1.1 ± 3.3 | 2.0 ± 4.5 | 98.0 ± 4.5 |
| PEGL3::EGL3-GFP | 95.8 ± 6.1 | 4.2 ± 6.1 | 1.9 ± 4.2 | 98.1 ± 4.2 |
| PEGL3::EGL3T399A-GFP | 93.1 ± 6.4 | 6.9 ± 6.4 | 2.8 ± 6.0 | 97.2 ± 6.0 |
| PEGL3::EGL3T209A/T213A-GFP | 85.5 ± 4.4* | 14.5 ± 4.4* | 1.0 ± 3.2 | 99.0 ± 3.2 |
-
At least 10 different 5-day-old roots were examined for each strain. Values represent means ± SD. For statistical analysis, the F test was used to determine the variance, and the two-tailed t test with equal variance or unequal variance was used to determine the significance level of the difference among the transgenic plants.
-
*
p<0.05.
Additional files
-
Supplementary file 1
List of primers used in this study.
- https://doi.org/10.7554/eLife.02525.020
Download links
A two-part list of links to download the article, or parts of the article, in various formats.
Downloads (link to download the article as PDF)
Open citations (links to open the citations from this article in various online reference manager services)
Cite this article (links to download the citations from this article in formats compatible with various reference manager tools)
Brassinosteroids control root epidermal cell fate via direct regulation of a MYB-bHLH-WD40 complex by GSK3-like kinases
eLife 3:e02525.
https://doi.org/10.7554/eLife.02525


