Cerebellar modules operate at different frequencies
- Erasmus MC, Netherlands
- Netherlands Institute for Neuroscience, Netherlands
Figures
Figure 1 with 2 supplements
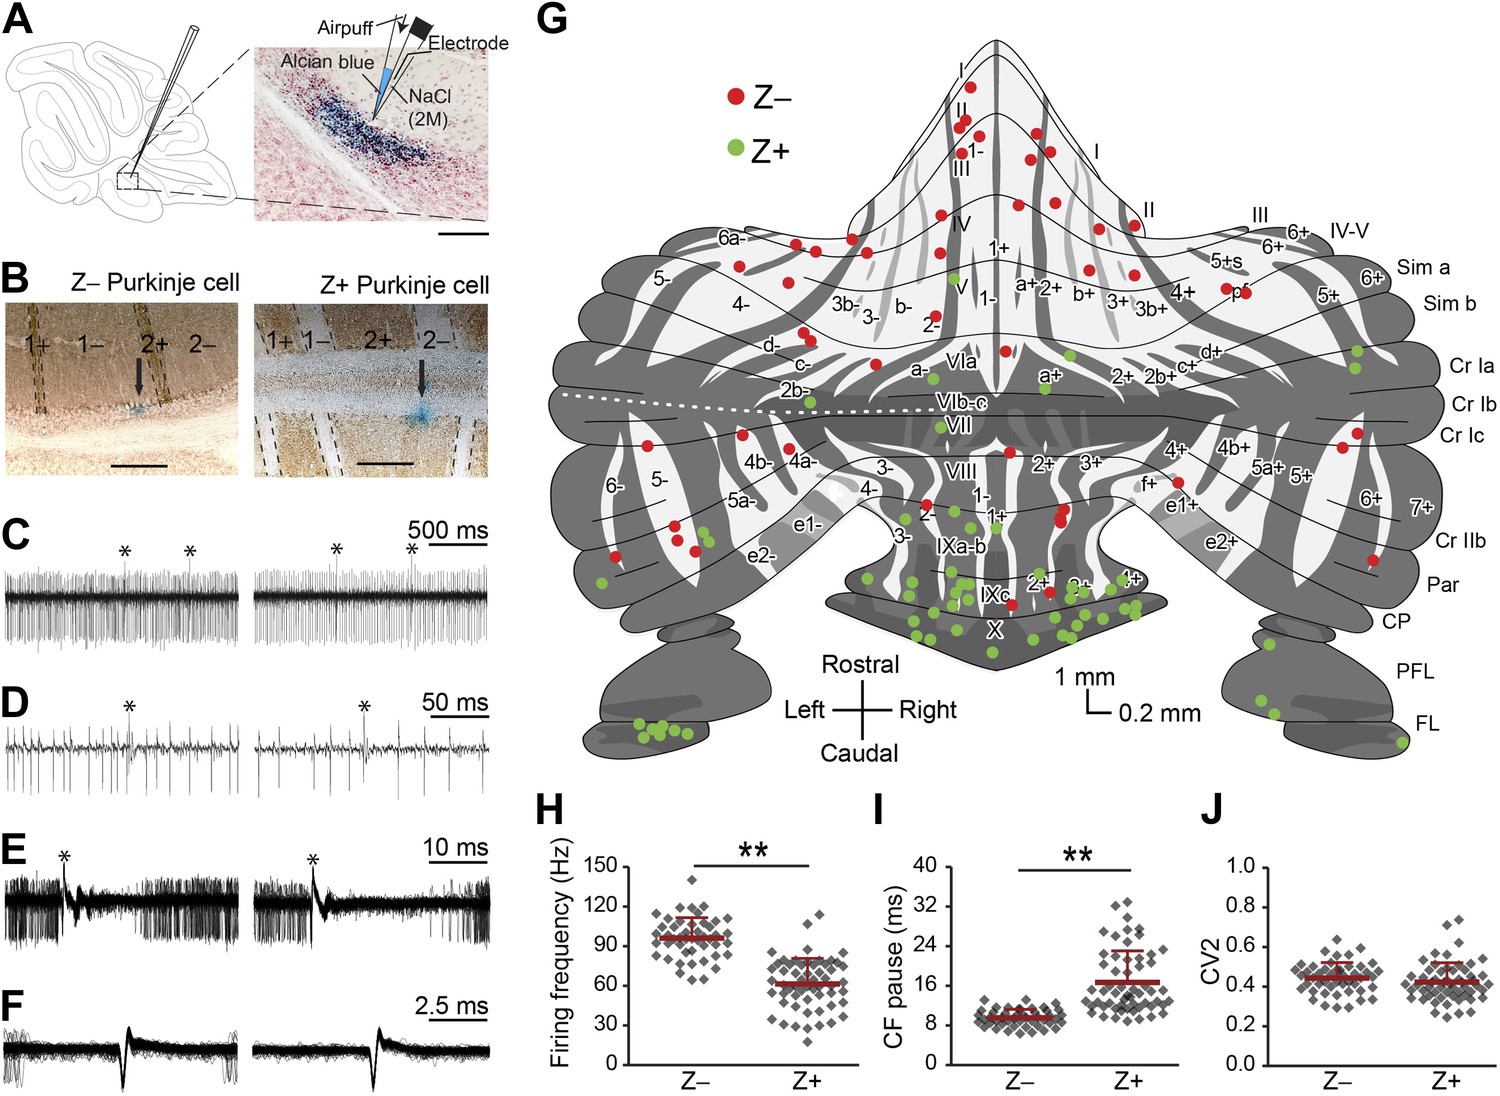
Simple spike firing activity differs between Purkinje cell populations.
(A) Extracellular recordings were made from PCs in the cerebellar cortex of awake mice, using double barrel glass electrodes (right). Dye injections were placed to histologically identify the recording location. (B) Photomicrographs of coronal sections with examples of zebrin-negative (Z−, left) and zebrin-positive (Z+, right) identified Purkinje cells in lobule II and lobule IX, respectively. Cells are marked by dye injections (blue, indicated by arrows), zebrin is stained brown, dotted lines demark zebrin borders. Note that Z+ stripes in lobules I–III are very narrow. (C and D) Example trace of Z− and Z+ Purkinje cell recordings identified by its hallmark feature, the occurrence of complex spikes (asterisk) and simple spikes. (E) Recordings were confirmed to be from a single neuron by the consistent pause in simple spike firing following each complex spike, in the overlay. (F) Overlay of simple spikes. (G) Distribution of recorded Z− and Z+ cells throughout the unfolded cerebellar cortex based on zebrin II compartments. (H) Simple spike firing frequency is significantly lower in identified Z+ PCs compared to Z− PCs (Z−: n = 47 cells, 26 mice; Z+: n = 57 cells, 34 mice; t = 9.942, p<0.001). (I) In line with the lower simple spike firing frequency, the climbing fiber pause was longer in identified Z+ Purkinje cells (CF pause; t = −7.482, p<0.001). (J) Simple spike regularity is not different between Z+ and Z− PCs (CV2: t = 1.147, p=0.234). Error bars represent SD, *p<0.05, **p<0.001. Schematic drawing in A was adapted from Sugihara and Quy (2007) with permission. Scale bars in A and B indicate 100 and 200 µm, respectively.
Figure 1—figure supplement 1
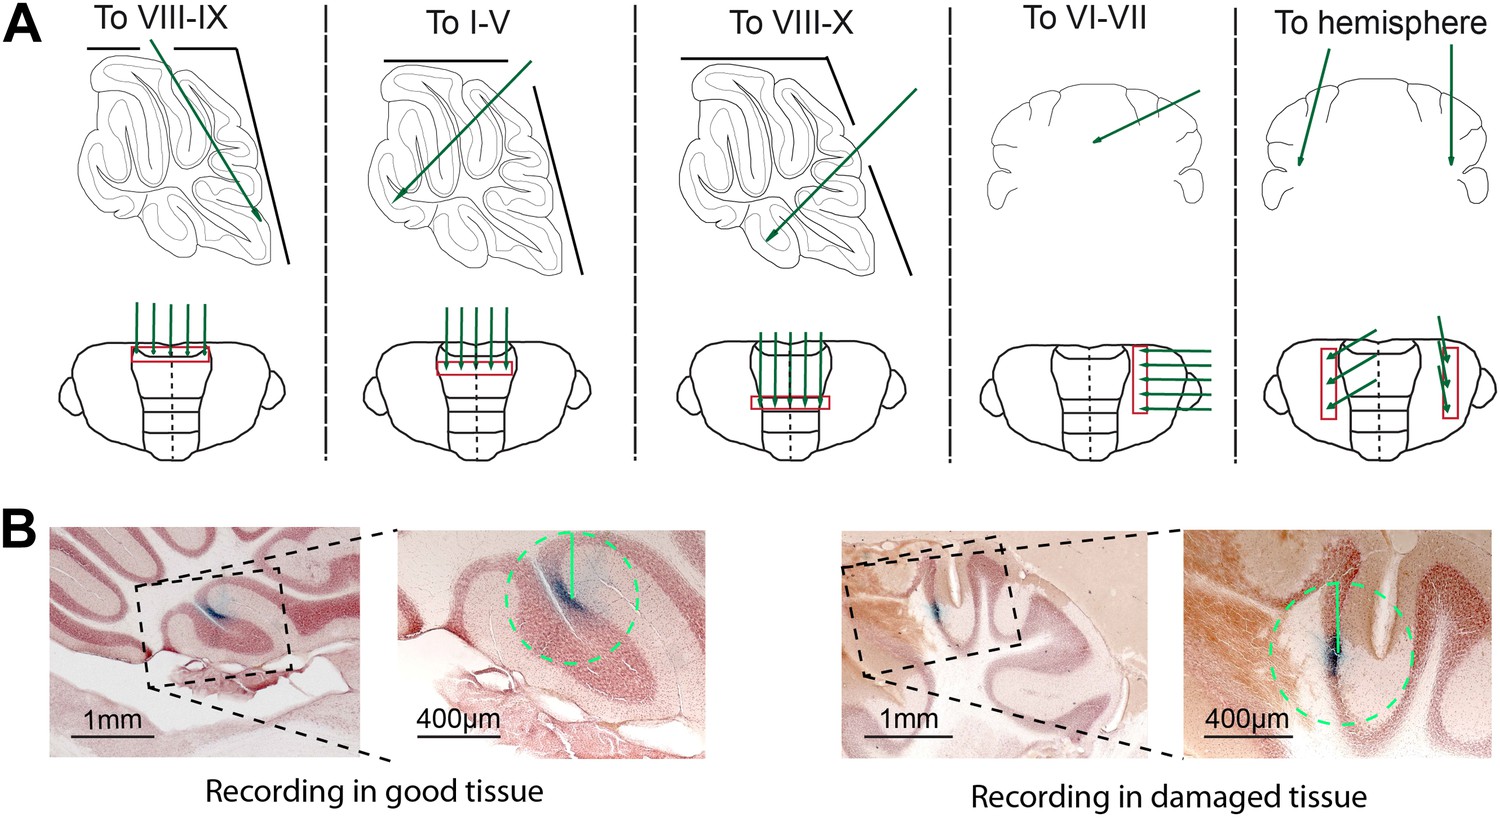
Experimental approach and histological verification.
(A) To obtain recordings from all cerebellar areas in vivo, we placed craniotomies in different locations. We avoided recording close to the craniotomy to decrease the chance of having to exclude the cells due to tissue damage (B). Five different approaches (top row) were used to cover all cerebellar areas, and recordings were done in a straight line running in either mediolateral or rostrocaudal direction, to assure reliable retrieval after histology. (B) To minimize the potential influence of tissue disruption on the recording results, we excluded all Purkinje cells that showed clear damage to the tissue, visible by light microscope, in a 400 µm radius circle around the dye identified recording location. Cells without detectable damage in surrounding tissue (left) were included, and those with clear damage (right) were excluded. Also, we did not observed obvious cell death in the Z-areas (Welsh et al., 2002).
Figure 1—figure supplement 2
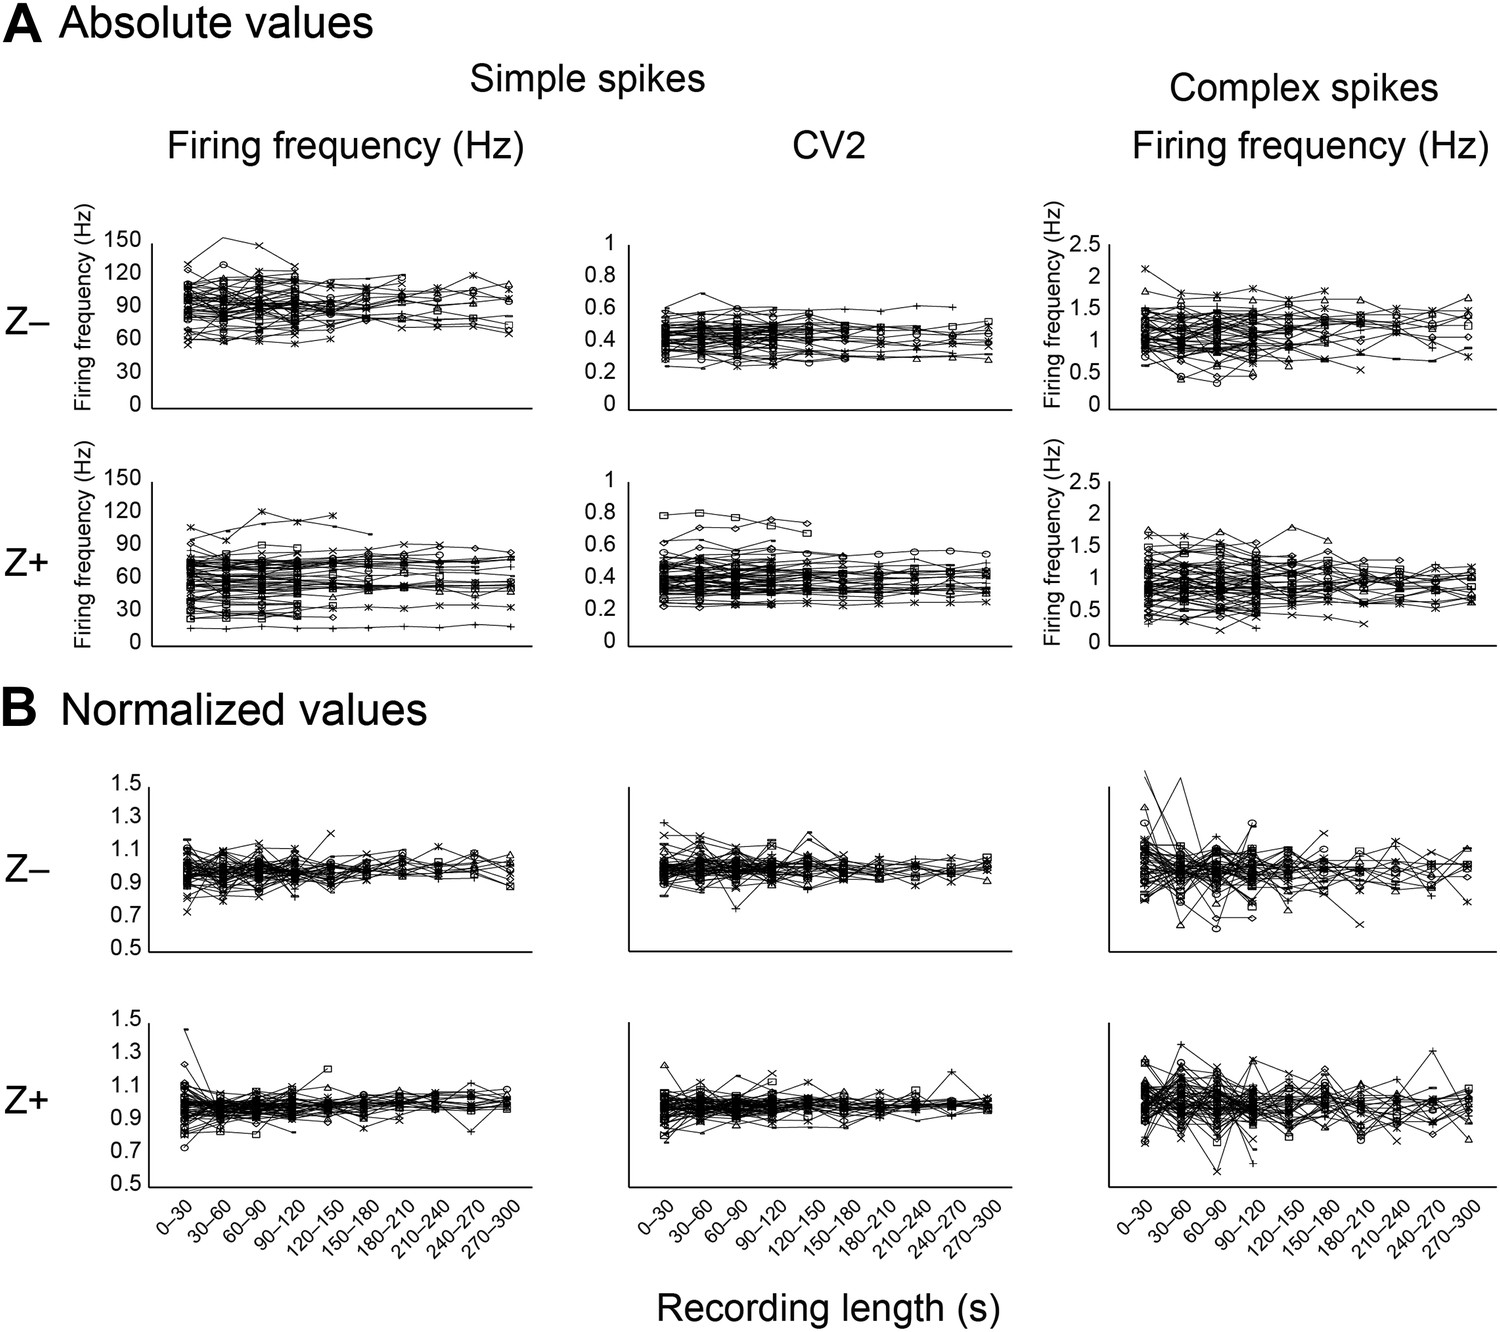
Stability of key parameters over the recording time.
As a measure of recording stability, the key parameters simple spike firing frequency and mean CV2, and complex spike firing frequency were analyzed in bins of 30 s. (A) Minimum duration was 120 s for all Purkinje cell recordings. For clarity, recordings were divided based on zebrin-identity. (B) Normalized values were obtained by dividing for each cell the absolute values binned per 30s in A by the average for the entire recording of that cell. Note that the deviation from average was typically <20% over 30 s bins.
Figure 2 with 1 supplement
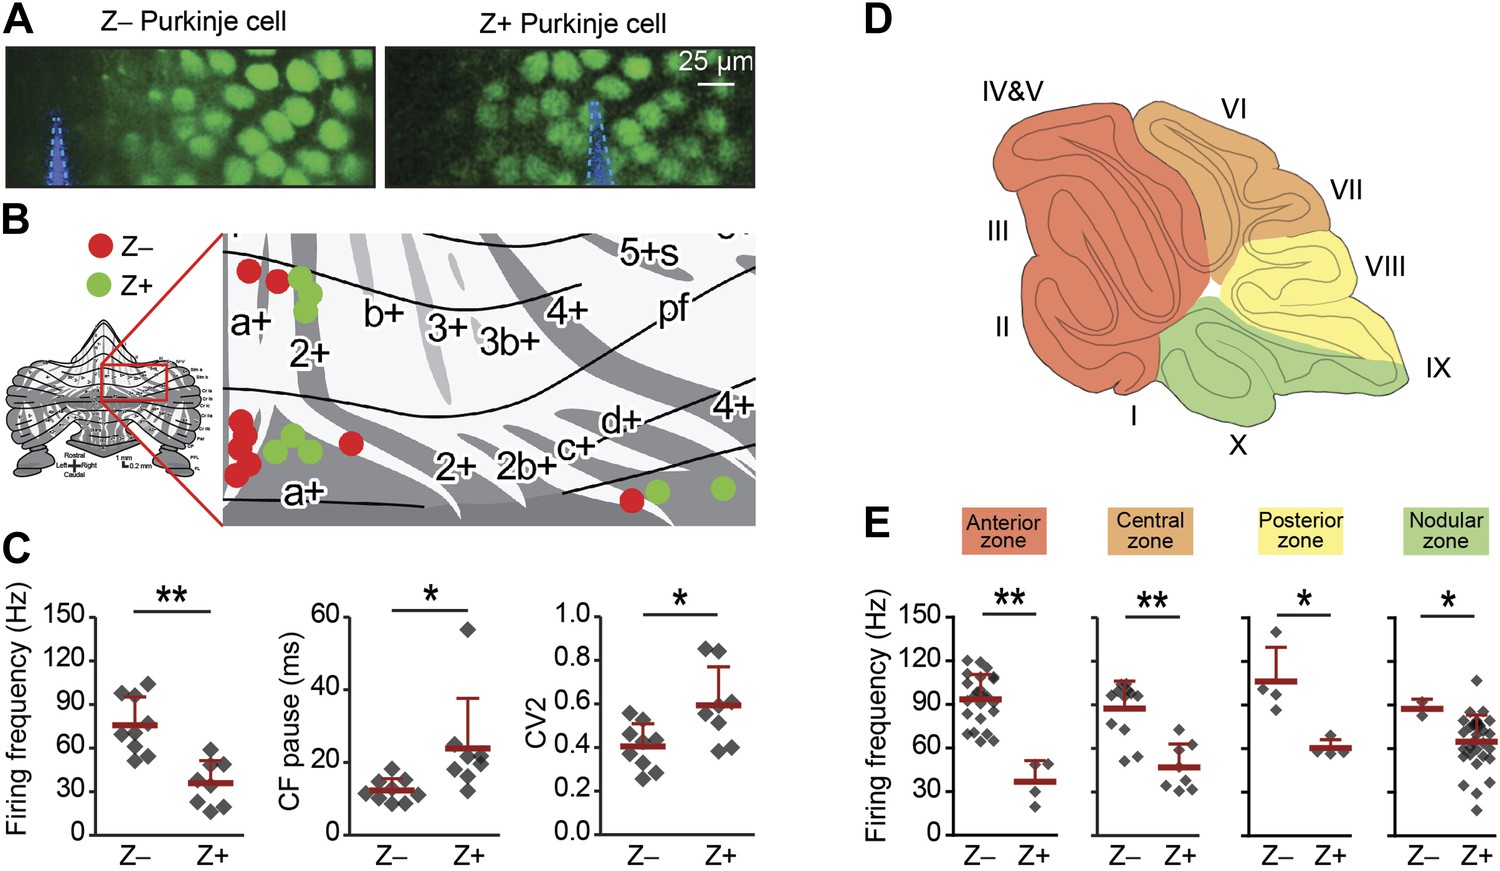
Simple spike firing frequency correlates with the zebrin identity of Purkinje cells.
To determine of the differences in simple spike activity are related to the location of the Purkinje cells, or to their zebrin identity, we compared PC activity of Z+ against Z– Purkinje cells in various smaller areas of the cerebellar cortex. (A) To more directly test the link with zebrin, we used EAAT4-eGFP mice that express eGFP in a pattern similar to that of zebrin. Two-photon images show an EAAT4+/Z+ band (green) in lobule V of an EAAT4-eGFP mouse: left, electrode (blue) positioned in the adjacent negative band; right, electrode (blue) in the positive band. (B) The activity of 17 zebrin-identity determined PCs (Z+, n = 8; Z–, n = 9, 5 mice) from lobule V, VI, and Crus I was recorded. (C) The difference in simple spike firing frequency was pertained in this subset of Purkinje cell recordings (Z+: 36.0 ± 15.5 Hz; Z−: 75.8 ± 19.5 Hz; t = 4.618, p<0.001), indicating that this difference is linked to zebrin identity, rather than lobular location. In contrast to data obtained with immunostaining for zebrin, the regularity of simple spikes also differs in this subpopulation (t = −2.715, p<0.016). (D) Cerebellar Purkinje cells can be subdivided based on the input they receive into four transverse zones: the anterior (red), central (orange), posterior (yellow), and nodular (green) zone. (E) The difference in simple spike firing frequency between Z+ and Z– Purkinje cells is consistently present throughout all transverse zones. In each of the four transverse zones, the simple spike rate was significantly lower in Z+ compared to Z– Purkinje cells (all p<0.05, One-tailed Student's t test). Note that simple spike frequency within different Z+ subgroups was also variable, in that the frequency in the anterior zone was lower than that in the nodular zone (p=0.018, One-way ANOVA, followed by Bonferroni's posthoc test). Error bars represent SD, *p<0.05, **p<0.001.
Figure 2—figure supplement 1
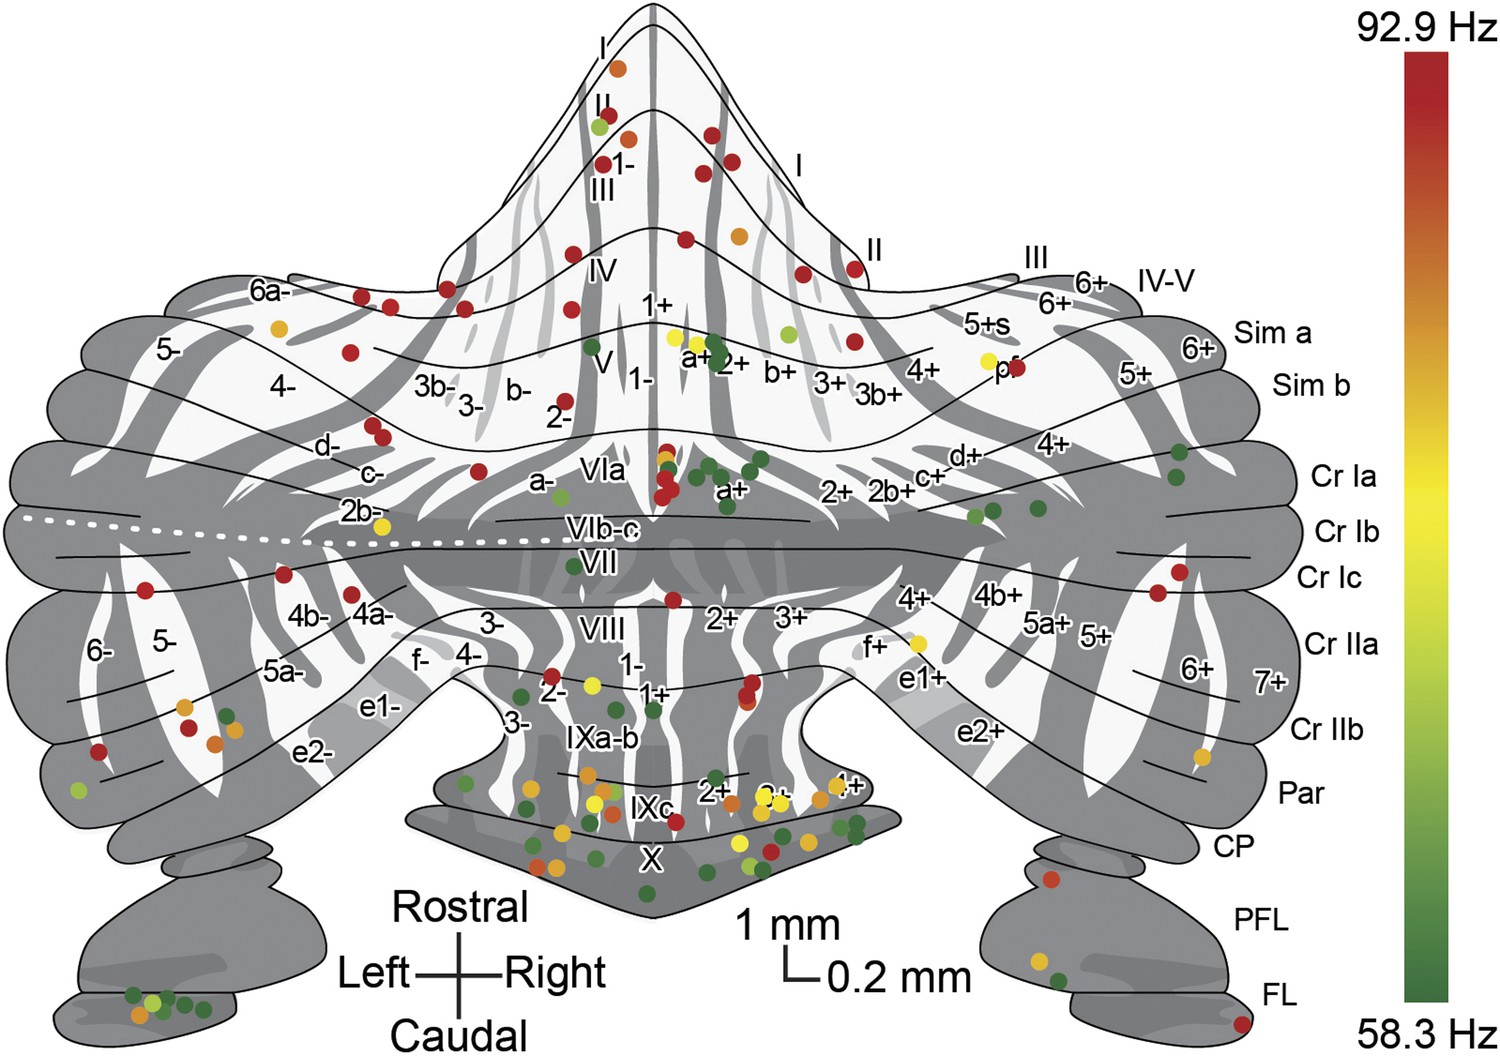
Overview with color-coded simple spike frequency for all identified Z+ and Z− Purkinje cells.
Overview plot of the unfolded cerebellar cortex depicting all Purkinje cells of which the activity was recorded and the zebrin identity was determined using either immunostaining or two-photon imaging, with dot color indicating the simple spike firing frequency. Dot color ranges from the combined average simple spike firing frequency for Z+ Purkinje cells, 58.3 Hz, in green to that of Z– Purkinje cells, 92.9 Hz, in red.
Figure 3 with 1 supplement
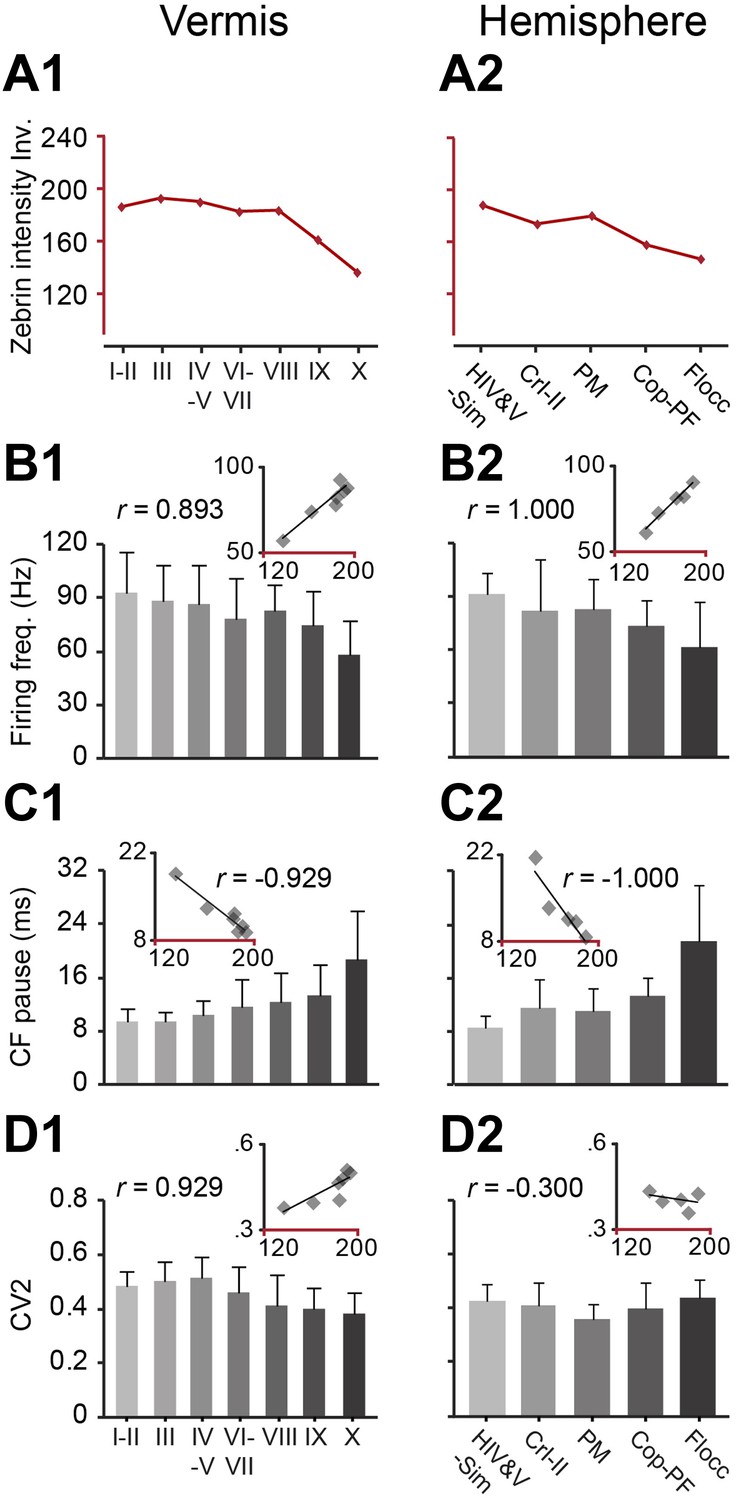
Zebrin staining intensity and simple spike frequency are inversely correlated.
To test the correlation to zebrin identity of modules throughout the cerebellar cortex, Purkinje cell activity was recorded from all parts of the cerebellar cortex, each followed by dye injection to identify the lobule. (A1–2) The average zebrin staining intensities of Purkinje cell somata in vermis and hemispheres were obtained from the sagittal sections of three mice. Note that high intensity values equal weak staining, and vice versa. (B1–2 and C1–2) The average simple spike firing frequency (vermis: n = 192 cells, 70 mice, r = 0.893, p=0.007; hemisphere: n = 53 cells, 30 mice, r = 1.000, p<0.001) and CF pause (vermis: r = −0.929, p=0.003; hemisphere: r = −1.000, p<0.001) show significant correlation with zebrin intensity over different parts of vermis and hemisphere. (D1–2) The CV2 of SSs could not be consistently related with zebrin intensity (vermis: r = 0.929, p=0.003; hemisphere: r = −0.300, p=0.624). Error bars represent SD. HIV&V-Sim, hemispheral part of lobule IV&V and simple lobule; CrI-II, Crus I and II; PM, paramedian lobule; Cop-PF, copula of the pyramis and paraflocculus; Flocc, flocculus.
Figure 3—figure supplement 1
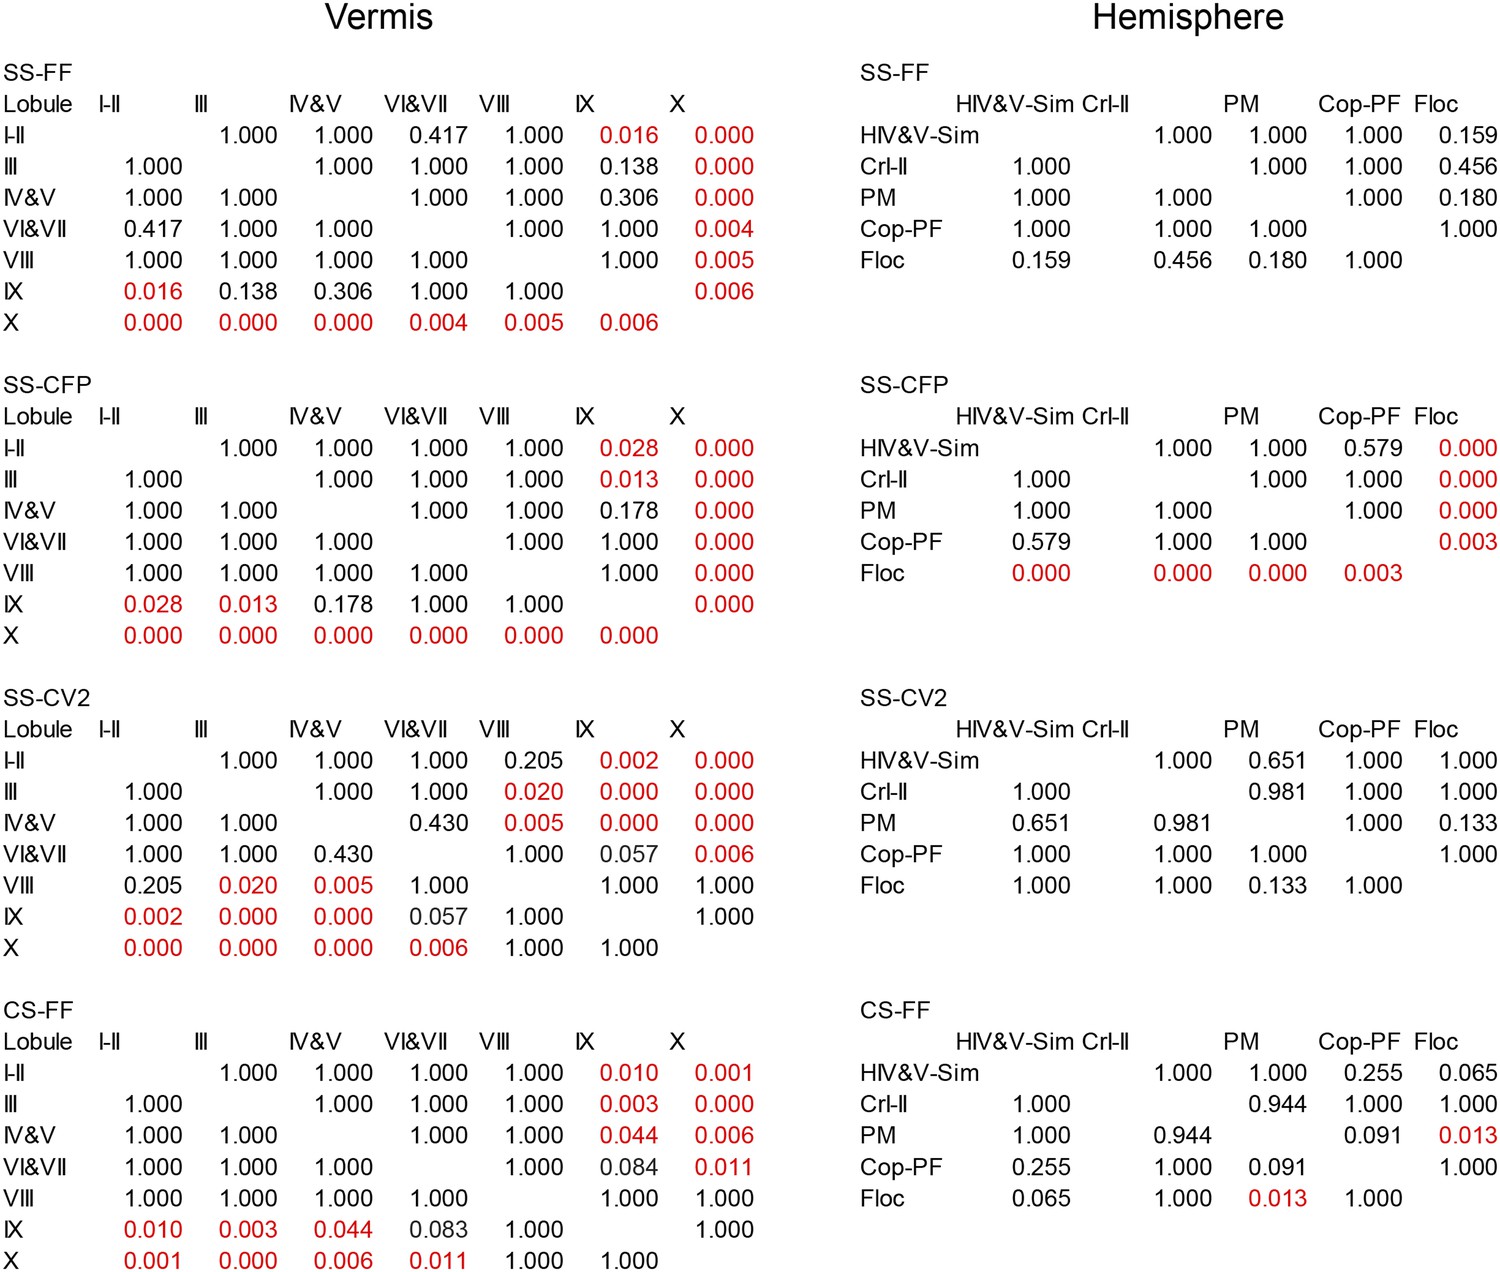
Statistical analysis of PC spiking characteristics per lobule.
Statistical comparisons of all recorded Purkinje cells, as presented in Figures 3 and 4C. These comparisons include all Purkinje cells from the vermis and hemispheres of which the location was determined based on dye injection (one-way ANOVA, followed by Bonferroni's posthoc test). FF, firing frequency; CFP, climbing fiber pause.
Figure 4
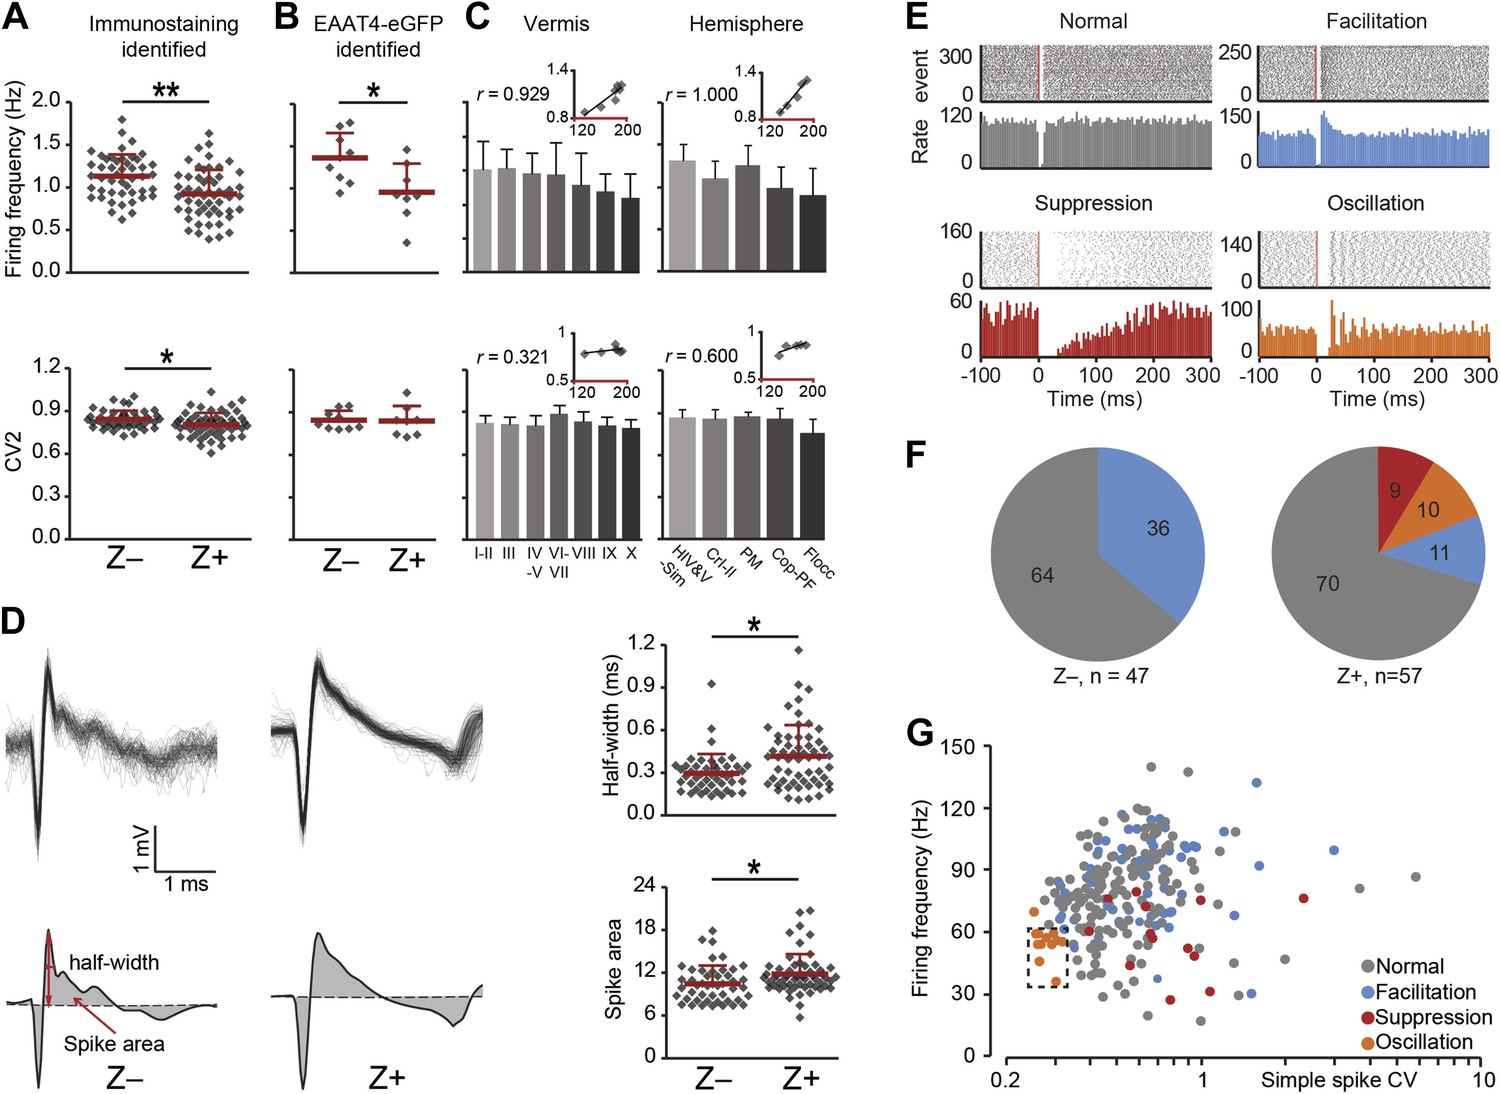
Complex spike characteristics depend on zebrin identitiy.
(A) Similar to simple spike frequency, complex spike frequency differs between immunostaining identified Z+ and Z− PCs (data from zebrin-identified PCs shown in Figure 1; t = 3.926, p<0.001), (B) This difference is confirmed in the sample of Z+ and Z− PCs obtained by two-photon imaging in EAAT4-eGFP mice, in that Z+ Purkinje cells have a lower complex spike firing frequency here too (t = 2.692, p=0.017). C, Moreover, complex spikes frequency shows significant correlation with zebrin intensity in vermis and hemisphere (vermis: r = 0.929, p=0.003; hemisphere: r = 1.000, p<0.001). Even though the regularity of CSs differs between immunostaining identified Z− and Z+ PCs (A, bottom), this was not reproduced in the other two experimental data sets (B–C, bottom). (D) Typical Z− and Z+ CS shapes (−0.5 to +3 ms) showing the characteristics analyzed: half-width and spike area (left). Z+ PCs have a longer half-width and bigger spike area than Z− cells (right). (E) Raster plots of simple spike activity around complex spikes (event, −100 ms till +300 ms) were converted in peri complex-spike time histograms. Based on these histograms, we could distinguish four different types of simple spike response types among the Purkinje cells recorded in all areas: normal, facilitation, suppression and oscillation. (F) The percentage of different types in Z− and Z+ PCs (values indicate percentage). The facilitation type occurs predominantly in Z− PCs, whereas the suppression and oscillation type are restricted to the Z+ PCs. (G) Attempts to find other parameters correlating in all recorded cells (n = 243 cells) with the response type were largely unsuccessful. The exception is the oscillation type, which has a signature combination of simple spike frequency and CV (11 out of 13, SS freq. range 35–60 Hz and CV <0.32). Two-photon imaging data are only included in panel B; panels D–F are based on immunostaining identified Z+ and Z− PCs only and panels C and G on all recorded PCs. Error bars represent SD, *p<0.05, **p<0.001.
Figure 5 with 1 supplement
Zebrin-related differences are present in the intrinsic activity of Purkinje cells.
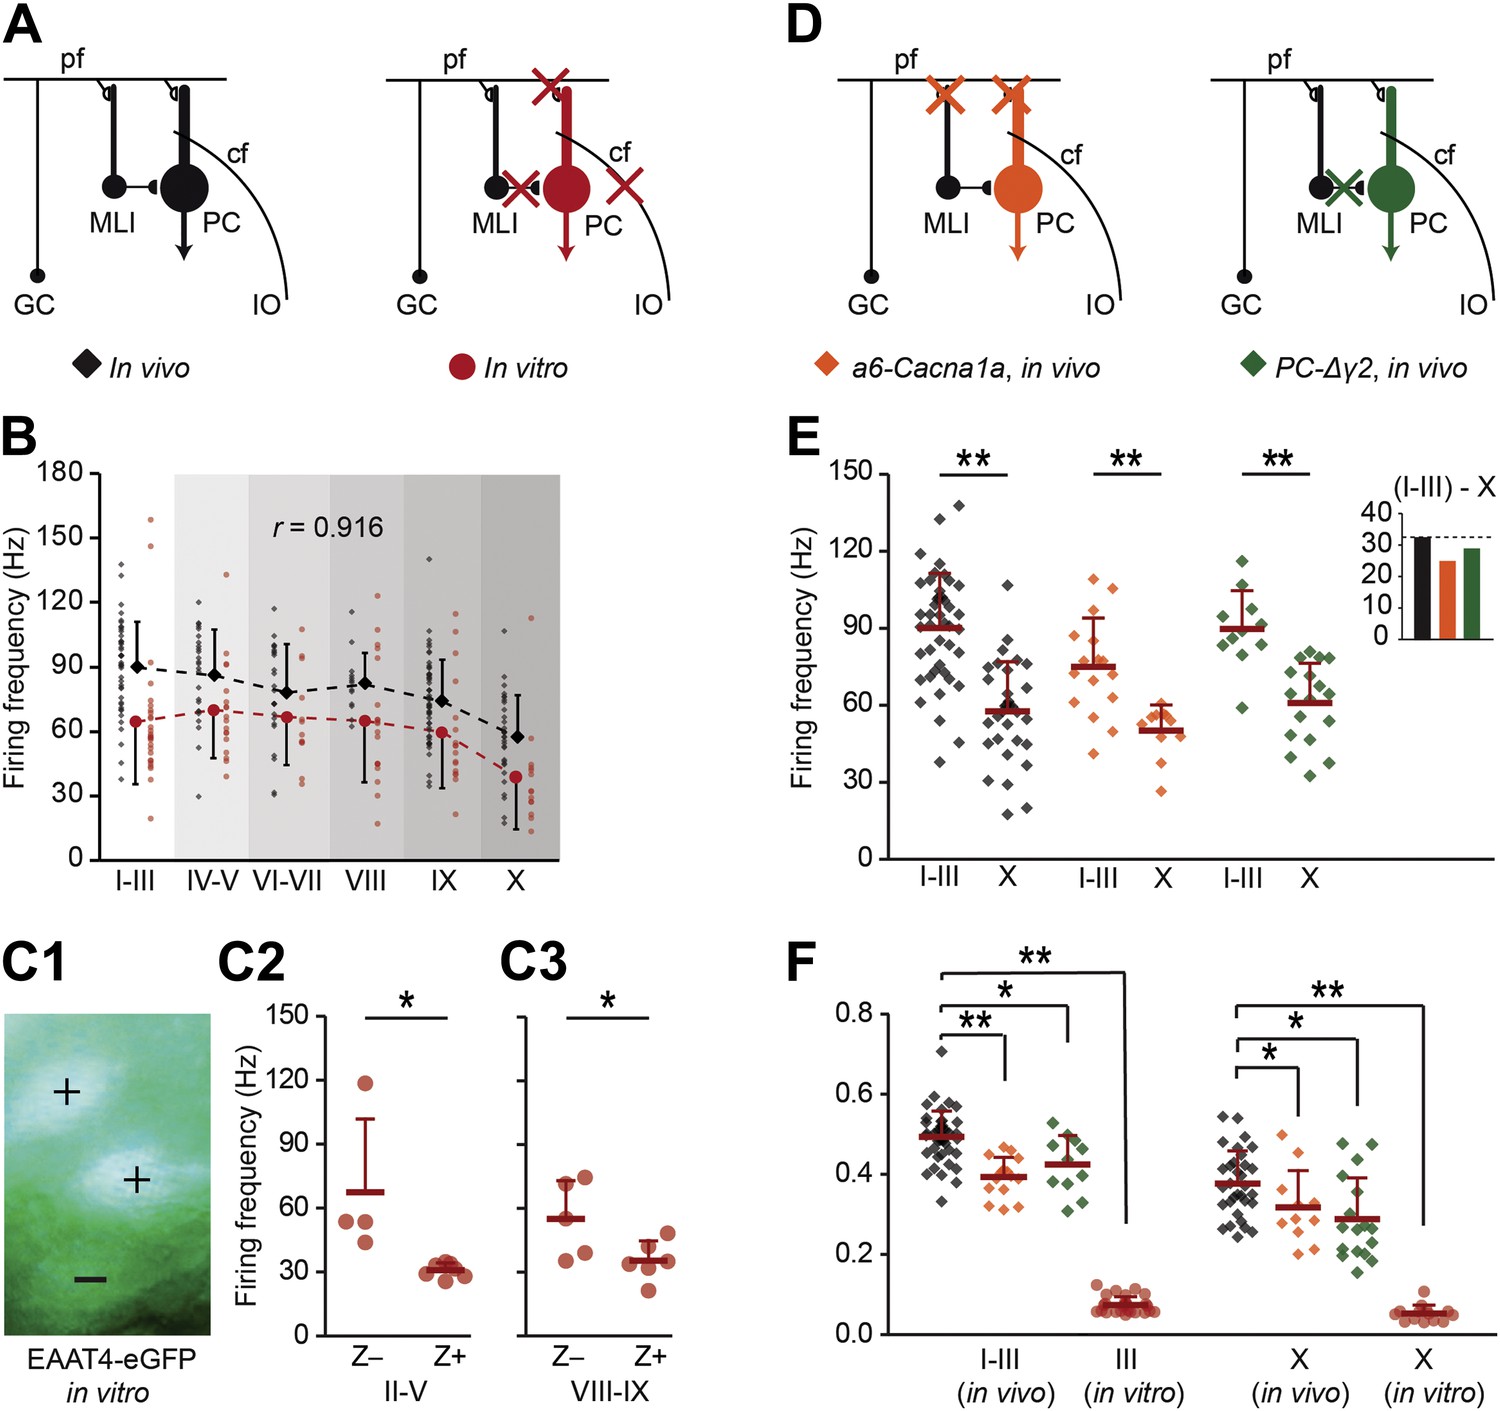
To test if intrinsic or input-related differences underlie the difference in simple spike frequency, we recorded PC activity in conditions of limited or no synaptic input. (A) PC activity was recorded in vitro (n = 107 cells, 15 mice) under complete block of synaptic inputs. (B) Spiking frequency in vitro (red) was lower than that in vivo (black) over the range of lobules, but the shape of the curve was similar (r = 0.916, p=0.010, Pearson's correlation). (C1–3) To verify the correlation with zebrin, we recorded activity of EAAT4/zebrin-positive and negative PCs in slices of EAAT4-eGFP mice. Both in lobules II–V (Z+: n = 7 cells, Z−: n = 4; 3 mice; t = 2.910, p=0.017) and lobules VIII-IX (Z+: n = 6, Z−: n = 5; 2 mice; t = 2.352, p=0.043) the difference in simple spike firing frequency was present, further confirming the link with zebrin. (D) Next, extracellular recordings were made in vivo in a6-Cacna1a and PC-Δγ2 mutant mice that have minimized excitatory and no synaptic inhibitory inputs to their PCs, respectively. (E) PC activity in Z+ lobule X of both mutants was lower than that in the predominantly Z− lobules I–III (wild types, lobules I–III: n = 43 cells, 18 mice, lobule X: n = 32 cells, 25 mice, t = 6.808, p<0.001; a6-Cacna1a, I–III: n = 16 cells, 2 mice; X: n = 11 cells, 2 mice; t = 3.979, p<0.001; PC-Δγ2, I-III: n = 11 cells, 3 mice; X: n = 17 cells, 3 mice; t = 4.876, p<0.001). Inset compares the absolute differences in firing frequency between lobules I–III and X. (F) CV2 values of Z− and Z+ SS activity from in vitro recordings (lobules I–III and X: both p<0.001) and in vivo recordings of both a6-Cacna1a mutants (lobule I–III: t = 5.613, p<0.001; lobule X: t = 2.062, p=0.046) and PC-Δγ2 mutants (lobules I–III and X: both p<0.005) were significantly lower than the wild type recordings. Abbreviations: cf, climbing fiber; GC, granule cell; IO, inferior olive; MLI, molecular layer interneuron; PC, Purkinje cell; pf, parallel fiber. Error bars represent SD, *p<0.05, **p<0.001.
Figure 5—figure supplement 1
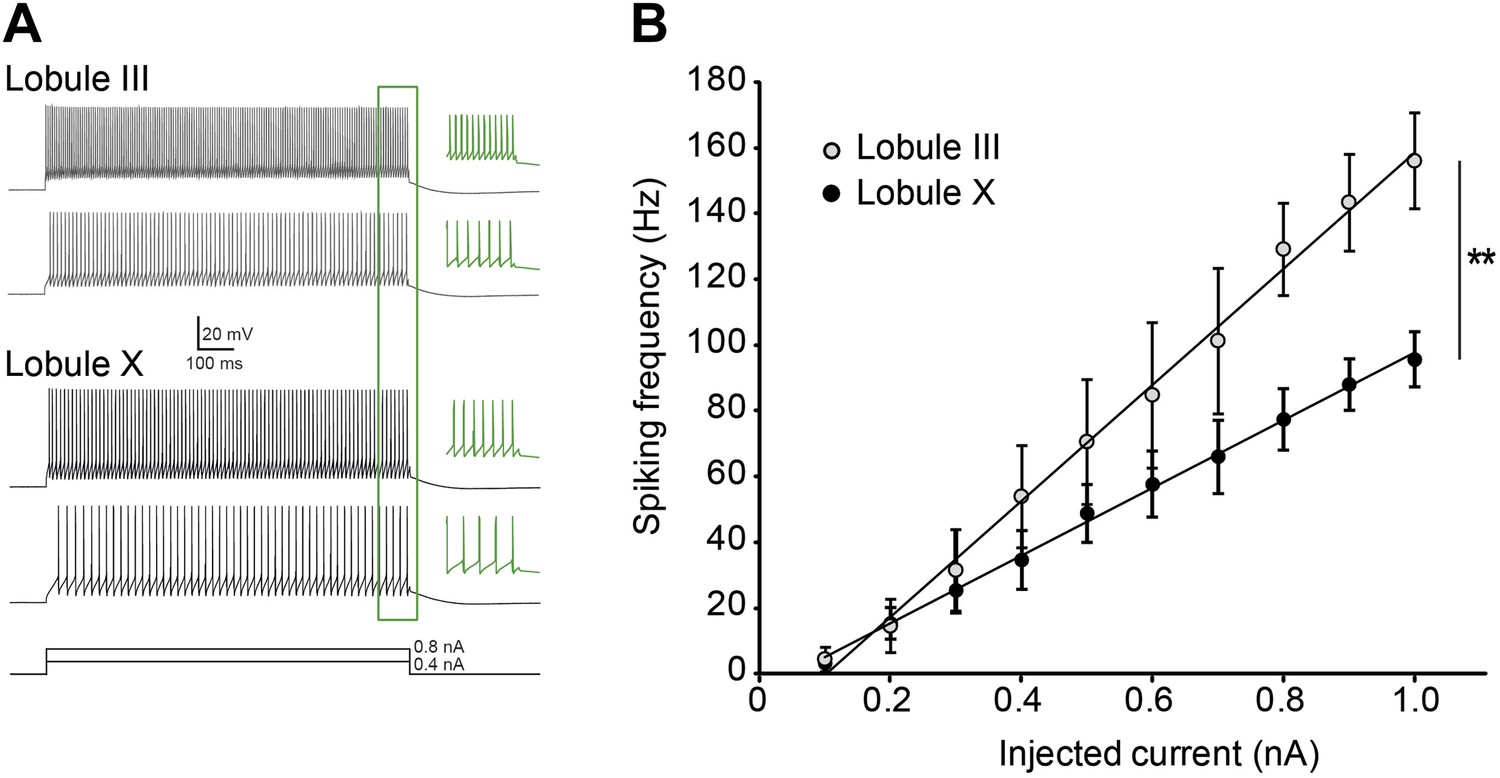
Purkinje cell intrinsic excitability is higher in lobule III than in X.
To test intrinsic excitability Purkinje cells were current clamped at −65 mV, 1 s current steps were injected increasing from 0.1 to 1.0 nA and the response frequencies were determined. (A) Example traces with insets (green) showing a magnification of the last 100 ms. (B) Response frequency was determined for the entire range, and the slope was calculated. The slope of the input–output curves was significantly higher in Purkinje cells from lobule III compared to lobule X (III: mean ± SEM 226.0 ± 14.5 spk/nA, n = 7; X: 124.1 ± 20.6 spk/nA, n = 9; t = 4.311, p<0.001). Error bars denote SEM, **p<0.001.
Figure 6 with 3 supplements
Blocking TRPC3 attenuates the simple spike frequency difference.
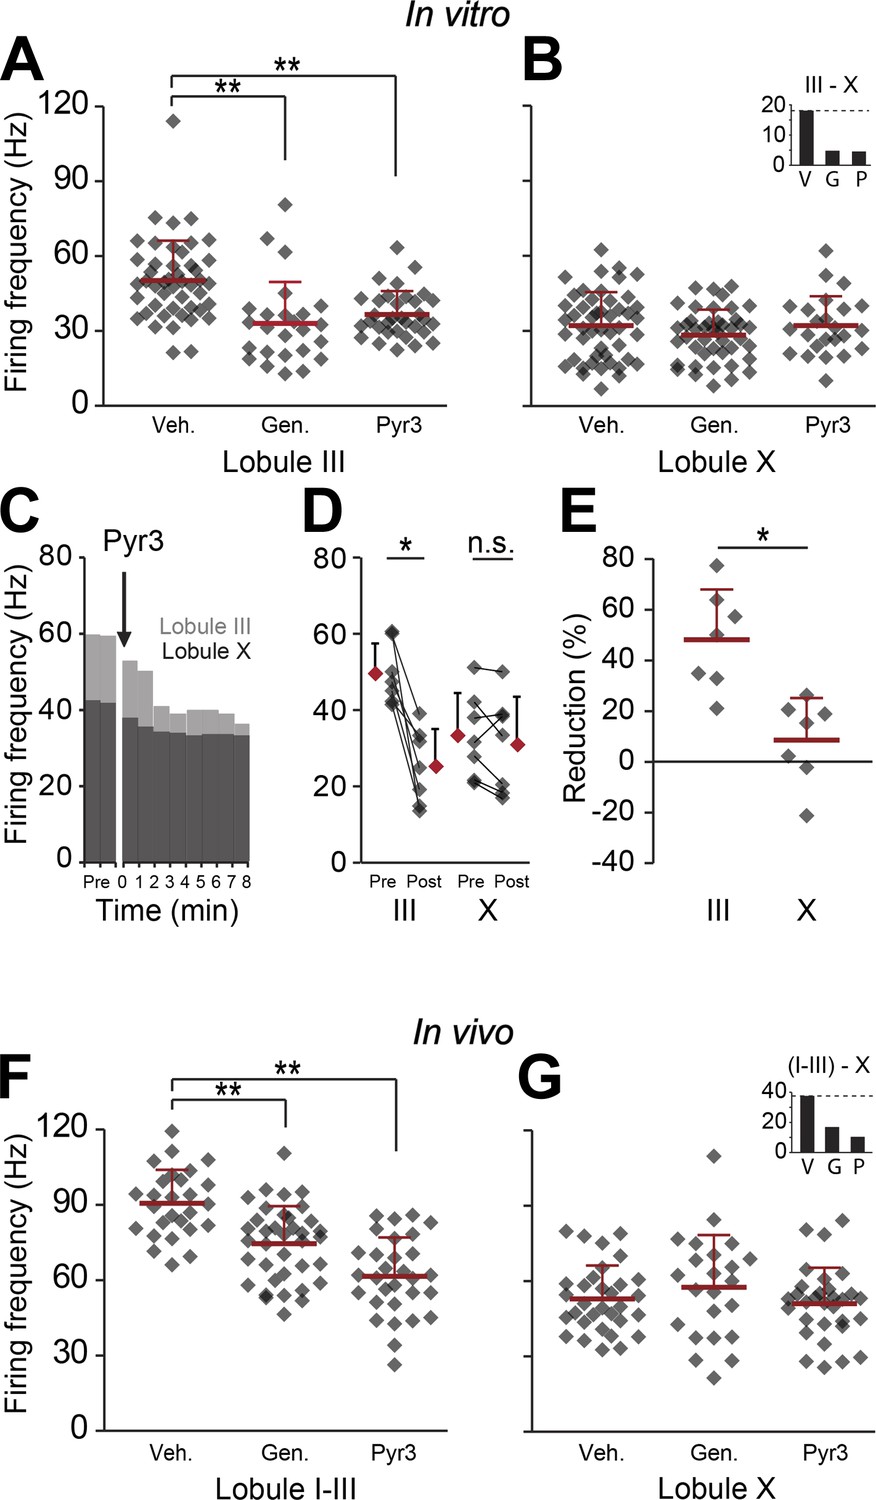
In search for the underlying mechanism, we tested the contribution of TRPC3, which can be indirectly linked to zebrin-like expression. (A and B) The presence of TRPC3 blocker genistein (10 µM) or the more selective Pyr3 (100 µM) reduced Purkinje cell firing frequency in lobule III (vehicle: n = 47 cells, 6 mice; genistein: n = 25 cells, 7 mice; Pyr3: n = 33 cells, 7 mice; both p<0.001 vs vehicle, One-Way ANOVA followed by Tukey's post-hoc test), but not in lobule X (vehicle: n = 48 cells, 6 mice; genistein: n = 44 cells, 7 mice; Pyr3, n = 24 cells, 7 mice; p=0.271 and p=1.000 vs vehicle, respectively, One-Way ANOVA followed by Tukey's post-hoc test), virtually eliminating the difference between averages for lobule III–X (inset). To more directly quantify the effect of blocking TRPC3, we washed-in Pyr3 during the recording of Purkinje cells in lobule III and X. (C–E) Pyr3 wash-in significantly decreased the simple spike firing frequency in lobule III (n = 7 cells, 7 mice; t = 5.412, p=0.002, paired Student's t test), and this decrease was larger in lobule III than in lobule X (t = 4.069; p=0.002). (F–G) In line with the in vitro data, in vivo blocking of TRPC3 by application of genistein (240 mg/kg, i.p.) or Pyr3 (200 µg, i.c.v.) decreased simple spike firing in lobule I–III (vehicle: n = 27 cells, 3 mice; genistein: n = 37 cells, 3 mice and Pyr3: n = 30 cells, 2 mice; both p<0.001 vs vehicle, one-way ANOVA followed by Tukey's post-hoc test), but had no effect in lobule X (vehicle: n = 32 cells, 3 mice; genistein: n = 23 cells, 4 mice and Pyr3: n = 31 cells, 4 mice; p=0.546 and p=0.887 vs vehicle, respectively one-way ANOVA followed by Tukey's post-hoc test), resulting in a pronounced reduction of the difference (inset). Error bars represent s.d., *p<0.05, **p<0.001.
Figure 6—figure supplement 1
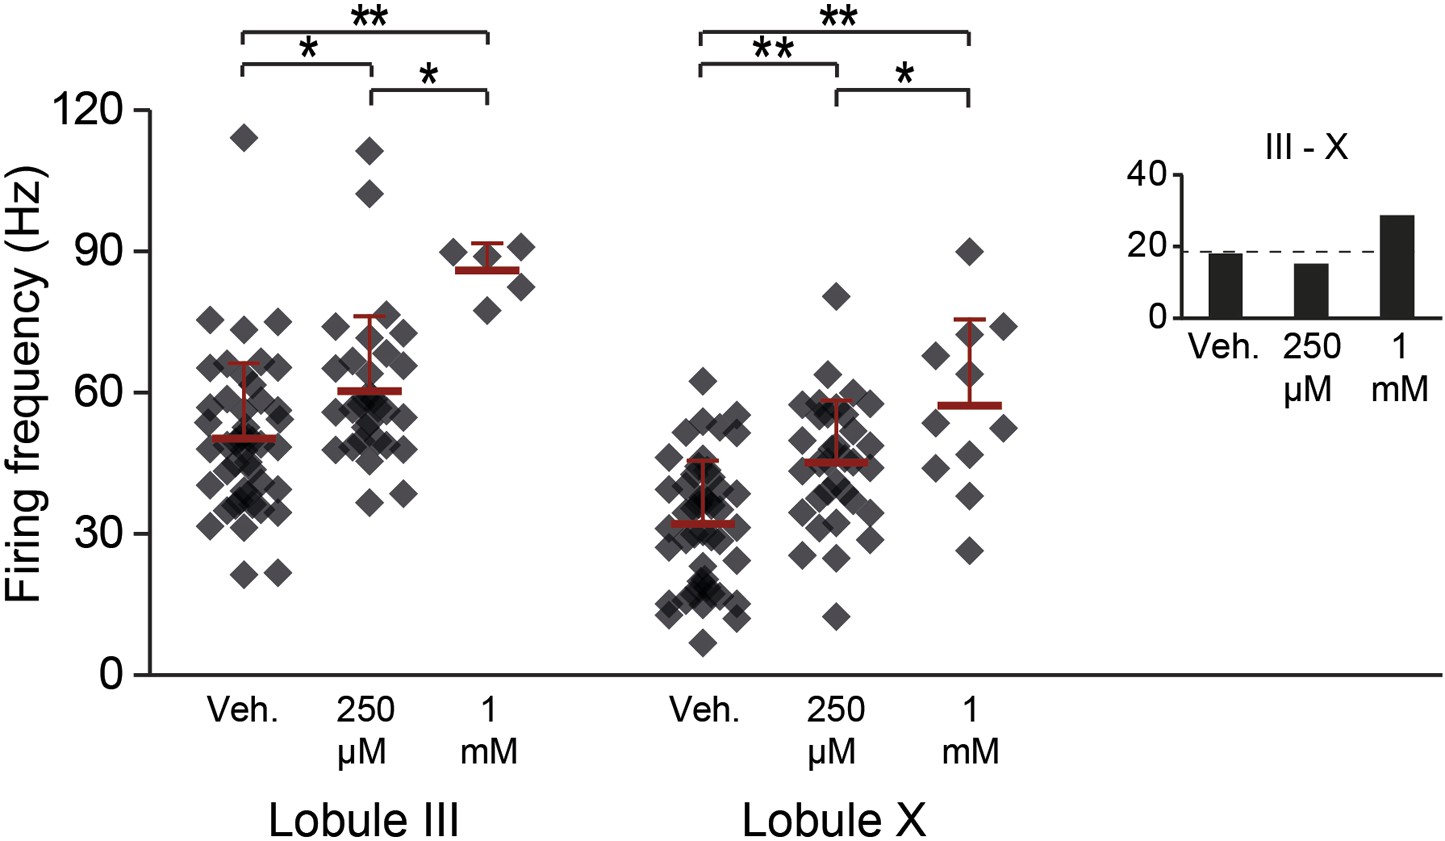
Aldolase C enzymatic reaction products GAP and DHAP increase the activity in lobules III and X.
To test the possibility that zebrin, or aldolase C, is responsible for the difference in simple spike activity due to its enzymatic activity, we bath-applied its reaction products. If this difference in enzymatic activity is responsible for the difference in simple spike activity between Z+ and Z– Purkinje cells, addition of the reaction products of zebrin should decrease the activity of Zebrin-negative Purkinje cells in lobule III. Simultaneous application of 250 µM of glyceraldehyde-3-phosphate (GAP) and dihydroxyacetone phosphate (DHAP) caused a subtle but significant increase in simple spike activity in both lobule X and lobule III (X: p<0.001; III: p=0.019 vs vehicle, One-Way ANOVA followed by Bonferroni's post-hoc tests). This increase was even more pronounced when we increased the concentration to 1 mM of each (X: p<0.001; III: p<0.001 vs vehicle, one-way ANOVA followed by Bonferroni's post-hoc tests). The increase of activity, particularly in lobule III, and the persistence of the difference between lobule III and X argue against a role for aldolase C in generating the difference in simple spike activity between Z+ and Z– Purkinje cells. Minimum recording duration was 60 s. Error bars represent SD, *p<0.05, **p<0.001.
Figure 6—figure supplement 2
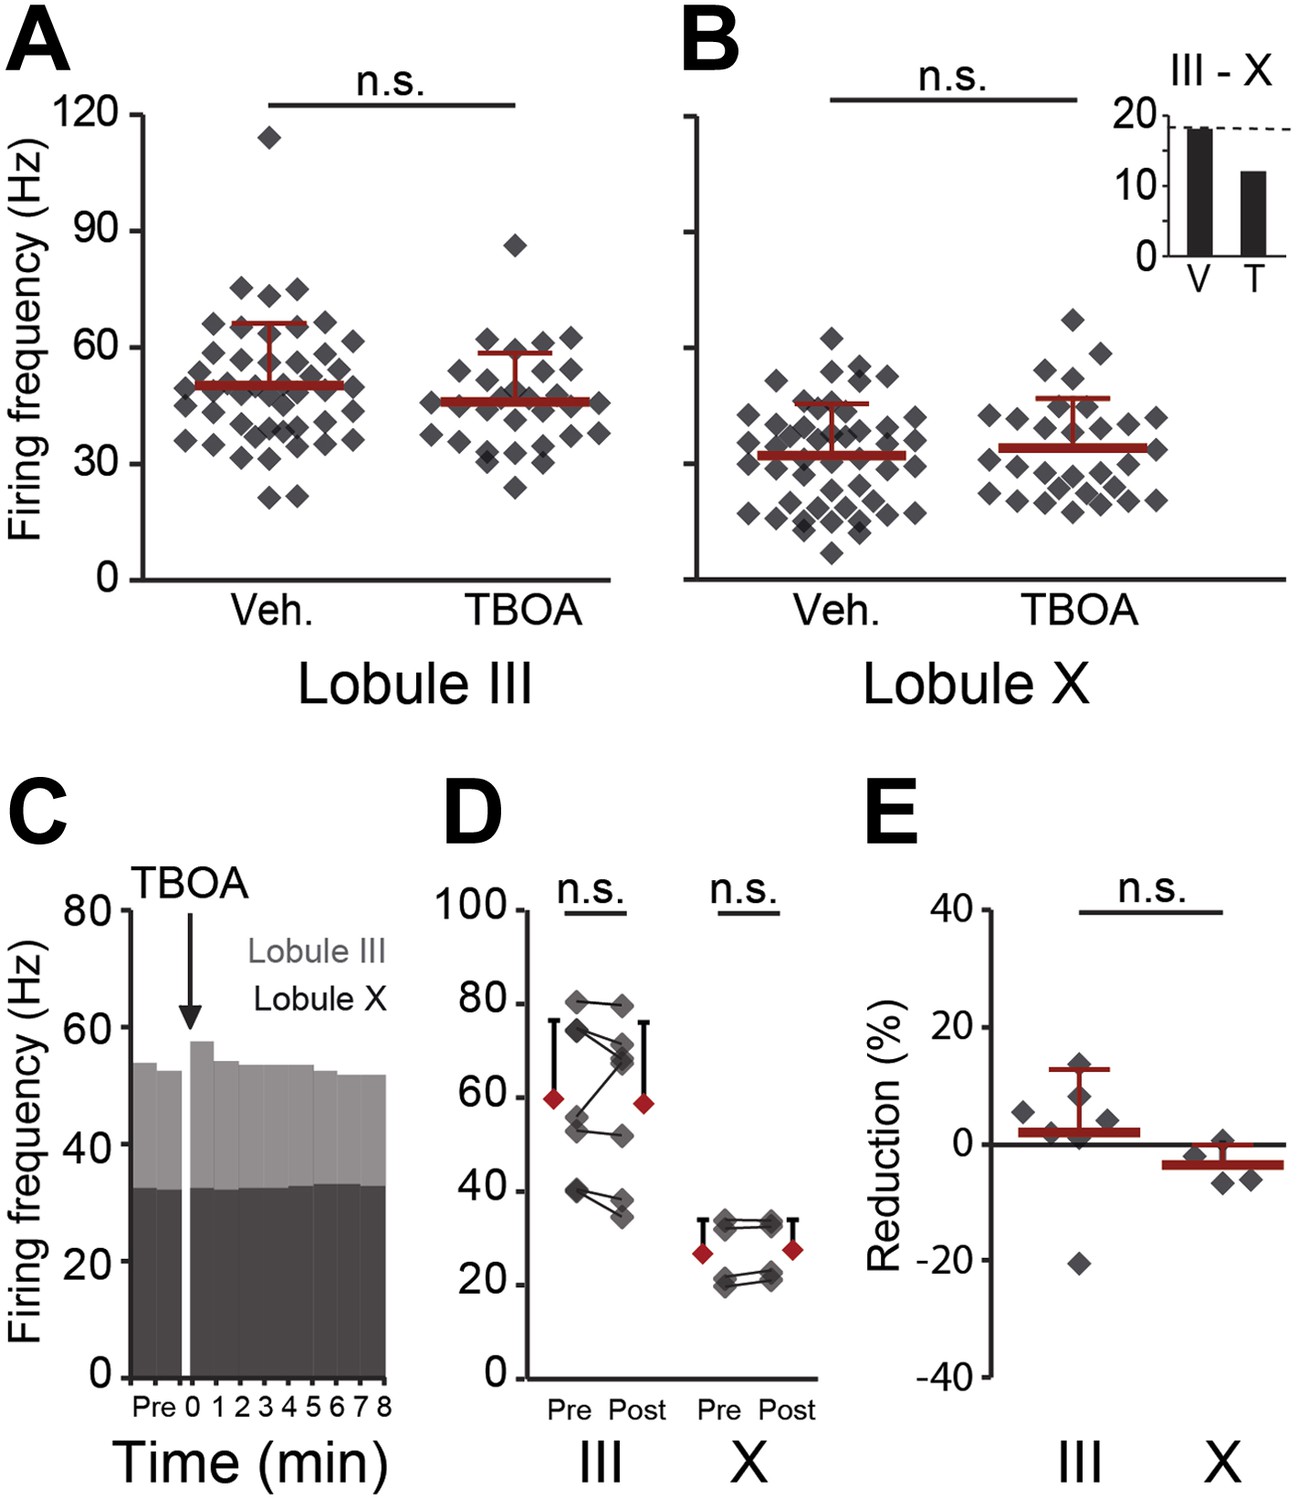
Effects of blocking EAAT4 on Purkinje cell activity in lobule III and X in vitro.
In search for the underlying mechanism, we tested the contribution of EAAT4, which is expressed in a pattern similar to that of zebrin, to Purkinje cell activity in vitro. (A and B) EAAT4 blocker TBOA (25 µM) did not affect the firing frequency of Purkinje cells in lobule III (vehicle: n = 47 cells, 6 mice; DL-TBOA: n = 30 cells, 5 mice; t = 1.219, p=0.227), or those in lobule X (vehicle: n = 48 cells, 6 mice; DL-TBOA: n = 30 cells, 5 mice; t = −0.597, p=0.553), largely maintaining the difference between averages for lobule III–X (inset). (C–E) Wash-in of DL-TBOA had no significant effect (III: n = 7 cells, 6 mice; t = 0.457, p=0.664, X: n = 4 cells, 4 mice; t = −2.202, p=0.115, paired Student’s t-test). Error bars represent SD.
Figure 6—figure supplement 3
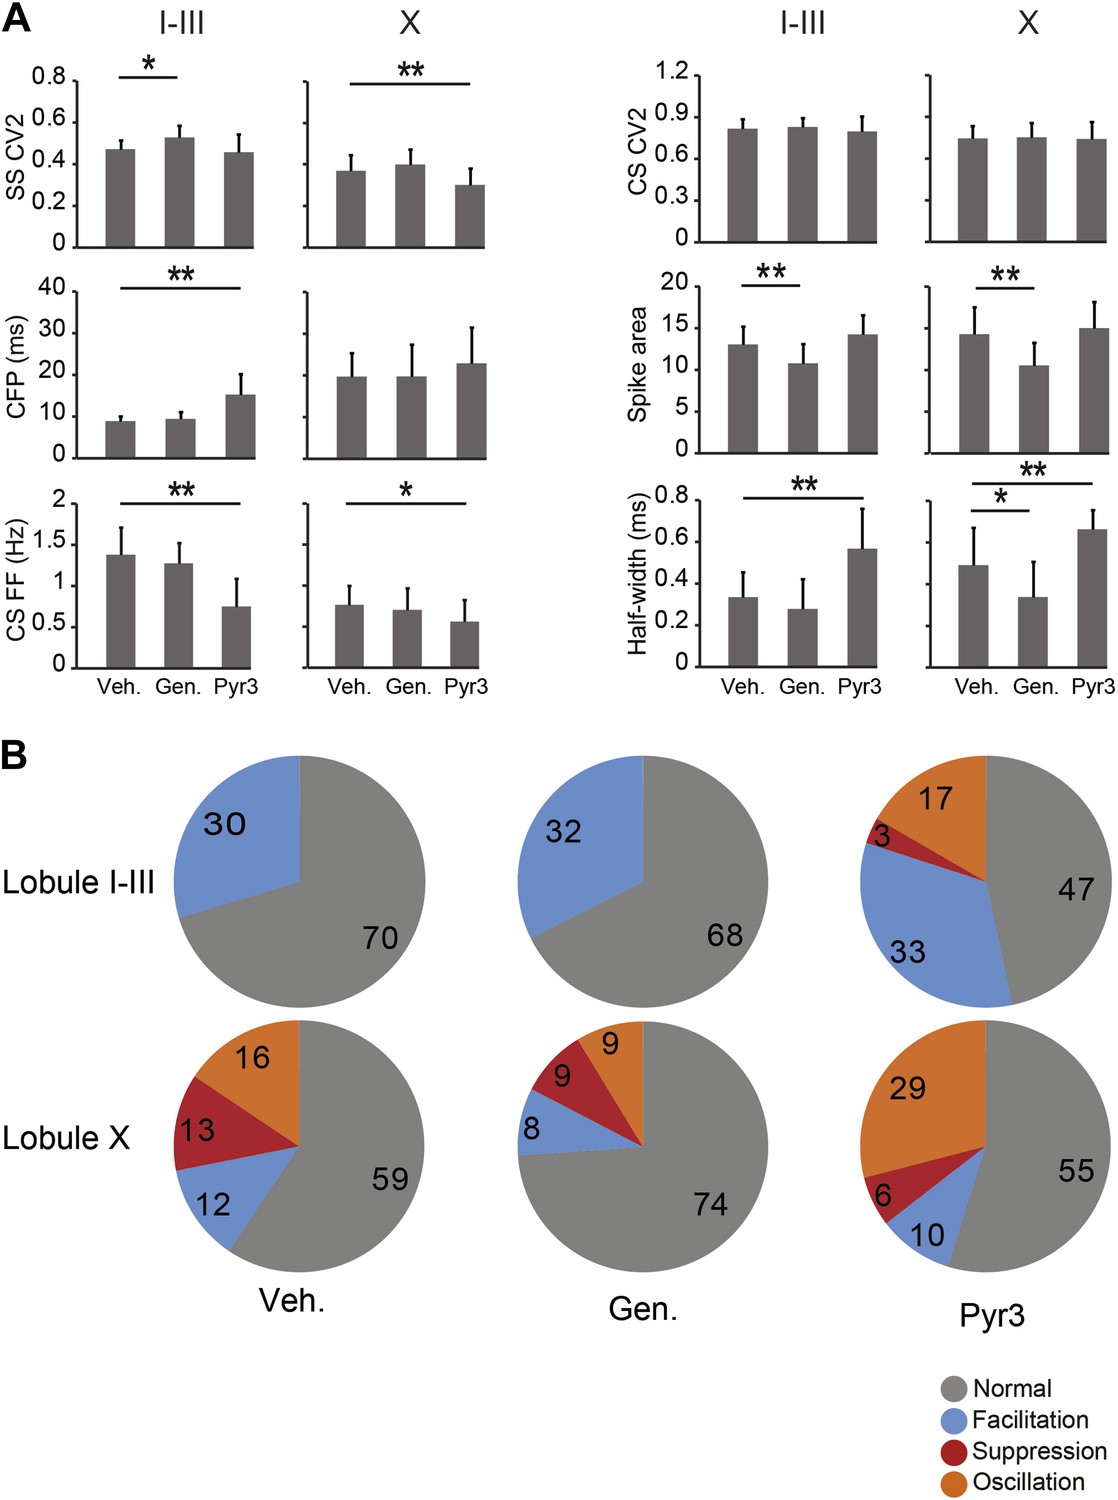
Effects of TRPC3 blockers on other PC activity parameters.
Application of TRPC3 blockers genistein and Pyr3 affected, apart from simple spike firing frequency, several other characteristics of Purkinje cell activity. (A) Whereas effects of TRPC3 blockers on simple and complex spike regularity were subtle or absent, Pyr3 increased the climbing fiber pause and decreased the complex spikes firing frequency in lobules I–III towards levels comparable to those found in lobule X, suggesting that the differences in these parameters between the predominantly zebrin-negative lobules I–III and zebrin-positive lobule X are also, at least in part, dependent on the activity of TRPC3. The effects of Pyr3 on complex spike half width appears to be comparable, in that it increases half-width towards levels observed in lobule X, while genistein predominantly has an attenuating effect on half-width and spike area, possibly due to its less selective nature. (B) Interestingly, blocking TRPC3 with Pyr3 induces the occurrence of the suppression and oscillation response types in the post complex spike simple spikes activity. These types are under normal and vehicle conditions restricted to PCs in lobule X, suggesting a role for TRPC3 in the post complex spike activity. Error bars represent SD *p<0.05, **p<0.001.
Download links
A two-part list of links to download the article, or parts of the article, in various formats.
Downloads (link to download the article as PDF)
Open citations (links to open the citations from this article in various online reference manager services)
Cite this article (links to download the citations from this article in formats compatible with various reference manager tools)
Cerebellar modules operate at different frequencies
eLife 3:e02536.
https://doi.org/10.7554/eLife.02536


