Bacterial actin MreB forms antiparallel double filaments
- Medical Research Council - Laboratory of Molecular Biology, United Kingdom
Figures
Figure 1 with 2 supplements
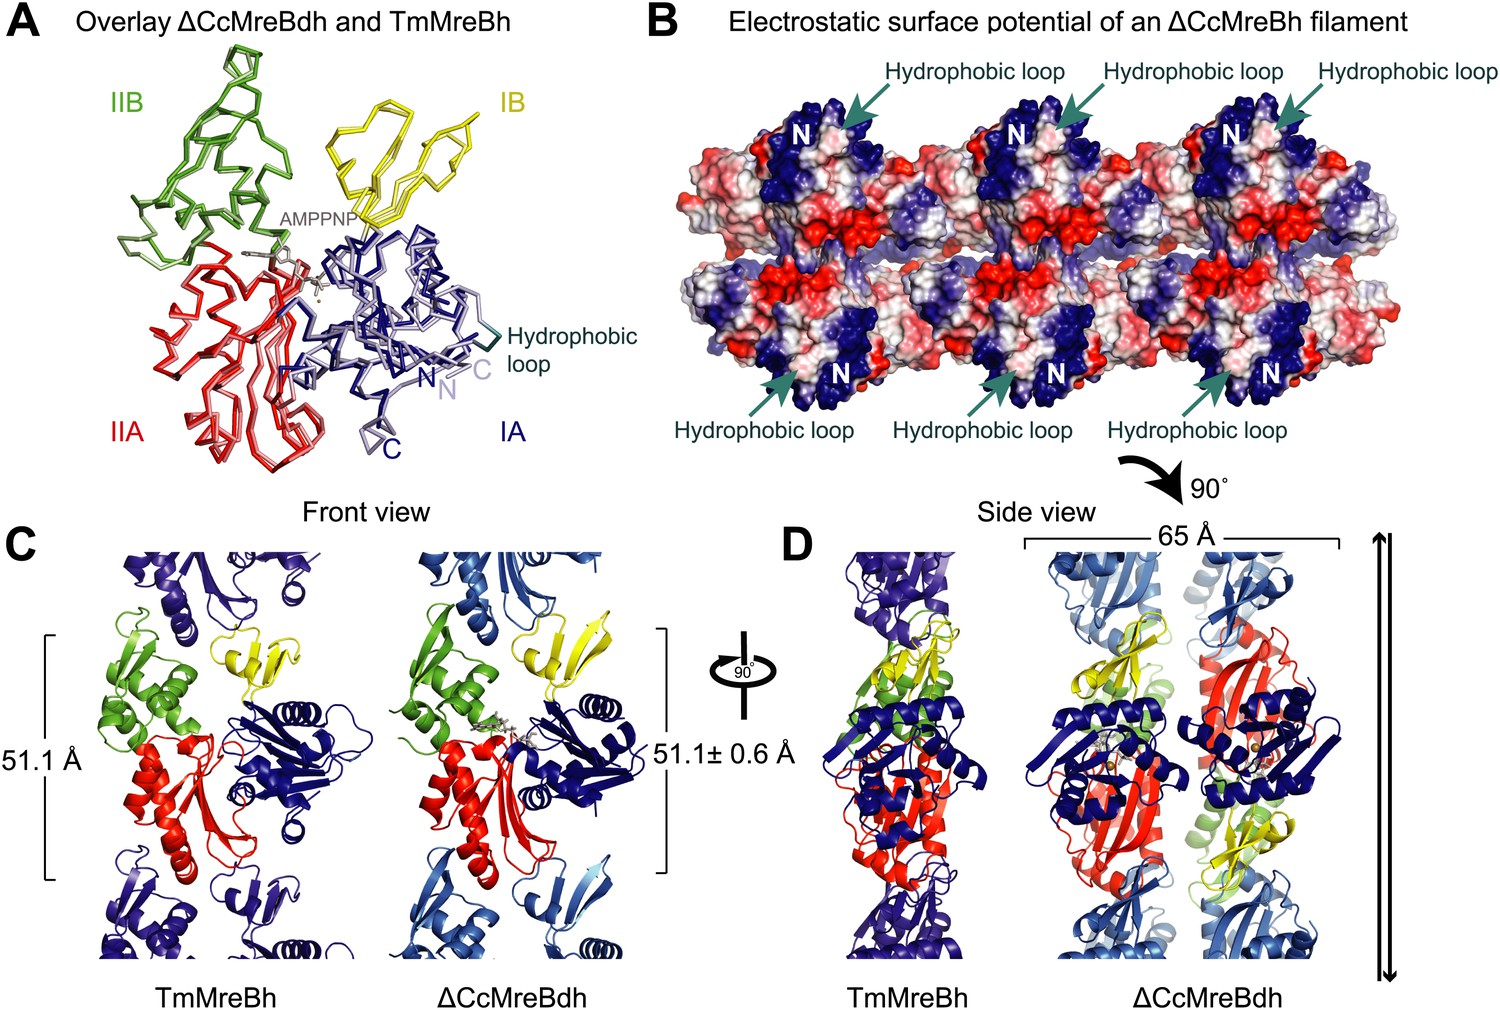
Comparison between crystal structures from Caulobacter crescentus and T. maritima MreB.
(A) The crystal structure of C. crescentus MreB (ΔCcMreBdh, d_3 [see Table 2] shown in dark colours) superimposes on that of T. maritima MreBh (PDB code 1JCG, shown in pastel colours) with an overall RMSD of 0.97 Å over 310 aligned residues and a Z-value of 20.95. The sequence similarity between the two proteins is 55.5%. Domains are coloured blue, for subdomain IA, yellow for subdomain IB, red for subdomain IIA, and green for subdomain IIB. The active site is located in the interdomain cleft and has AMPPNP (shown in grey) and Mg2+ (pink) bound to ΔCcMreBdh. The hydrophobic loop (coloured in cyan) is shown for TmMreB and is not ordered in ΔCcMreBdh (d_3). (B) Electrostatic surface potential of an antiparallel protofilament of C. crescentus MreB shown from side view, where it binds to the membrane. The hydrophobic loop is indicated by an arrow (cyan) and the N-terminus from where the amphipathic helix emerges is shown (N). Positively charged regions are shown in blue, negatively charged areas in red and hydrophobic patches in white. Crystals containing antiparallel protofilaments of ΔCcMreBh were soaked in ATPγS. (C) Front view of a protofilament from T. maritima MreB and C. crescentus MreB. Crystals containing TmMreBh protofilaments (PDB code 1JCG, left) have the same subunit repeat as those from ΔCcMreBdh (right, d_3). The colour code is as in Figure 1A. The standard deviation is calculated based on 7 crystal structures containing protofilaments of C. crescentus MreB (Table 2). (D) Side view of a single protofilament of T. maritima MreB (PDB code IJCG, left) and double protofilaments from ΔCcMreBdh (right, d_3) arranged in an antiparallel fashion (indicated by the black arrows on the right). Colour codes indicate the four subdomains, as explained in Figure 1A.
Figure 1—figure supplement 1
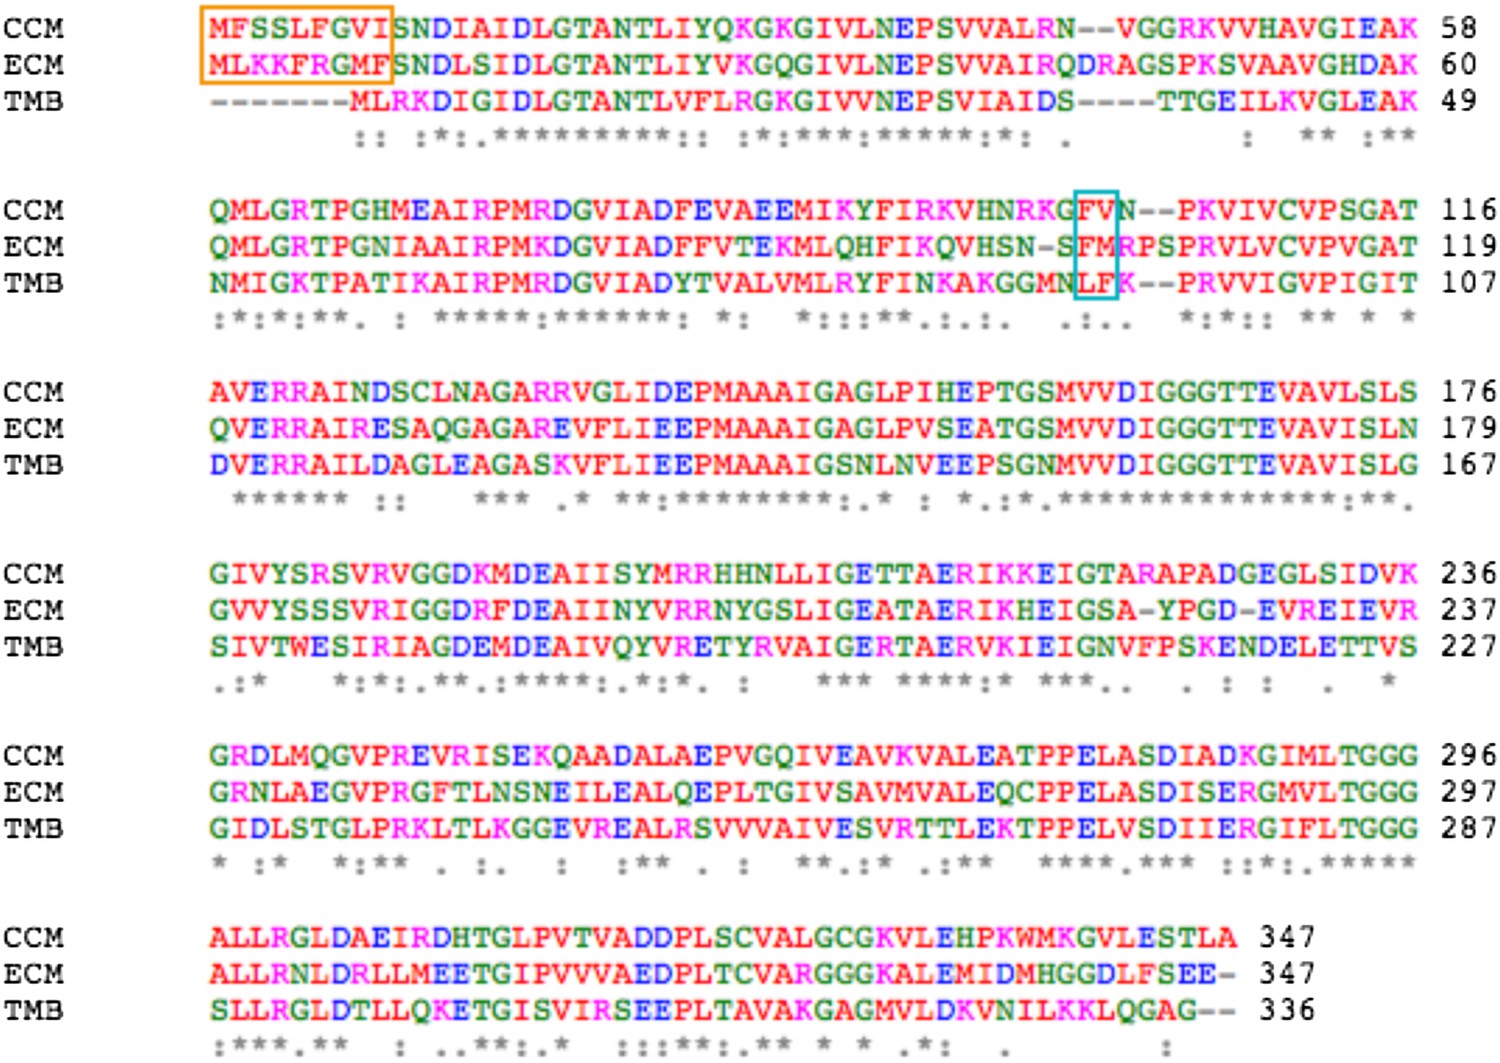
Sequence alignment between MreB from C. crescentus (CCM), E. coli (ECM), and T. maritima (TMB).
The orange box indicates the amphipathic helix at the N-terminus and the cyan box indicates the hydrophobic loop.
Figure 1—figure supplement 2
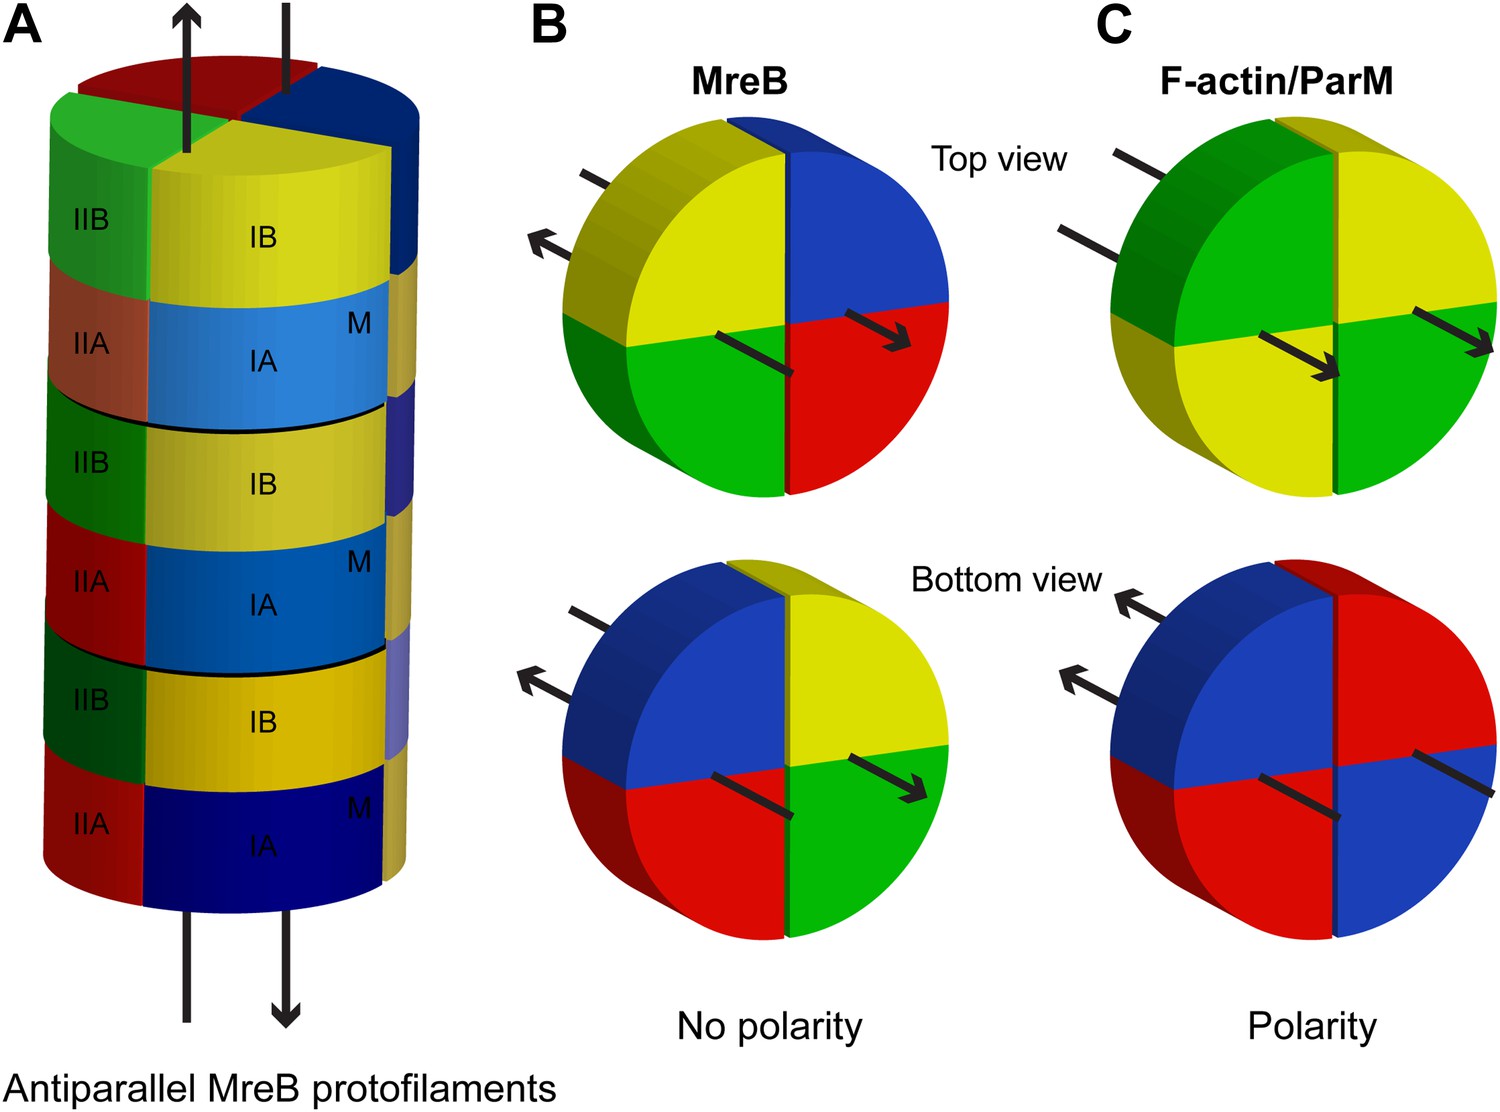
Schematic showing lack of polarity at filament ends in an MreB filament.
(A) Two antiparallel protofilaments; (B) Top and bottom ends of antiparallel MreB filament having the same surface; (C) Top (barbed) and bottom (pointed) end of a parallel filament, such as F-actin or ParM, showing distinctive ends. Colours indicate the subdomains, as explained in Figure 1A. M indicates the membrane-binding site.
Figure 2
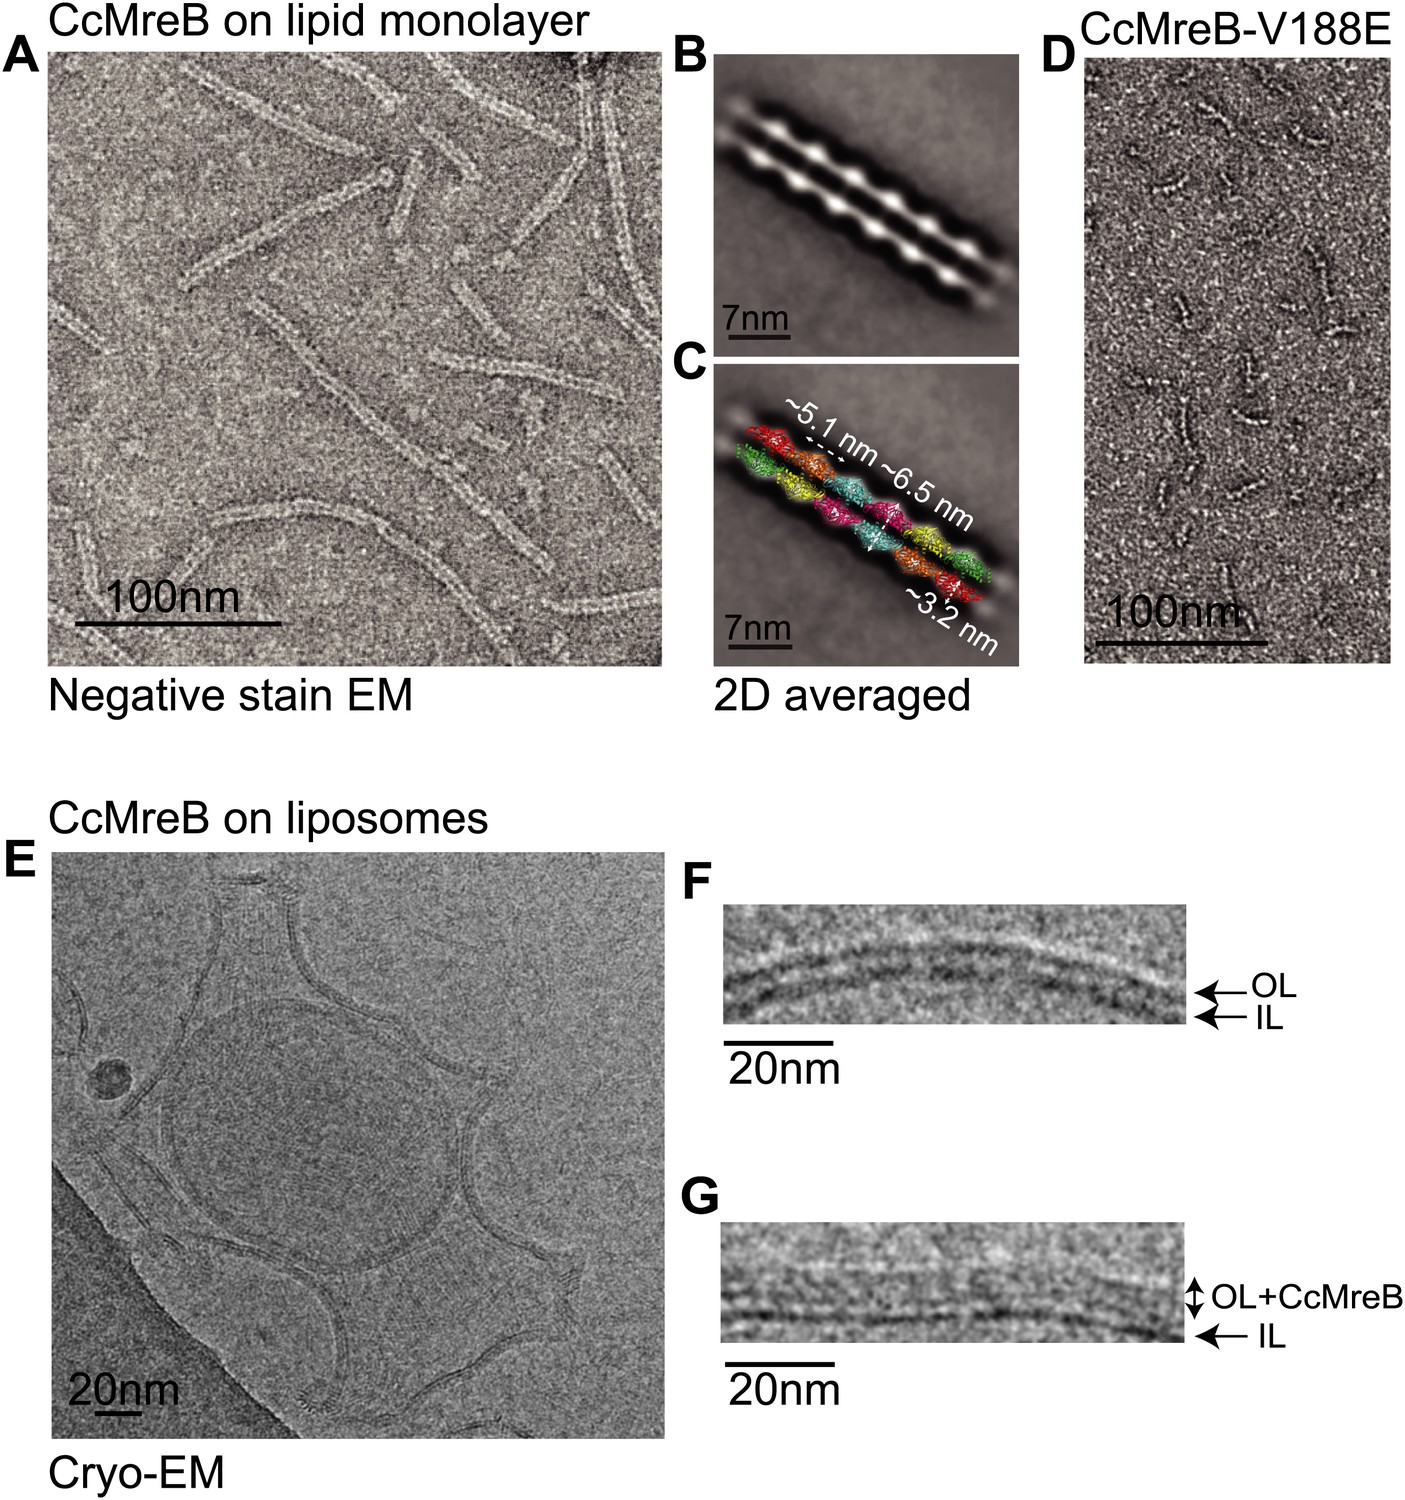
MreB forms double protofilaments on a lipid bilayer and distorts liposomes.
(A) Negative stained electron microscopy image of untagged CcMreB double protofilaments assembled on lipid monolayer at 0.25 mg/ml in the presence of ATP. Bar: 100 nm. (B) 2D averaging of CcMreB double protofilaments from views similar to the one shown in A. Bar: 7 nm. (C) Scaled double protofilament from the ΔCcMreBh crystal structure (d_e) was positioned into the EM density obtained from the 2D averaging. Bar: 7 nm. (D) Negative stained electron microscopy image of untagged CcMreB-V118E single protofilaments assembled on lipid monolayer at 0.13 mg/ml in the presence of ATP. Bar: 100 nm. (E) Cryo-EM image of ATP-bound CcMreB (1 mg/ml), which distorts liposomes made from E. coli total lipid extract. Scale bar: 20 nm. (F) Negative control showing the membrane of a liposome in the absence of CcMreB. OL: outer leaflet. IL: inner leaflet. Scale bar: 20 nm. (G) View of a liposome membrane in the presence of ATP-bound CcMreB. OL + CcMreB: outer leaflet with CcMreB. IL: inner leaflet. Scale bar: 20 nm.
Figure 3

MreB binds to one leaflet of the lipid bilayer in the presence of ATP.
(A) Image of negatively stained lipid tubes, made by mixing E. coli total lipid extract with 30% of D-Galactosyl-β1-1′-N-Nervonoyl-D-erythro-sphingosine (C24:1 β-D Galactosyl-Ceramide, Avanti Polar Lipids). Bar: 200 nm. (B) Cryo-EM image of a lipid tube. Bar: 20 nm. (C) Cryo-EM image of CcMreB (i), TmMreB (ii) on lipid tube at 1 mg/ml. Bar: 20 nm. (D) Cross section view of a lipid tube coated by TmMreB (1 mg/ml). Bar: 20 nm. (E) 2D averaging of the edge of TmMreB-coated lipid tubes from views such as those squared in Figure 3D. The longitudinal subunit repeats of ∼5 nm is in agreement with that of the crystal structure (Figure 1C). The lipid bilayer is ∼7 nm and MreB extends the density to a total of ∼12.5 nm. Bar: 20 nm. (F) Scaled protofilament from the ΔCcMreBh crystal structure (d_3) was positioned into the EM density obtained from 2D averaging. Scale bar: 20 nm. (G) Subtomogram averaging reconstruction of a lipid tube coated with TmMreB. Top and cross-section views. Scale bar: 20 nm.
Figure 4
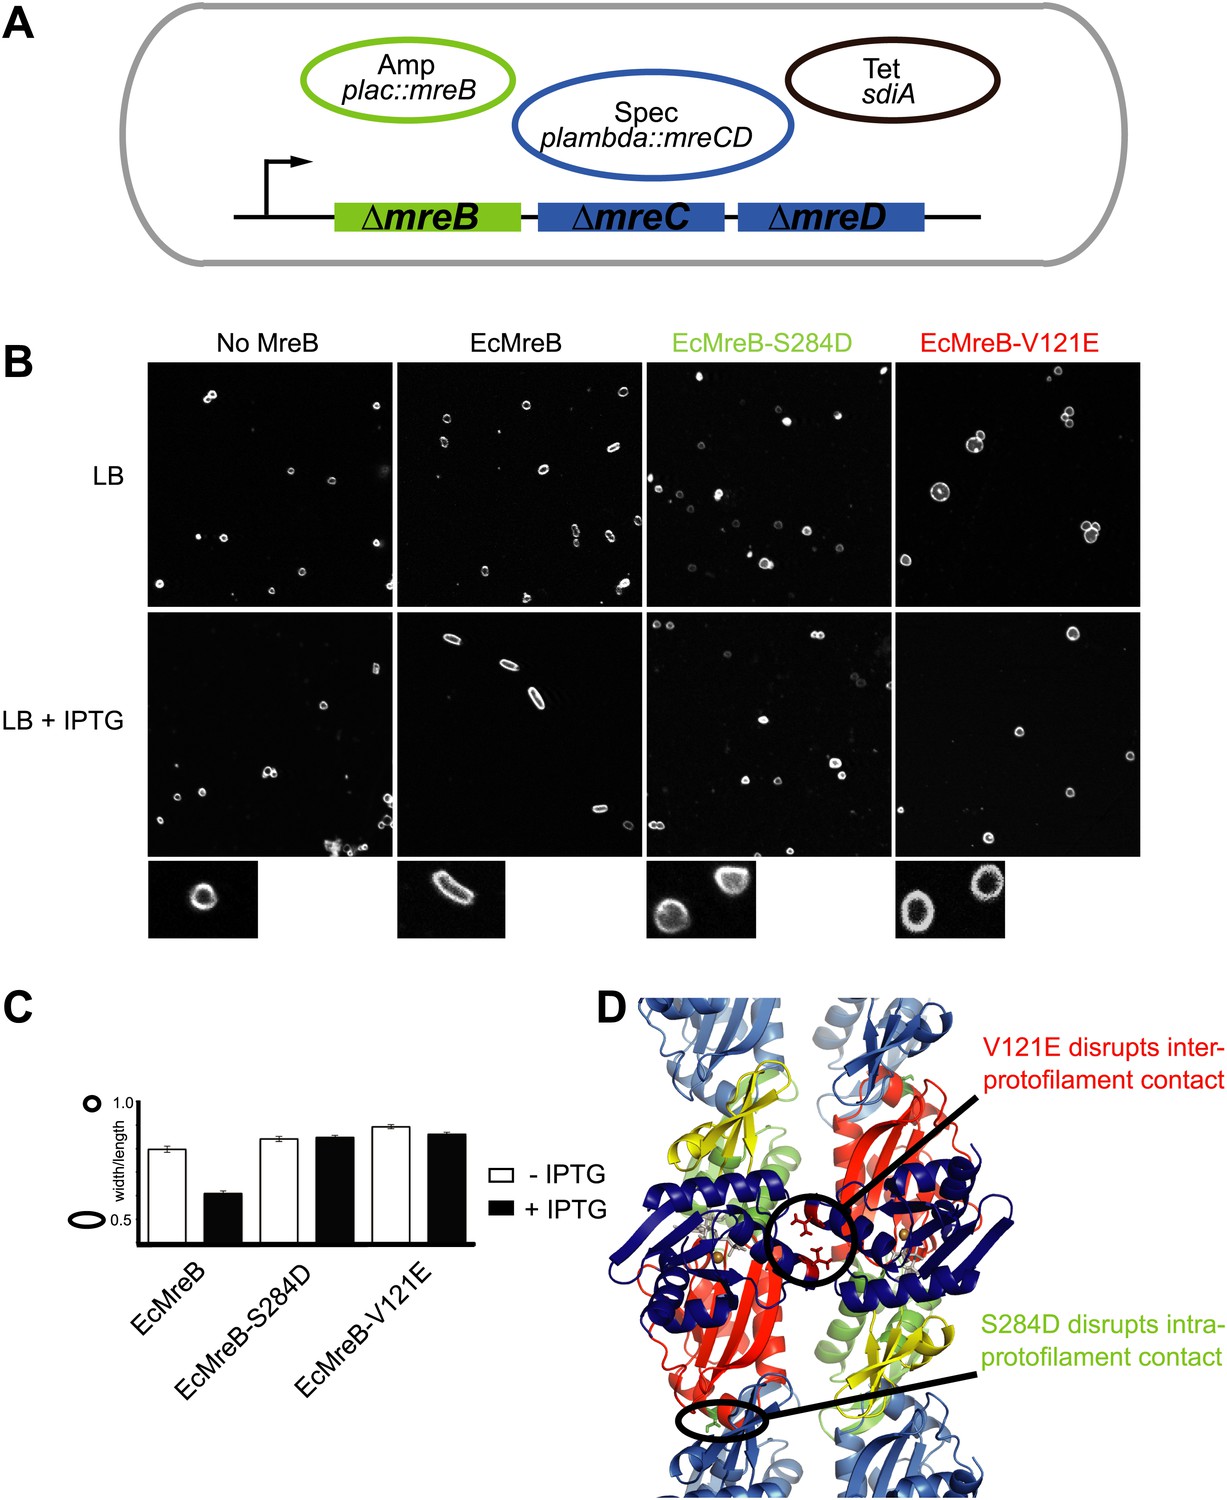
Pairs of MreB protofilaments are essential for cell shape maintenance in E. coli.
(A) Schematic diagram showing the genetic set-up to examine cell shape maintenance by intra- and inter-protofilament mutants of MreB. An mreBCD knock-out strain (mreBCD < > frt, FB17) is kept alive by the constitutive expression of transcription factor SdiA (pFB112, tetR, shown in black), that enhances levels of FtsQAZ and a plasmid carrying mreCD downstream of a lambda promoter and a temperature-sensitive repressor (pFB124, specR, blue). Variants of mreB are expressed from a lac promoter on a third plasmid (plac::mreB, ampR, green). (B) Confocal images of strain FB17/pFB112/pFB124 (ΔmreBCD/tet sdiA/aadA clts plambda:mreCD) are shown in the first column, in the absence (top) and presence (bottom) of 250 µM IPTG. Wild-type MreB expressed from plasmid pFB209 (plac::EcMreB) complements the strain FB17/pFB112/pFB124 (ΔmreBCD/tet sdiA/aadA clts plambda:mreCD) in the presence (second column, bottom), but not in the absence (second column, top) of 250 µM IPTG. No complementation was observed with MreB that contains a single point mutation in the intra-protofilament interface (plac::EcMreB-S284D, pFE535) or in the inter-protofilament interface (plac::EcMreB-V121E, pFE400), regardless of the presence or absence of IPTG (third and fourth column). Cells were grown to late log phase and stained with FM4-64 prior to visualisation with a Zeiss confocal laser scanning microscope LSM510. (C) Cell shape distribution shown for strain FB17/pFB112/pFB124 (ΔmreBCD/tet sdiA/aadA clts plambda:mreCD) complemented by wild-type MreB (plac::EcMreB, pFB209, labelled EcMreB), by intra-protofilament mutant (plac::EcMreB-S284D, pFE535, labelled EcMreB-S284D) or by the inter-protofilament mutant (plac::EcMreB-V121E, pFE400, labelled EcMreB-V121E). The width/length ratio was determined computationally with ImageJ. Perfect round cells have a value of 1.0 and rod cells a value around 0.6 for E. coli. Total number of cells measured for each experiment are as follows: plac::EcMreB (FB17/pFB112/pFB124), n = 68 (−IPTG); n = 92 (+IPTG); plac::EcMreB-S284D (FB17/pFB112/pFB124), n = 96 (−IPTG), n = 95 (+IPTG); plac::EcMreB-V121E (FB17/pFB112/pFB124), n = 51 (−IPTG), n = 51 (+IPTG). Error bars represent the standard error of the mean. (D) Structure of antiparallel protofilaments (d_3) showing the position of the intra-protofilament mutation S284D (green) and inter-protofilament mutation V121E (red).
Figure 5 with 1 supplement
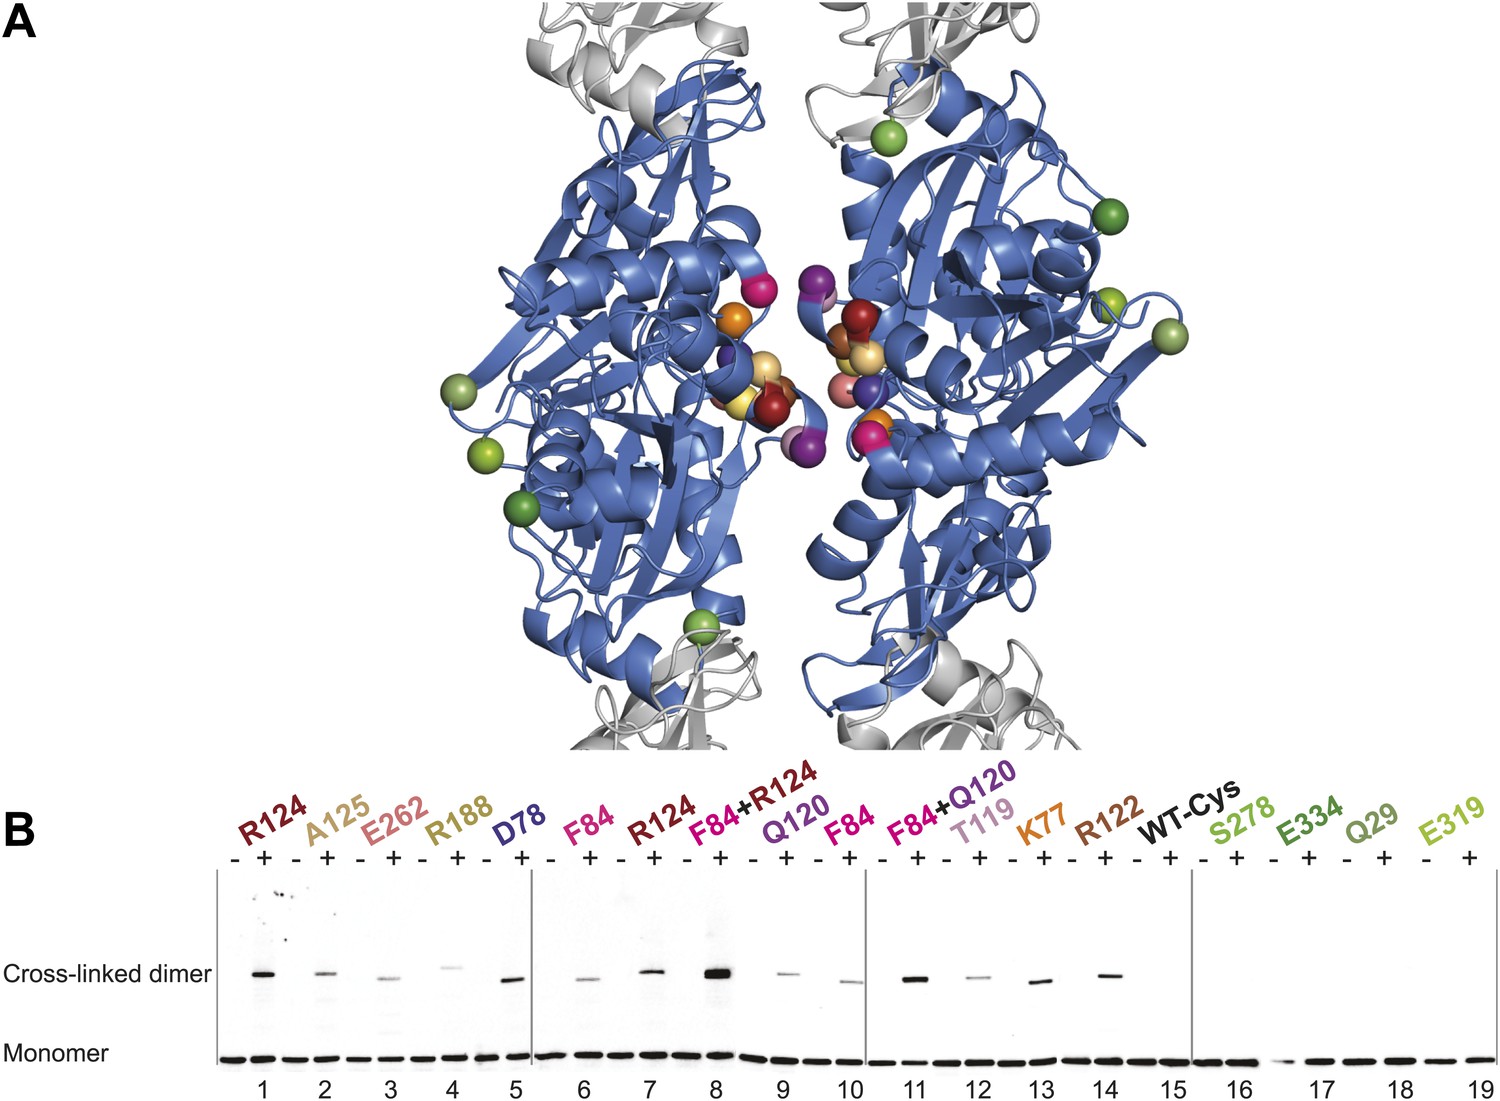
In vivo cysteine cross-linking of MreB in E. coli.
(A) Antiparallel protofilament of ΔCcMreBh (d_e) as depicted as a ribbon plot, showing the protofilament interface mutations in bold coloured spheres and the mutations outside the interface in green coloured spheres. (B) Immunoblot after in vivo cross-linking using MreB-specific antibody shows samples from MreB knockout strains (FB17/pFB112/pFB124 (ΔmreBCD/tet sdiA/aadA clts plambda:mreCD)) supplemented with a cysteine-containing MreB allele (plac::mreB), containing mutation(s) as indicated above the lanes. Cells were grown to late log phase, then incubated on ice with (+) or without (−) the thiol-specific compound bismaleimidoethane (BMOE), prior to western blot analysis. A band corresponding to a dimer of MreB occurs with mutants that contain a cysteine in the dimer interface (indicated in bright colours). No cross-linking product was obtained in mutants that do not have cysteine or contain cysteine residues outside the dimer interface (green).
Figure 5—figure supplement 1
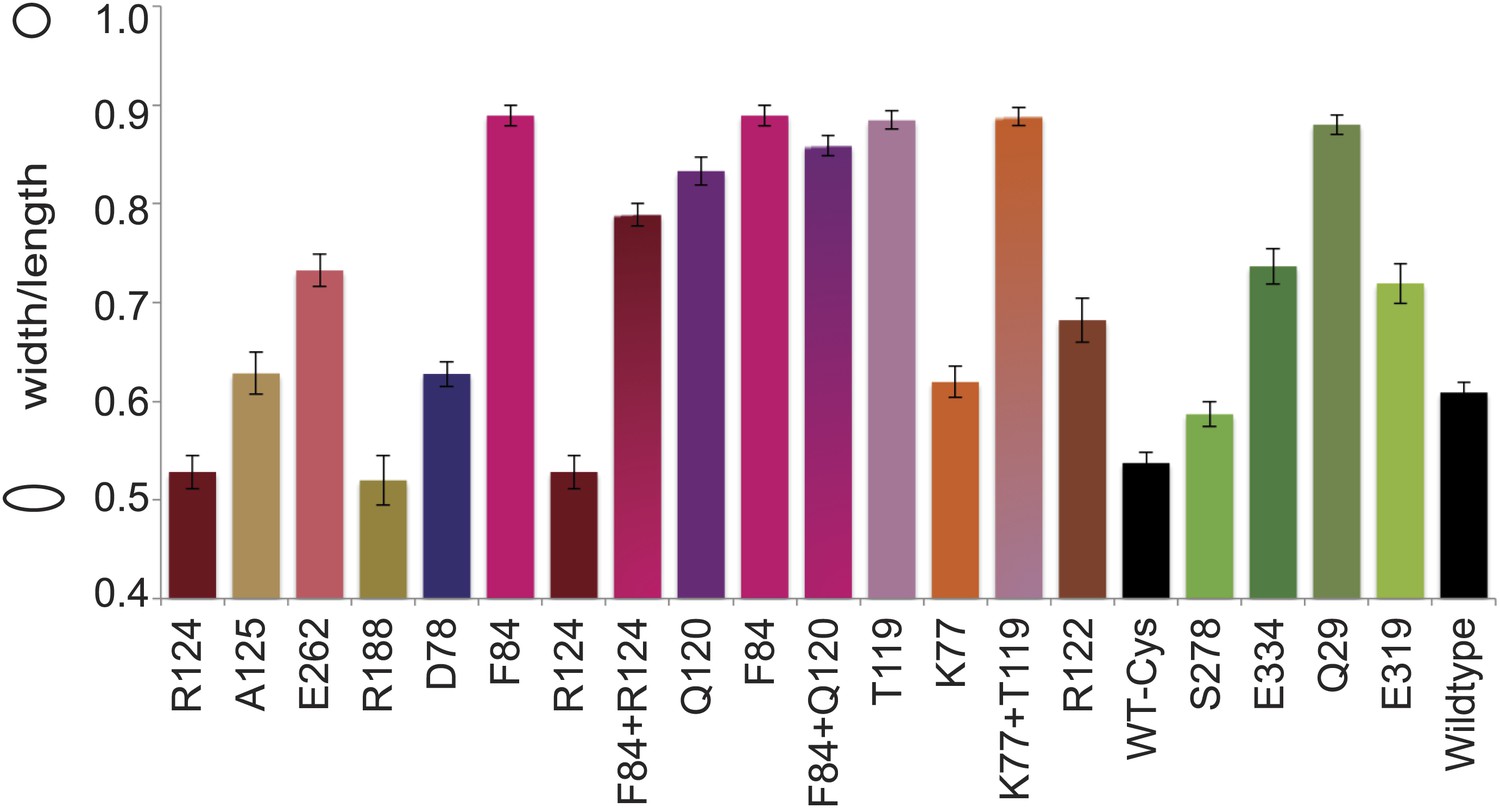
Cell shape distribution.
Shown is FB17/pFB112/pFB124 (ΔmreBCD/tet sdiA/aadA clts plambda:mreCD) (Bendezú and de Boer, 2008) complemented by mutated forms of MreB (plac::EcmreBmut). Width to length ratio was determined with ImageJ. Total numbers of cells measured for each construct is as follows: EcMreB-R124C/C113S/C278S/C324S, n = 62; plac::EcmreB-A125C/C113S/C278S/C324S, n = 53; EcMreB-E262C/C113S/C278S/C324S, n = 76; EcMreB-R188C/C113S/C278S/C324S, n = 45; EcMreB-D78C/C113S/C278S/C324S, n = 97; EcMreB-F84C/C113S/C278S/C324S, n = 39; EcMreB-F84C/R124C/C113S/C278S/C324S, n = 82; EcMreB-Q120C/C113S/C278S/C324S, n = 38; EcMreB-F84C/Q120C/C113S/C278S/C324S, n = 37; EcMreB-T119C/C113S/C278S/C324S, n = 53; EcMreB-K77C/C113S/C278S/C324S, n = 80; EcMreB-K77C/T119C/C113S/C278S/C324S, n = 51; EcMreB-R122C/C113S/C278S/C324S, n = 39; WT-Cys (EcMreB-C113S/C278S/C324S), n = 72; EcMreB-C113S/C324S, n = 130; EcMreB-E334/C113S/C278S/C324S, n = 70; EcMreB-Q29/C113S/C278S/C324S, n = 39; EcMreB-E319C/C113S/C278S/C324S, n = 32; EcMreB, n = 93. The order of the mutants is the same as shown in Figure 5B. Error bars represent the standard error of the mean. Cells were grown for 6 hr in the presence of 250 µM IPTG, 50 µg/ml ampicillin, 50 µg/ml spectinomycin, in LB at 37°C.
Figure 6 with 2 supplements
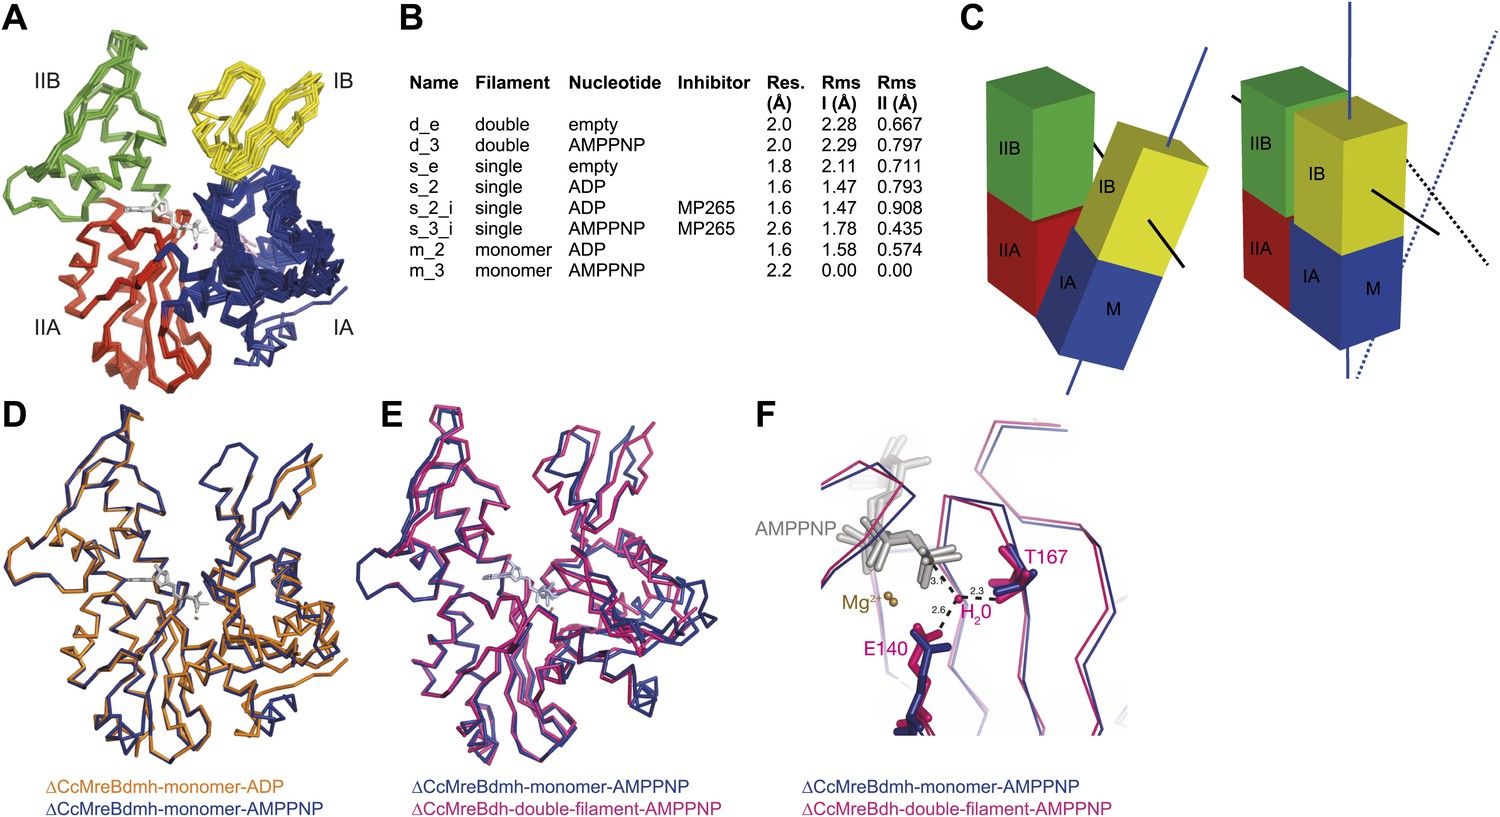
Crystal structures of MreB in different nucleotide states reveal a propeller twist.
(A) Superposition of crystal structures of C. crescentus MreB in different nucleotide states as listed in Figure 6B show movement in domain I rather than domain II. Colour codes of subdomains are as in Figure 1A. The nucleotide is shown in light grey, Mg2+ in purple, and the inhibitor in pink. (B) List of CcMreB crystal structures that occur either as a double or a single filament or as a monomer (second column), in the presence or absence of nucleotide/inhibitor (third and fourth column, respectively). The resolution of the structures is shown in the fifth column and the root mean square deviation (RMS) for domain I and domain II are listed in the last two columns. The RMS was calculated relative to the monomeric, AMPPNP-bound form (m_3 in Table 2). (C) Schematic drawing showing the propeller twist in MreB. The interdomain cleft narrows due to the movement of domain I towards domain II that is accompanied by a rotation of domain I resulting in flattening of the interfilament interface. Domain colours are described in Figure 6A, the membrane binding site is indicated (M). (D) Superposition of ADP-bound ΔCcMreBdmh (m_2, shown in orange) and AMPPNP-bound ΔCcMreBdmh (m_3, shown in blue). A small movement of domain IB initiates the propeller twist observed upon polymerisation (Figure 6B). (E) Superposition of AMPPNP-bound monomeric ΔCcMreBdmh (m_3, shown in blue) and AMPPNP-bound polymeric ΔCcMreBdh (d_3, shown in pink) reveals a propeller twist: closing of the nucleotide-binding cleft by the movement of subdomain IB towards subdomain IIB, accompanied by a twist of subdomain IA, resulting of flattening of the molecule (Figure 6—figure supplement 2 and Figure 1—figure supplement 2). (F) Zoom into the active site of the superposition of AMPPNP-bound monomeric ΔCcMreBdmh (m_3, shown in blue) and AMPPNP-bound polymeric ΔCcMreBdh (d_3, shown in pink). The catalytic site residues E140 and T167 coordinate the attacking water to be in line with the gamma phosphate in filamentous MreB (pink). In monomeric, AMPPNP-bound MreB, the catalytic E140 moves 1 Å away from the nucleotide and is no longer able to bind to the catalytic water (blue).
Figure 6—figure supplement 1
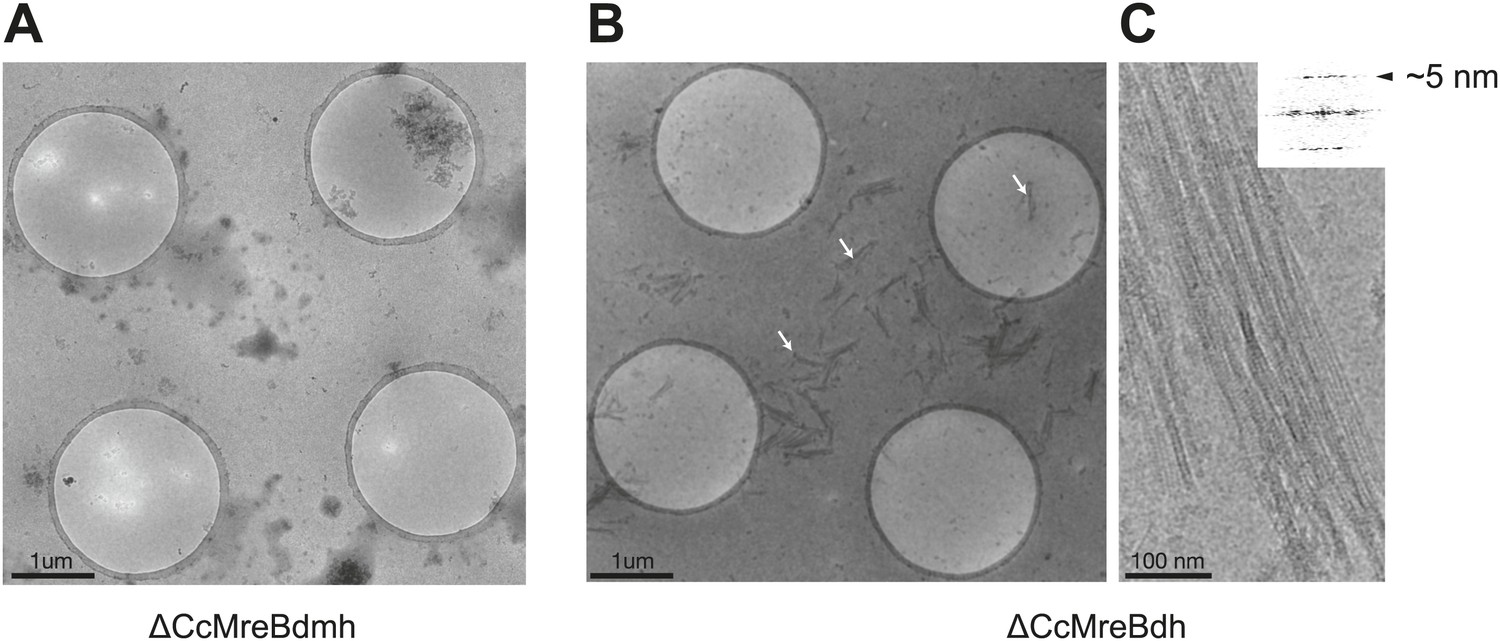
ΔCcMreBdh forms filaments as shown here by cryo-EM and a single mutation in the intra-protofilament interface disrupts filament formation (ΔCcMreBmdh).
(A) Low magnification view of ΔCcMreBdmh showing that S283D mutation prevents MreB polymerisation. (B) Low magnification view of ΔCcMreBdh. Arrows show MreB filament bundles, showing that the protein still polymerises. (C) High magnification picture of ΔCcMreBdh polymers containing a longitudinal repeat of ∼5 nm as shown by FFT (top right corner).
Figure 6—figure supplement 2
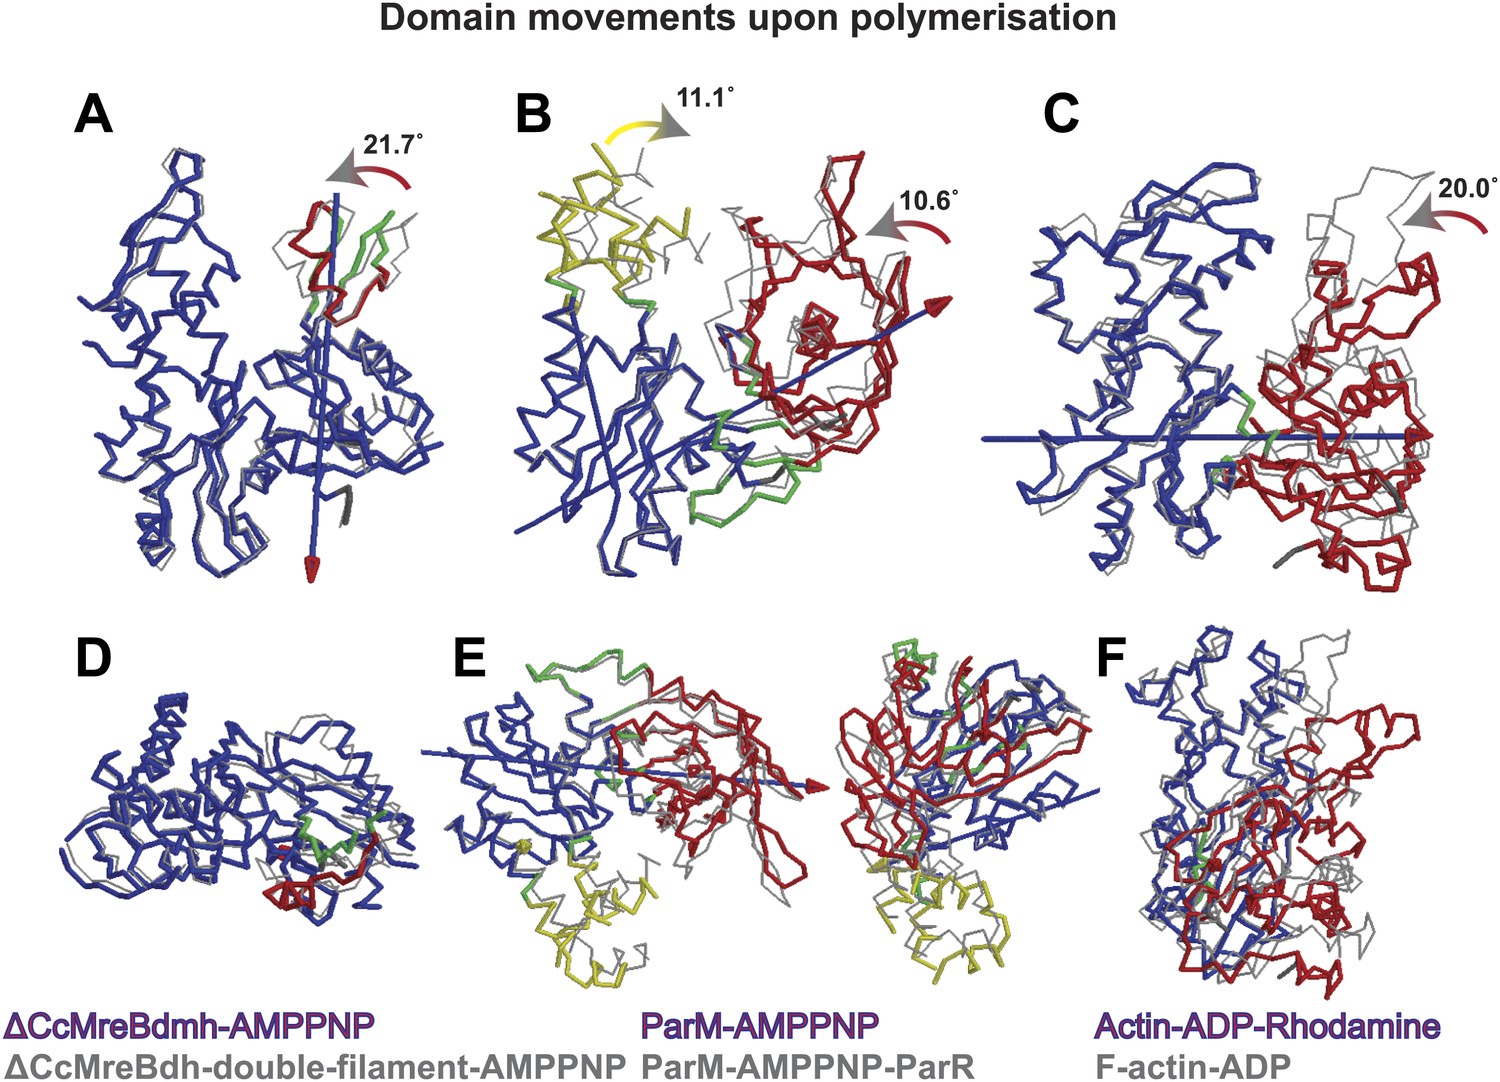
Domain rotations of actin-like proteins MreB, ParM and actin upon adopting the filament conformation.
The front view (top row, A–C) shows the subdomain I closing into the active site cleft upon transition from the monomeric to filamentous state. View looking along the screw axis of the interdomain rotation row (D–F). The superposition of the monomeric form (in colours) and the polymeric form (in grey) is shown. Bending residues are shown in green, moving regions are shown in red and yellow and more fixed regions are shown in blue. The blue lines with red/yellow arrows depict the interdomain screw axis. PDB codes: ParM_AMPPNP: 4A61; PaRM_AMMPNP_ParR: 4A62; Actin-ADP_Rhodamine: 1J6Z ; F-actin-ADP:2ZWH. Domain rotations determined by Dyndom (Hayward and Lee, 2002; http://fizz.cmp.uea.ac.uk/dyndom).
Figure 7
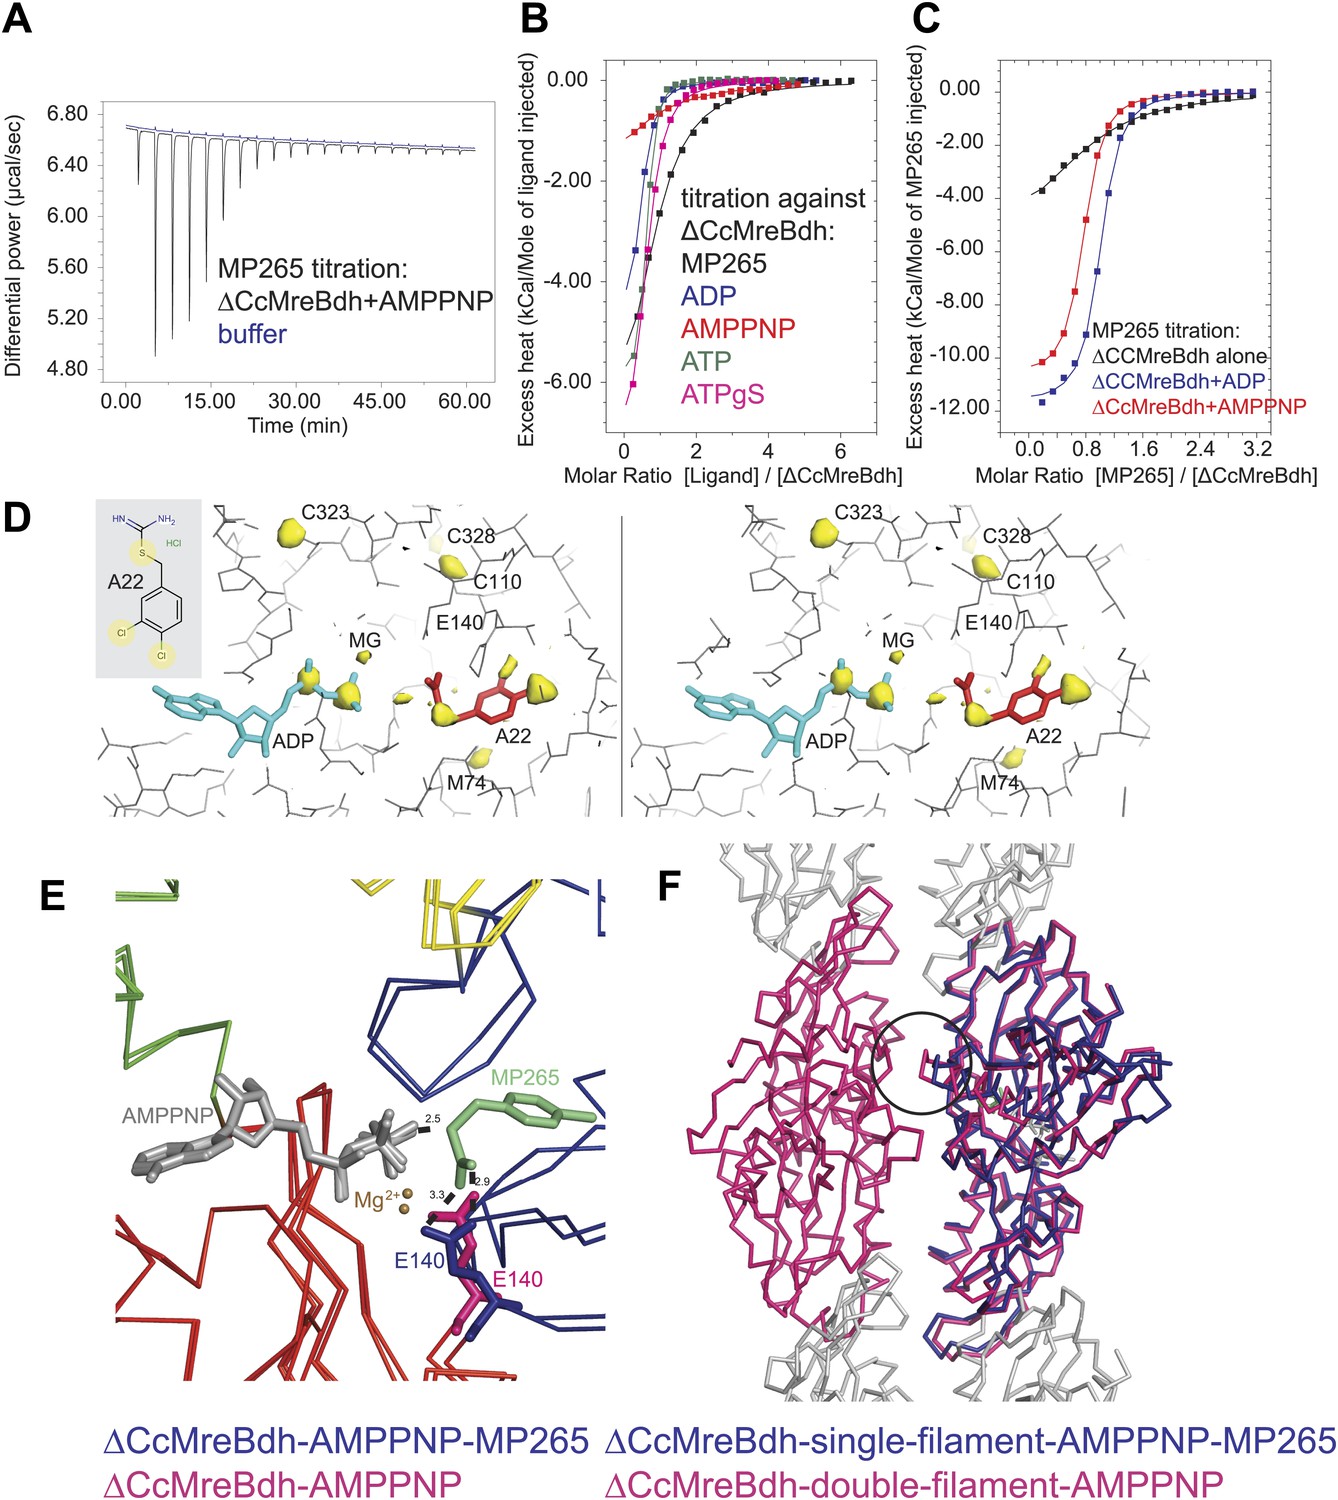
Mechanism of the inhibitory action of A22 and MP265 on MreB.
(A) Representative raw ITC data. Binding of MP265 to ΔCcMreBdh in the presence of 0.5 mM AMPPNP, measured at 25°C (black). Corresponds to red curve in Figure 7C. Control heats for the titration of MP265 into dialysis buffer at 25°C are shown in blue. (B) ITC measurements and curve fits for different nucleotides and MP265. Black: MP265 (Kd 26 µM, ΔH −7.9 kcal/mol); blue: ADP (Kd 4 µM, ΔH −5.3 kcal/mol); red: AMPPNP (Kd 65 µM, ΔH −4.4 kcal/mol); olive: ATP (Kd 1 µM, ΔH −6.0 kcal/mol); magenta: ATPγS (Kd 4.5 µM, ΔH −7.7 kcal/mol). Binding decreases as follows: ATP > ADP ∼ ATPγS >> AMPPNP. Note that MP265 binds 20–30 times tighter in the presence of nucleotide, as shown in Figure 7C. (C) ITC measurements and curve fits for MP265 binding in the presence of different nucleotides. Measured at 25°C for the binding of MP265 to ΔCcMreBdh alone (black, note separate but identical in design experiment to black curve in B) and in the presence of 0.5 mM ADP (blue) or 0.5 mM AMPPNP (red). Solid lines are the fit to data having the following parameters; ΔCcMreBdh and MP265 alone (black) Kd 27 µM, ΔH −6 kcal/mol; ΔCcMreBdh and MP265 + 0.5 mM ADP (blue) Kd 1.3 µM, ΔH −12 kcal/mol; CCM2DM and MP265 + 0.5 mM AMPPNP (red) Kd 1.7 µM, ΔH −11 kcal/mol. Similar data were obtained (not shown) for binding experiments at 15°C where affinities were 19, 0.6 and 0.7 µM respectively. MP265 binds stronger in the presence of di- and tri-phosphate nucleotides than without. (D) Stereograph of the active site ADP-bound ΔCcMreBdh in complex with inhibitor A22 (s_2_a), showing the anomalous difference correlates well with the positions of nucleotide (light blue) and inhibitor A22 (red). The structure of A22 is shown in the inset (top left corner). (E) Superposition of AMPPNP-bound ΔCcMreBdh crystallised as double protofilaments (d_3) and AMPPNP-bound ΔCcMreBdh in complex with inhibitor MP265 crystallised as a single protofilament (s_3_i). The inhibitor binds to the catalytic residues E140 (blue) and the gamma phosphate thereby inhibiting nucleotide hydrolysis. It also blocks the exit channel for the phosphate. (F) Superposition of AMPPNP-bound ΔCcMreBdh crystallised as double protofilaments (d_3, shown in pink) and AMPPNP-bound ΔCcMreBdh in complex with inhibitor MP265 crystallised as a single protofilament (s_3_i, shown in blue). The inhibitor weakens the inter-protofilament interface by displacing the major dimerization helix (indicated by a black circle).
Videos
Video 1
CcMreB distorts vesicles.
Tomography of full-length untagged MreB (CcMreB) filaments (+ATP) bound to vesicles made from E. coli total lipid extract. MreB filaments are clearly seen on both the top and bottom flattened surfaces of the vesicle. Scale bar: 20 nm.
Video 2
TmMreB filaments on lipid nanotubes.
Tomography of full length untagged MreB (TmMreB) filaments (+ATP) bound to lipid nanotubes. Filaments are straight and run parallel to the long axis of the tubes. Scale bar: 50 nm.
Tables
Table 1
Summary of proteins used in this study
| Caulobacter crescentus MreB (GenBank: ACL95077.1) | |
| CcMreB | M1-CcMreB-A347 |
| ΔCcMreBh | M-I9-CcMreB-A347-GSHHHHHH |
| ΔCcMreBdh | M-I9-CcMreB(F102S, V103G)-A347-GSHHHHHH |
| ΔCcMreBdmh | M-I9-CcMreB(F102S, V103G, S283D)-A347-GSHHHHHH |
| Thermotoga maritima MreB1 (GenBank:AAD35673.1) | |
| TmMreB | M1-TmMreB-G336 |
| TmMreBh | M1-TmMreB-G336-GSHHHHHH |
Table 2
Crystallographic data
| Name | Tray | Protein | SG | Cell [Å] | Res. [Å] | Source* | Rpim† | CC1/2‡ | R/Rfree § | PDB | Model in ASU# | Filament type | |
|---|---|---|---|---|---|---|---|---|---|---|---|---|---|
| d_e | 28 | ΔCcMreBh | I2 | 52.3, 98.2, 90.3, β = 98.1° | 2.0 | I04-1 | 0.075(0.236) | 0.858 | 0.20/0.23 | 4cze | 1 MreB, 1 PO4 | double filament, empty | |
| s_2 | 93 | ΔCcMreBdh | P21 | 51.5, 71.8, 53.7, β = 100.4° | 1.6¶ | Fr-E | 0.011(0.063) | 0.990 | 0.17/0.20 | 4czf | 1 MreB, 1 MgADP | single filament, ADP | |
| s_2_a | 96 | ΔCcMreBdh | P21 | 50.7, 73.7, 54.2, β = 102.4° | 1.5 | Fr-E | 0.030(0.460) | 0.752 | 0.16/0.22 | 4czg | 1 MreB, 1 MgADP, 1 A22 | single, ADP, A22 | |
| s_2_i | 106 | ΔCcMreBdh | P21 | 50.6, 73.7, 53.7, β = 102.4° | 1.6 | Fr-E | 0.041(0.416) | 0.897 | 0.20/0.23 | 4czh | 1 MreB, 1 MgADP, 1 MP265 | single, ADP, MP265 | |
| s_e | 136 | ΔCcMreBdh | P21 | 52.0, 69.3, 52.2, β = 99.6° | 1.8 | I04 | 0.035(0.210) | 0.884 | 0.18/0.22 | 4czi | 1 MreB | single, empty | |
| d_3 | 144 | ΔCcMreBdh | P212121 | 51.5, 101.9, 122.7 | 2.0 | id23eh1 | 0.047(0.253) | 0.847 | 0.18/0.23 | 4czj | 2 MreB, 2 MgAMPPNP | double, AMPPNP | |
| s_3_i | 235 | ΔCcMreBdh | P212121 | 51.7, 73.2, 84.7 | 2.6 | id14eh4 | 0.042(0.256) | 0.818 | 0.20/0.25 | 4czk | 1 MreB, 1 MgAMPPNP, 1 MP265 | single, AMPNP, MP265 | |
| m_2 | 447 | ΔCcMreBdmh | P32 | 68.7, 68.7, 68.7 | 1.6 | I03 | 0.033(0.523) | 0.560 | 0.20/0.23 | 4czl | 1 MreB, 1 MgADP | monomeric, ADP | |
| m_3 | 452 | ΔCcMreBdmh | P43212 | 67.8, 67.8, 320.5 | 2.3 | I02 | 0.019(0.466) | 0.539 | 0.21/0.28 | 4czm | 2 MreB, 2 MgAMPPNP | monomeric, AMPPNP |
-
*
I04-1, I04, I03 and I02 beamlines at Diamond Light Source, Harwell, UK. Id23 and id14 at ESRF, Grenoble, France. Fr-E refers to in house data collection on a Rigaku Fr-E Superbright + generator equipped with MarDTB imageplate.
-
†
Numbers in parentheses refer to the highest resolution bin.
-
‡
correlation of random half-datasets in the highest resolution bin, as implemented in SCALA.
-
§
5% of reflections were randomly selected for the calculation of the Rfree value and excluded from all refinement procedures.
-
#
ASU: asymmetric unit of the crystal lattice. Water molecules (not tabulated) were automatically picked with phenix.refine and manually checked.
-
¶
Dataset resolution limited by diffraction geometry, not the crystal.
Additional files
-
Supplementary file 1
Plasmids used in this study.
- https://doi.org/10.7554/eLife.02634.019
-
Supplementary file 2
Crystallisation conditions.
- https://doi.org/10.7554/eLife.02634.020
Download links
A two-part list of links to download the article, or parts of the article, in various formats.
Downloads (link to download the article as PDF)
Open citations (links to open the citations from this article in various online reference manager services)
Cite this article (links to download the citations from this article in formats compatible with various reference manager tools)
Bacterial actin MreB forms antiparallel double filaments
eLife 3:e02634.
https://doi.org/10.7554/eLife.02634


