Regulation of retinal axon growth by secreted Vax1 homeodomain protein
- Korea Advanced Institute of Science and Technology, Republic of Korea
Figures
Figure 1 with 1 supplement
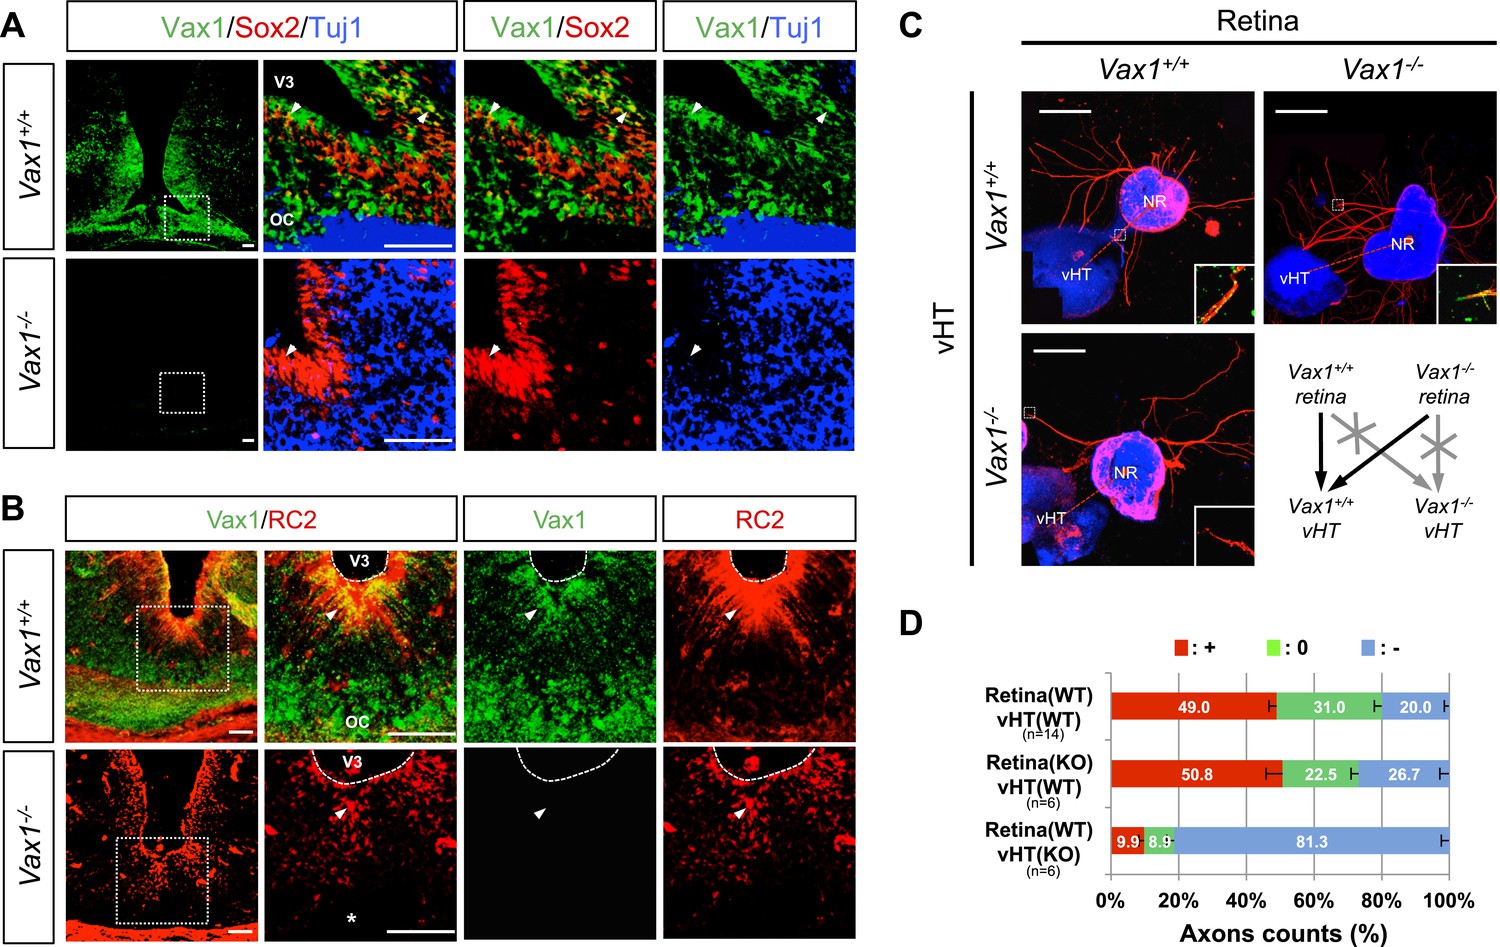
Vax1 regulates RGC axonal growth in a non-cell autonomous manner.
(A) Cells expressing Vax1 (green) in brain sections (coronal; 16 μm) from E14.5 Vax1+/+ (top) and Vax1−/− (bottom) embryos were detected by co-immunostaining for the NPC marker Sox2 (red) and post-mitotic neuronal marker tubulin-βIII (blue), detected with the Tuj1 antibody. The right-most three columns are the magnified images of dotted boxes in the left column image. The results indicate that Vax1 is expressed in a subpopulation of Sox2-positive NPCs (arrowheads) but is not detectable in Tuj1-positive neurons. (B) Vax1-expressing cells in the vHT were also compared with RC2-positive radial glia. Arrowheads indicate RC2-positive radial glial cells expressing Vax1. Scale bars: 50 μm. (C) The vHT and dorsal neural retina (NR) were isolated from WT (Vax1+/+) and Vax1-knockout (Vax1−/−) E13.5 mouse embryos and co-cultured in a combinatorial manner for 48 hr. The explants were fixed and immunostained with an anti-NF160 antibody (α-NF160; red); nuclei were counterstained with DAPI (blue). Dotted boxes indicate the area magnified in each inset. Red dotted lines link centers of retinal explants and vHT explants. Scale bars: 500 μm. (D) The angular distribution of RGC axons in images was measured by counting pixels containing immunostaining for the axon marker NF160 (axon counts), as described in ‘Materials and methods’, and presented graphically. +, forward direction angle segment; 0, neutral direction angle segments; −, reverse direction angle segment. The values in the bar are averages, error bars denote standard deviations (SDs), and numbers under y-axis labels are the numbers (n) of explants analyzed from three independent experiments. p-values determined by the analysis of variance (ANOVA) are between 0.01 and 0.005.
Figure 1—figure supplement 1
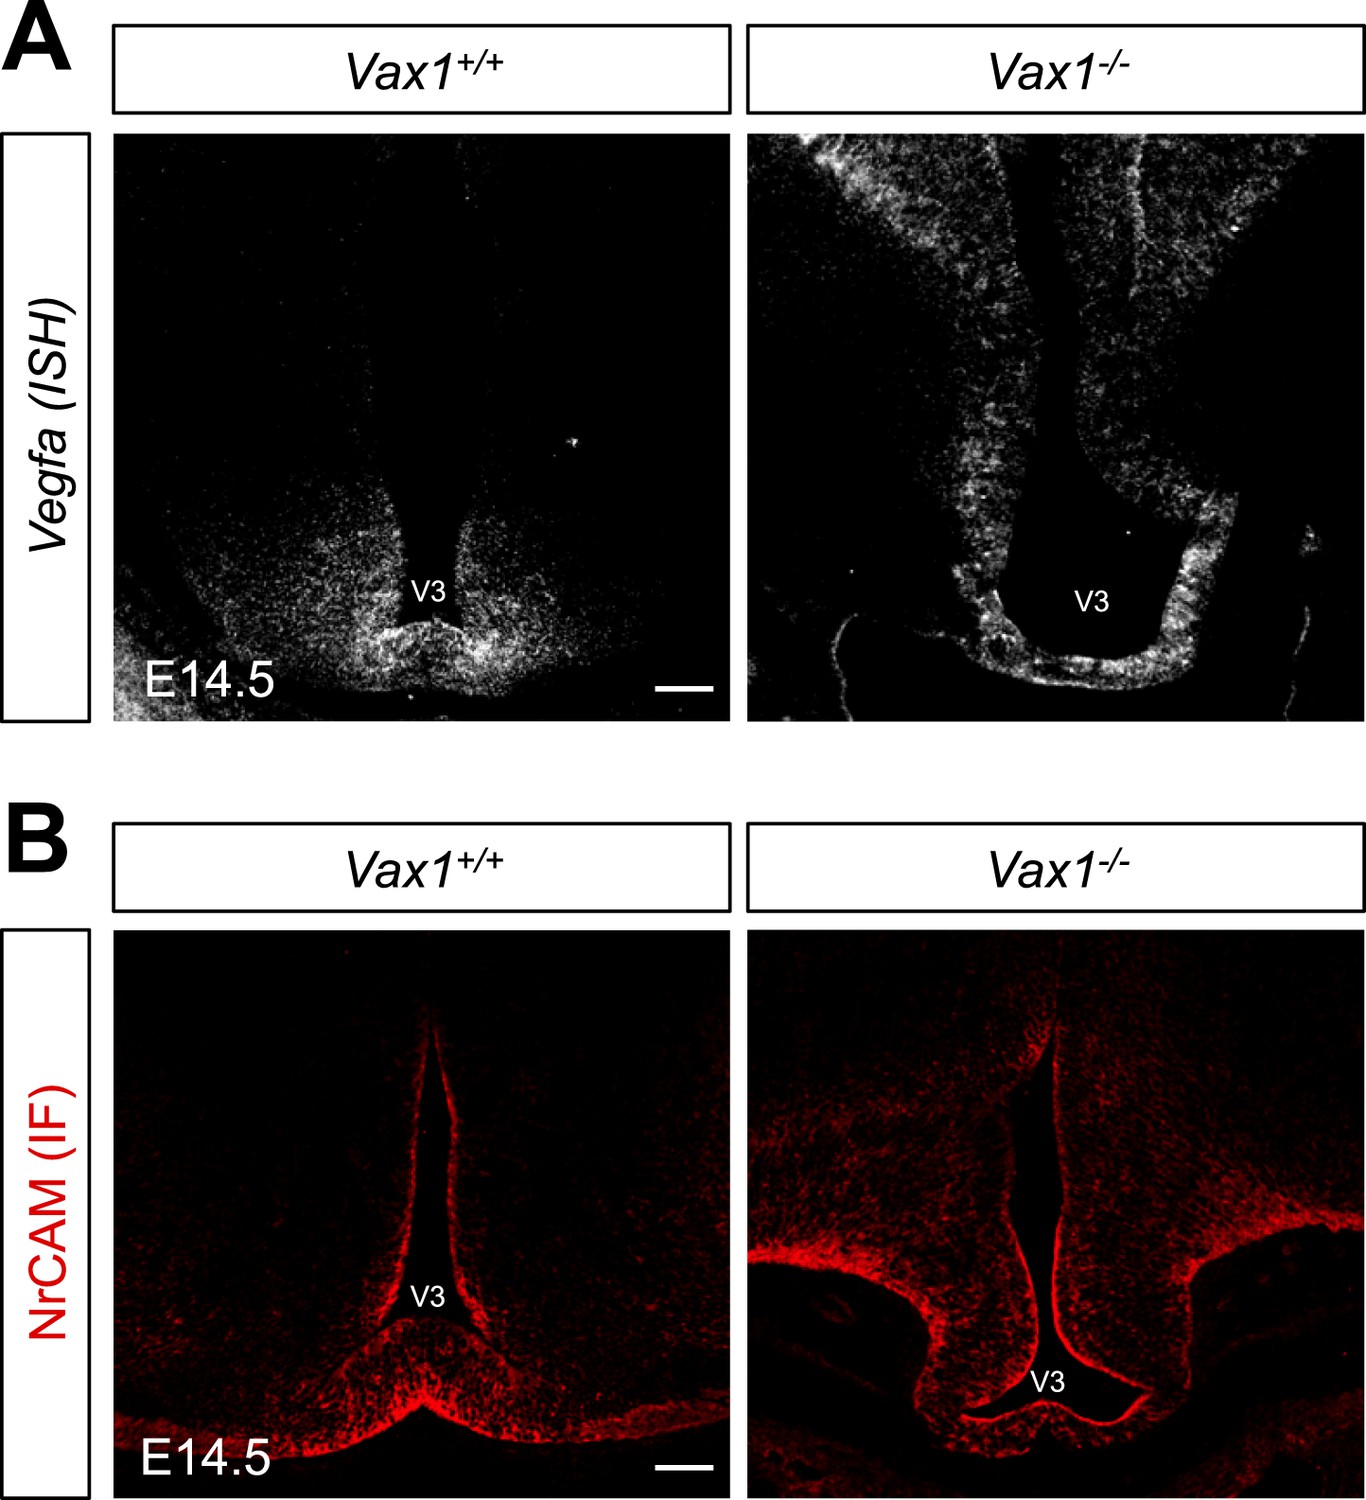
Expression of RGC axon attractive cues in Vax1−/− mouse vHT.
To determine whether defective projection of RGC axons to the vHT midline of Vax1−/− mice resulted from defective expression of RGC axon growth factors, such as VEGF164 or NrCAM (Williams et al., 2006; Erskine et al., 2011), in the vHT, we compared expression of these cues between WT (Vax1+/+) and Vax1-knockout (Vax1−/−) mouse embryos. Expression of Vegfa mRNA (A) and NrCAM protein in E14.5 Vax1+/+ and Vax1−/− mouse embryonic sections (coronal; 16 μm) was examined by in situ RNA hybridization (ISH; A) and immunofluorescence staining (IF; B), respectively. The vHT of the Vax1−/− mouse brain retained, but expanded, expression of both Vegfa and NrCAM. Scale bars: 100 μm.
Figure 2 with 2 supplements
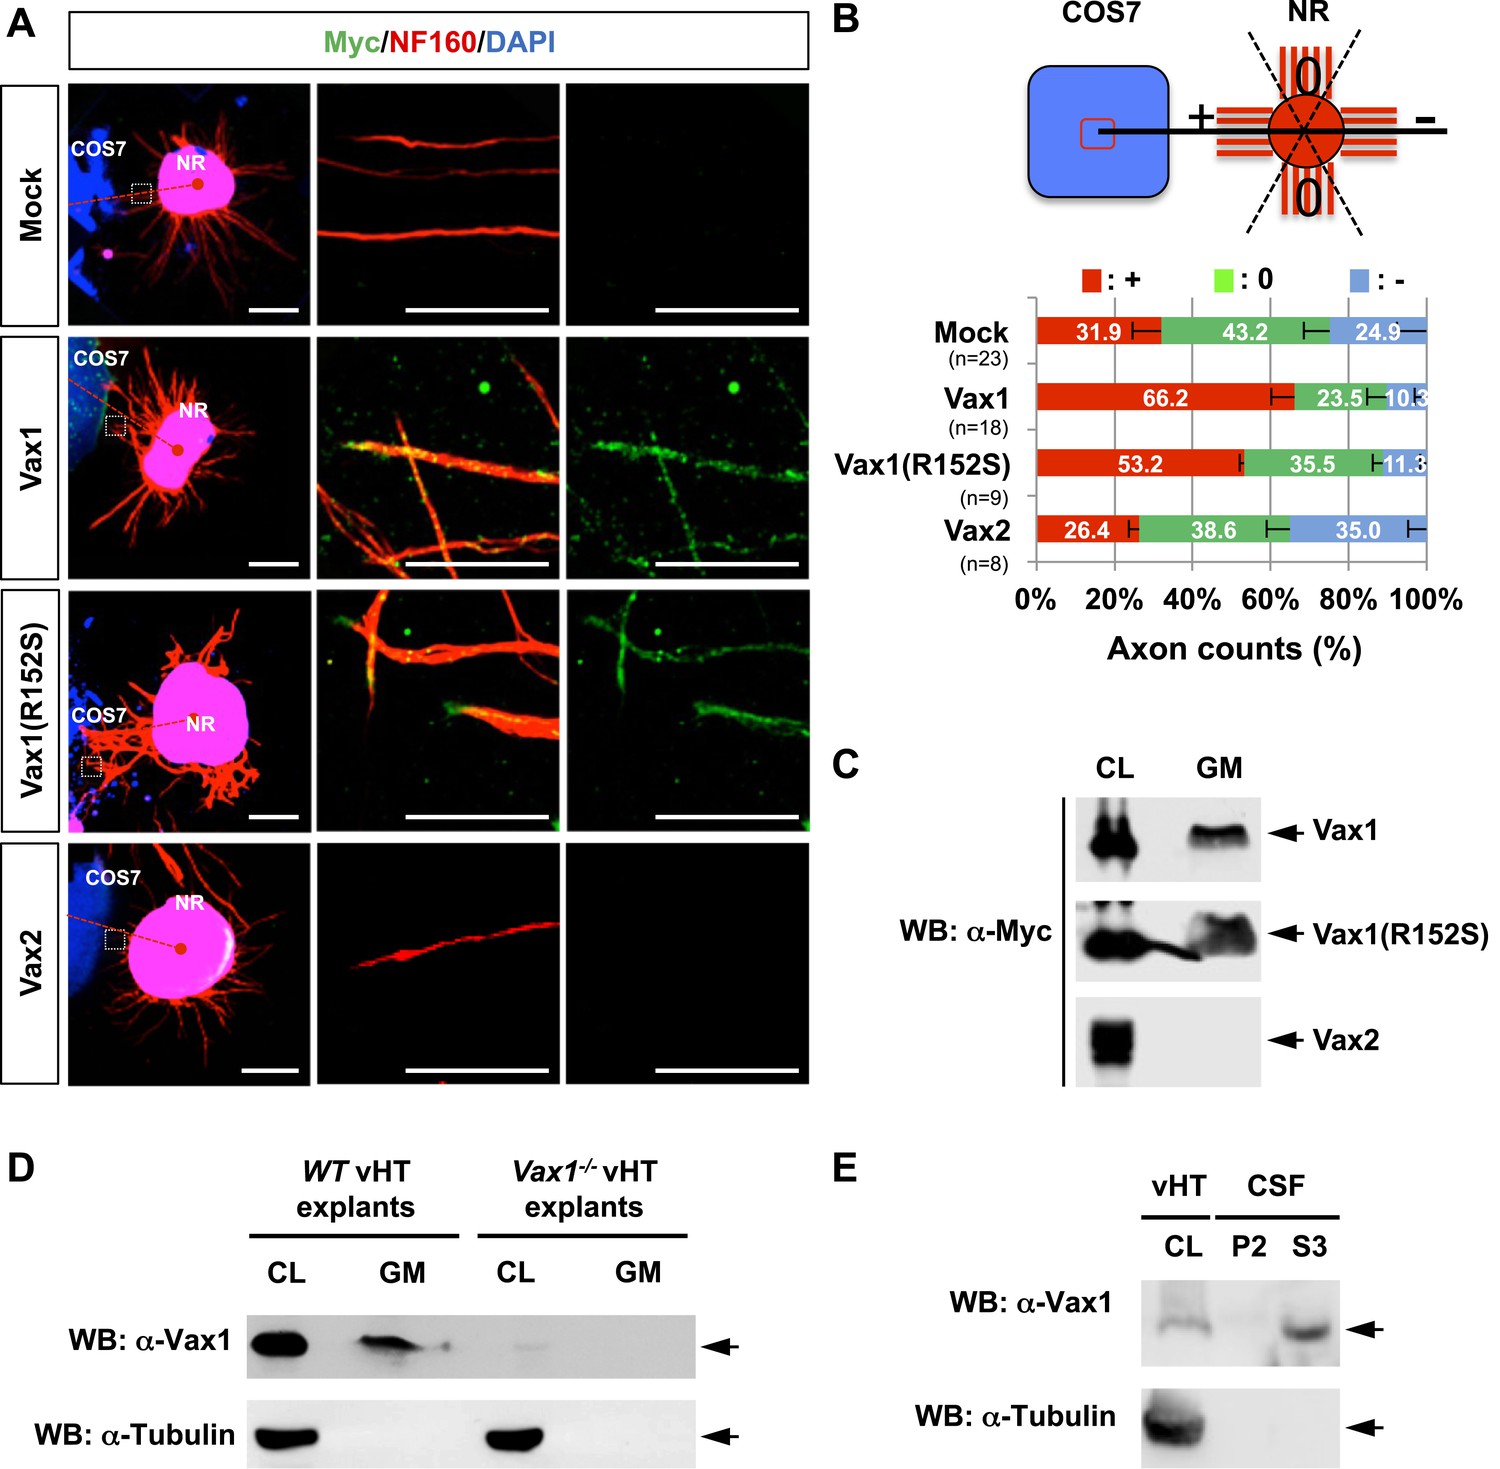
Vax1 homeodomain protein is a secreted protein.
(A) COS7 cells overexpressing Myc-tagged mouse Vax1, Vax1(R152S), or Vax2 were co-cultured with E13.5 mouse retinal explants (NR) for 48 hr. The explants were then stained with a rabbit anti-Myc antibody (green) and a mouse anti-NF160 antibody (red). Nuclei of explant cells were counterstained with DAPI (blue). Dotted red lines indicate the connections between the centers of two explants. Scale bars: 500 μm (left column) and 100 μm (magnified immunostained images in two right-hand columns). (B) The angular distribution of RGC axons was measured as described in Figure 1D. The values in the bar are averages and error bars denote SDs. Numbers under y-axis labels are the number of explants analyzed from three independent experiments. p-values are between 0.01 and 0.005 (ANOVA). (C) Growth medium from COS7 cells overexpressing Myc-Vax1, Myc-Vax1(R152S), or Myc-Vax2 was collected, and the presence of Vax protein in the growth medium (GM) was detected by Western blotting (WB) with an anti-Myc antibody. The relative amounts of secreted protein were also measured by analyzing the level of proteins in the COS7 cell lysates (CL; 5% of total). (D) vHTs isolated from WT and Vax1−/− E13.5 mouse embryos were cultured for 24 hr, after which GM was collected for detection of secreted Vax1 protein by Western blotting. CL, cell lysates of vHT explants (5% of total). (E) Cerebrospinal fluid (CSF) from E14.5 mouse embryos (n = 20) was collected, a supernatant fraction (S3) was separated from cell debris (P2) by step-wise centrifugation (see ‘Materials and methods’ for details), and the presence of Vax1 protein was examined by Western blotting. The presence of β-tubulin, a cytoplasmic protein, was also examined in GM and CSF fractions to check for the possible non-specific release of intracellular proteins from dead cells. CL, E14.5 vHT cell lysates (2% of total lysates from one embryonic vHT).
Figure 2—figure supplement 1
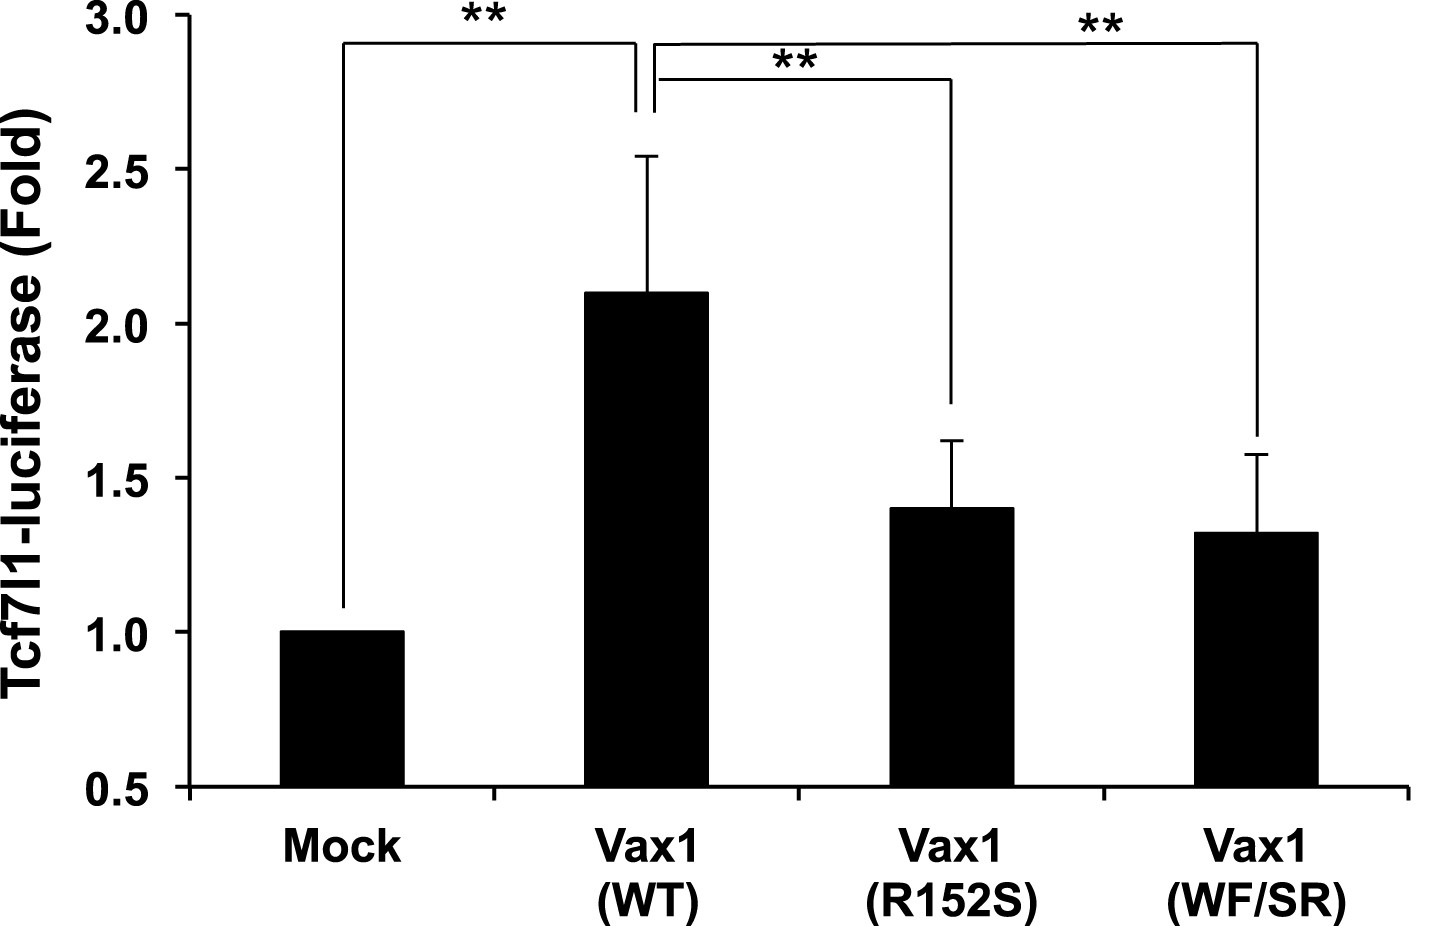
Relative transcriptional activities of Vax1 mutants used in this study.
HEK293T cells (105) were transfected with pcDNA6-V5 expression vectors (1 μg) for Vax1, Vax1(R152S), or Vax1(WF/SR) together with pGL3-Tcf7l1-luciferase (0.2 μg) (Vacik et al., 2011) and pCMV-β-gal (0.2 μg) plasmids. Luciferase activity in the transfected cells was measured 24 hr post-transfection. The values were then normalized to β-galactosidase activity in the same cells to obtain the relative luciferase activity of the cells. The values are averages obtained from three independent experiments, and error bars denote SDs (**p < 0.001; ANOVA).
Figure 2—figure supplement 2
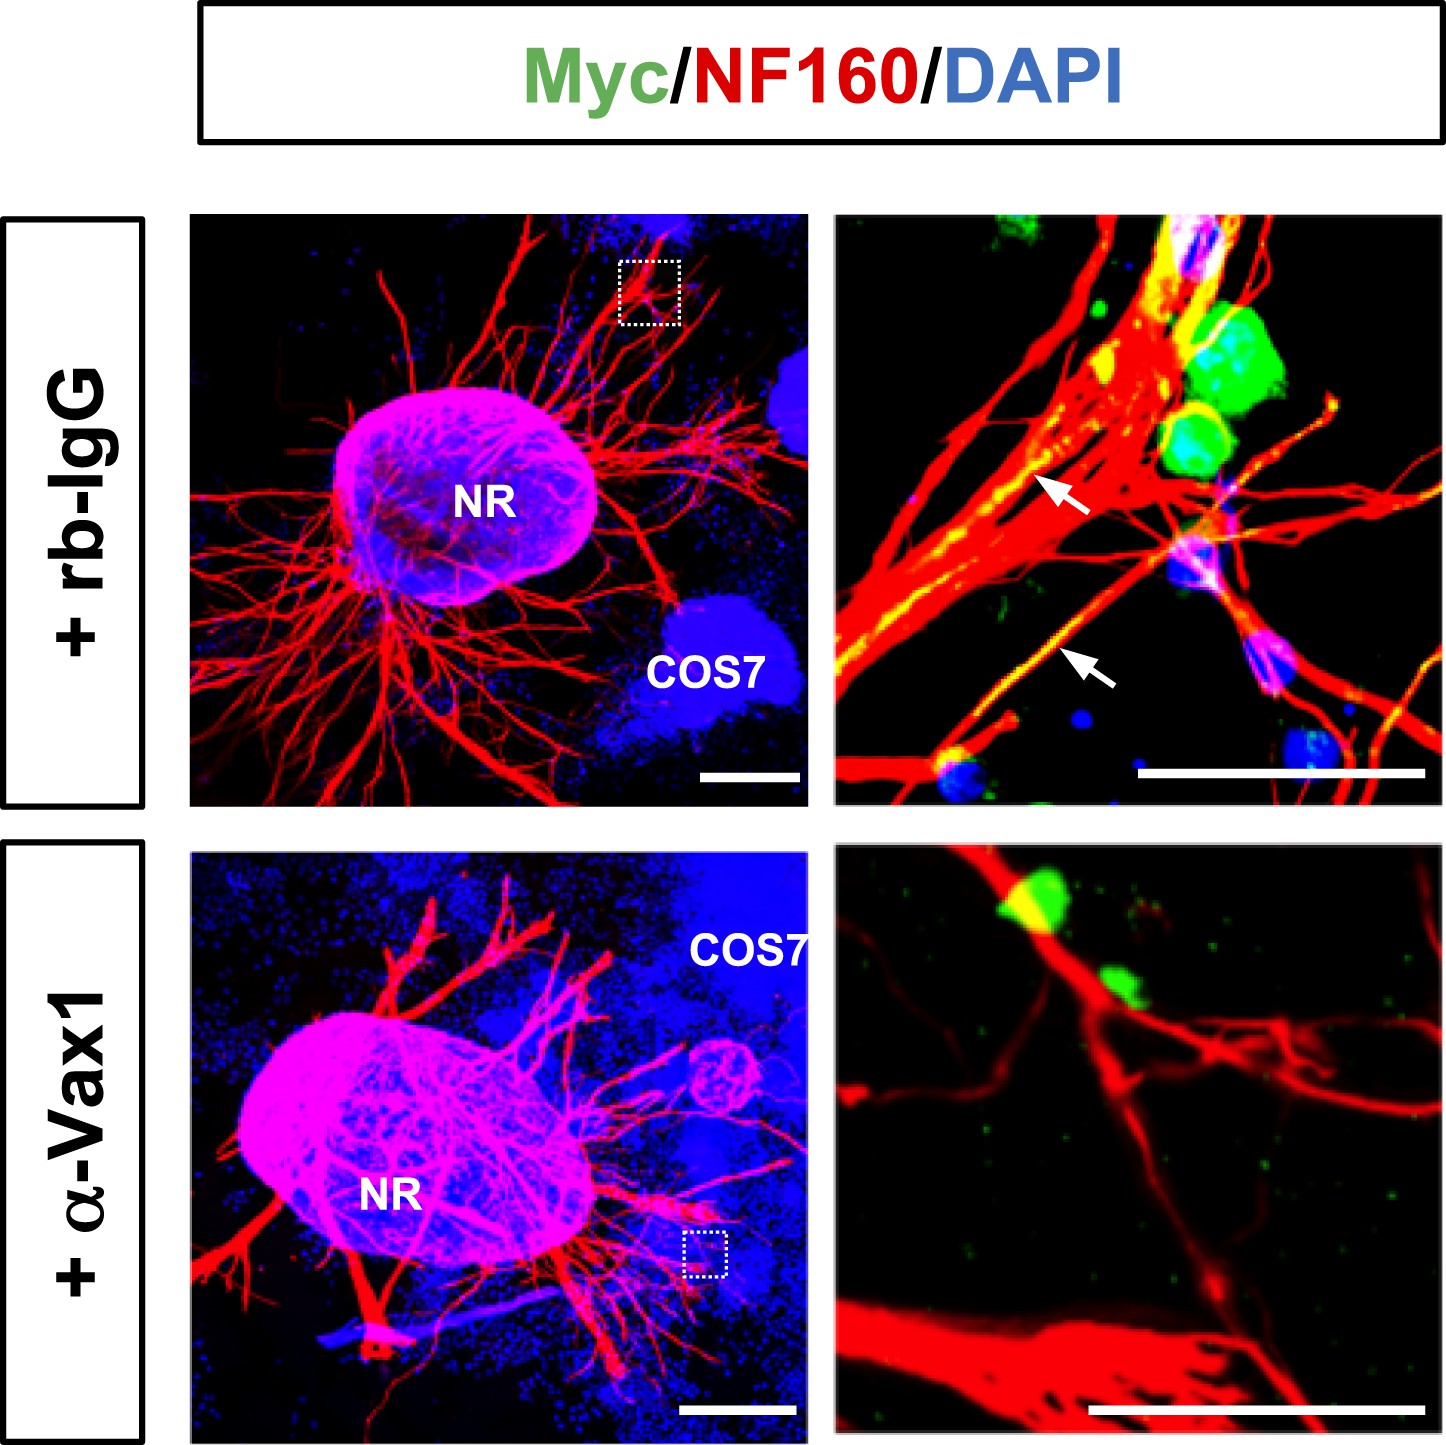
Interference of Vax1 intercellular transfer by sequestering extracellular Vax1.
E13.5 retinal explants were co-incubated with Myc-Vax1 transfected COS7 cell aggregates for 24 hr in the presence of rb-IgG (1 μg/ml; top) or anti-Vax1 antibody (α-Vax1; 1 μg/ml; bottom). The explants were then fixed for immunostaining with mouse anti-NF160 antibody (red) and rabbit anti-Myc antibody (green). Immunostaining images of dotted boxed area in the left column are shown in the right column. Arrows indicate Vax1-Myc proteins internalized to RGC axons. Scale bars: left, 500 μm; right, 100 μm.
Figure 3 with 3 supplements
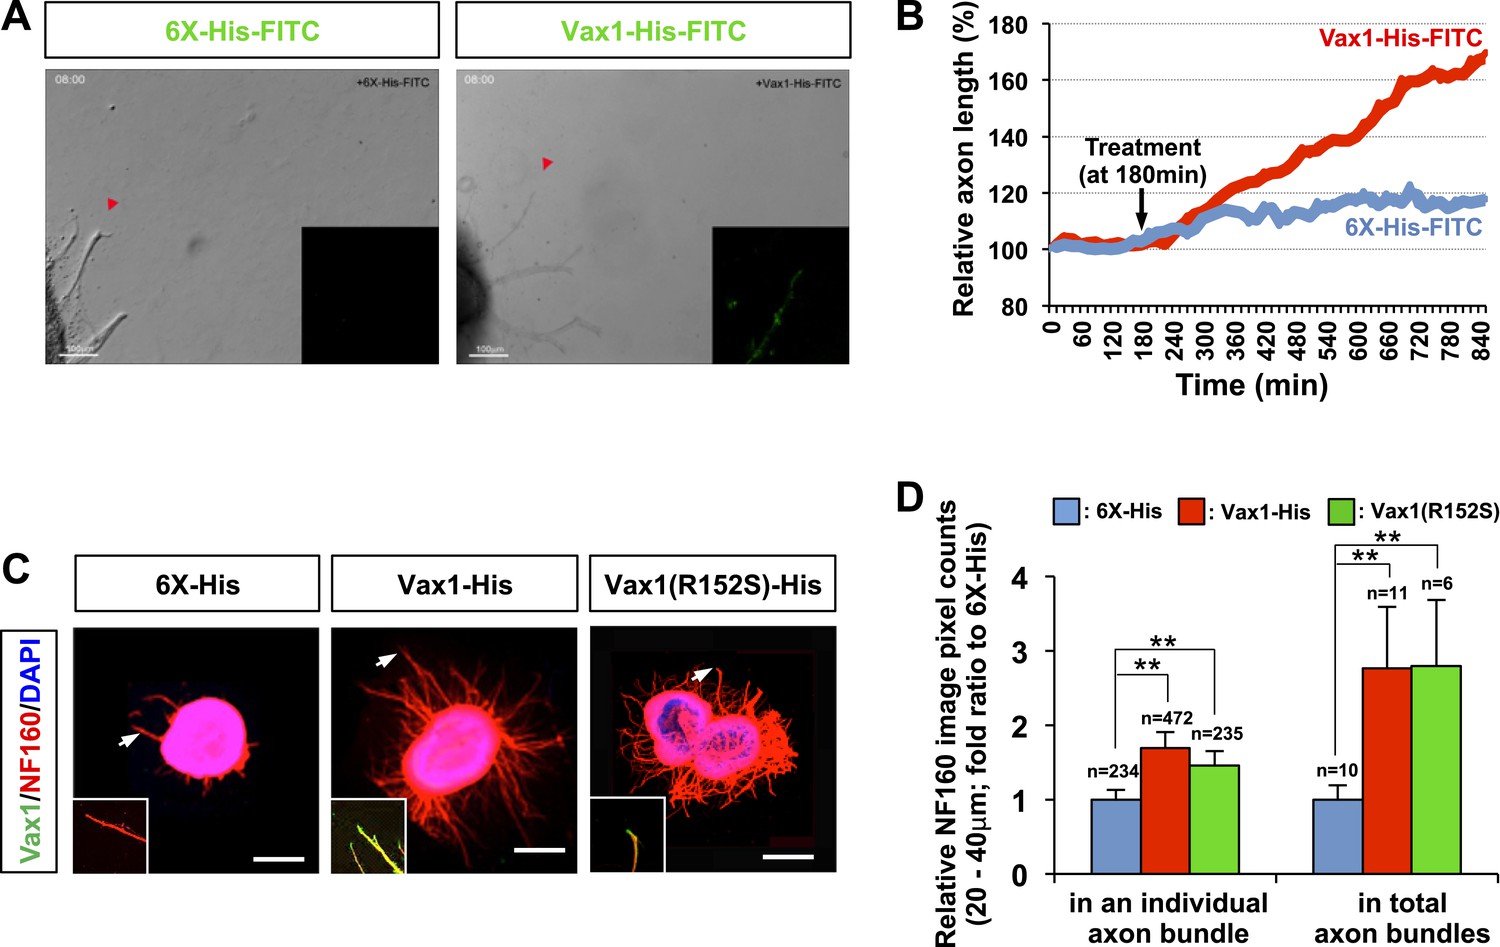
Vax1 protein is a retinal axon growth factor.
(A) E13.5 mouse retinal explants were cultured for 24 hr and then treated with 6X-His-FITC peptide (100 ng/ml) or recombinant Vax1-His-FITC protein (500 ng/ml) for an additional 24 hr. Images of RGC axons were taken every 15 min for 16 hr before immunostaining with anti-Vax1 and anti-His antibodies (Videos 1 and 2; Figure 3—figure supplement 1). The accumulation of 6X-His-FITC and Vax1-His-FITC in growing RGC axons was also visualized by detecting FITC fluorescence signals (inset images). Red arrowheads indicate the area magnified in each inset. (B) The changes in RGC axonal length during the recording were plotted after adjusting the initial length to 100%. (C) Retinal explants treated with 6X-His (25 ng/ml), Vax1-His (100 ng/ml), or Vax1(R152S)-His (100 ng/ml) for 24 hr were stained with rabbit anti-Vax1 (green) and mouse anti-NF160 (red) antibodies to visualize Vax1 protein in RGC axons. Arrowheads indicate the area magnified in each inset. Scale bars: 500 μm. (D) Relative numbers of axon bundles projecting from retinal explants were indirectly measured by counting the pixels containing NF160 immunofluorescence in RGC axons between 20 and 40 μm from the rim of the explants (total axon bundle). The relative thickness of individual axon bundles was also measured by comparing the total pixel counts of NF160 in the 20–40-μm area (individual axon bundle). The values in the graph are averages expressed relative to those of 6X-His peptide-treated samples, presented as 1; error bars denote SDs (**p < 0.001; ANOVA). The scores on top of the graph columns are the number of axons (individual axon bundle) and the number of explants (total axon bundle) analyzed, respectively. Results were obtained from three independent experiments. The number of explants analyzed: for 6X-His, n = 10; Vax1-His, n = 11; Vax1(R152S)-His, n = 6. (already shown in total axon bundle).
Figure 3—figure supplement 1
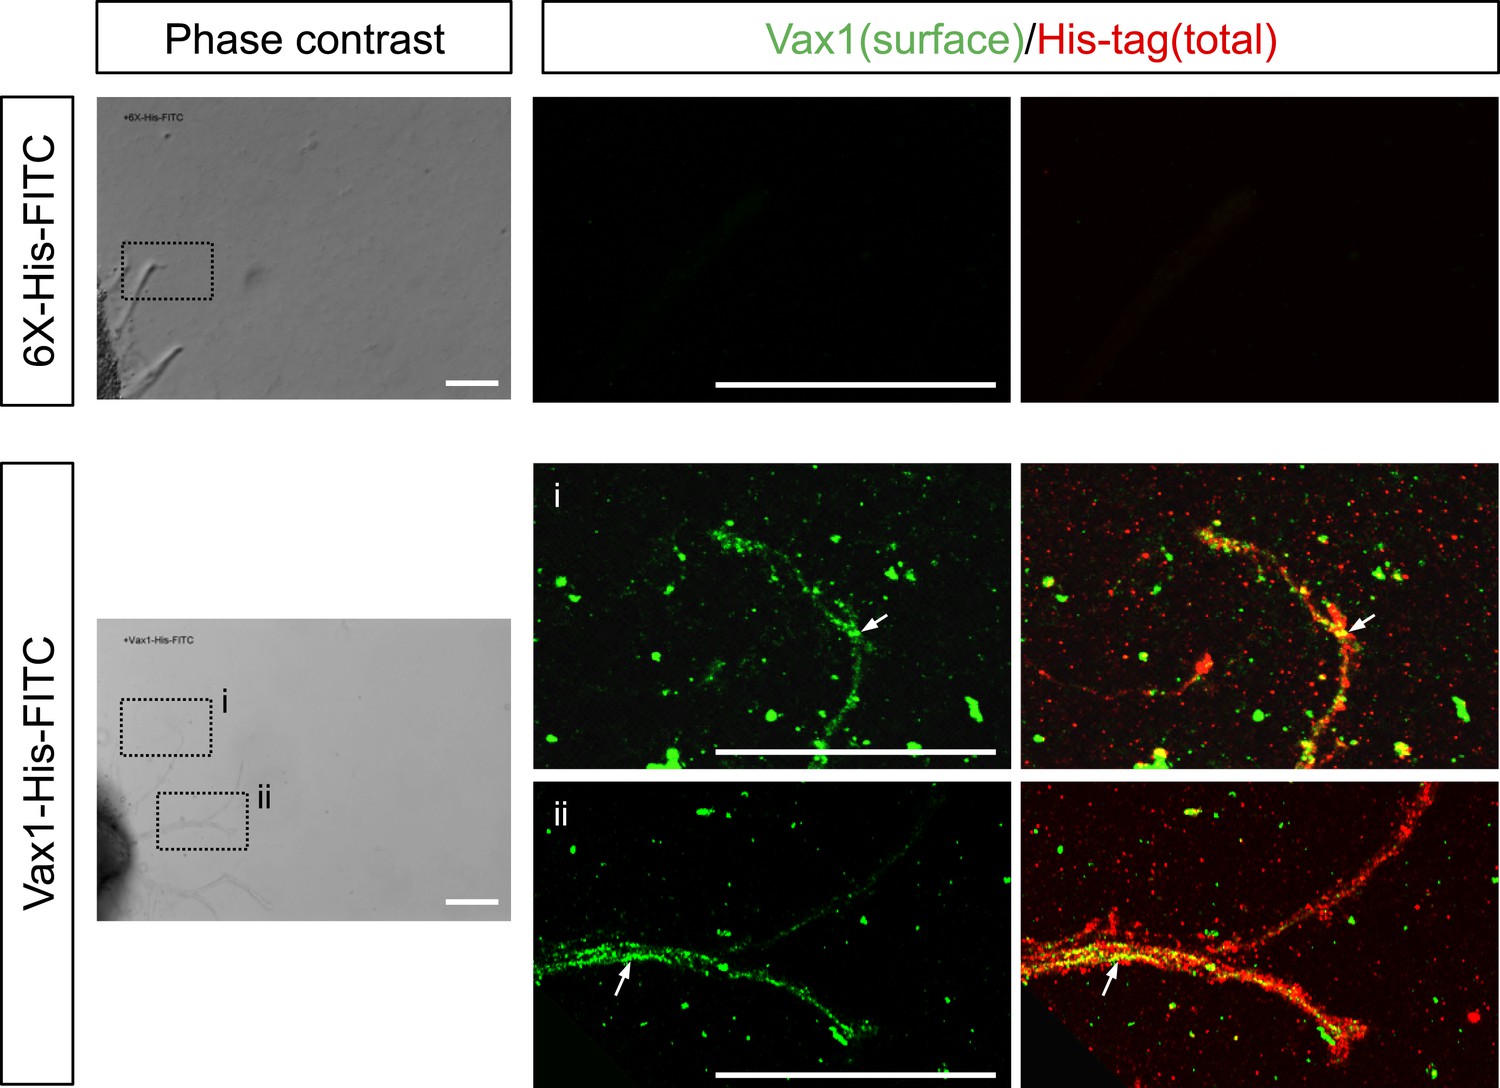
Penetration of exogenous Vax1 protein into RGC axons.
Retinal explants isolated from E13.5 mouse embryos were cultured for 24 hr before recording phase contrast and fluorescence images every 15 min on a Zeiss Axio Observer Z1 inverted microscope. After 180 min of recording, 6X-His-FITC peptide (100 ng/ml) or Vax1-His-FITC protein (500 ng/ml) was added to the growth medium. The images were then combined into video clips, provided in Videos 1 and 2. After recording for 16 hr, the explants were washed with PBS, and Vax1 protein present at the surface of axons was detected by incubating with rabbit α-Vax1 (green) in growth medium for 20 min. The explants were then washed three times with PBS and fixed in 4% PFS/PBS for 1 hr prior to the detection of 6X-His peptide or Vax1-His protein inside and on the surface of axons using mouse anti-His antibody (red). The explants were then further incubated with Alexa 488-labeled α-rabbit IgG and Cy3-labeled α-mouse IgG, and the distribution of Vax1 on the surface and within the intracellular space of RGC axons was analyzed by confocal microscopy. Phase contrast images in the left column show representative snapshot images from Videos 1 and 2. Immunostained images in the right columns correspond to dotted boxes in the phase contrast images in the left column. Arrows indicate Vax1-His proteins internalized to RGC axons. Scale bars: 100 μm.
Figure 3—figure supplement 2
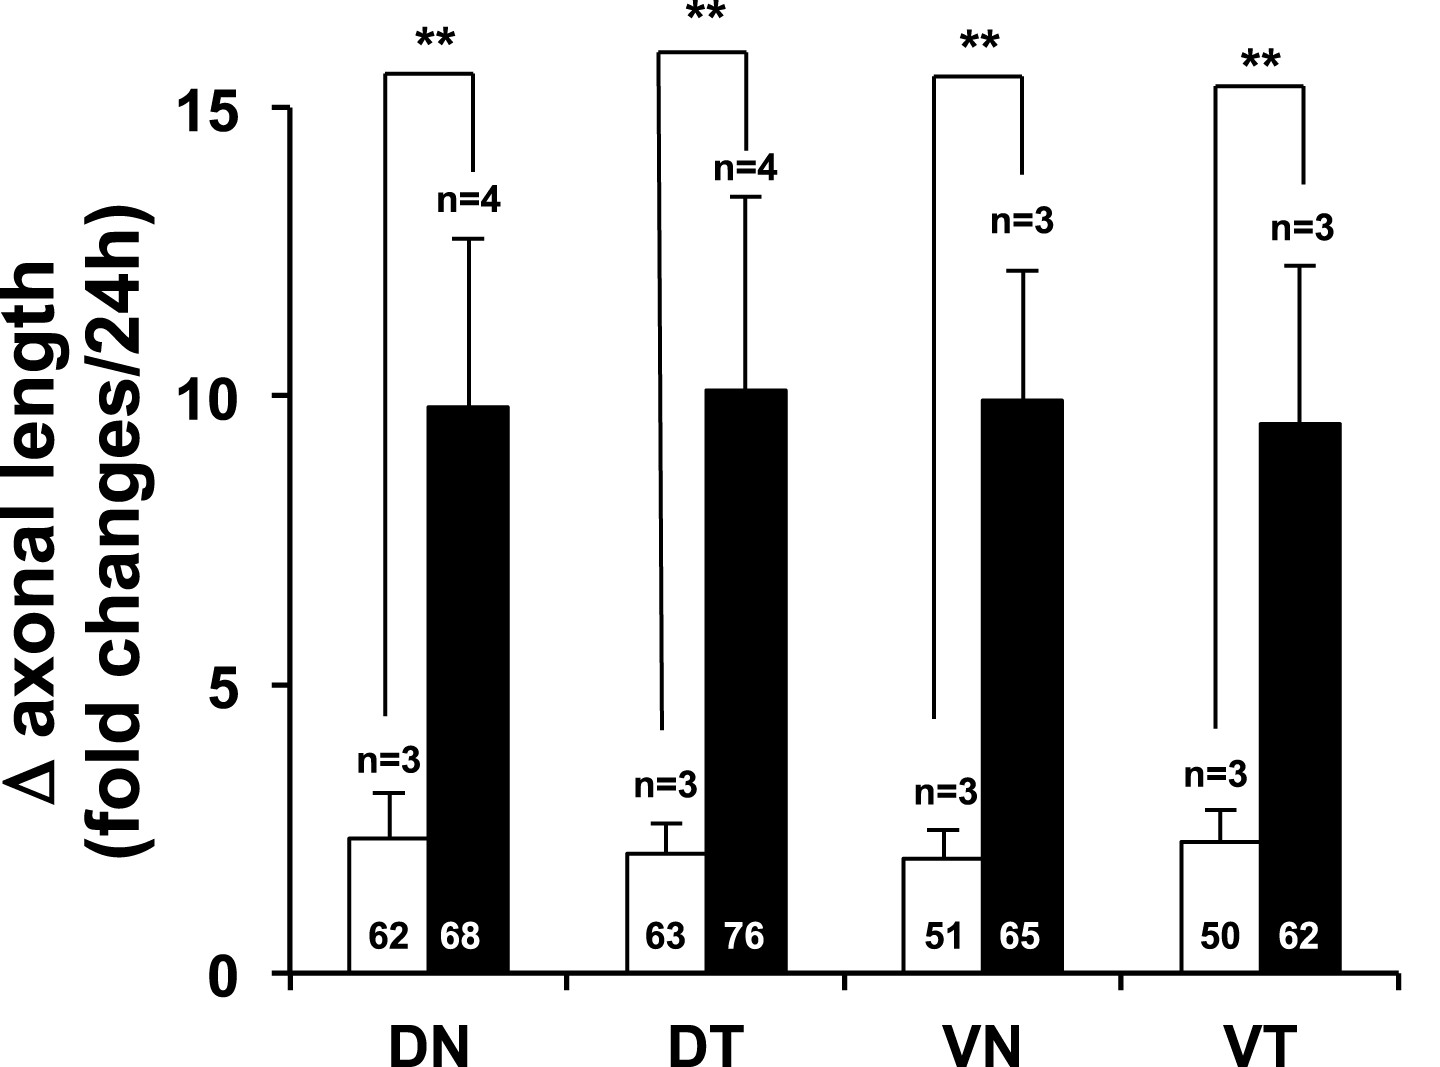
Region non-selective stimulation of retinal axonal growth by recombinant Vax1.
Dark field images of retinal quadrant explants were taken before (0 hr) and after (24 hr) treating them with 6X-His peptide (25 ng/ml; white column) or Vax1-His protein (100 ng/ml; black column). The changes in axonal length during the 24-hr incubation period were shown in a graph. The values in the graph are averages and error bars denote SDs. The scores in the graph columns are the numbers of axons analyzed. Numbers of explants analyzed are shown on the top of the columns. p-values were determined by Student t-test (**p < 0.001). The results were obtained from two independent experiments.
Figure 3—figure supplement 3
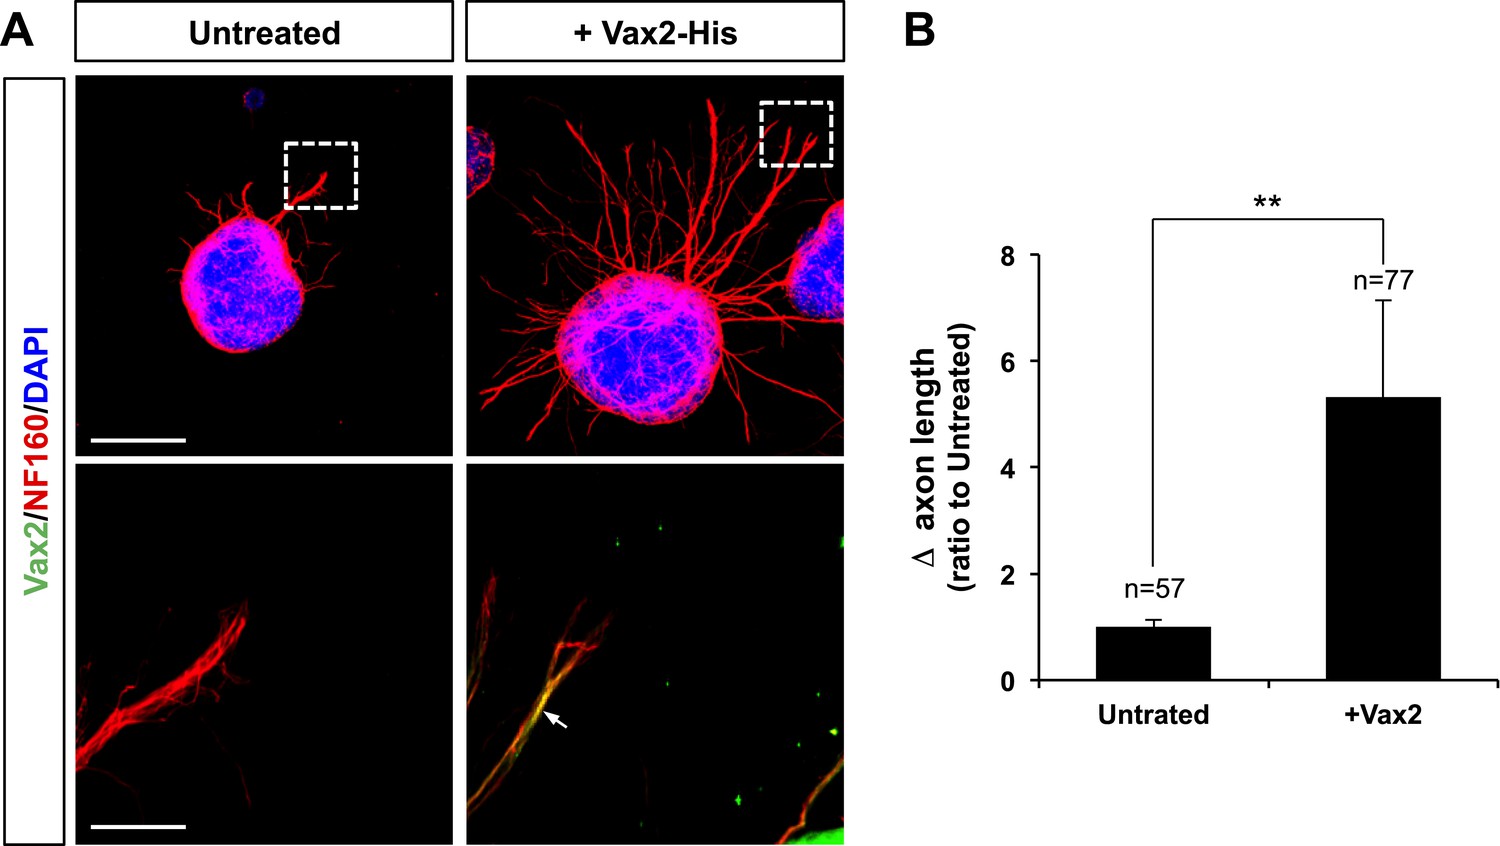
Recombinant Vax2 is capable for inducing RGC axon growth in vitro.
(A) E13.5 WT retinal explants were incubated in the presence and absence of Vax2-His (100 ng/ml) for 24 hr. The explants were then fixed for immunostaining with rabbit anti-Vax2 antibody (green) and mouse anti-NF160 antibody (red). DAPI (blue), nuclear counter staining. Immunostaining images in the bottom panel are magnified versions of dotted boxed area in the top panel. Arrow indicates Vax2-His proteins internalized to RGC axons. Scale bars are 500 μm (top) and 100 μm (bottom), respectively. (B) Dark field images of the explants were taken before (0 hr) and after (24 hr) incubation period. The changes in axonal length during the 24-hr incubation period were measured and compared with untreated control samples. The values in the graph are averages and error bars denote SDs. The scores on top of the graph columns are the number of axons analyzed. The number of explants analyzed are: 6X-His, n = 5; Vax1, n = 4. p-values were determined by Student t test (**p < 0.001).
Figure 4 with 2 supplements

Mouse RGC axons import Vax1 protein.
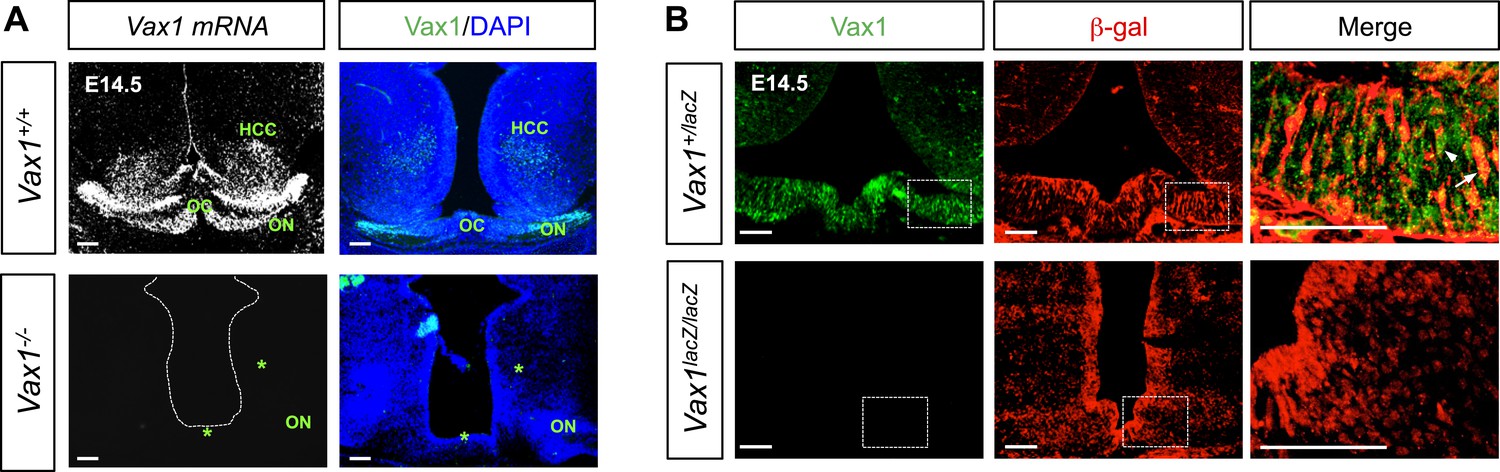
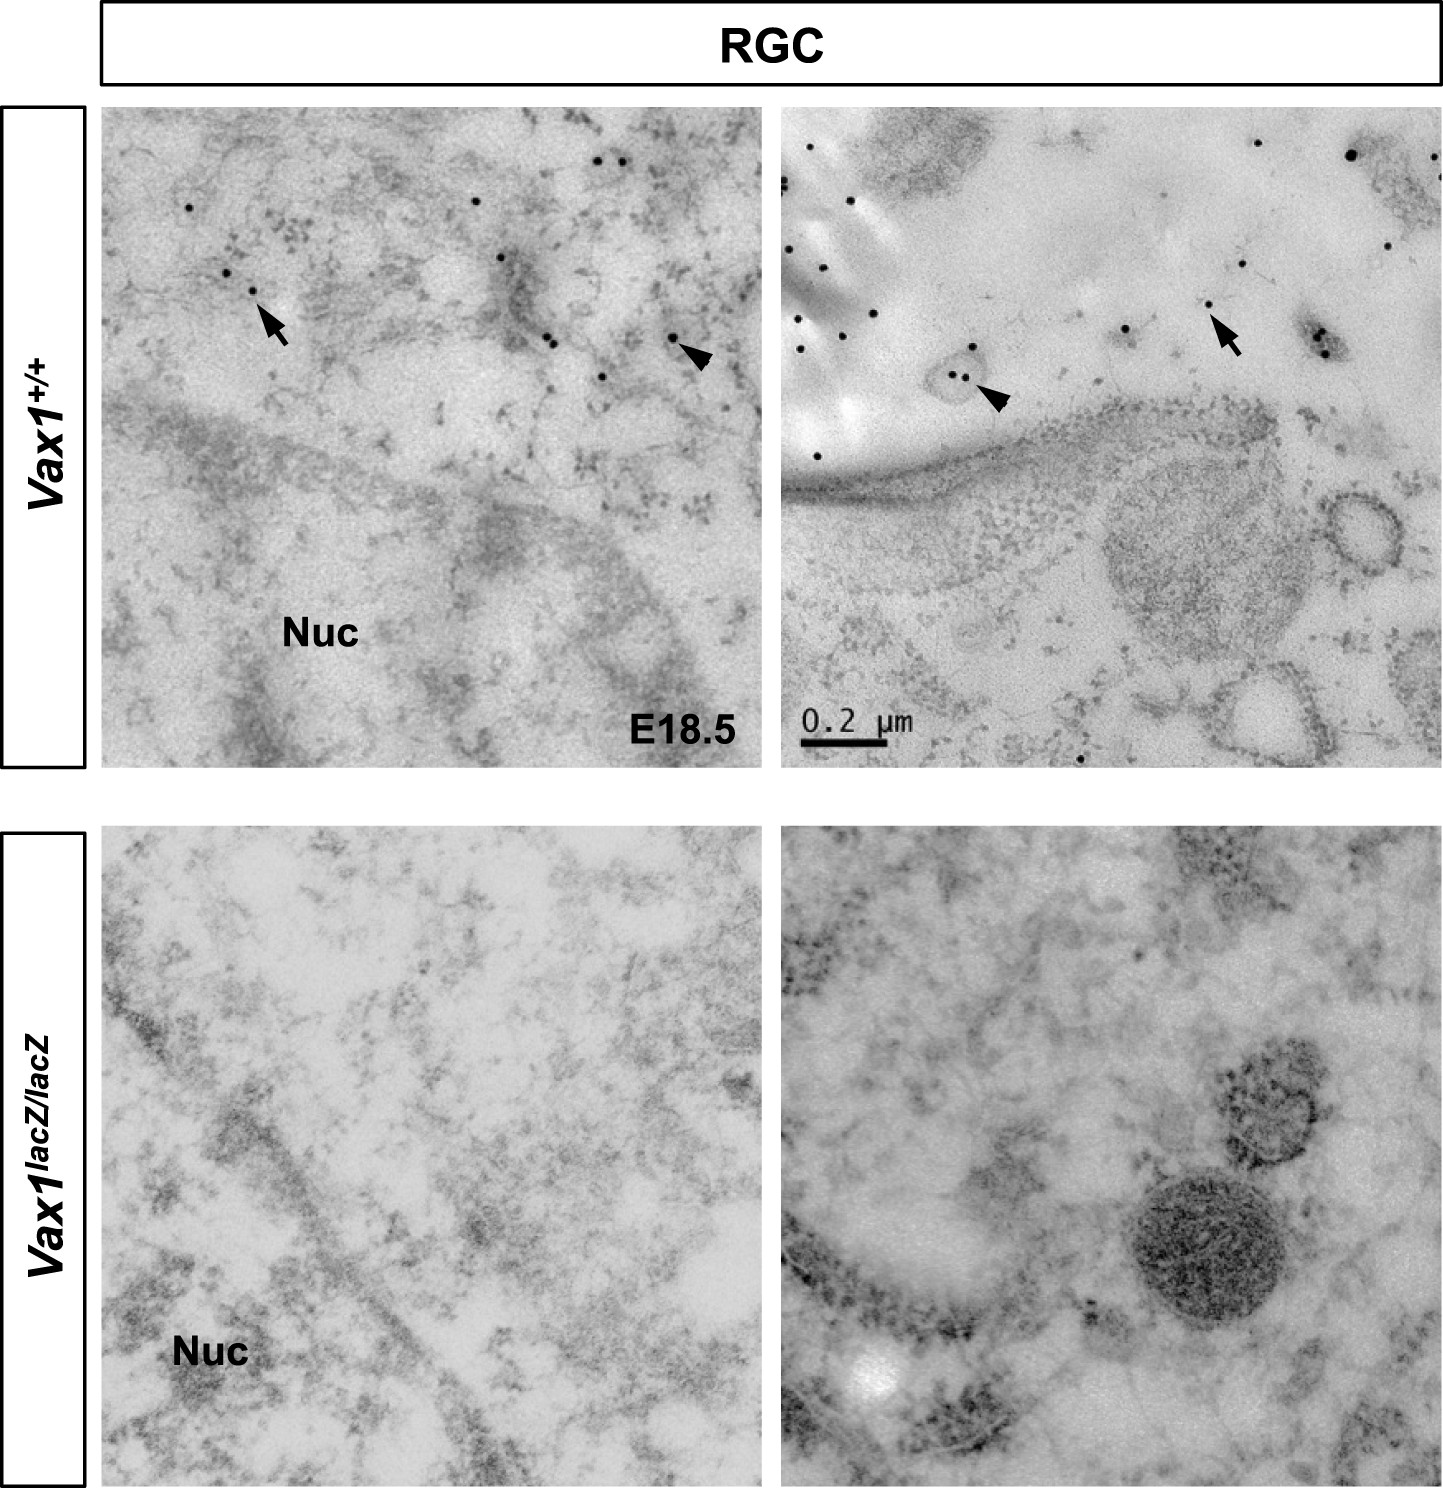
(A) Vax1 mRNA expression in E14.5 WT (Vax1+/+) mouse retinas was examined by in situ RNA hybridization using a [33P]-CTP-labeled antisense Vax1 probe, as described elsewhere (Mui et al., 2005). Vax1 transcripts were detected in the OS and OD, but not in the neural retina (NR). This in situ hybridization signal was absent in Vax1lacZ/lacZ homozygous knock-in mouse eyes (bottom). (B) The distribution of Vax1 protein in the NR (i and iii) and OS (ii and iv) of E14.5 Vax1lacZ/+ and Vax1lacZ/lacZ embryos was compared with that of β-gal expressed from the lacZ gene at the Vax1 locus by co-staining with rabbit anti-Vax1 (green) and mouse anti-β-gal (red) antibodies. Vax1 protein detected in Vax1lacZ/+ mouse retinal cells, where β-gal signals were absent, is presumed to originate from external sources that co-express Vax1 and β-gal. Red dots in (iii) are non-specific background β-gal immunostaining. (C) Distribution of Vax1 in RGC axons and cell bodies was examined by co-immunostaining for Vax1 (green) and the RGC axonal marker NF160 (red). Nuclei were counterstained with DAPI (blue). Arrowheads in (ii) indicate Vax1 protein that co-localizes with NF160, whereas arrows point to Vax1 in APC nuclei. Vax1 immunostaining signals were completely absent in the OS and NR of Vax1lacZ/lacZ mice, whereas NF160 immunostaining was still detectable in defasciculated RGC axons (iii and iv). (D) Sections of E18.5 WT and Vax1lacZ/lacZ mouse retinas (top) and optic nerves (ON; bottom) were immunostained with rabbit anti-Vax1 antibody and gold (25 nm)-labeled anti-rabbit IgG. Subcellular localization of Vax1 proteins was then examined by electron microscopy. Arrowheads in RGC images point to Vax1 proteins in the intracellular vesicle, whereas arrows in the images indicate Vax1 proteins bound to the extracellular surface of the RGC plasma membrane (top). Arrowheads in APC images indicate Vax1 proteins in trafficking vesicles, whereas arrows mark Vax1 proteins associated with chromatin in the nucleus (bottom). Scale bars in (A) to (C): 200 μm (left column) and 20 μm (right two columns). Scale bars in (D): 0.5 μm (left column) and 0.2 μm (right two columns).
Figure 4—figure supplement 1
Expression of Vax1 mRNA and protein in the vHT area.
(A) Vax1 mRNA was detected in the HT, hypothalamic cell cord (HCC), and optic nerve (ON) approaching the OC of E14.5 WT (Vax1+/+) embryonic brains (top left). Vax1 proteins, assessed by immunostaining with an anti-Vax1 antibody, were also detectable in these structures (top right). However, Vax1 immunostaining signals as well as Vax1 mRNA were absent in these structures in the brains of Vax1−/− littermates (bottom). (B) Vax1 localization in E14.5 Vax1lacZ/+ mouse vHT cells, which also express β-gal from one Vax1 locus, was examined by co-immunostaining for Vax1 and β-gal. All cells that expressed β-gal also expressed Vax1 (arrowhead), but some Vax1-positive cells lacked β-gal (arrow). Vax1 was not detected in the brains of Vax1lacZ/lacZ homozygous knock-in mice, which express β-gal from both Vax1 loci, confirming the specificity of Vax1 immunostaining. Scale bars: 50 μm.
Figure 4—figure supplement 2
Cytoplasmic localization of Vax1 in RGCs.
Sections of E18.5 WT (top) or Vax1lacZ/lacZ mouse retinas (bottom) were immunostained with rabbit α-Vax1 and gold (25 nm)-labeled anti-rabbit IgG and analyzed by electron microscopy, as described in Figure 4D. Arrowheads indicate Vax1 proteins in trafficking vesicles, whereas arrows mark soluble Vax1 in the cytoplasm (top).
Figure 5
Secreted Vax1 protein is necessary for RGC axon growth.
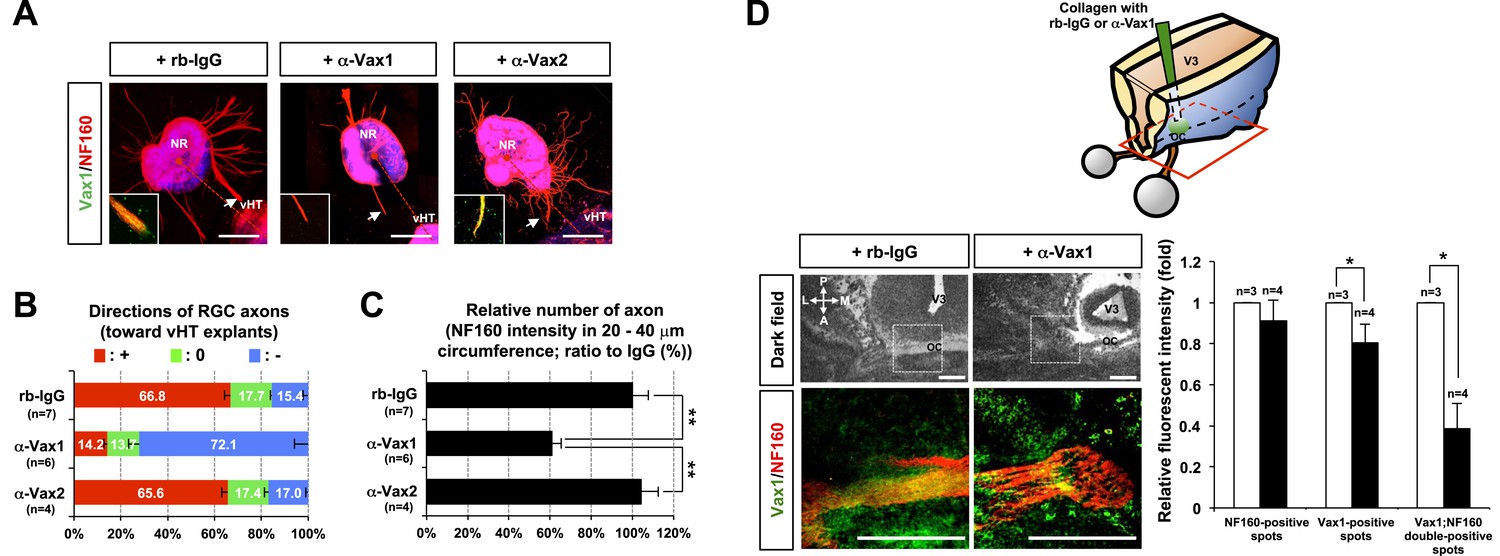
(A) vHTs and retinas isolated from E13.5 mouse embryos were co-cultured for 48 hr in the presence of pre-immune rabbit IgG (rb-IgG; 1 μg/ml), anti-Vax1 (α-Vax1; 1 μg/ml), or anti-Vax2 (α-Vax2; 1 μg/ml) antibodies. Vax1 localization in RGC axons was then determined by staining explants with rabbit α-Vax1 (green) and mouse α-NF160 (red). Arrowheads indicate the area magnified in each inset. Scale bars: 500 μm. (B) The distribution of RGC axons in each angle segment was determined as described in ‘Materials and methods’. The values in the bar are averages, and error bars denote SDs. p-values are between 0.01 and 0.005 (ANOVA). (C) Total image pixel counts of NF160 immunofluorescence in a 20–40-μm area were compared to obtain the relative number of axons projected from each explant. Scores under y-axis labels of (B) and (C) are the numbers of explants analyzed in three independent experiments (**p < 0.001; ANOVA). (D) Slabs of mouse heads including eyes, forebrain, and midbrain structures were prepared from E13.5 WT mouse embryos. The third brain ventricles of mouse-head slabs were then implanted with collagen gels containing rb-IgG (1 μg/ml) or α-Vax1 (1 μg/ml) and subsequently incubated at 37°C in a CO2 incubator for 12 hr (top row; see ‘Materials and methods’ for details). The slabs were then fixed and frozen to obtain horizontal sections (18 μm thick). The slides containing optic nerves (ON) were then further co-stained with α-Vax1 (green) and α-NF160 (red) and analyzed using an Olympus FV1000 confocal microscope. Images in the bottom row are magnifications of dotted boxes in the top row. Scale bars: 200 μm. Relative fluorescence intensities of Vax1- and/or NF160-positive immunostaining intensities in the midline area (dotted box) were measured using ImageJ software and presented graphically. White column, rb-IgG; black column, α-Vax1. The values are relative intensities compared with rb-IgG-treated samples; error bars denote SDs and values on the top of graph columns are number of slabs analyzed (*p < 0.01; Student t test). A, anterior; P, posterior; M, medial; L, lateral; *, optic chiasm; V3, third ventricle.
Figure 6
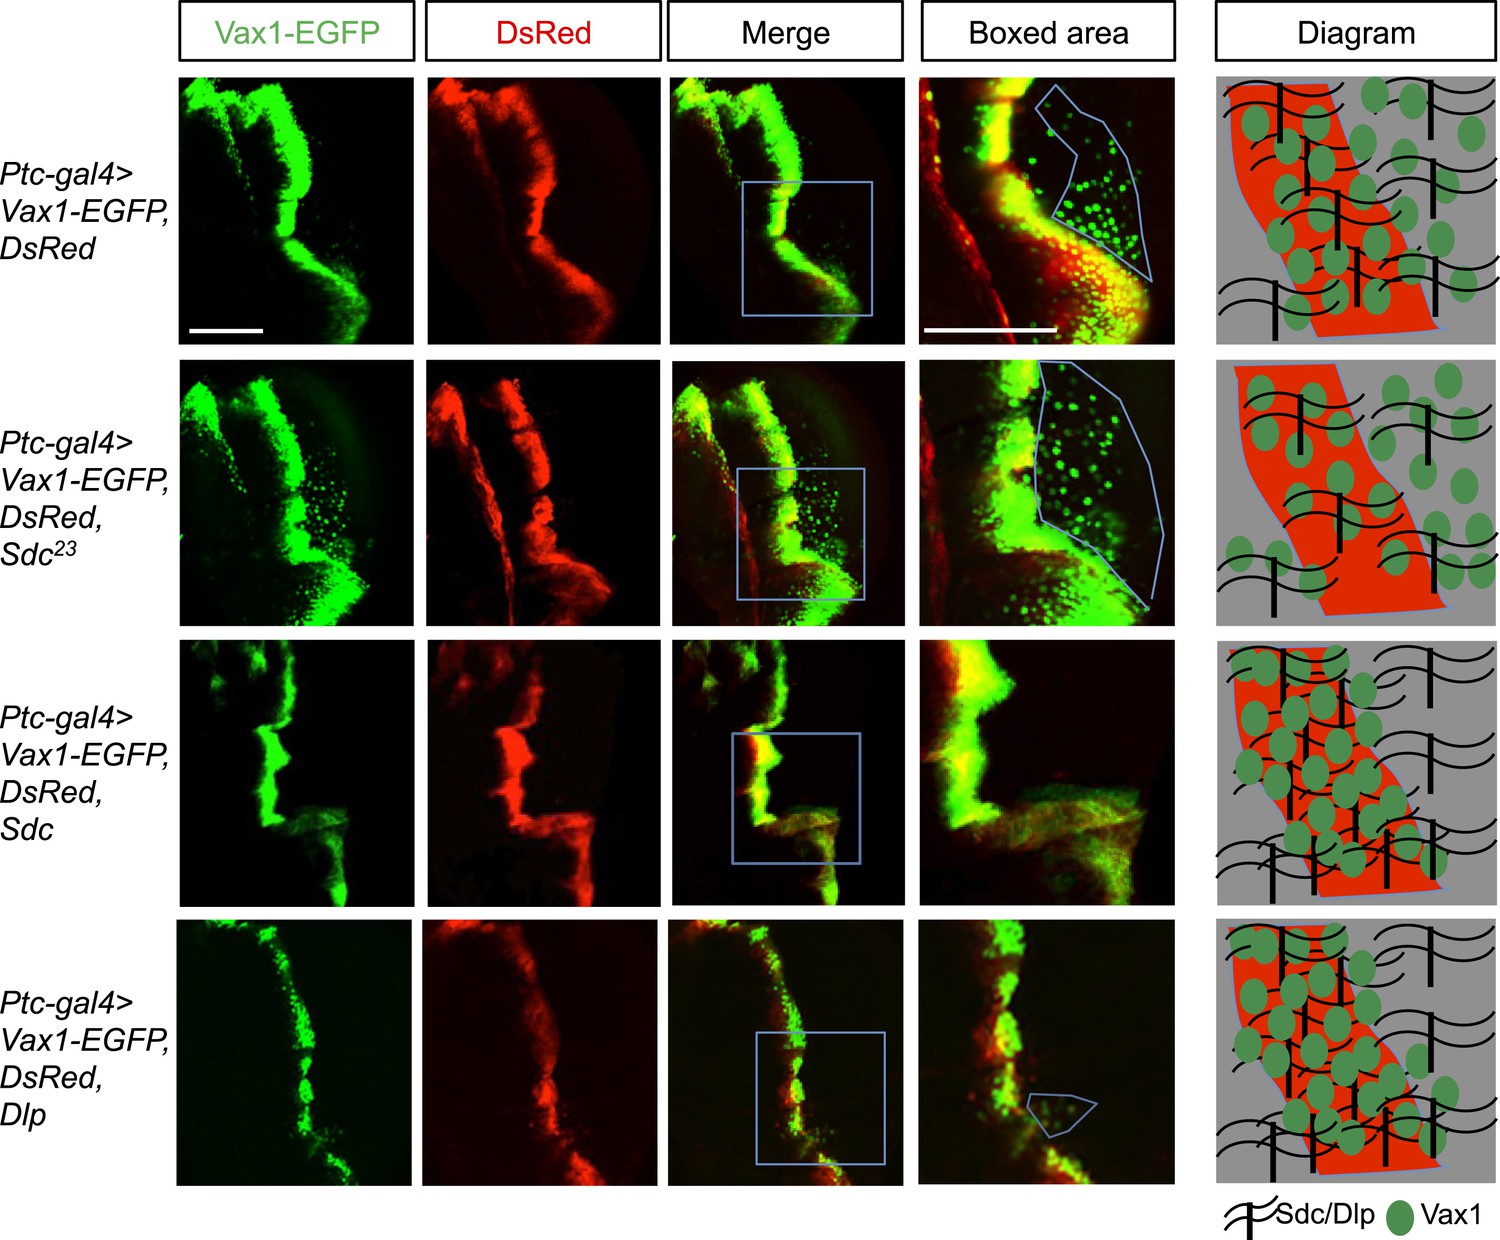
Regulation of intercellular Vax1 transfer by HSPGs in Drosophila wing imaginal discs.
Vax1-EGFP (green) and DsRed (red) were co-expressed under the control of Ptc-Gal4 in the A/P boundary cells of Drosophila wing imaginal discs in wt (top row) and Sdc mutant (Sdc23; second row) flies. The number of cells positive for Vax1-EGFP but negative for DsRed at the posterior part of the wing disc was increased in Sdc23 flies. In contrast, the number of Vax1-EGFP-positive cells in the posterior wing disc was significantly decreased in fly embryos that co-expressed Sdc (third row) or Dlp (bottom row) together with Vax1-EGFP and DsRed. Diagrams in the right column show the distribution of Vax1-EGFP-positive cells (green) and DsRed (red) in the corresponding fly wing discs. Scale bars: 100 μm.
Figure 7 with 2 supplements
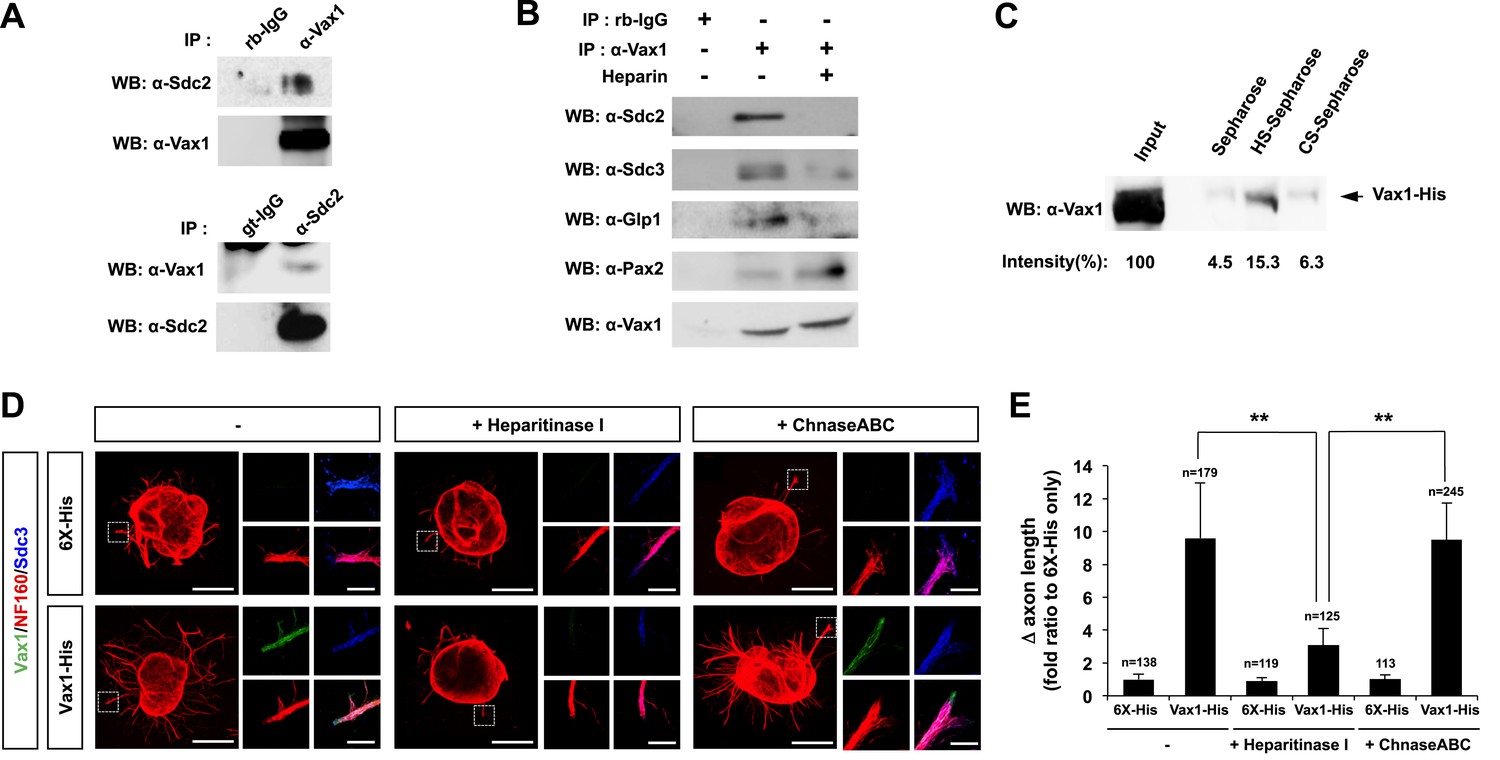
Vax1 binding to HSPGs is necessary for RGC axonal growth.
(A) Interaction between Vax1 and Sdc2 in the E14.5 mouse optic nerve was investigated by immunoprecipitation with a rabbit anti-Vax1 (top) or goat anti-Sdc2 (bottom) antibody and subsequent Western blotting with reciprocal antibodies. The specificity of anti-Vax1 and anti-Sdc2 antibodies was confirmed by immunoprecipitation with pre-immune rabbit IgG (rb-IgG) and goat IgG (gt-IgG), respectively. (B) Immunoprecipitation of Vax1 in the E14.5 mouse OS was also performed in the presence or absence of heparin (1 mg/ml) to determine whether the Vax1 protein bound to HS sugar groups of Sdc2, Sdc3, and/or Glp1 HSPGs expressed in RGC axons. (C) Vax1-His protein (final concentration, 2 μg/ml) was incubated at 4°C for 1 hr with Sepharose 4B resin (Sigma, St. Louis, MO, USA) coated with HS or CS. The resins were washed three times with PBS, and Vax1 protein bound to the resins was eluted in SDS sample buffer for subsequent SDS-PAGE on 10% gels and Western blotting with α-Vax1. Relative intensities of Vax1 bands in Western blot images were analyzed using ImageJ software. (D) Retinal explants were treated with heparinase I (2.5 U/ml) or ChnaseABC (2.5 U/ml) for 3 hr and then incubated with 6X-His peptide (25 ng/ml) or Vax1-His recombinant protein (100 ng/ml) for an additional 24 hr. The presence of Vax1-His in RGC axons was then examined by co-immunostaining with rabbit anti-Vax1 (green), mouse anti-NF160 (red), and goat anti-Sdc3 (blue) antibodies. Dotted boxes indicate the area magnified at right. Scale bars: 500 μm. (E) The graph shows relative distances that RGC axons grew during the 24-hr incubation period. The values in the graph are averages of fold ratios compared with those of 6X-His-treated samples, error bars denote SDs, and the scores on top of graph columns are the number of axons analyzed (*p < 0.01, **p < 0.001; ANOVA). Results were obtained from three independent experiments. Numbers of explants analyzed: 6X-His, n = 6; Vax1, n = 7; heparinase, n = 5; chondroitinase, n = 5; Vax1+heparinase I, n = 6; Vax1+ChnaseABC, n = 6.
Figure 7—figure supplement 1
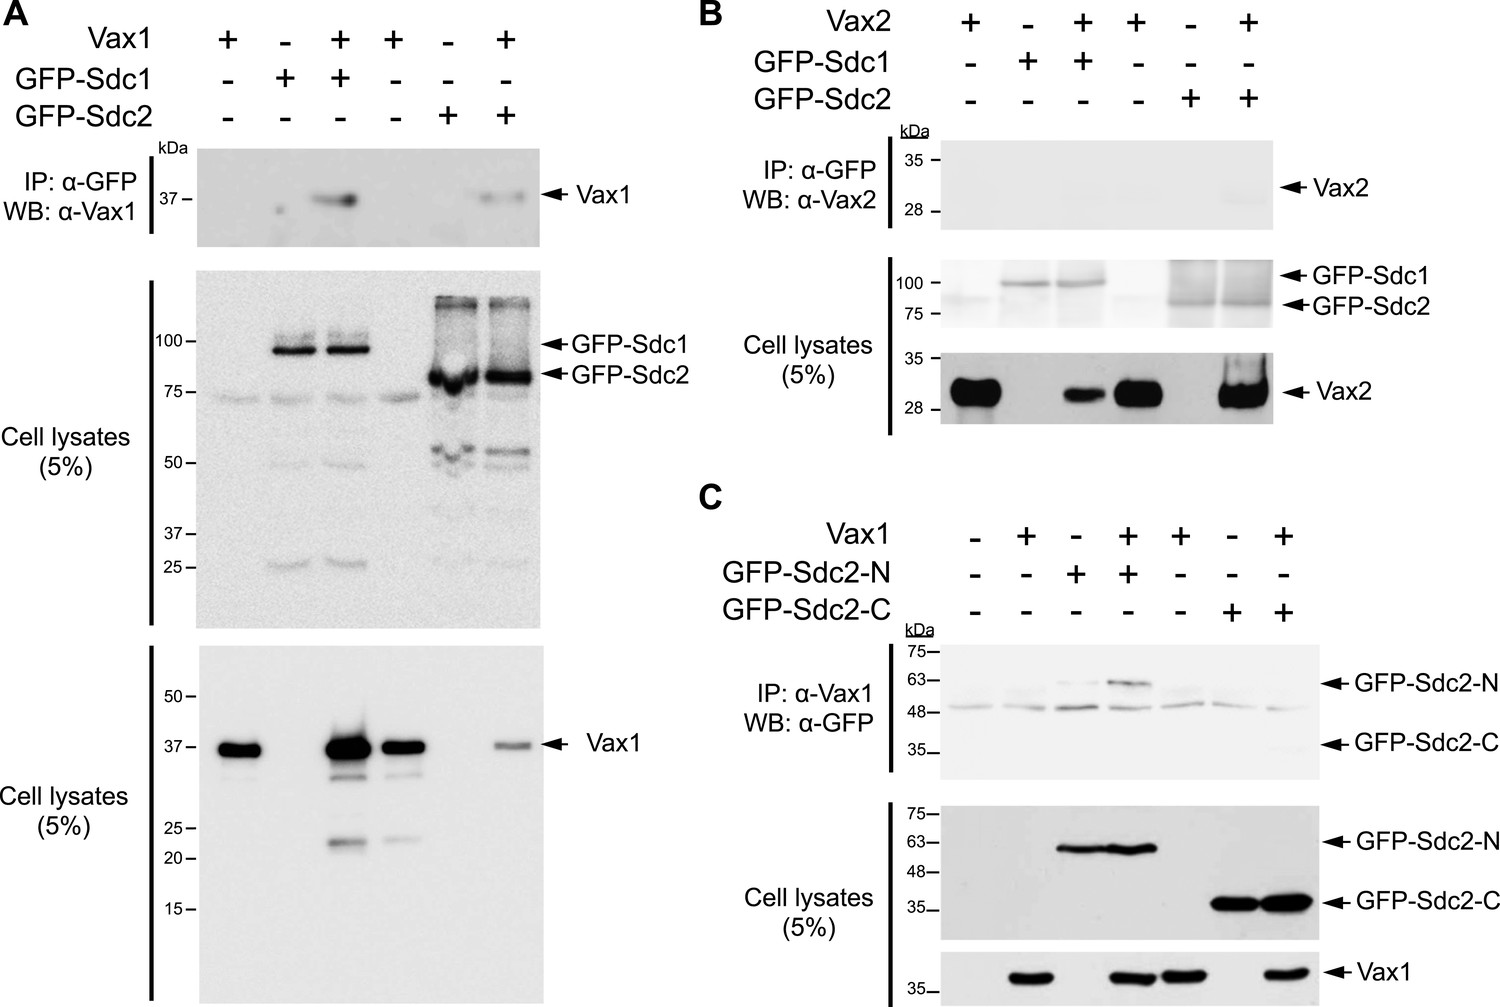
Molecular determination of the interaction between Vax1 and Sdc.
Vax1 (A) or Vax2 (B) was co-expressed with GFP-tagged Sdc1 and Sdc2 in HEK293T cells. GFP-fused Sdc1 and Sdc2 protein complexes were isolated by immunoprecipitation (IP), and Vax1 and Vax2 proteins in GFP-Sdc1 and GFP-Sdc2 immune complexes were detected by Western blotting using α-Vax1 (A) or α-Vax2 (B). (C) The Vax1-interacting domains of Sdc2 were examined by co-expressing Vax1 with Sdc2-N, which lacks the cytoplasmic domain, or with Sdc2-C, which lacks the extracellular domain. GFP-Sdc-N or GFP-Sdc-C protein that co-immunoprecipitated with Vax1 was detected by Western blotting with α-GFP. Relative levels of Vax1, Vax2, and GFP-Sdc2 proteins in cell lysates (CL) used for IP were also examined by Western blotting (bottom two panels in A–C).
Figure 7—figure supplement 2
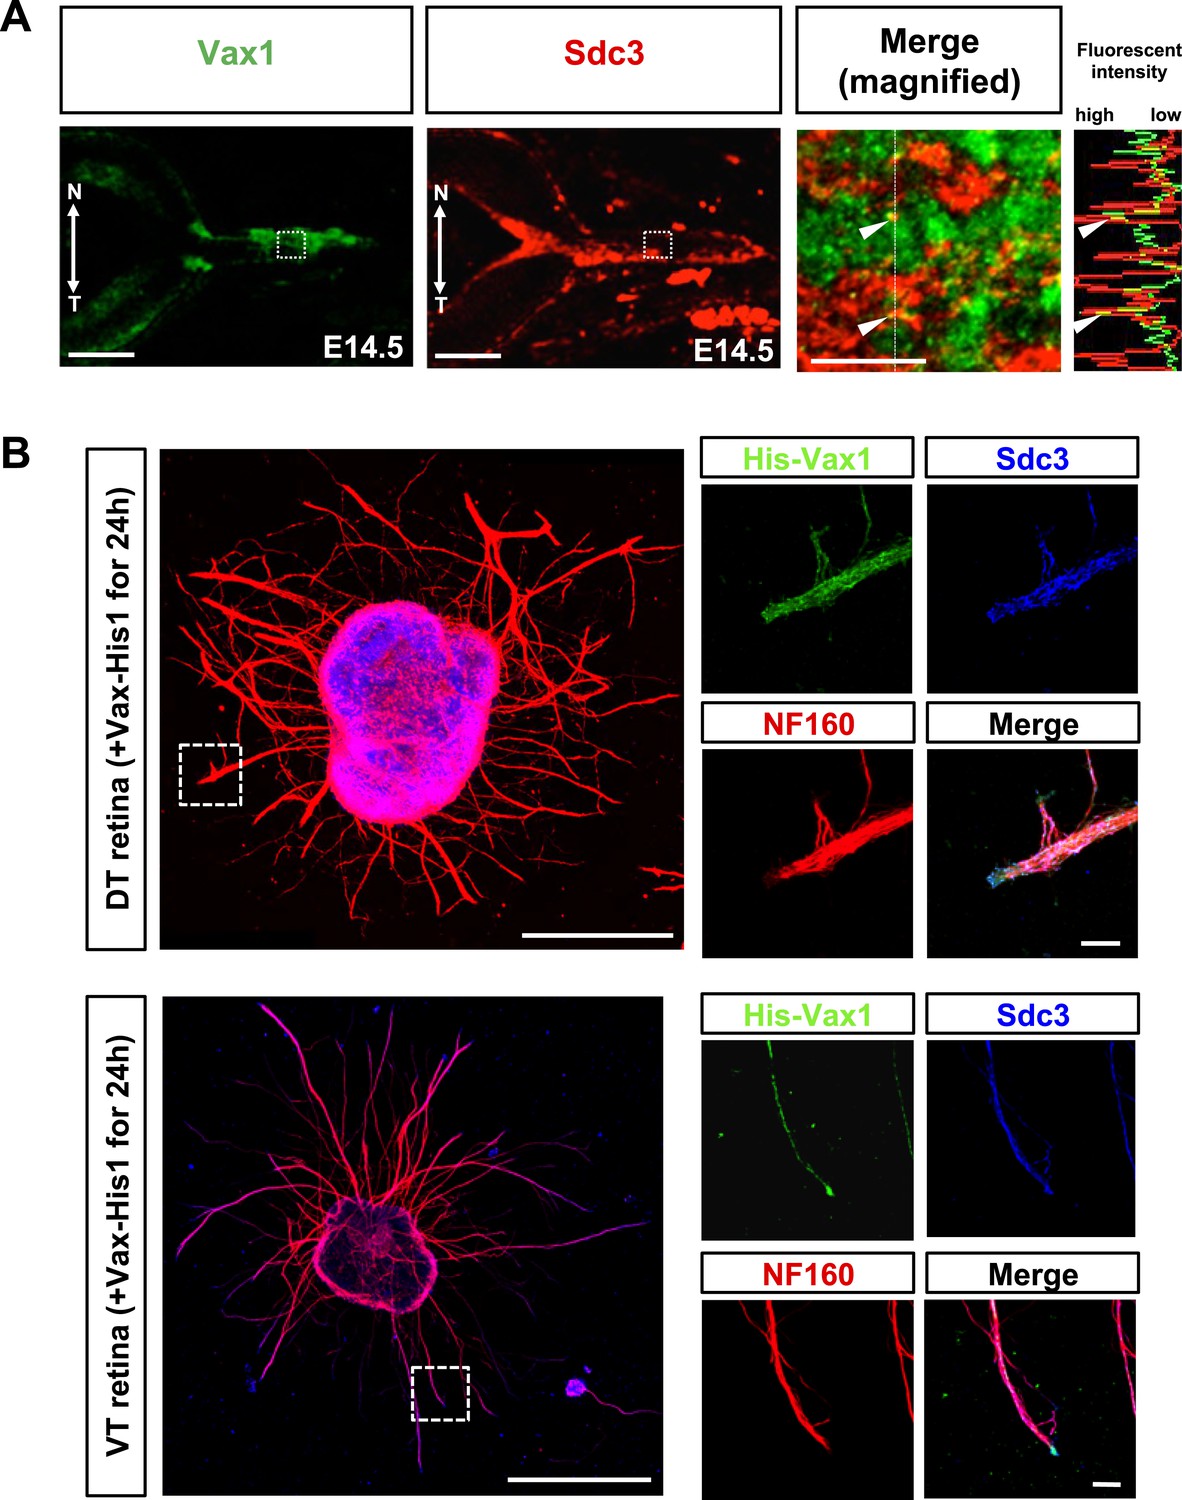
Co-localization of Vax1 and Sdc3 in RGC axons.
(A) Distribution of Vax1 and Sdc3 in E14.5 mouse embryonic eyes was examined by co-immunostaining with rabbit anti-Vax1 (green) and goat anti-Sdc3 (red) antibodies. Image in the third is a merged magnification of area marked by dotted boxes in the left two images. Plots in the right column indicate fluorescence intensities of areas marked by dotted lines in the third. Arrowheads on plots indicate fluorescence intensities of the corresponding points in the images. N, nasal; T, temporal. Scale bars: 200 μm (left two panel) and 20 μm (third panel). (B) Retinal explants isolated from dorsal-temporal (DT) and ventral-temporal (VT) parts of E13.5 mouse retinas were treated with Vax1-His protein (100 ng/ml) for 24 hr. The explants were then fixed for immunostaining with rabbit anti-Vax1 (green), mouse anti-NF160 (red), and goat anti-Sdc3 (blue) antibodies. The localization of Vax1 and Sdc3 in NF160-positive RGC axons was examined by confocal microscopy (see details in ‘Materials and methods’). Scale bars: 500 μm (left column) and 50 μm (magnified images at right).
Figure 8 with 1 supplement
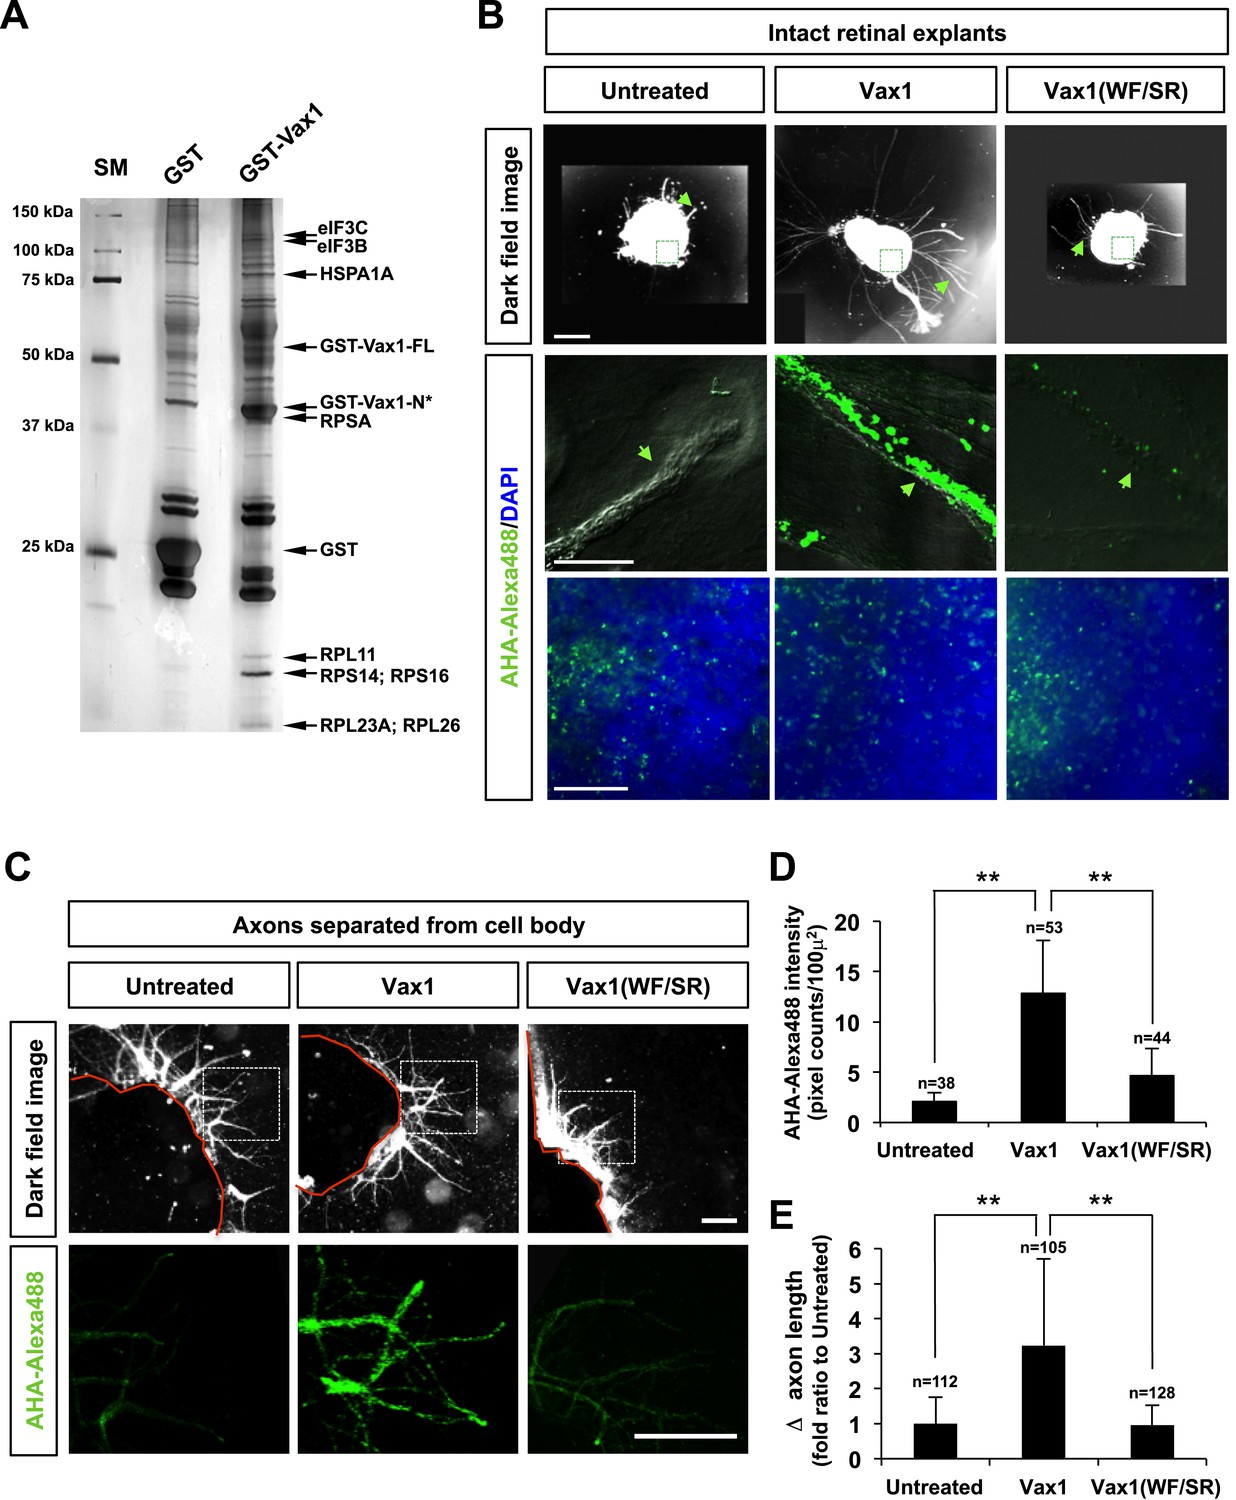
Imported Vax1 induces RGC axonal growth by stimulating local protein synthesis.
(A) GST and GST-Vax1 protein complexes were affinity purified from cytoplasmic fractions of HEK293T cells overexpressing GST and GST-Vax1, respectively (see ‘Materials and methods’ for details). Complexes were then analyzed by SDS-PAGE on 10% gels and subsequent silver staining to detect proteins specifically enriched in GST-Vax1 complexes. The identities of protein bands, shown to the right of the gel photograph, were determined by MALDI-TOF mass spectrometry. Vax1-FL, full-length Vax1; Vax1-N*, Vax1 N-terminal fragment. (B) E13.5 mouse retinal explants were cultured for 24 hr before changing to medium containing Vax1-His (100 ng/ml) or Vax1(WF/SR)-His (100 ng/ml) for an additional 16 hr-incubation. The explants were further incubated for 6 hr after addition of the bioorthogonal noncanonical amino acid AHA (L-azidohomoalanine). Newly synthesized proteins incorporating these noncanonical amino acids were labeled with Alexa Fluor 488-alkyne by click chemistry (Dieterich et al., 2007), and the rates of protein synthesis in RGC axons (middle row) and explant cell body (bottom) were assessed by measuring the fluorescence intensities of AHA-Alexa Fluor 488-labeled proteins (see ‘Materials and methods’ for details). Scale bars: 500 μm (top) and 100 μm (bottom). (C) The influence of nuclear events in Vax1-induced RGC axon growth was excluded by isolating axons from the cell body before treatment with Vax1 proteins (100 ng/ml) for 6 hr. Arrowheads indicate the area magnified in each inset. Scale bars: 500 μm. (D) Relative AHA-Alexa488 fluorescence intensities in cell body-free axons were measured using ImageJ software and are shown graphically. Error bars denote SDs. (E) Relative distances that RGC axons grew during this 6-hr incubation period are presented graphically. The values in the graph are averages of fold ratios compared with those of untreated samples. Scores on top of the graph columns in (D) and (E) are number of axons analyzed (**p < 0.001; ANOVA). Results were obtained from two independent experiments. Numbers of explants analyzed: untreated, n = 4; Vax1, n = 5; Vax1(WF/SR), n = 4.
Figure 8—figure supplement 1
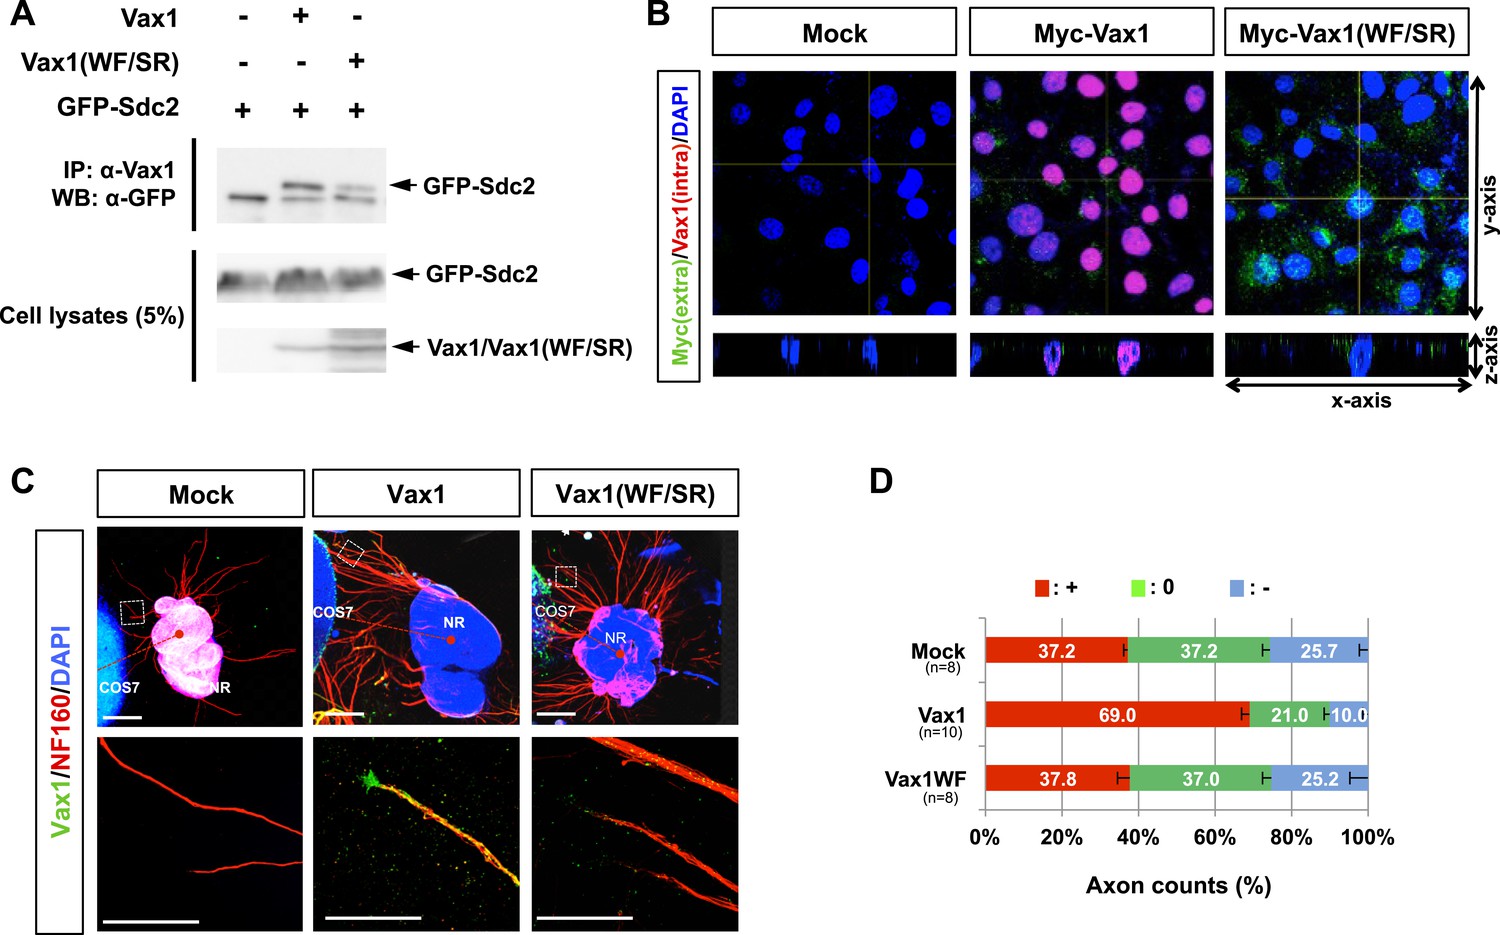
Biophysical properties of Vax1(WF/SR) mutant protein.
(A) Trp and Phe (WF) at amino acid residues 147 and 148 of mouse Vax1, which are homologous to the critical residues of the cell-penetrating region of the Antp (antennapedia) homeodomain (Joliot et al., 1998), were mutated to Ser–Arg (SR) in Vax1(WF/SR). Vax1 and Vax1(WF/SR) interactions with GFP-Sdc2 were assessed by immunoprecipitating cell lysates with α-Vax1 and subsequent Western blotting with α-GFP. Successful expression of Vax1 and GFP-Sdc2 was also assessed by Western blotting of cell lysates. (B) COS7 cells were incubated for 3 hr with growth medium (S3 fraction) from HEK293T cells overexpressing Vax1-V5 or Vax1(WF/SR)-V5. Vax1 protein at the intact cell surface was detected with rabbit α-Vax1 (green), whereas Vax1 protein inside cells and at the cell surface of fixed cells was labeled with mouse α-V5 (red). After incubating with Alexa 488-conjugated α-mouse IgG and Cy3-conjugated α-rabbit IgG, the distribution of cell surface and intracellular Vax1 was analyzed by confocal microscopy. Scale bars: 20 μm. (C) The importance of cell penetration of Vax1 for RGC axonal growth was investigated by co-culturing mouse retinal explants (NR) with COS7 cells overexpressing WT Vax1 or Vax1(WF/SR) mutant for 48 hr. The explants were then stained with rabbit α-Vax1 (green) and mouse α-NF160 (red). Scale bars: 500 μm (top) and 200 μm (bottom). (D) Relative axon content in each angle segment was analyzed as described in ‘Materials and methods’ and is shown graphically. The values in the graph are averages, and error bars denote standard deviations (SD). Results were obtained from three independent experiments. The scores under y-axis labels are the number of explants analyzed. p-values are between 0.001 and 0.005 (ANOVA).
Figure 9 with 2 supplements
RGC axons re-grow in Vax1-implanted, Vax1−/− mouse brains.
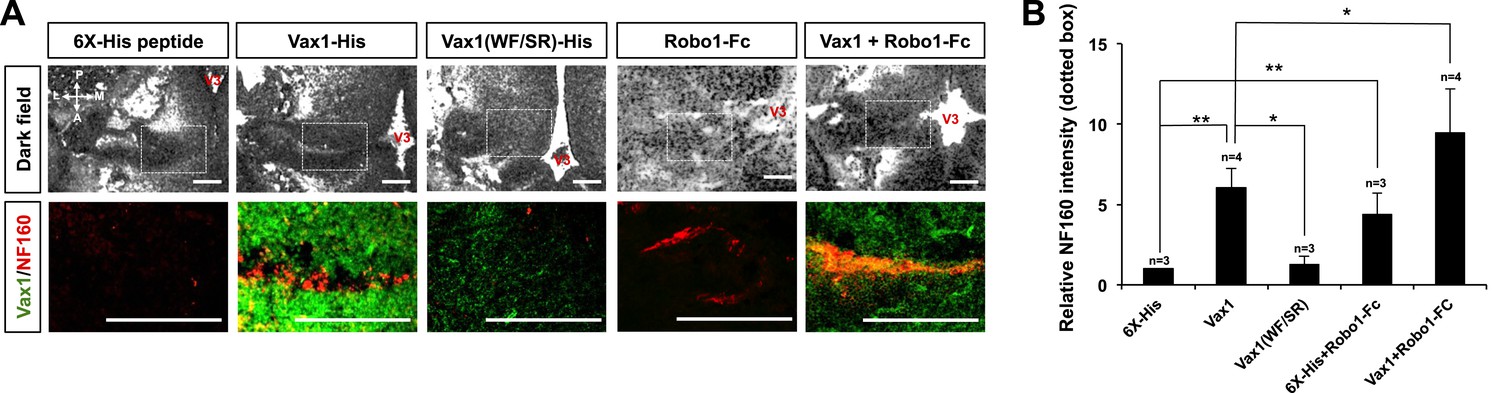
(A) The third ventricles of E13.5 Vax1−/− mouse-head slabs were implanted with collagen gels mixed with 6X-His peptide (4.78 μg/ml; 5.69 nmol), Vax1-His (200 μg/ml; 5.69 nmol), or Vax1(WF/SR)-His (200 μg/ml; 5.69 nmol) and incubated for 12 hr (see diagram in Figure 5D and ‘Materials and methods’ for details). Vax1−/− mouse-head slabs were also implanted with collagen gels mixed with Robo1-Fc fragment (1 μg/ml; 12.35 pmol; R&D Systems, Minneapolis, MN, USA) in the presence of 6X-His peptide (4.78 μg/ml; 5.69 nmol) or Vax1-His (200 μg/ml; 5.69 nmol) and incubated for 12 hr. The fluorescence images of horizontal sections of head slabs were obtained using an Olympus FV1000 confocal microscopy equipped with a transmitted light detector (top row). The same embryonic sections were further stained with rabbit anti-Vax1 (green) and mouse anti-NF160 (red) antibodies (bottom row). (B) Fluorescence intensities of NF160 immunostains in the boxed areas in (A) were measured using ImageJ software and are presented graphically. The values are intensities expressed relative to rb-IgG-treated samples, and error bars denote SDs (**p < 0.001; ANOVA). Numbers on top of the graph columns are head-slab preparations.
Figure 9—figure supplement 1
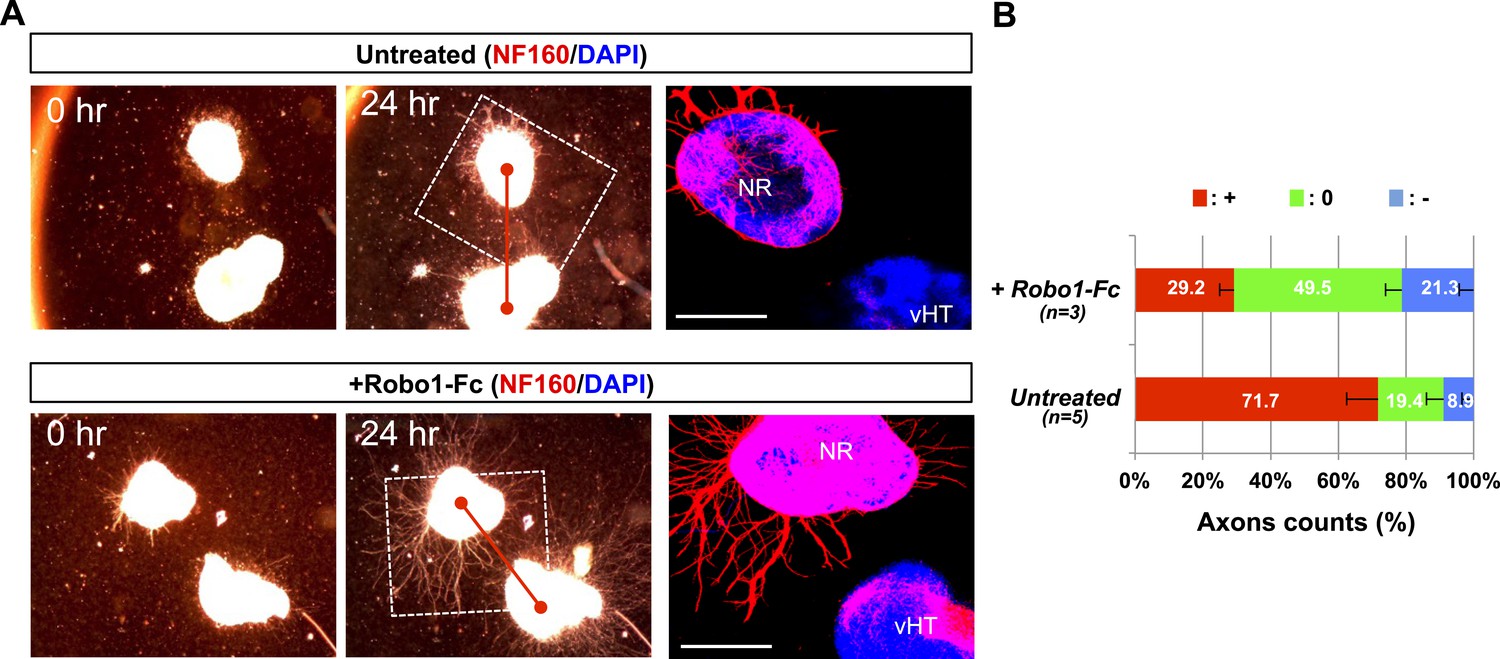
vHT-secreted Silt inhibits RGC axon growth.
(A) E13.5 WT retinal explants were co-incubated with E13.5 Vax1-ko vHT explants for 24 hr in the presence (bottom) or absence (top) of Robo1-Fc (100 ng/ml). Dark field images of the explants were taken before (0 hr; left column) and after (24 hr; center column) the incubation. The explants were then fixed for immunostaining with mouse anti-NF160 antibody (red). Immunostaining images of dotted boxed areas in the center column are shown in the right column. DAPI, nuclear counter staining. Scale bars denote 500 μm. (B) The angular distribution of RGC axons was measured by counting axon marker NF160 immunostaining image pixels (axon counts) as described in ‘Materials and methods’ and presented graphically. +, forward direction angle segment; 0, neutral direction angle segments; −, reverse direction angle segment. The values in the bar are averages, and error bars denote SDs. Numbers under y-axis labels are the number of explants analyzed. p-values determined by ANOVA test are <0.01.
Figure 9—figure supplement 2
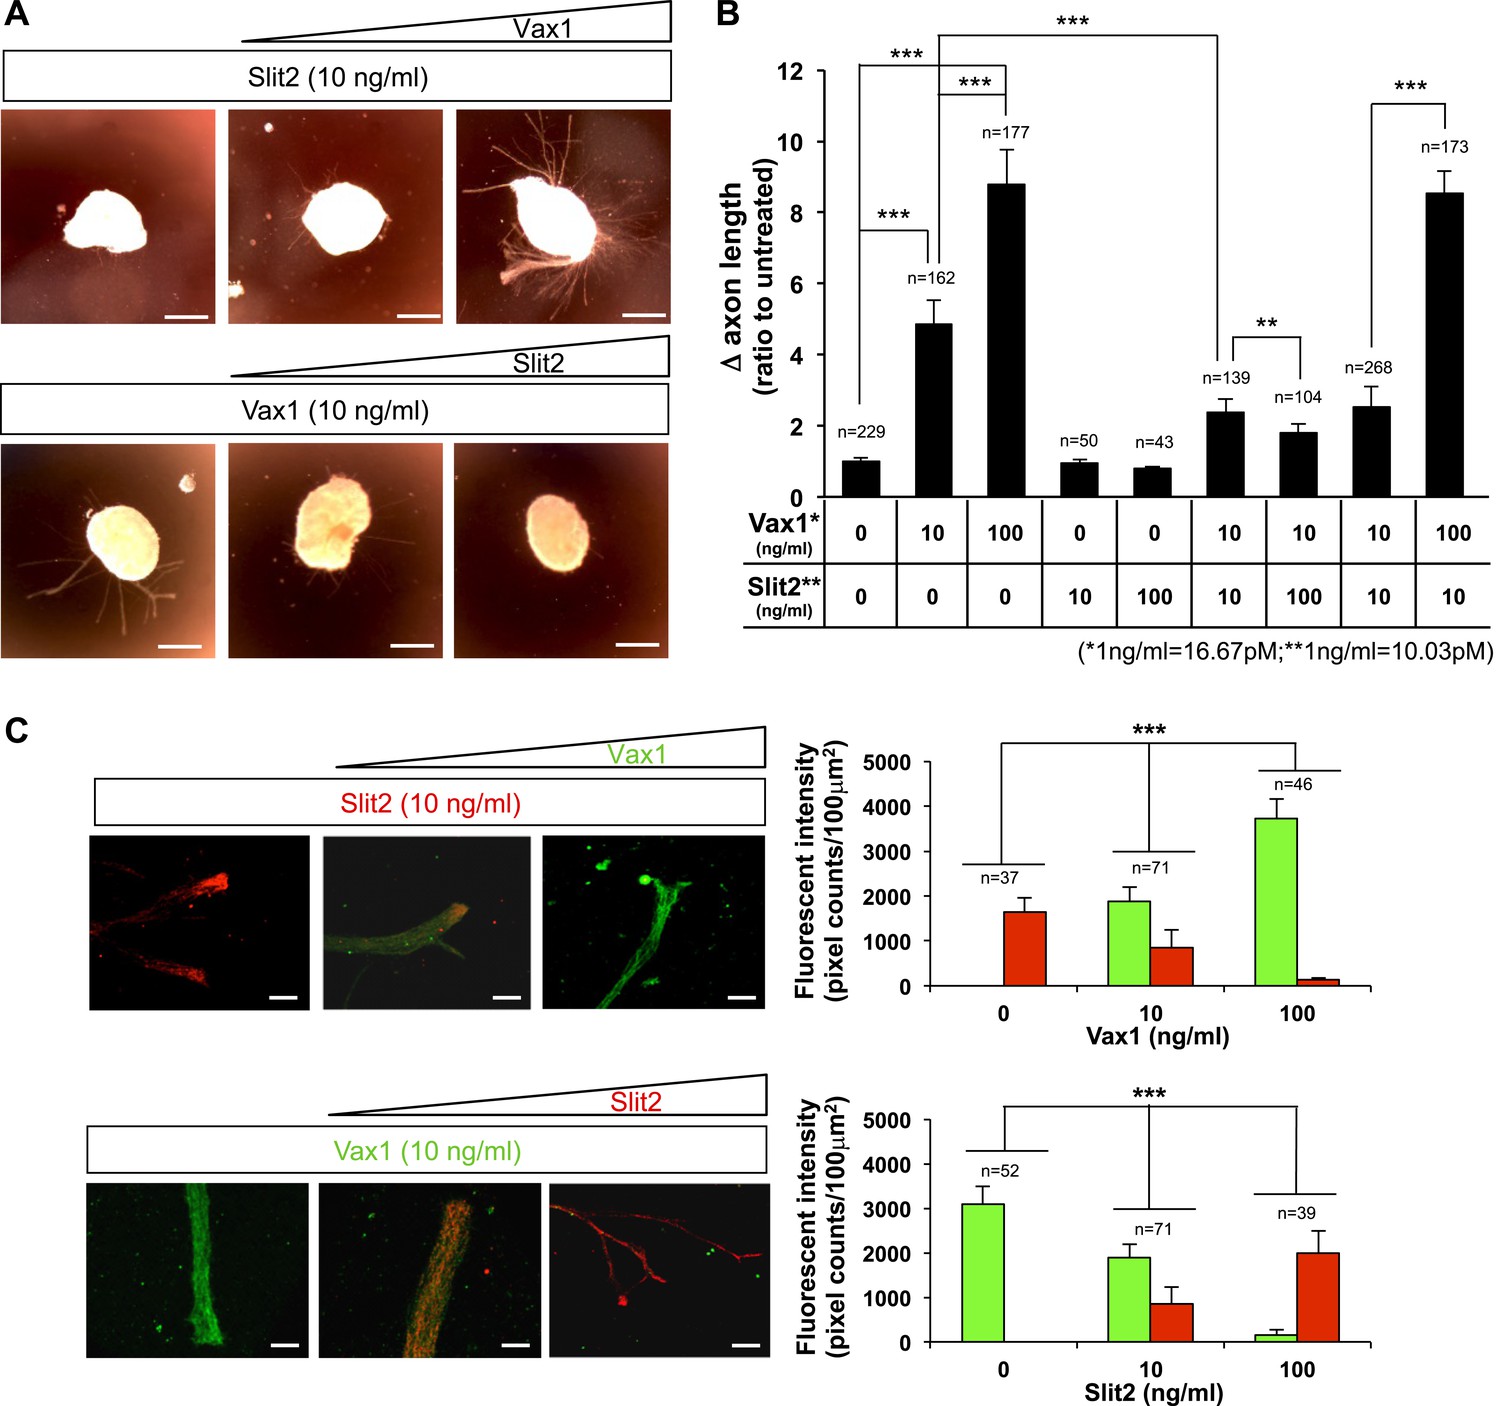
Reciprocal antagonism between Vax1 and Slit2 in vitro.
(A) E13.5 mouse retinal explants were cultured for 24 hr prior to treatment with Slit2-His (10 ng/ml; R&D Systems) for 24 hr in the absence (left) of Vax1-His or in the presence of 10 ng/ml (middle) or 100 ng/ml (right) of Vax1-His (top row). In reciprocal experiments, explants were treated with Vax1-His (10 ng/ml) for 24 hr in the absence (left) of Slit2-His or the presence of 10 ng/ml (middle) or 100 ng/ml (right) Slit2-His (bottom row). (B) The changes in RGC axon length during the last 24 hr are shown graphically. Error bars denote SD and the scores on top of the graph columns are the number of axons analyzed. Number of explants analyzed: untreated, n = 22; Vax1 (10 ng/ml), n = 10; Vax1 (100 ng/ml), n = 9; Slit2 (10 ng/ml), n = 5; Slit2 (100 ng/ml), n = 5; Vax1 (10 ng/ml) + Slit2 (10 ng/ml), n = 7; Vax1 (10 ng/ml) + Slit2 (100 ng/ml), n = 6; Vax1 (10 ng/ml) + Slit2 (10 ng/ml), n = 13; and Vax1 (100 ng/ml) + Slit2 (10 ng/ml), n = 7. Results were obtained from four (for the first two) or three (for the rest) independent experiments. (C) Vax1-His and Slit2-His added to the retinal explants were detected by immunostaining with rabbit α-Vax1 (green) and mouse α-Slit2 (red). Scale bars: 20 μm. Fluorescent intensities Vax1 and Slit2 immunostaining images were measured by ImageJ software and shown graphically. Scores on top of the columns are number of areas analyzed. Number of explants analyzed for immunostainings are same as (B).
Figure 10
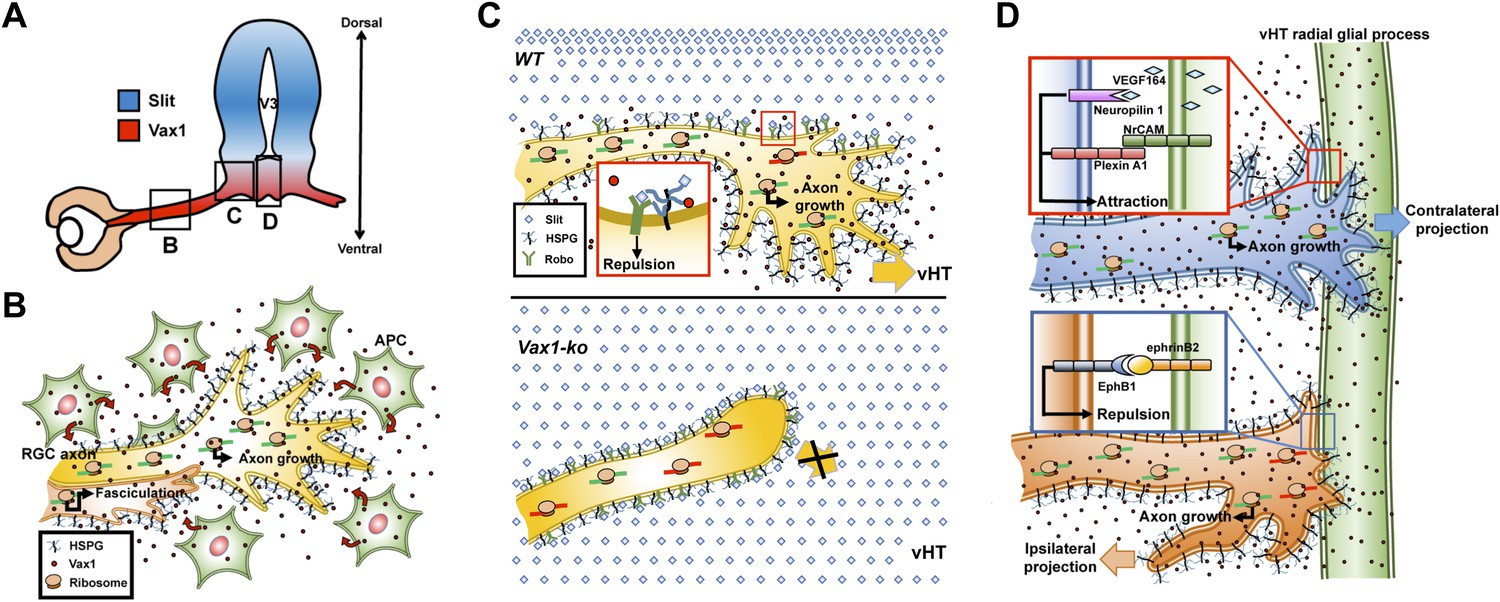
Model depicting Vax1 functions as a secreted retinal axon growth factor.
Vax1 is expressed in radial glia and NPCs of the vHT as well as the OS APCs (A) and secreted to the extracellular space (B). RGC axons that grow in the OS capture APC-secreted Vax1 by HSPGs, resulting in an increase in Vax1 concentration at RGC axons for subsequent penetration and local activation of translation in the axon (B). The imported Vax1 in RGC axoplasm not only promotes axonal growth towards the vHT, but it also enhances fasciculation of RGC axons. This axon growth stimulatory activity of Vax1 supports sustained RGC axon growth to the vHT midline after the axons were avoided from progressing to dorsal diencephalon, which expresses high concentration of Slit repulsive axon guidance cue (C, top). Therefore, RGC axons stop at the lateral wall of Vax1-ko mouse diencephalon and fail to access the midline (C, bottom). At the vHT midline, RGC axon guidance cues, including VEGF164, NrCAM, and ephrinB2, determine the directionalities of RGC axon growth cones by acting their specific receptors (D). Vax1 does not likely determine the directionalities of RGC axon growth cone at the midline but does promote the growth of the RGC axon shaft as well as the growth cone regardless of their original positions in the retina.
Videos
Video 1
Time-lapse video of E13.5 mouse retinal explants cultured in the presence of 6X-His-FITC peptides (100 ng/ml) as described in ‘Materials and methods’.
https://doi.org/10.7554/eLife.02671.012
Video 2
Time-lapse video of E13.5 mouse retinal explants cultured in the presence of Vax1-His-FITC proteins (500 ng/ml) as described in ‘Materials and methods’.
https://doi.org/10.7554/eLife.02671.013
Video 3
Time-lapse video of E13.5 mouse retinal explants cultured in the presence of 6X-His-FITC peptides (500 ng/ml) as described in ‘Materials and methods’.
https://doi.org/10.7554/eLife.02671.028Download links
A two-part list of links to download the article, or parts of the article, in various formats.
Downloads (link to download the article as PDF)
Open citations (links to open the citations from this article in various online reference manager services)
Cite this article (links to download the citations from this article in formats compatible with various reference manager tools)
Regulation of retinal axon growth by secreted Vax1 homeodomain protein
eLife 3:e02671.
https://doi.org/10.7554/eLife.02671


