Drastic changes in conformational dynamics of the antiterminator M2-1 regulate transcription efficiency in Pneumovirinae
- Wellcome Trust Centre for Human Genetics, United Kingdom
- Diamond Light Source Ltd, United Kingdom
Figures
Figure 1 with 2 supplements
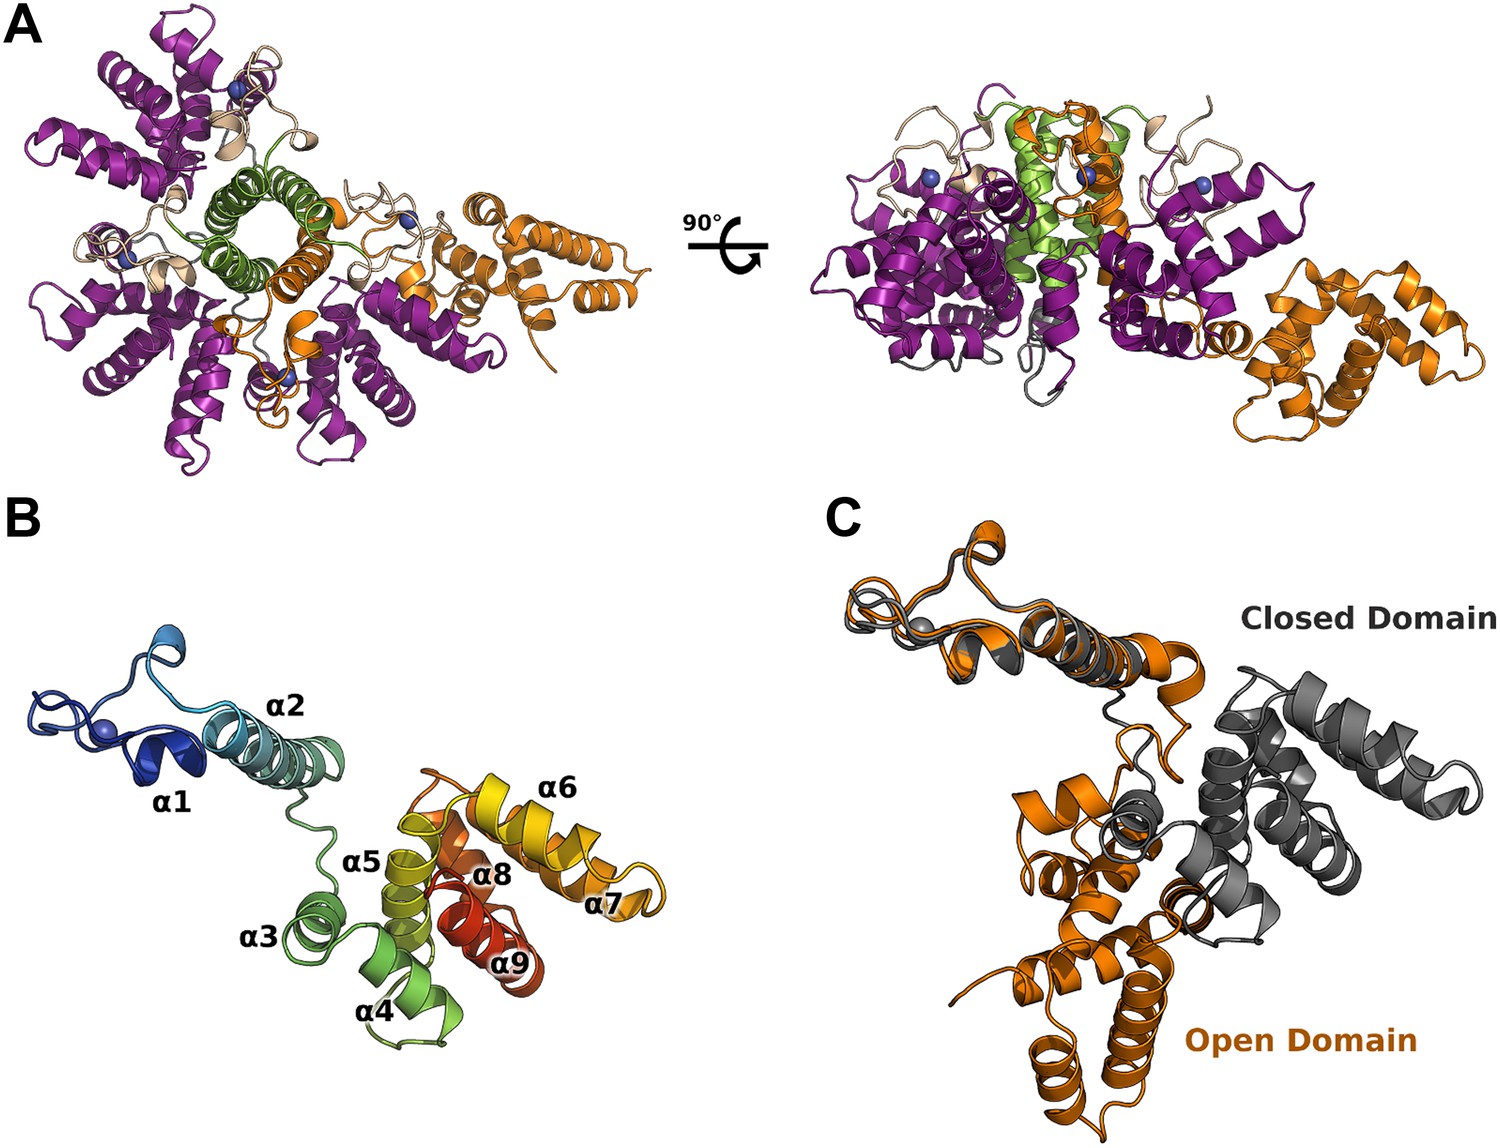
Crystal structure of HMPV M2-1.
(A) Top view (left) and side view (right) of M2-1 asymmetric tetramer in cartoon representation. Closed protomers are coloured by domain with the zinc finger in wheat, tetramerization helix in green, and core domain in purple. Zinc atoms are represented as blue spheres. The open protomer is coloured in orange. (B) Close-up view of a closed protomer. The molecule is coloured from blue (N terminus) to red (C terminus) and secondary structure elements are labelled. (C) Comparison between open (orange) and closed protomer (grey).
Figure 1—figure supplement 1
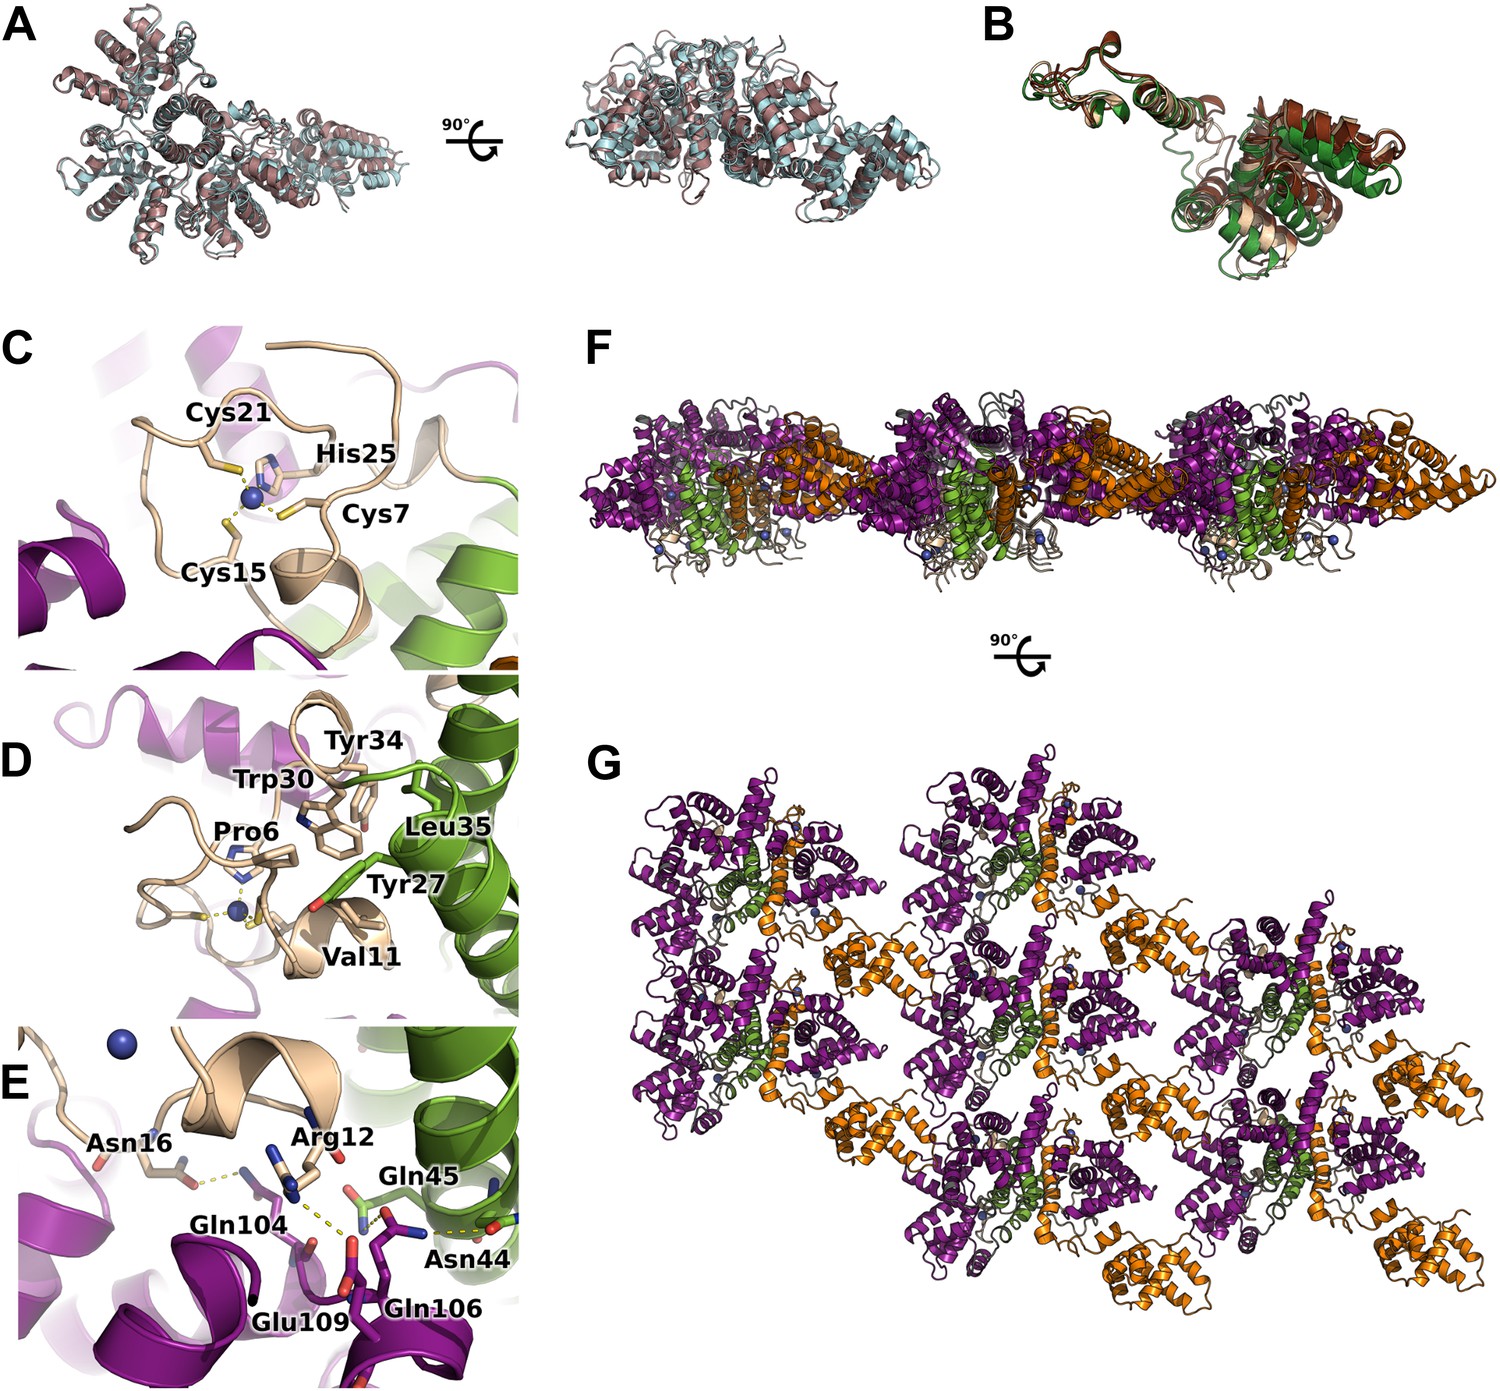
Flexibility, interfaces details and packing of M2-1 in the crystalline state.
(A) Top view (left) and side view (right) of superimposed M2-1 tetramers from two different crystals are shown in cartoon representation (apo1 and 2). (B) Overlaid closed state protomers from the apo1 structure, highlighting the flexibility of the core domain. (C) A close-up view of M2-1 zinc finger showing that the tetragonal coordination of the zinc atom. (D) Details of the zinc finger and tetramerization domains interfaces. (E) Polar contacts involving the zinc finger and core domains in the closed state. (F and G) Rotated views of the crystallographic packing of the asymmetric M2-1 tetramer coloured as in Figure 1A.
Figure 1—figure supplement 2
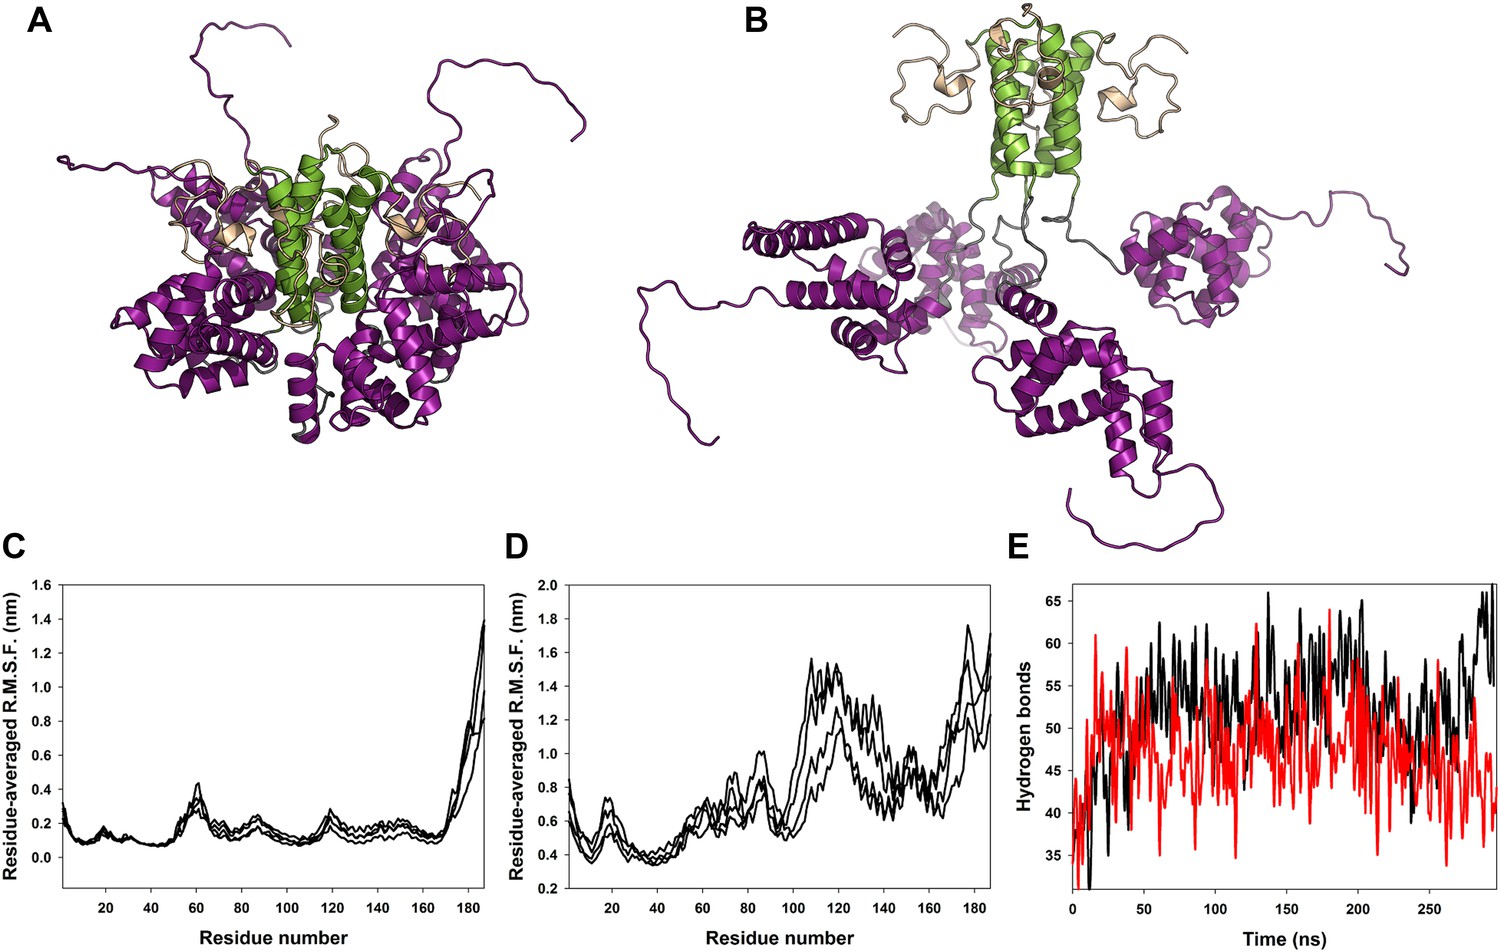
Classical molecular dynamics simulations of the closed and open state models of M2-1.
(A) Model of M2-1 closed state. The N-terminal his-tag is omitted for clarity. (B) Model of M2-1 open state. (C and D) Root mean square fluctuations of each four protomers in the closed and open states, averaged from three independent simulations. (E) Number of hydrogen bonds between one closed core domain and the remainder of the molecule vs simulation time in two independent simulations.
Figure 2 with 2 supplements
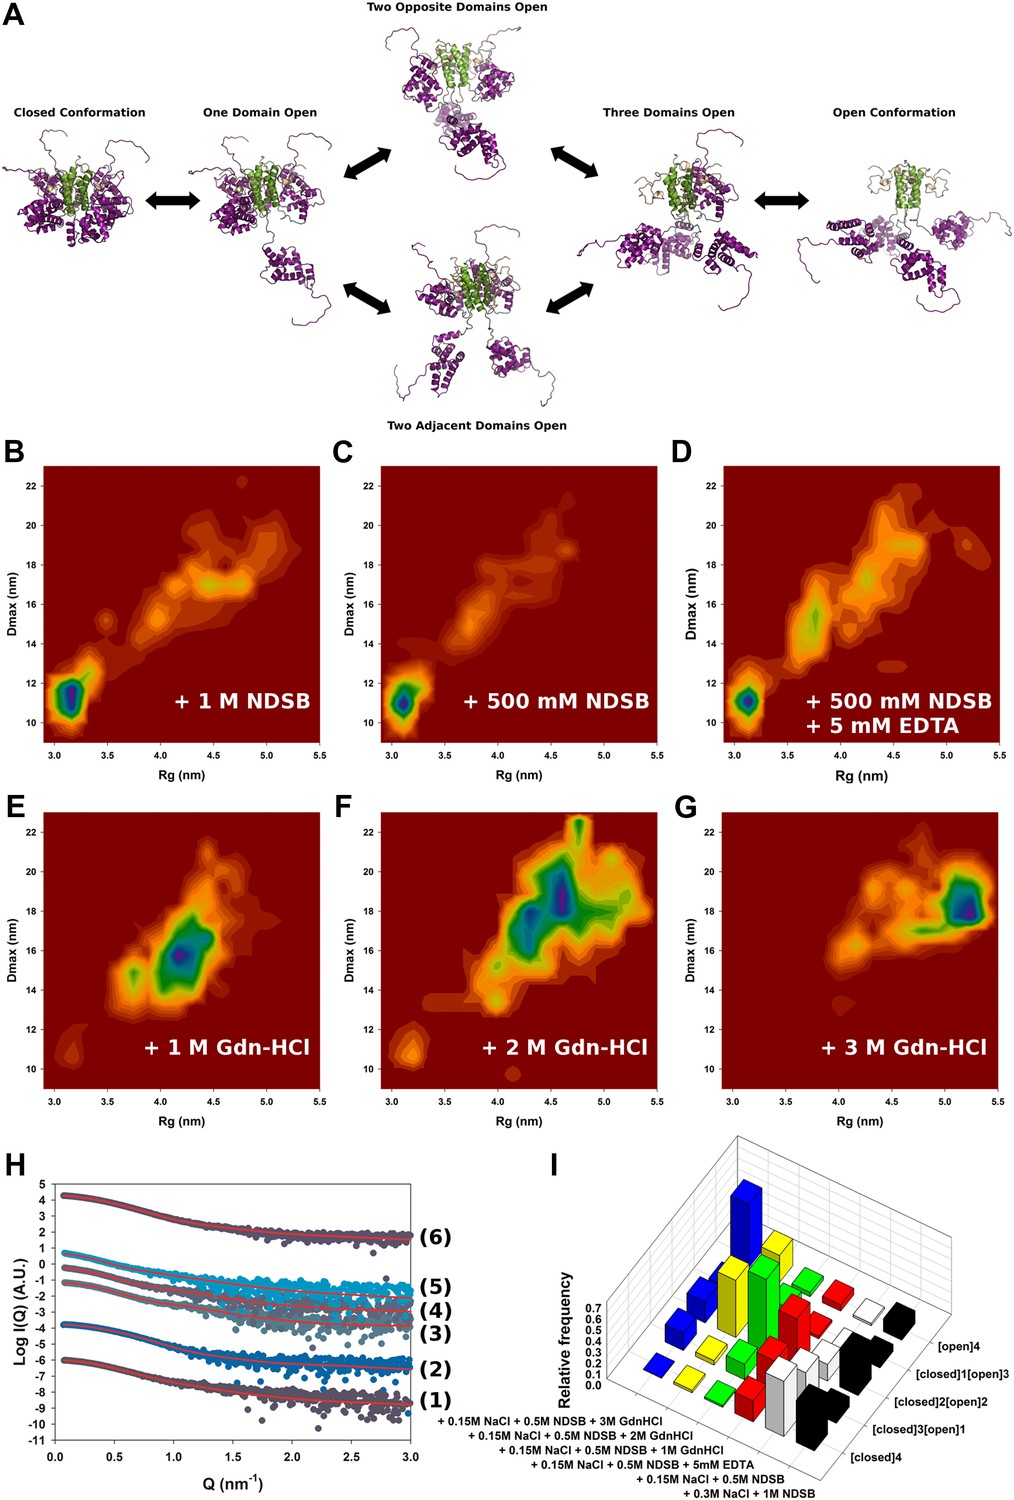
Solution structure of HMPV M2-1.
(A) Model for domain opening and closure. The structures are coloured by domain with the zinc finger in wheat, tetramerization domain in green, and core domain in purple. The N-terminal histag is omitted for clarity. (B–G) Two-dimensional histogram representations of radius of gyration (Rg) and maximal intramolecular distance (Dmax) distributions for M2-1 in the presence of 20 mM Tris pH 7.5 and 300 mM NaCl and 1 M NDSB-201 (B), 150 mM NaCl and 500 mM NDSB-201 (C), 150 mM NaCl, 500 mM NDSB-201, and 5 mM EDTA (D), 150 mM NaCl, 500 mM NDSB-201 and 1 M, 2 M or 3 M guanidinium hydrochloride (E, F and G). (H) Fitted SAXS profiles using optimized ensembles of 50 models. From bottom to top, data measured in the presence of 20 mM Tris pH 7.5, 150 mM NaCl, and 500 mM NDSB-201 (1), 150 mM NaCl, 500 mM NDSB-201 and 5 mM EDTA (2), 1 M, 2 M, or 3 M guanidinium hydrochloride (3, 4, 5), or 300 mM NaCl and 1 M NDSB-201 (6). (I) Relative frequencies of selection of the conformers shown in A in various buffer environments.
Figure 2—figure supplement 1
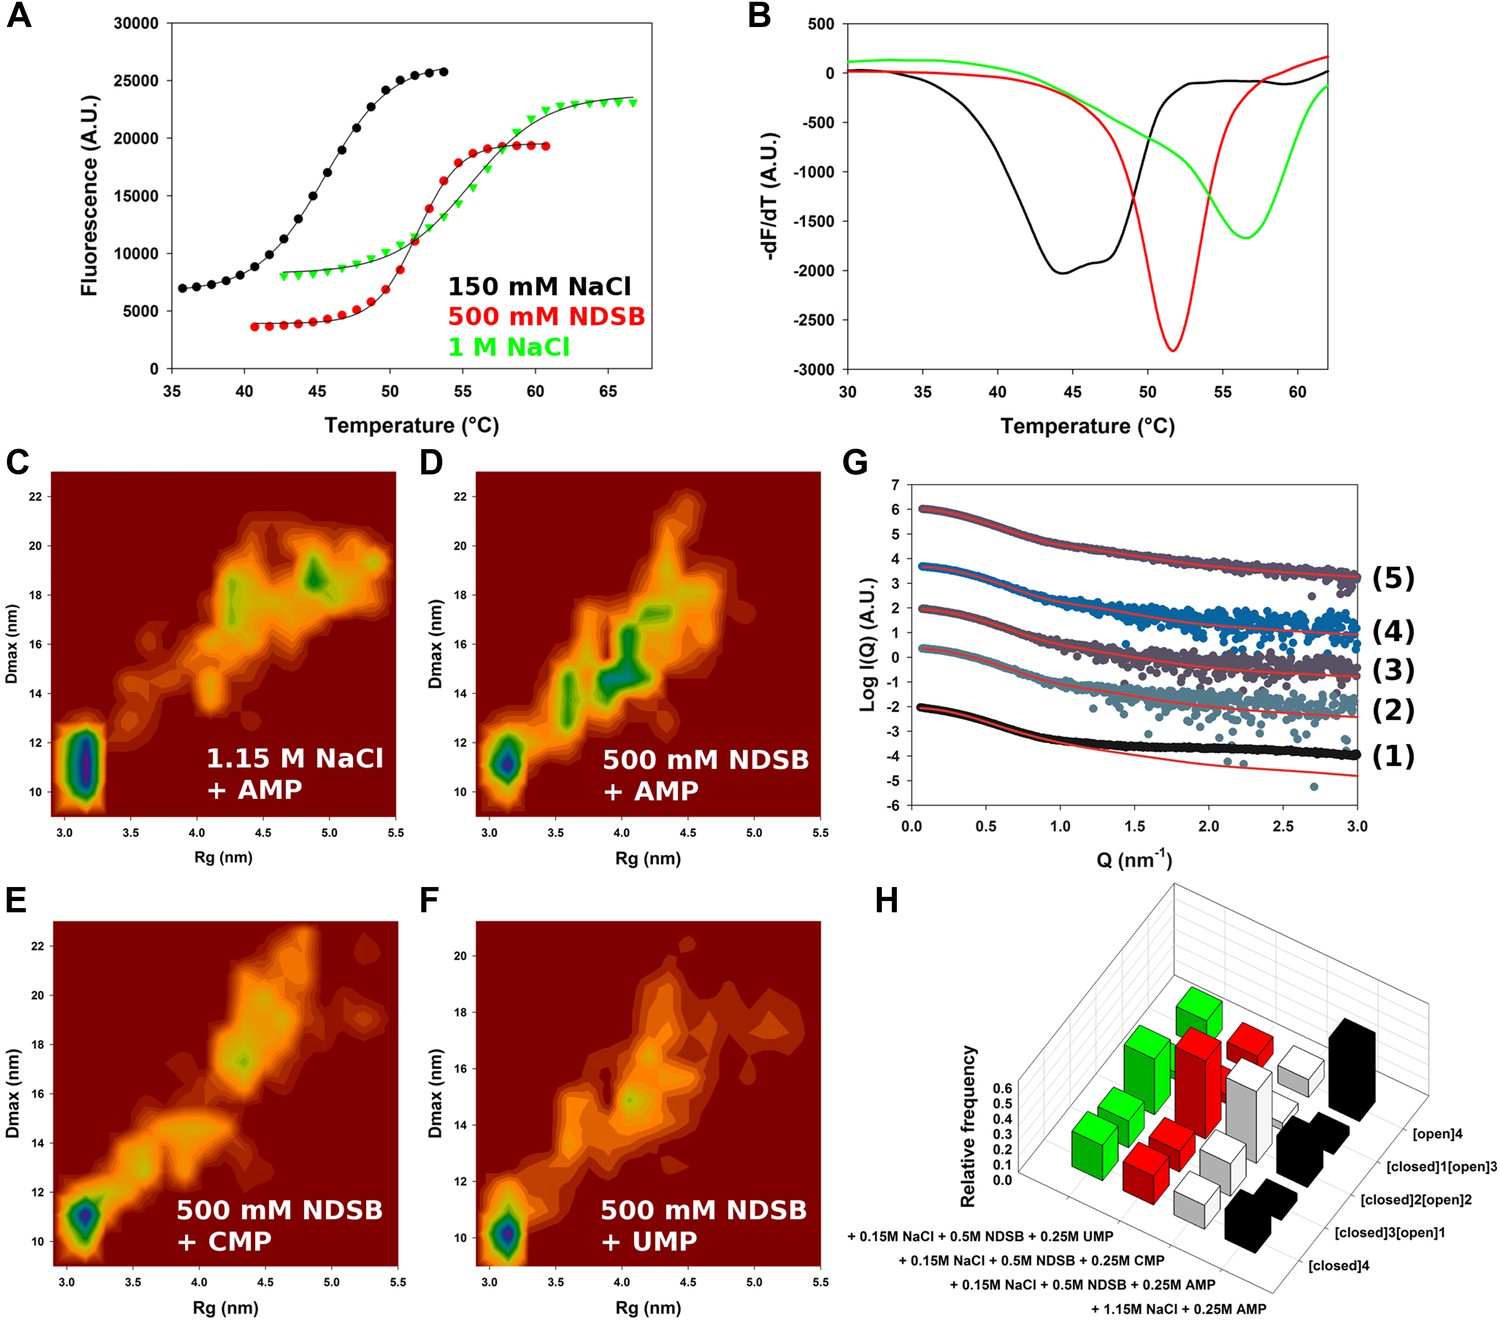
Conformational landscape of M2-1 in the presence of nucleotides studied by SAXS.
(A and B) Effect of different buffer environments on HMPV M2-1 melting profile monitored by fluorescence-based thermal shift assay. (C–F) Two-dimensional histogram representations of radius of gyration (Rg) and maximal intramolecular distance (Dmax) distributions for M2-1 in the presence of 20 mM Tris pH 7.5 and 1.15 M NaCl and 250 mM AMP (C), 150 mM NaCl, 500 mM NDSB-201, and 250 mM AMP (D), or 250 mM CMP (E), or 250 mM UMP (F). (G) Fitted SAXS profiles using optimized ensembles of 50 models. From bottom to top, data measured in the presence of 20 mM Tris pH 7.5, 150 mM NaCl, and 250 mM AMP (1), 150 mM NaCl, 500 mM NDSB-201, and 250 mM AMP (2), or 250 mM CMP (3), or 250 mM UMP (4), or 1.15 M NaCl and 250 mM AMP (5). (H) Relative frequencies of selection of the conformers shown in Figure 2A in the presence of AMP, CMP, or UMP.
Figure 2—figure supplement 2
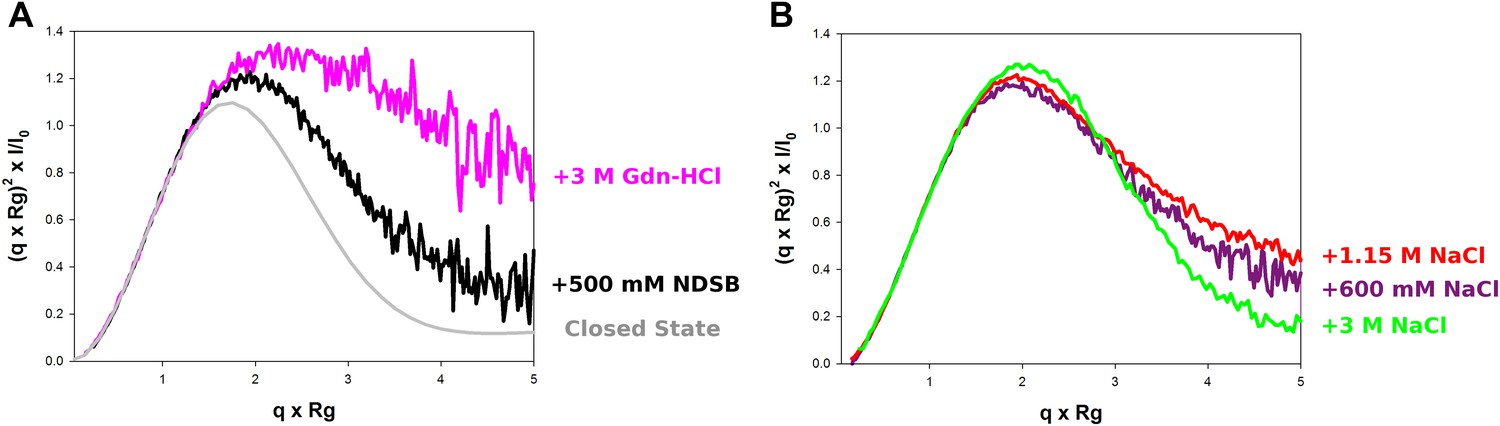
Model-free analysis of M2-1 conformational landscape.
(A) Normalized Kratky plots of M2-1 in the presence of 20 mM Tris pH 7.5, 150 mM NaCl, and 500 mM NDSB-201 (black), or with 3 M Gdn-HCl (pink). The grey curve is the normalized Kratky plot calculated from the theoretical SAXS profile of an ensemble of three closed state conformers (to account for the flexibility of the disordered N-terminal side and C-terminal extension). (B) Normalized Kratky plots of M2-1 in the presence of 20 mM Tris pH 7.5 and 600 mM NaCl (purple), 1.15 M NaCl (red) or 3 M NaCl (green).
Figure 3 with 2 supplements
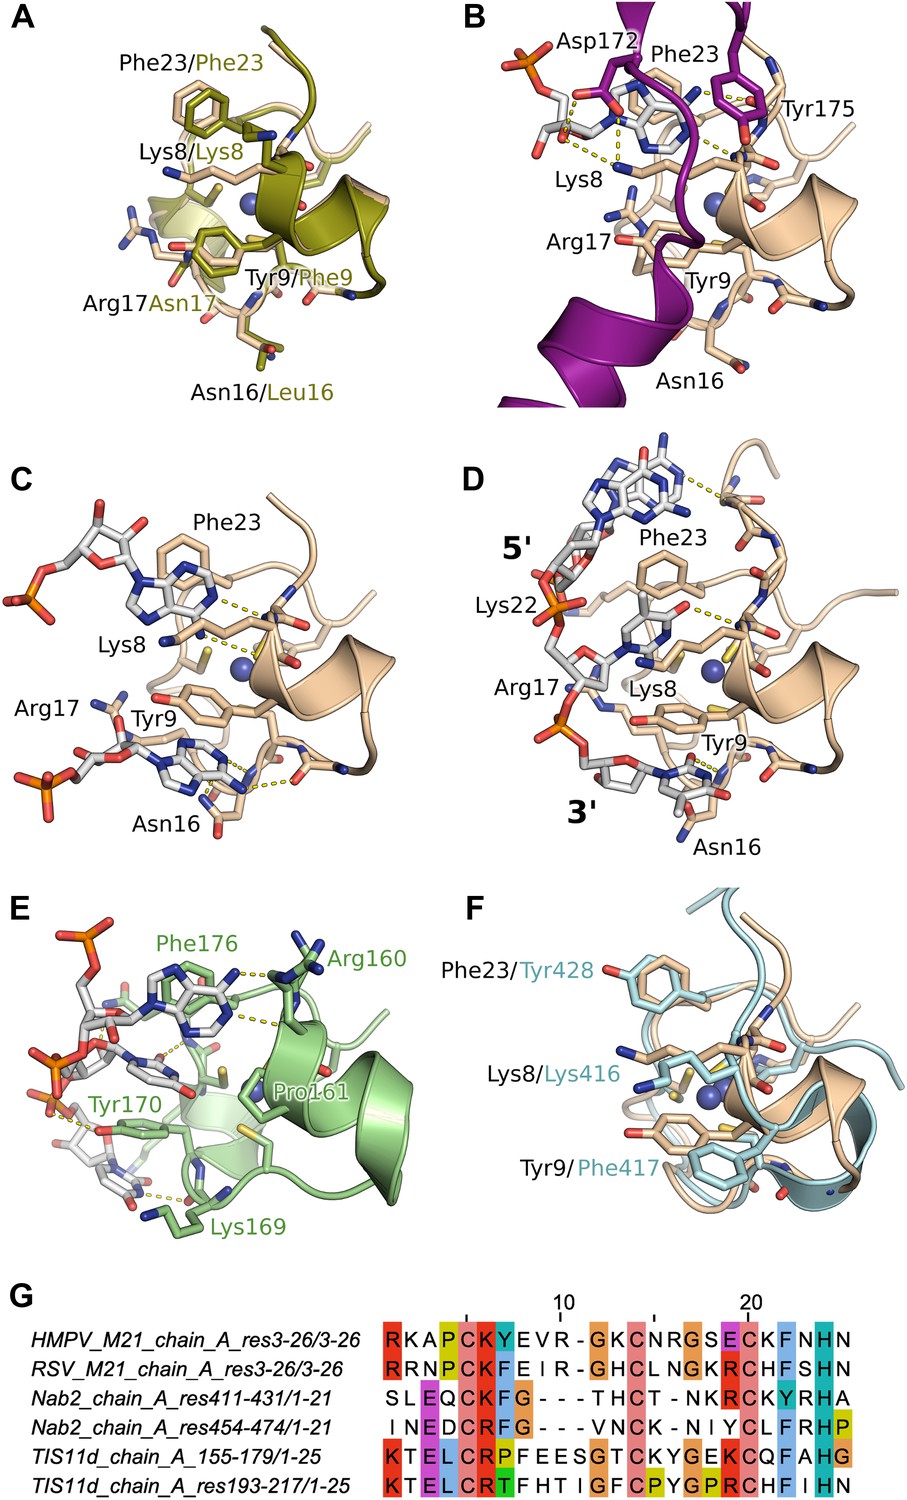
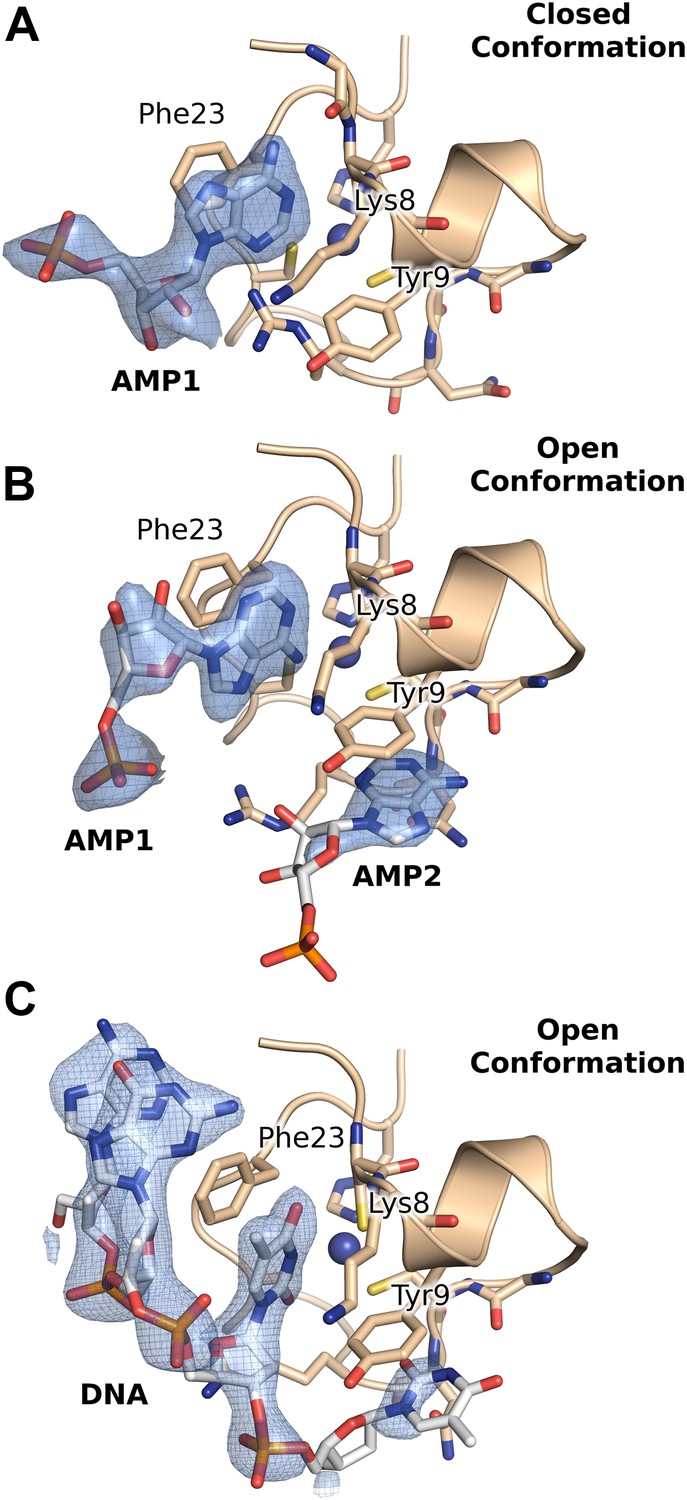
Interaction of the zinc finger of M2-1 with nucleic acids.
(A) Superimposition of HMPV (wheat) and RSV (split pea, PDB ID 4C3B) zinc fingers, highlighting the conservation of surface residues. (B) Structure of adenosine monophosphate bound HMPV M2-1 zinc finger in the closed state. The C-terminal region of the core domain that folds onto the bound nucleotide is shown in purple. (C) Structure of adenosine monophosphate bound HMPV M2-1 zinc finger in the open state. (D) Structure of HMPV M2-1 bound to the DNA sequence AGTT. (E) NMR structure of TIS11d zinc finger 1 bound to the RNA sequence AUU (PDB ID 1RGO). (F) Superimposed structures of HMPV M2-1 zinc finger and Nab2 zinc finger 5 (in light blue), showing the spatial conservation of the aromatic and charged residues involved in RNA binding. (G) Multiple sequence alignment of viral and eukaryotic zinc fingers that preferentially bind adenosine rich (HMPV and RSV M2-1, Nab2) or adenosine-uridine rich sequences (TIS11d).
Figure 3—figure supplement 1
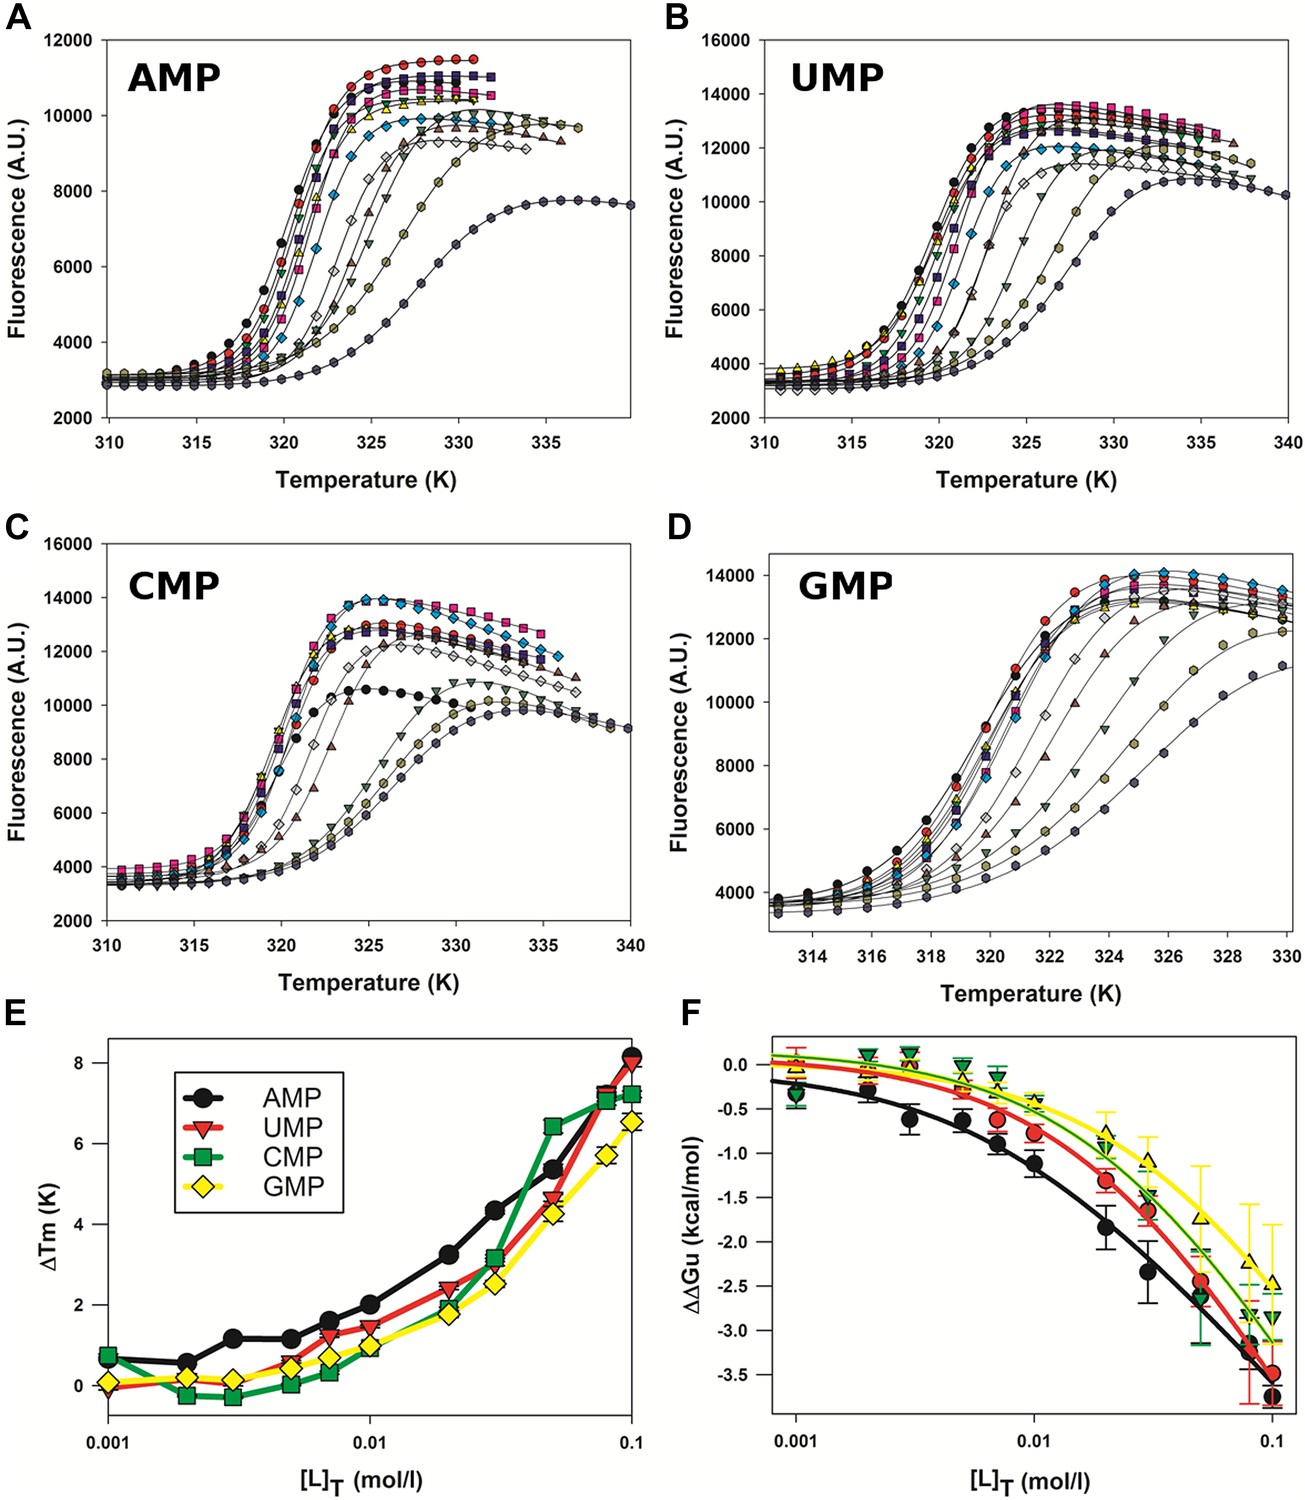
Effect of nucleotides on HMPV M2-1 melting profile monitored by fluorescence-based thermal shift assay.
(A–D) Unfolding transitions of HMPV M2-1 at 4 µM (black spheres) in 50 mM HEPES, pH 7.5, and 150 mM NaCl and with increasing concentrations of AMP (A), UMP (B), CMP (C) or GMP (D) from 1 mM to 100 mM. (E) Variations of the protein melting temperature (Tm) as a function of the concentration of added nucleotide. (F) Calculated ΔΔGu values vs ligand concentrations.
Figure 3—figure supplement 2
2Fo-Fc electron density maps contoured at ∼1σ, from the crystal structures of AMP and DNA bound HMPV M2-1.
(A and B) AMP molecules bound in between the zinc finger and core domains of two symmetry related protomers. (C) Binding of the DNA oligonucleotide AGTT in between the zinc finger and core domains of two symmetry related protomers.
Figure 4
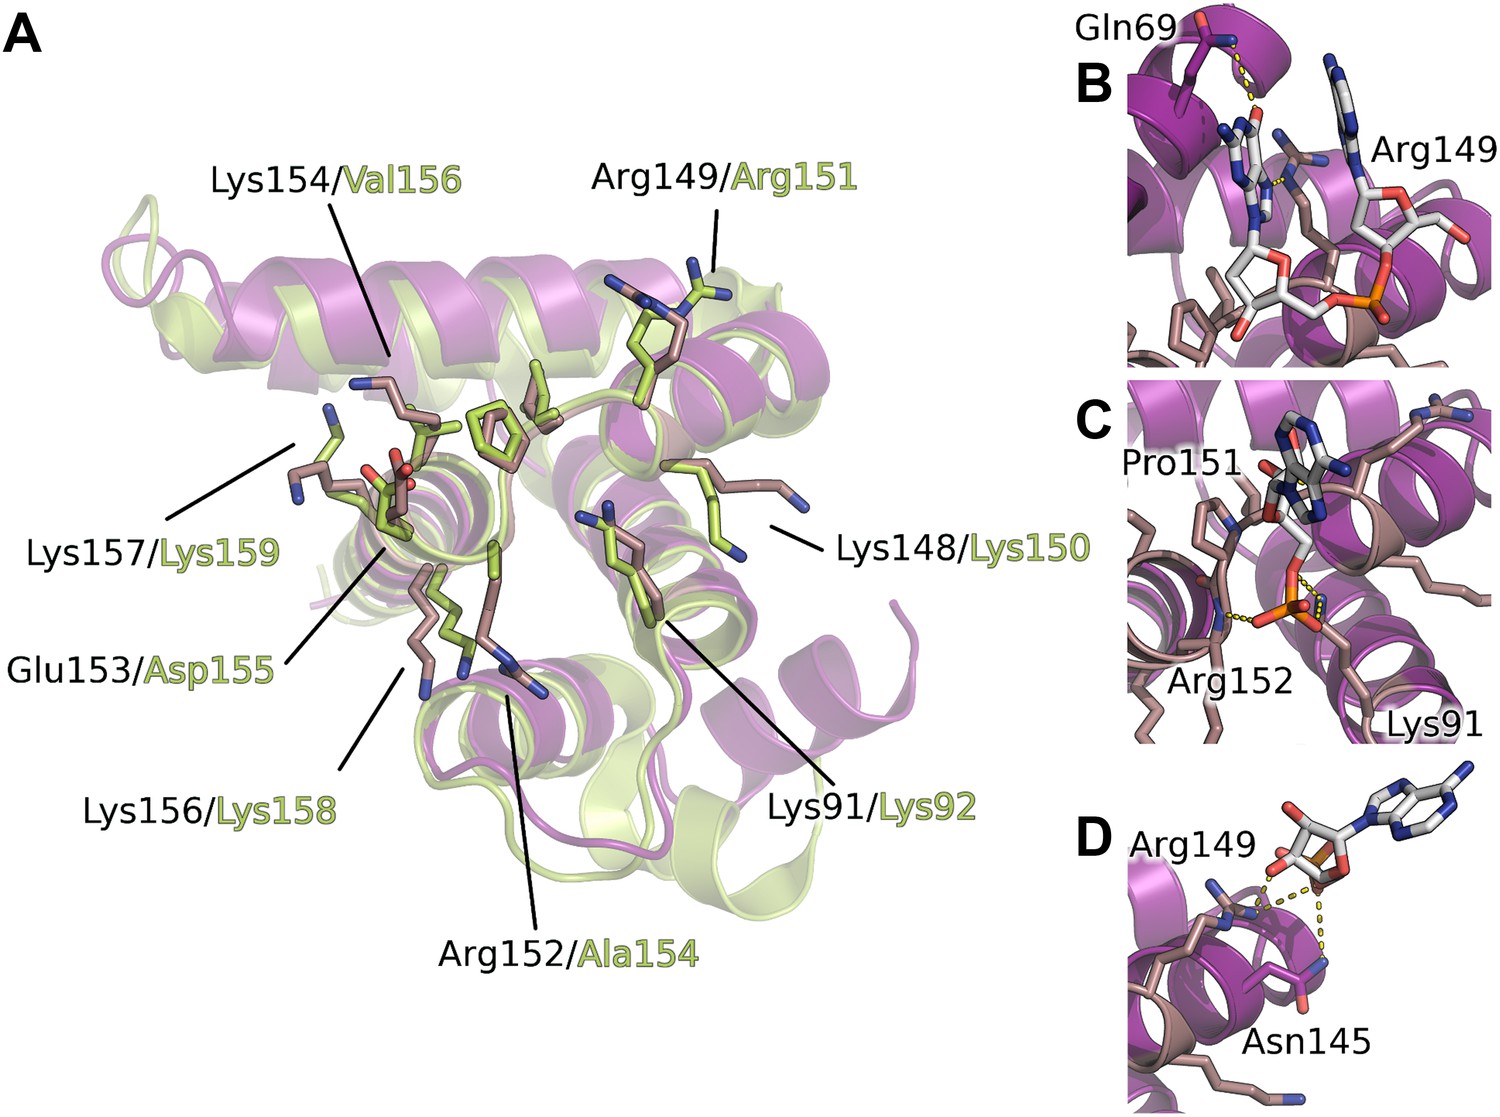
Interaction of the core domain of M2-1 with nucleic acids.
(A) Superimposition of HMPV (purple) and RSV (lime, PDB ID 4C3D) M2-1 core domains. (B) HMPV M2-1 core domain bound to the DNA sequence AG. (C and D) Adenosine monophosphate bound core domains. The core domain is shown in purple cartoon representation, and RNA binding residues previously identified by NMR are coloured in brown with side chains shown in sticks.
Figure 5 with 2 supplements
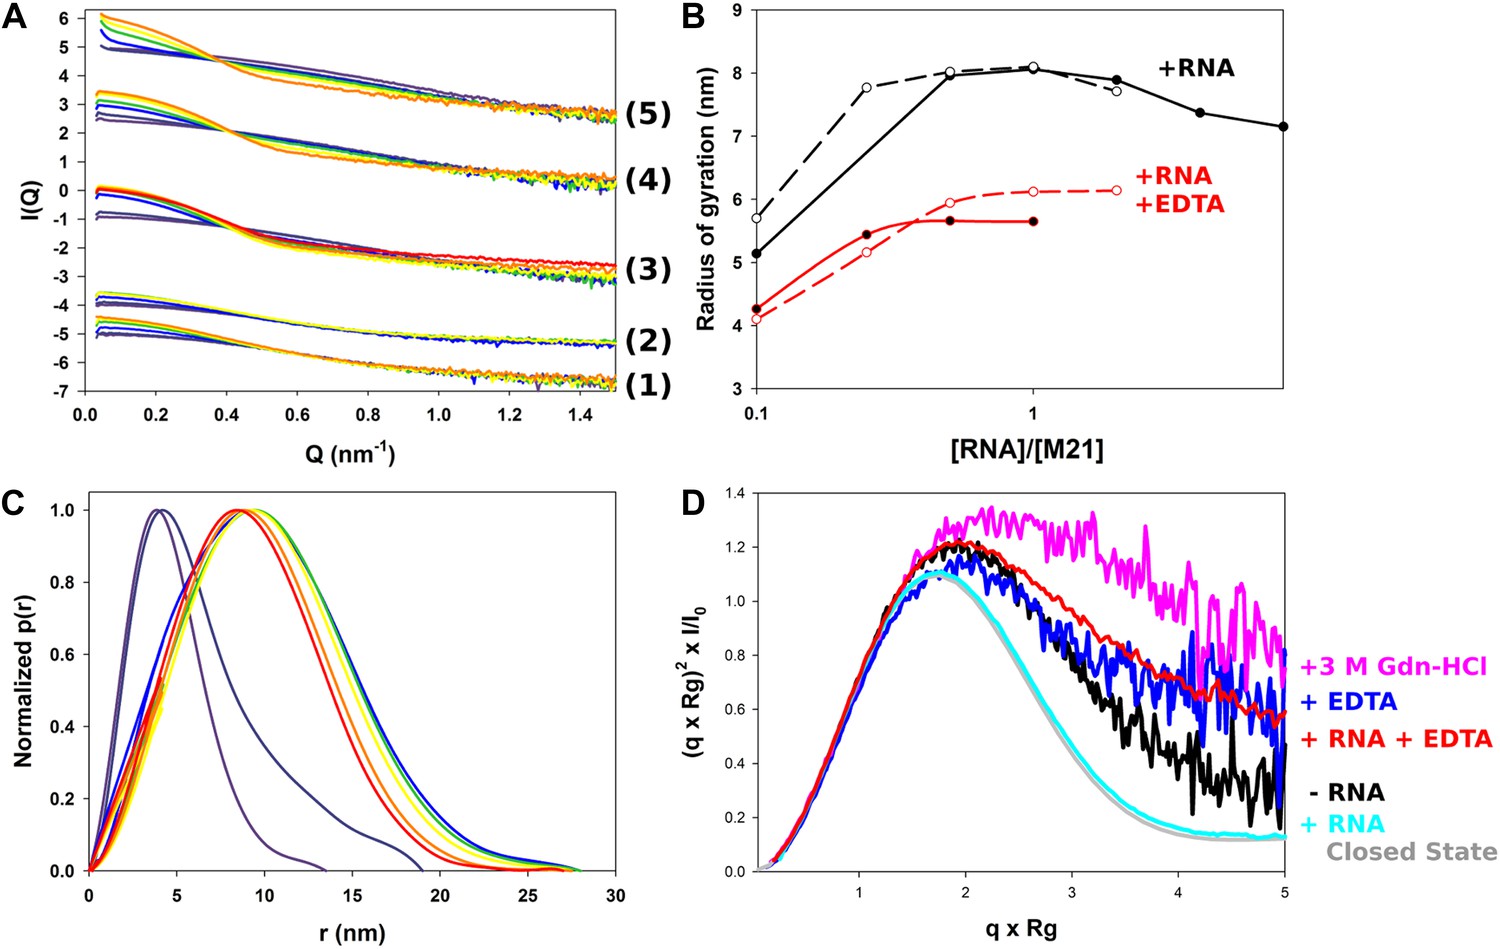
Structural characterization of M2-1/RNA complexes using SAXS.
(A) RNA induced changes on the measured SAXS profiles by addition of leader RNA (5′ACGCGAAAAAAU-3′) at 0, 1, 5, 10, 20 µM or gene end RNA (5′-AGUUAauuAAAAA-3′) at 0, 1, 5, 10, 20, 40, and 80 µM, coloured from purple to red. From bottom to top, M2-1 in the presence of 20 mM Tris pH 7.5, 150 mM NaCl and 500 mM NDSB-201, 5 mM EDTA + gene end RNA (1) or leader RNA (2), M2-1 in the presence of 20 mM Tris pH 7.5, 150 mM NaCl and 500 mM NDSB-201 + gene end RNA (3) or leader RNA (4). The top curve (5) is similar to (4) but using a higher protein concentration (∼1 mg/ml vs ∼0.2 mg/ml). (B) The measured radius of gyration is plotted as a function of the molar ratio of RNA to protein concentration, indicating the formation of higher order oligomers. Titrations performed in the presence or absence of 5 mM EDTA are shown in red and in black, respectively, leader RNA titrations are in white circles and dashed lines and gene end RNA titrations are in black circles and solid lines. (C) Normalized pair distance distribution functions for M2-1 in 20 mM Tris pH 7.5, 150 mM NaCl and 500 mM NDSB-201 (red curve) and with increasing amounts of gene end RNA (orange to green to purple curve). (D) Normalized Kratky plots of M2-1 in the presence of 20 mM Tris pH 7.5, 150 mM NaCl, and 500 mM NDSB-201 (black), with 20 µM of RNA added (cyan), with 5 mM of EDTA (purple), with 5 mM of EDTA and 20 µM of RNA (red), or with 3 M Gdn-HCl (pink). Finally, the grey curve is the normalized Kratky plot calculated from the theoretical SAXS profile of an ensemble of three closed state conformers (to account for the flexibility of the disordered N-terminal side and C-terminal extension).
Figure 5—figure supplement 1
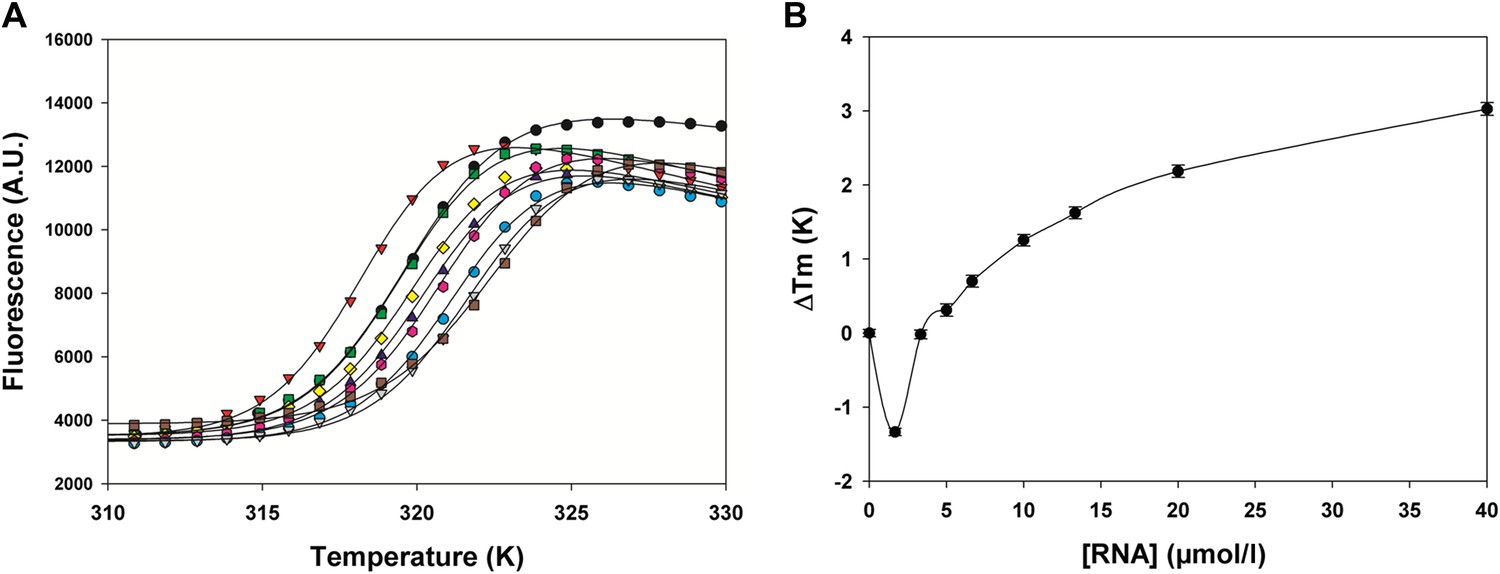
Effect of gene end RNA (5′-AGUUAauuAAAAA-3′) on HMPV M2-1 melting profile monitored by fluorescence-based thermal shift assay.
(A) Unfolding transitions of HMPV M2-1 at 4 µM (black spheres) in 50 mM HEPES, pH 7.5, and 150 mM NaCl and with increasing concentrations of gene end RNA. (B) Variations of the protein melting temperature (Tm) as a function of the concentration of added RNA.
Figure 5—figure supplement 2
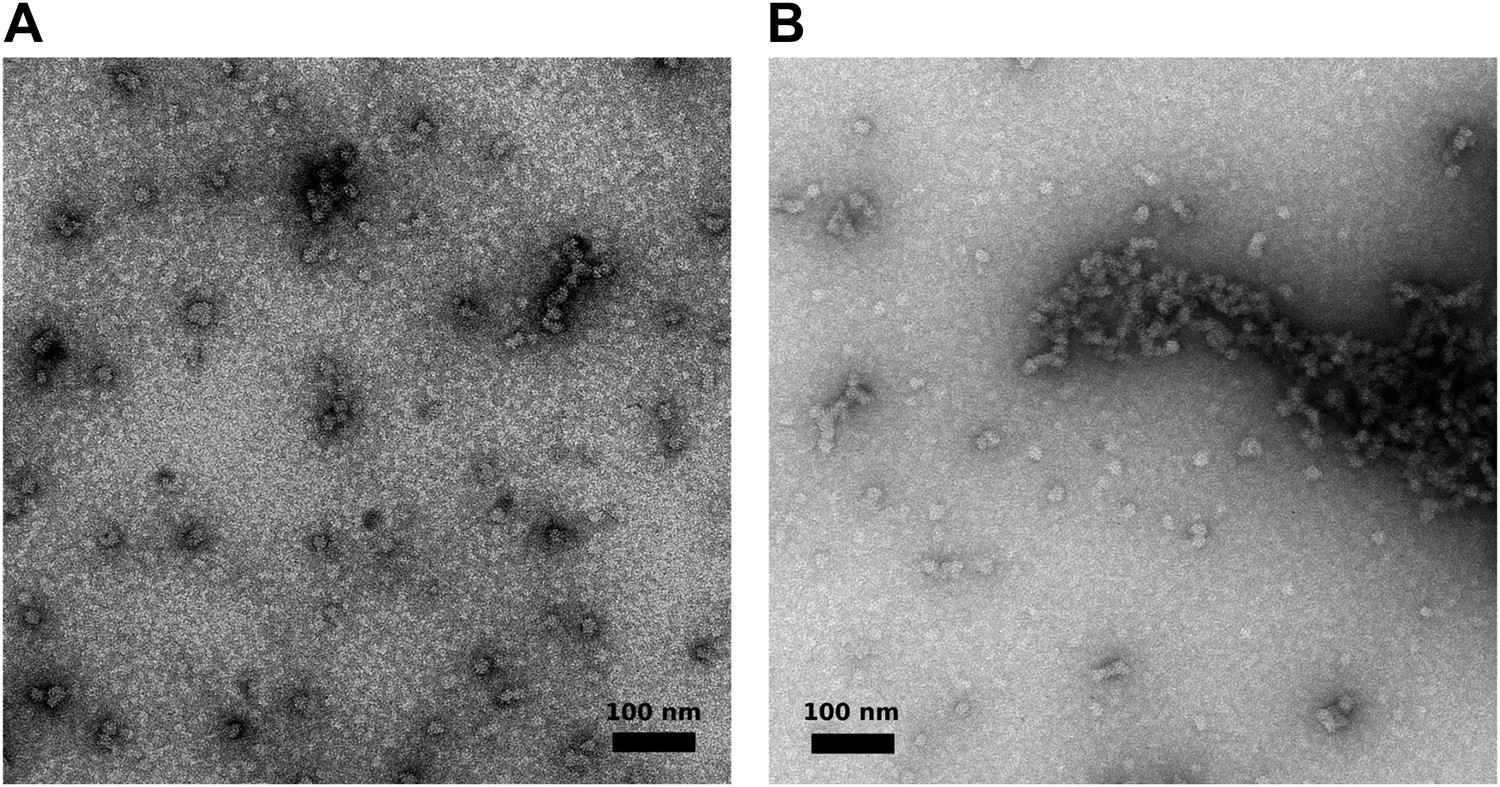
Visualization of aggregated M2-1/RNA complexes by electron microscopy.
(A and B) Negatively stained M2-1/RNA complexes observed by electron microscopy, showing the formation of globular polymers with heterogeneous sizes.
Figure 6 with 1 supplement
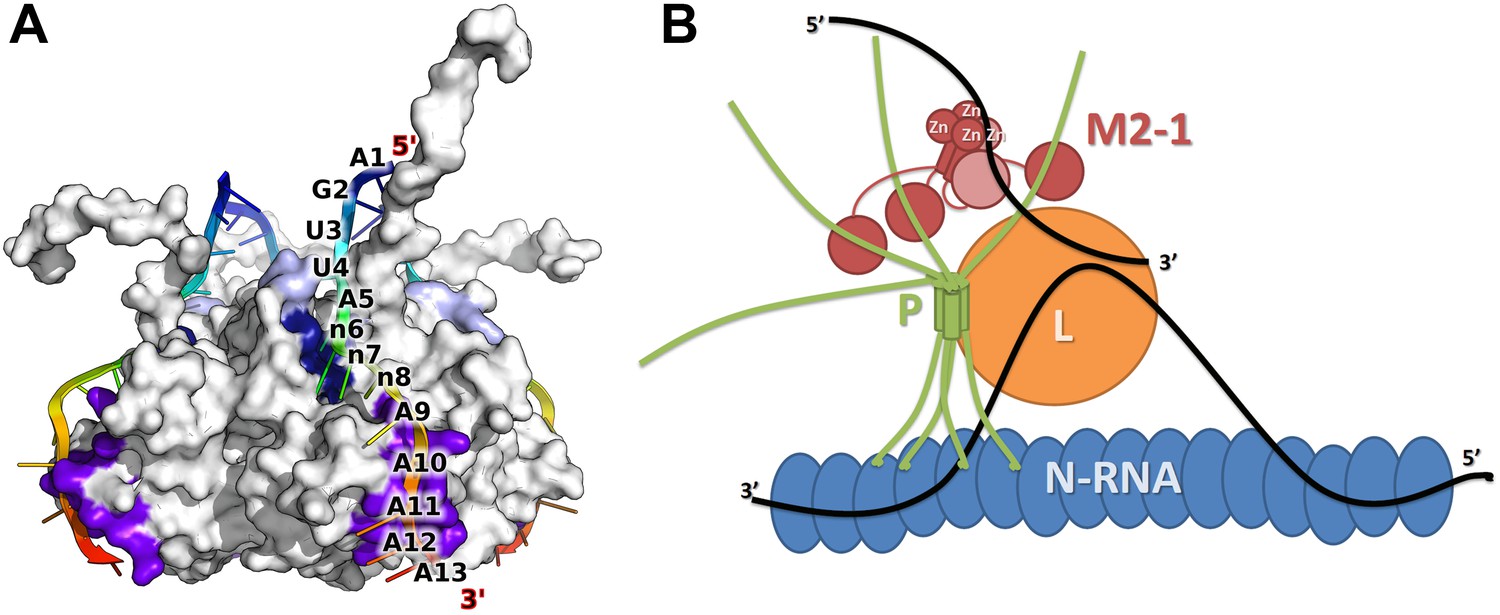
Model of M2-1 recognition of RNA and association with the viral transcription complex.
(A) Proposed model of the recognition of the consensus gene end RNA sequence 5′-AGUUAnnnAAAAA-3′ by M2-1. The model of M2-1 in its closed state is shown in white surface representation. Residues from the core domain involved in RNA binding are coloured in purple, residues from the zinc finger in dark blue, and positively charged residues identified in RSV are shown in light blue. The RNA molecule is shown in cartoon representation and coloured from blue to red (5′ to 3′) and the RNA sequence is mapped onto the model. (B) Hypothetical model of co-transcriptional recognition of viral mRNA by M2-1 in the context of the HMPV viral transcription complex. The nucleocapsid is represented in blue, and associates with RNA (black line) and with the tetrameric P protein in green. The P protein binds the viral polymerase L (orange) and the M2-1 tetramer, which is shown in red. RNA-induced conformational changes upon recognition of A-rich RNA sequences by M2-1 (gene ends or viral mRNA polyA tails) are illustrated by the closure of a single subunit bound to single-stranded RNA (light red).
Figure 6—figure supplement 1
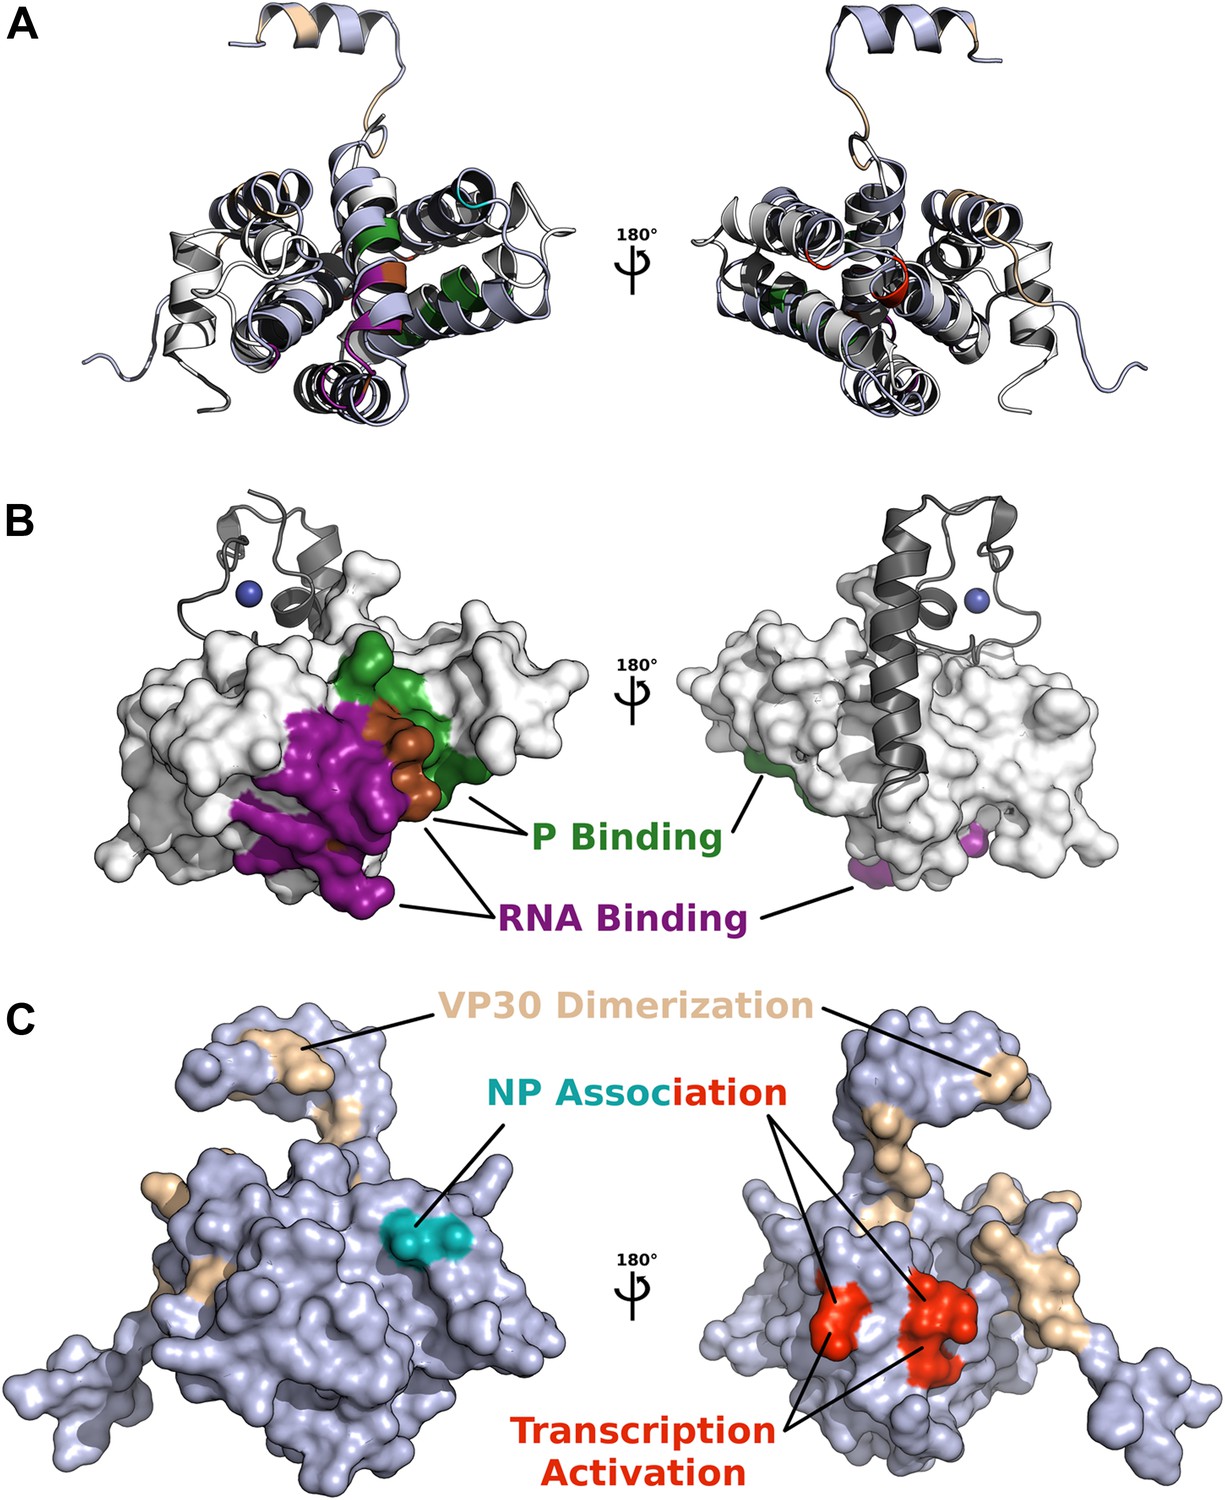
Comparison of functionally important surfaces identified in pneumivirinae M2-1 and filoviridae VP30 core domains, based on structural alignment by secondary structure matching (shown as cartoons in A).
(B) The core domain of HMPV M2-1 is shown as a white surface, and the interacting zinc finger and tetramerization helix are shown in grey cartoon. Surfaces involved in RNA and P binding are shown in purple and green, respectively. The region shown in brown represents residues that bind both P and RNA. (C) The core domain of Ebola virus VP30, structurally aligned to M2-1, is shown as a slate surface, residue E197 that affects EBOV NP association is shown in cyan, residues R179, K180, and K183 that were found to decrease NP association and inhibit transcription activation are coloured in red, and residues involved in dimerization are shown in wheat.
Tables
Table 1
X-ray data collection and refinement statistics
| Data Set | MAD–Peak | MAD–High-Energy Remote | Native | AMP-Soak | DNA-Soak |
|---|---|---|---|---|---|
| Data collection and processing statistics | |||||
| λ (Å) | 1.2828 | 1.2802 | 0.9686 | 0.9686 | 0.9795 |
| Resolution range (Å) | 33.13–2.47 | 33.13–2.51 | 44.81–2.10 | 49.80–2.01 | 63.04–2.28 |
| Space group | P21 | P21 | P21 | P21 | P21 |
| Unit cell constants (Å)/(°) | 50.2, 92.7, 82.8/90.0, 94.5, 90.0 | 50.0, 93.4, 85.2/90.0, 95.4, 90.0 | 50.1, 93.6, 85.6/90.0, 95.8, 90.0 | 50.1, 93.9, 85.5/90.0, 95.8, 90.0 | |
| Measured Reflections | 182, 655 | 167, 780 | 538, 740 | 660, 719 | 235, 027 |
| Unique Reflections | 27, 190 | 25, 798 | 45, 494 | 51, 659 | 35, 938 |
| Completeness (%) (outer shell) | 99.8 (99.9) | 99.9 (99.7) | 99.8 (99.2) | 98.8 (85.1) | 99.7 (98.8) |
| Multiplicity (%) (outer shell) | 6.7 (6.7) | 6.5 (3.3) | 11.8 (5.8) | 12.8 (5.1) | 6.5 (5.0) |
| Rpim (outer shell) | 0.039 (0.604) | 0.031 (0.367) | 0.021 (0.420) | 0.019 (0.401) | 0.023 (0.421) |
| Rmerge (outer shell) | 0.078 (1.338) | 0.062 (0.516) | 0.074 (0.937) | 0.068 (0.839) | 0.054 (0.843) |
| Mean (<I>/sd <I>) (outer shell) | 12.2 (1.7) | 14.9 (1.9) | 23.1 (2.0) | 22.5 (1.8) | 19.6 (1.8) |
| Refinement and Ramachandran statistics | |||||
| Rwork (%) | 23.34 | 19.23 | 18.64 | 19.35 | |
| Rfree (%) | 26.15 | 22.20 | 20.83 | 22.21 | |
| RMSD Bond lengths (Å) | 0.012 | 0.009 | 0.010 | 0.009 | |
| RMSD Bond angles (°) | 1.18 | 1.00 | 0.96 | 1.03 | |
| Residues in preferred regions (%) | 95.3 | 97.8 | 97.3 | 97.3 | |
| Residues in allowed regions (%) | 3.9 | 2.2 | 2.4 | 2.4 | |
| Outliers (%) | 0.8 | 0.0 | 0.3 | 0.3 | |
| PDB ID | 4CS7 | 4CS8 | 4CS9 | 4CSA | |
Table 2
SAXS-derived parameters
| Buffer conditions | c (mg/ml) | MW (kDa) | Rg (nm) | Dmax (nm) | χexp |
|---|---|---|---|---|---|
| 20 mM Tris pH 7.5 300 mM NaCl 1 M NDSB-201 | 2.00 | 93 | 4.09 | 13.71 | 0.983 |
| – | 1.50 | 89 | 3.90 | 13.22 | 0.908 |
| – | 1.00 | 82 | 3.84 | 13.01 | 0.857 |
| 20 mM Tris pH 7.5 150 mM NaCl 500 mM NDSB-201 | 0.75 | 87 | 3.52 | 12.60 | 0.839 |
| 20 mM Tris pH 7.5 150 mM NaCl 500 mM NDSB-201 + 1 M Gdn-HCl | 0.50 | 124 | 4.24 | 14.50 | 0.829 |
| 20 mM Tris pH 7.5 150 mM NaCl 500 mM NDSB-201 + 2 M Gdn-HCl | 0.50 | 140 | 4.72 | 15.34 | 0.856 |
| 20 mM Tris pH 7.5 150 mM NaCl 500 mM NDSB-201 + 3 M Gdn-HCl | 0.50 | 88 | 5.24 | 18.35 | 0.893 |
| 20 mM Tris pH 7.5 1.15 M NaCl 250 mM AMP | 1.80 | 85 | 4.30 | 14.70 | 0.986 |
| 20 mM Tris pH 7.5 150 mM NaCl 250 mM AMP | 2.00 | 97/78* | 4.01 | 13.26 | >10 |
| 20 mM Tris pH 7.5 150 mM NaCl 500 mM NDSB-201 250 mM AMP | 0.75 | 90 | 3.91 | 13.70 | 0.814 |
| 20 mM Tris pH 7.5 150 mM NaCl 500 mM NDSB-201 250 mM UMP | 0.75 | 92 | 3.86 | 13.50 | 0.843 |
| 20 mM Tris pH 7.5 150 mM NaCl 500 mM NDSB-201 250 mM CMP | 0.75 | 87 | 3.99 | 13.98 | 0.808 |
| 20 mM Tris pH 7.5 150 mM NaCl 500 mM NDSB-201 + 5 mM EDTA | 0.75 | 82 | 3.86 | 14.2 | 0.927 |
| 20 mM Tris pH 7.5 575 mM NaCl | 0.4 | 234 | 4.83 | 17.2 | N.D |
| 20 mM Tris pH 7.5 3 M NaCl | 0.4 | 463 | 8.62 | 26.7 | N.D |
| 20 mM Tris pH 7.5 1.15 M NaCl | 0.4 | 178 | 5.77 | 20.10 | N.D |
| 20 mM Tris pH 7.5 1.15 M NaCl | 0.90 | 254 | 5.91 | 20.50 | N.D |
| 20 mM Tris pH 7.5 1.15 M NaCl | 1.50 | 305 | 6.10 | 21.30 | N.D |
| 20 mM Tris pH 7.5 1.15 M NaCl | 3.00 | 580 | 7.20 | 25.20 | N.D |
-
*
97 kDa assuming 90% protein + 10% RNA and 78 kDa assuming only protein.
Download links
A two-part list of links to download the article, or parts of the article, in various formats.
Downloads (link to download the article as PDF)
Open citations (links to open the citations from this article in various online reference manager services)
Cite this article (links to download the citations from this article in formats compatible with various reference manager tools)
Drastic changes in conformational dynamics of the antiterminator M2-1 regulate transcription efficiency in Pneumovirinae
eLife 3:e02674.
https://doi.org/10.7554/eLife.02674


