Molecular mechanism for Rabex-5 GEF activation by Rabaptin-5
- Institute of Biochemistry and Cell Biology, Shanghai Institutes for Biological Sciences, Chinese Academy of Sciences, China
- Wuhan Institute of Physics and Mathematics, Chinese Academy of Sciences, China
Figures
Figure 1 with 5 supplements
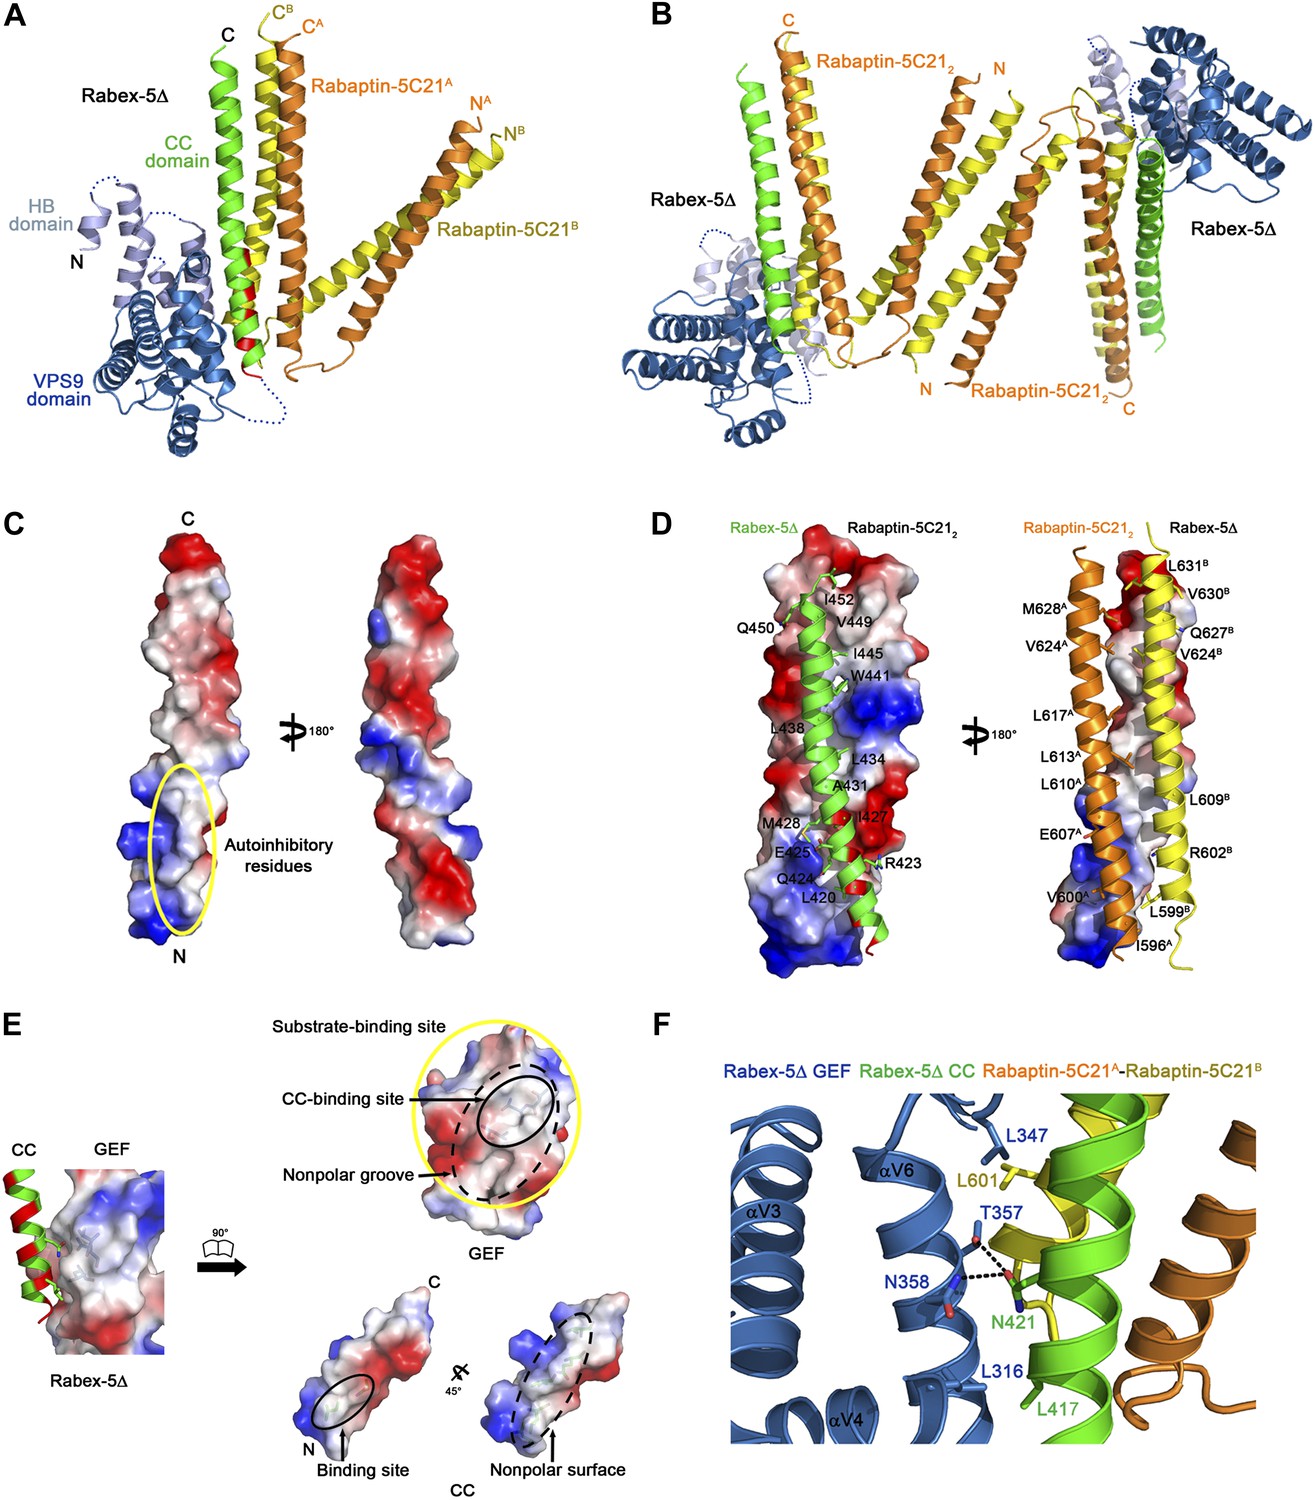
Crystal structure of the Rabex-5Δ-Rabaptin-5C212 complex.
(A) A ribbon representation of the overall structure of the Rabex-5Δ-Rabaptin-5C212 complex. The HB and Vps9 domains of the Rabex-5 GEF domain are colored in light blue and dark blue, respectively, and the Rabex-5 CC domain (Rabex-5CC) in green. The two Rabaptin-5C21 are designated with superscripts A and B, and colored in orange and dark yellow, respectively. The disordered loops of the HB domain (residues 149, 161–162, 174, 190–204, and 220–230) and the linker between the GEF and CC domains (residues 369–412Δ393-407) are indicated with dotted lines. The autoinhibitory residues of Rabex-5CC are marked in red. (B) The dimeric Rabex-5Δ-Rabaptin-5C212 complex. (C) An electrostatic surface representation of the amphipathic α-helix of Rabex-5CC. The autoinhibitory residues are located on the N-terminal of the nonpolar surface as indicated with a yellow circle. (D) Interactions between Rabex-5CC and Rabaptin-5C212. Left panel: Rabex-5CC is shown in ribbon representation and Rabaptin-5C212 in electrostatic surface representation. Right panel: Rabex-5CC is shown in electrostatic surface representation and Rabaptin-5C212 in ribbon representation. The interacting residues are shown with side chains. The detailed interactions is available in the Figure 1—source data 1. (E) An electrostatic surface representation of the interactions between the GEF and CC domains of Rabex-5Δ. (F) A close-up view of the interactions of the GEF domain with Rabex-5CC and Rabaptin-5C21. The interacting residues are shown with side chains and the hydrogen bonds are indicated with dotted lines.
-
Figure 1—source data 1
Interactions between Rabex-5CC and Rabaptin-5C21 in the Rabex-5Δ-Rabaptin-5C212 complex.
- https://doi.org/10.7554/eLife.02687.005
-
Figure 1—source data 2
Interactions between Rabex-5CC and Rabaptin-5C21 in the Rabex-5CC-Rabaptin-5C212 complex.
- https://doi.org/10.7554/eLife.02687.006
Figure 1—figure supplement 1
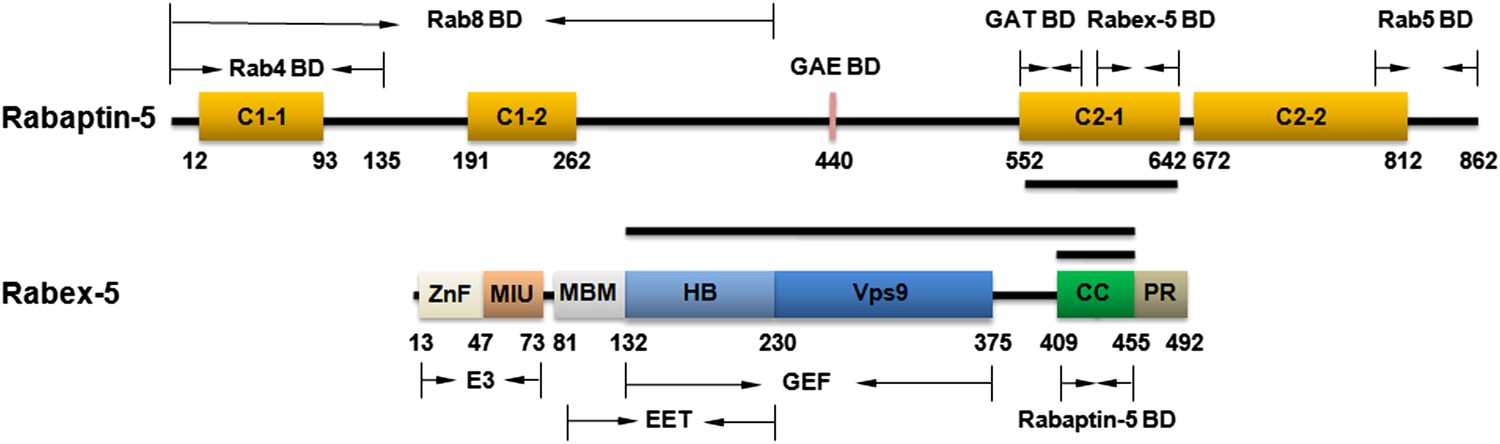
Schematic diagrams showing the domain organizations of Rabex-5 and Rabaptin-5.
Rabex-5 consists of a zinc finger (ZnF) domain, a motif interacting with ubiquitin (MIU) domain, a membrane binding motif (MBM) domain, a helical bundle (HB) domain, a Vps9 domain, a coiled-coil (CC) domain, and a proline-rich region (PR) (Delprato et al., 2004; Mattera et al., 2006; Delprato and Lambright, 2007; Zhu et al., 2007). The MBM and HB domains compose the early endosomal targeting (EET) domain. The HB and Vps9 domains compose the GEF domain. The CC domain contains the binding site for Rabaptin-5 as well as an autoinhibitory element for its GEF activity. Rabaptin-5 consists of four coiled-coil domains designated as C1-1, C1-2, C2-1, and C2-2 (Vitale et al., 1998; Mattera et al., 2003; Miller et al., 2003; Zhu et al., 2004a; Zhu et al., 2004b; Mattera et al., 2006; Omori et al., 2008). The binding regions for Rab4, Rab5, Rab8, and the GAE and GAT domains of GGAs are indicated. The C-terminal part of the C2-1 domain contains the binding site for Rabex-5. The segments of Rabex-5 and Rabaptin-5 whose structures are determined in this work are indicated with black bars. The color scheme of the domains is adopted in all the Figure in this work unless otherwise specified.
Figure 1—figure supplement 2
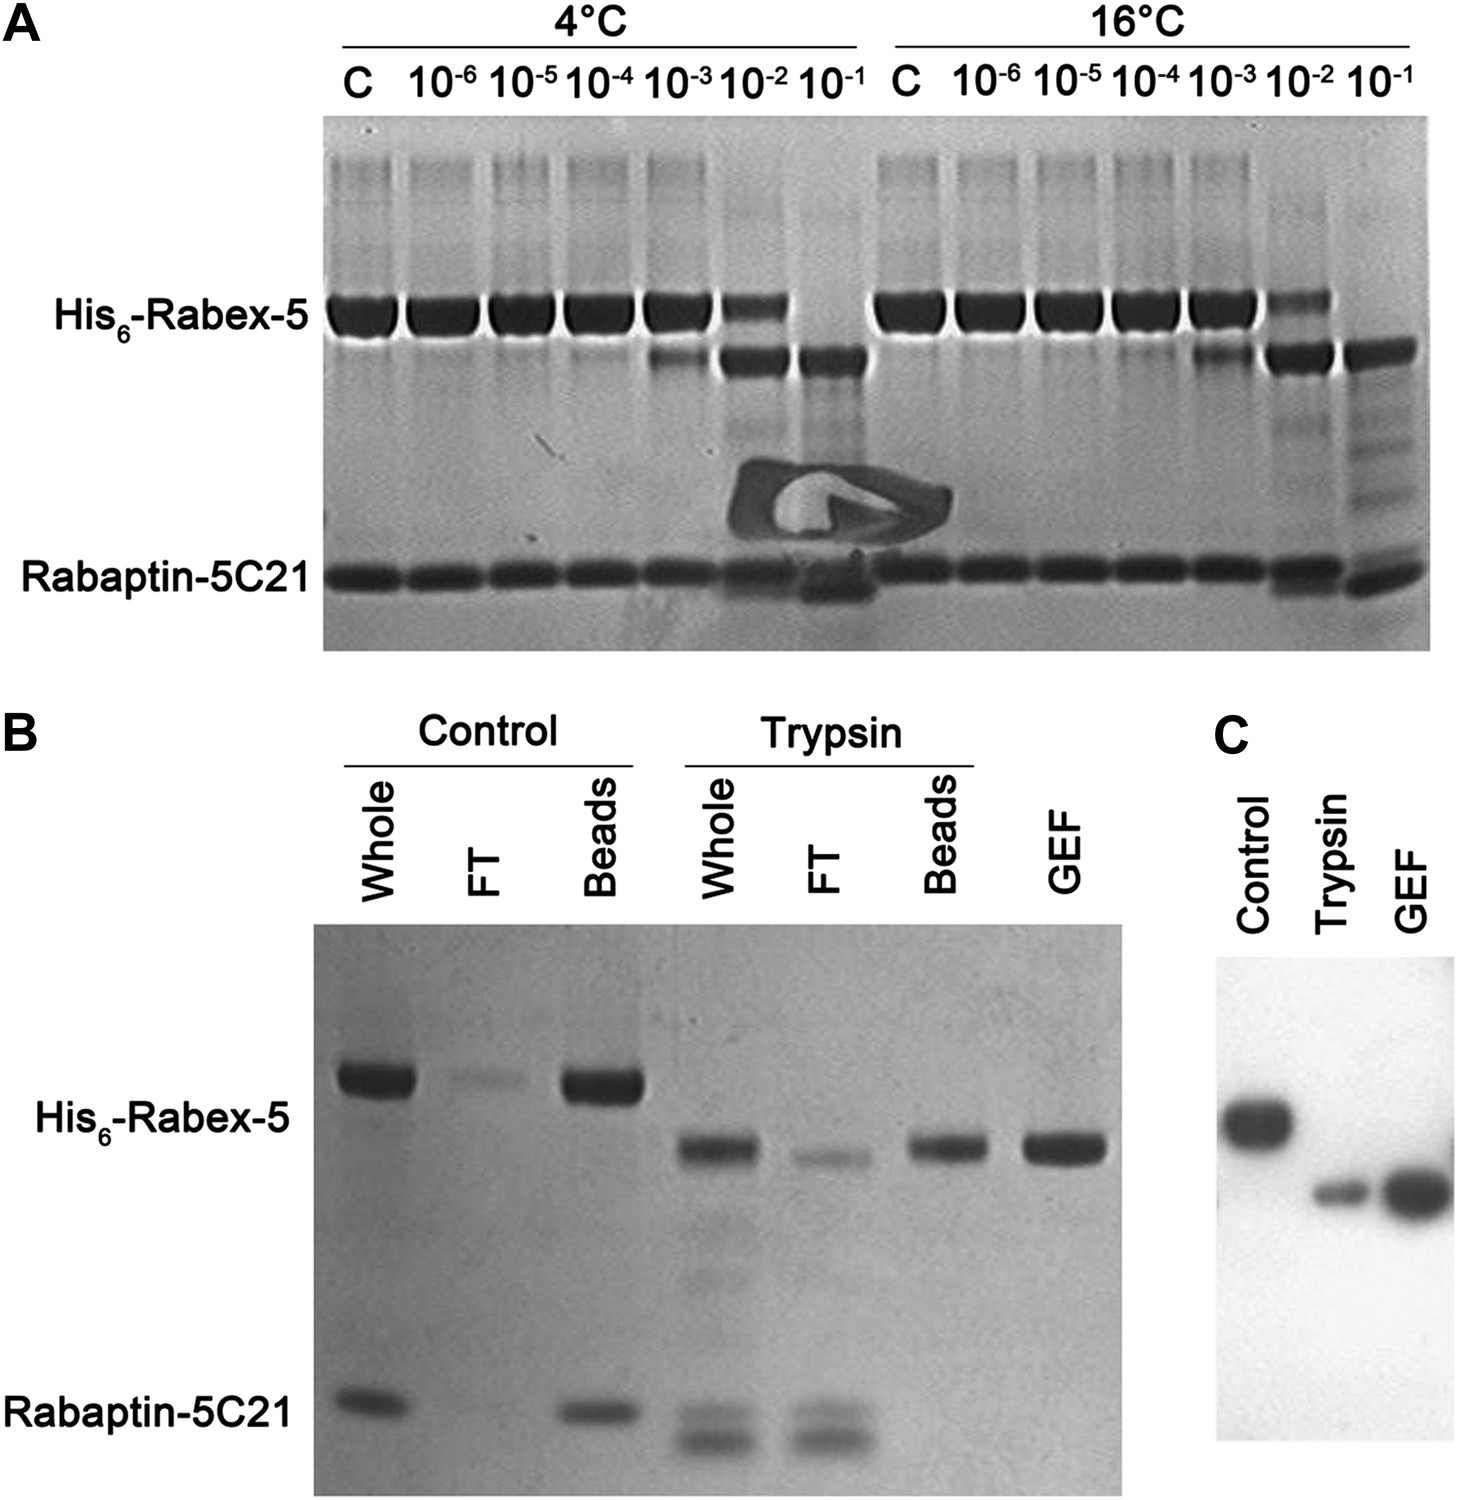
Trypsin digestion of the Rabex-5-Rabaptin-5C21 complex.
(A) Trypsin digestion of the Rabex-5-Rabaptin-5C21 complex. At high concentration of trypsin, Rabex-5 is proteolyzed to a stable fragment with a molecular mass similar to the GEF domain. (B) Affinity chromatography analysis and (C) Western blot analysis of the Rabex-5-Rabaptin-5C21 complex treated with and without trypsin. The N-terminus of Rabex-5 is attached with a His6 tag. After trypsin digestion, the remaining Rabex-5 fragment can still bind to the Ni-NTA beads and be detected by anti-His antibody, suggesting that the N-terminal part is intact and the proteolytic site lies in the linker between the GEF and CC domains.
Figure 1—figure supplement 3
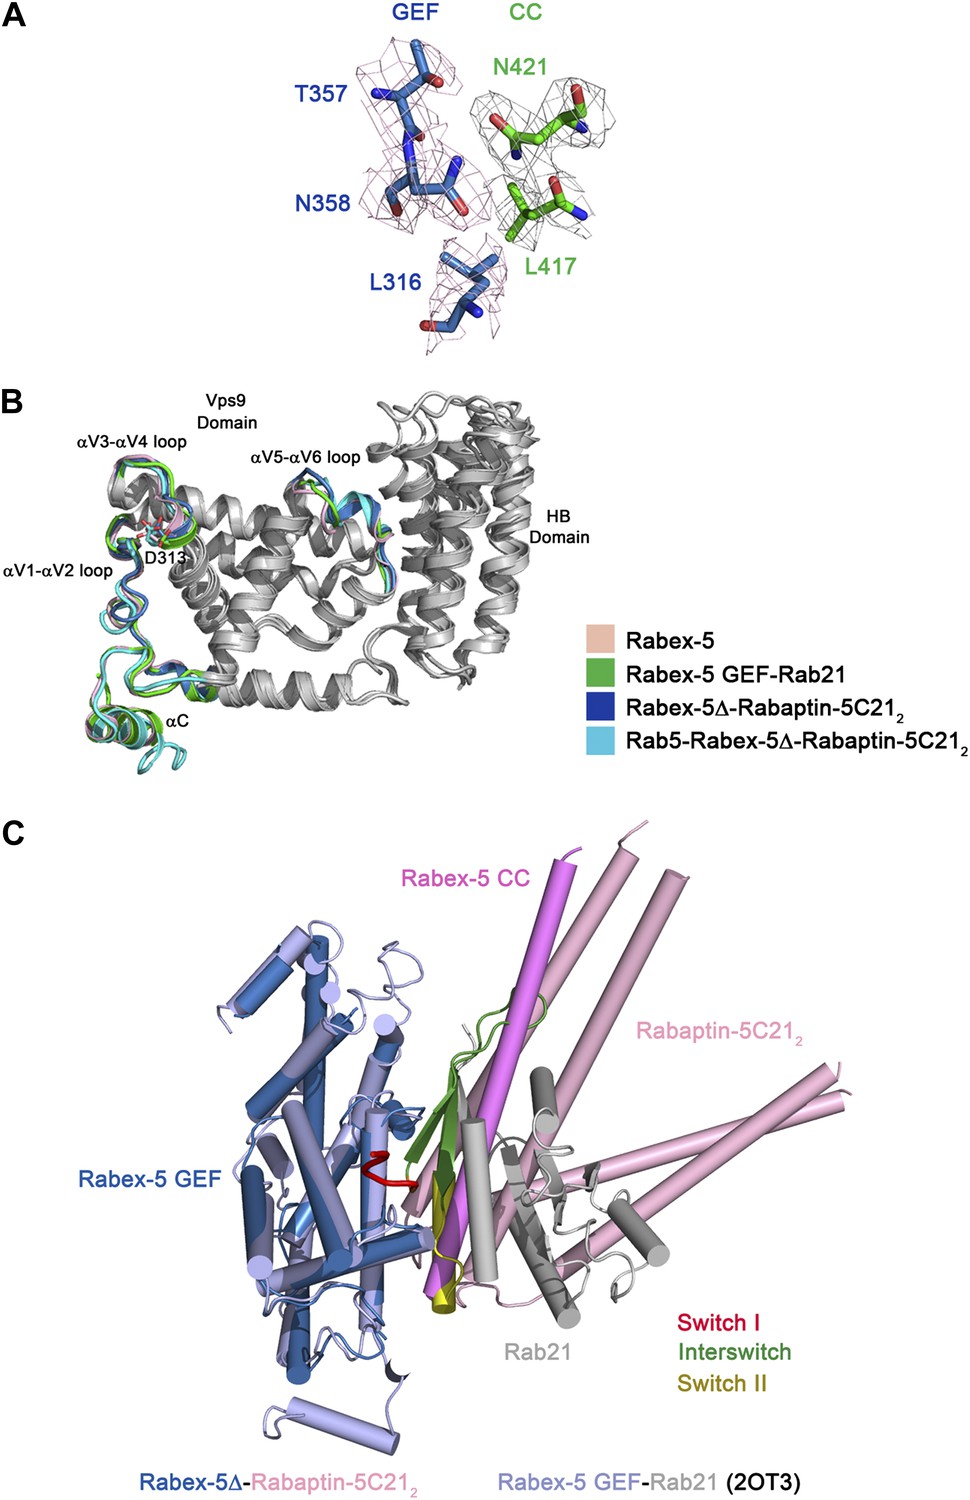
Comparison of the Rabex-5 GEF domain in different structures.
(A) Representative simulated annealing composite omit map of the Rabex-5Δ-Rabaptin-5C212 complex. The map is contoured at 1.0σ with the final structure shown in stick model. (B) Superposition of the Rabex-5 GEF domain alone (pink, PDB code 1TXU) (Delprato et al., 2004), in the Rabex-5 GEF-Rab21 complex (green, PDB code 2OT3) (Delprato and Lambright, 2007), in the Rabex-5Δ-Rabaptin-5C212 complex (blue), and in the Rab5-Rabex-5Δ-Rabaptin-5C212 complex (cyan). The overall structure of the GEF domain in these structures is very similar with RMSD of ∼0.90 Å for 228 Cα atoms. Only slight conformational differences are observed in the αV1-αV2, αV3-αV4, and αV5-αV6 loops which are involved in the substrate binding. The regions with similar conformations are colored in gray and the regions with slightly varied conformations are marked in different colors. The invariant “aspartic acid finger” Asp313 in the αV3- αV4 loop is shown with side chain. (C) Superposition of the Rabex-5Δ-Rabaptin-5C212 complex and the Rabex-5 GEF-Rab21 complex. For the Rabex-5Δ-Rabaptin-5C212 complex, the GEF and CC domains of Rabex-5 are colored in blue and violet, respectively, and Rabaptin-5C212 in pink. For the Rabex-5 GEF-Rab21 complex, the Rabex-5 GEF domain is colored in light blue; switch I, interswitch, and switch II of Rab21 are colored in red, green and dark yellow, respectively, and the rest region in gray. The substrate-binding site of Rabex-5 in the Rabex-5Δ-Rabaptin-5C212 complex is partially occupied by the three-helix bundle formed by Rabex-5CC and Rabaptin-5C212.
Figure 1—figure supplement 4
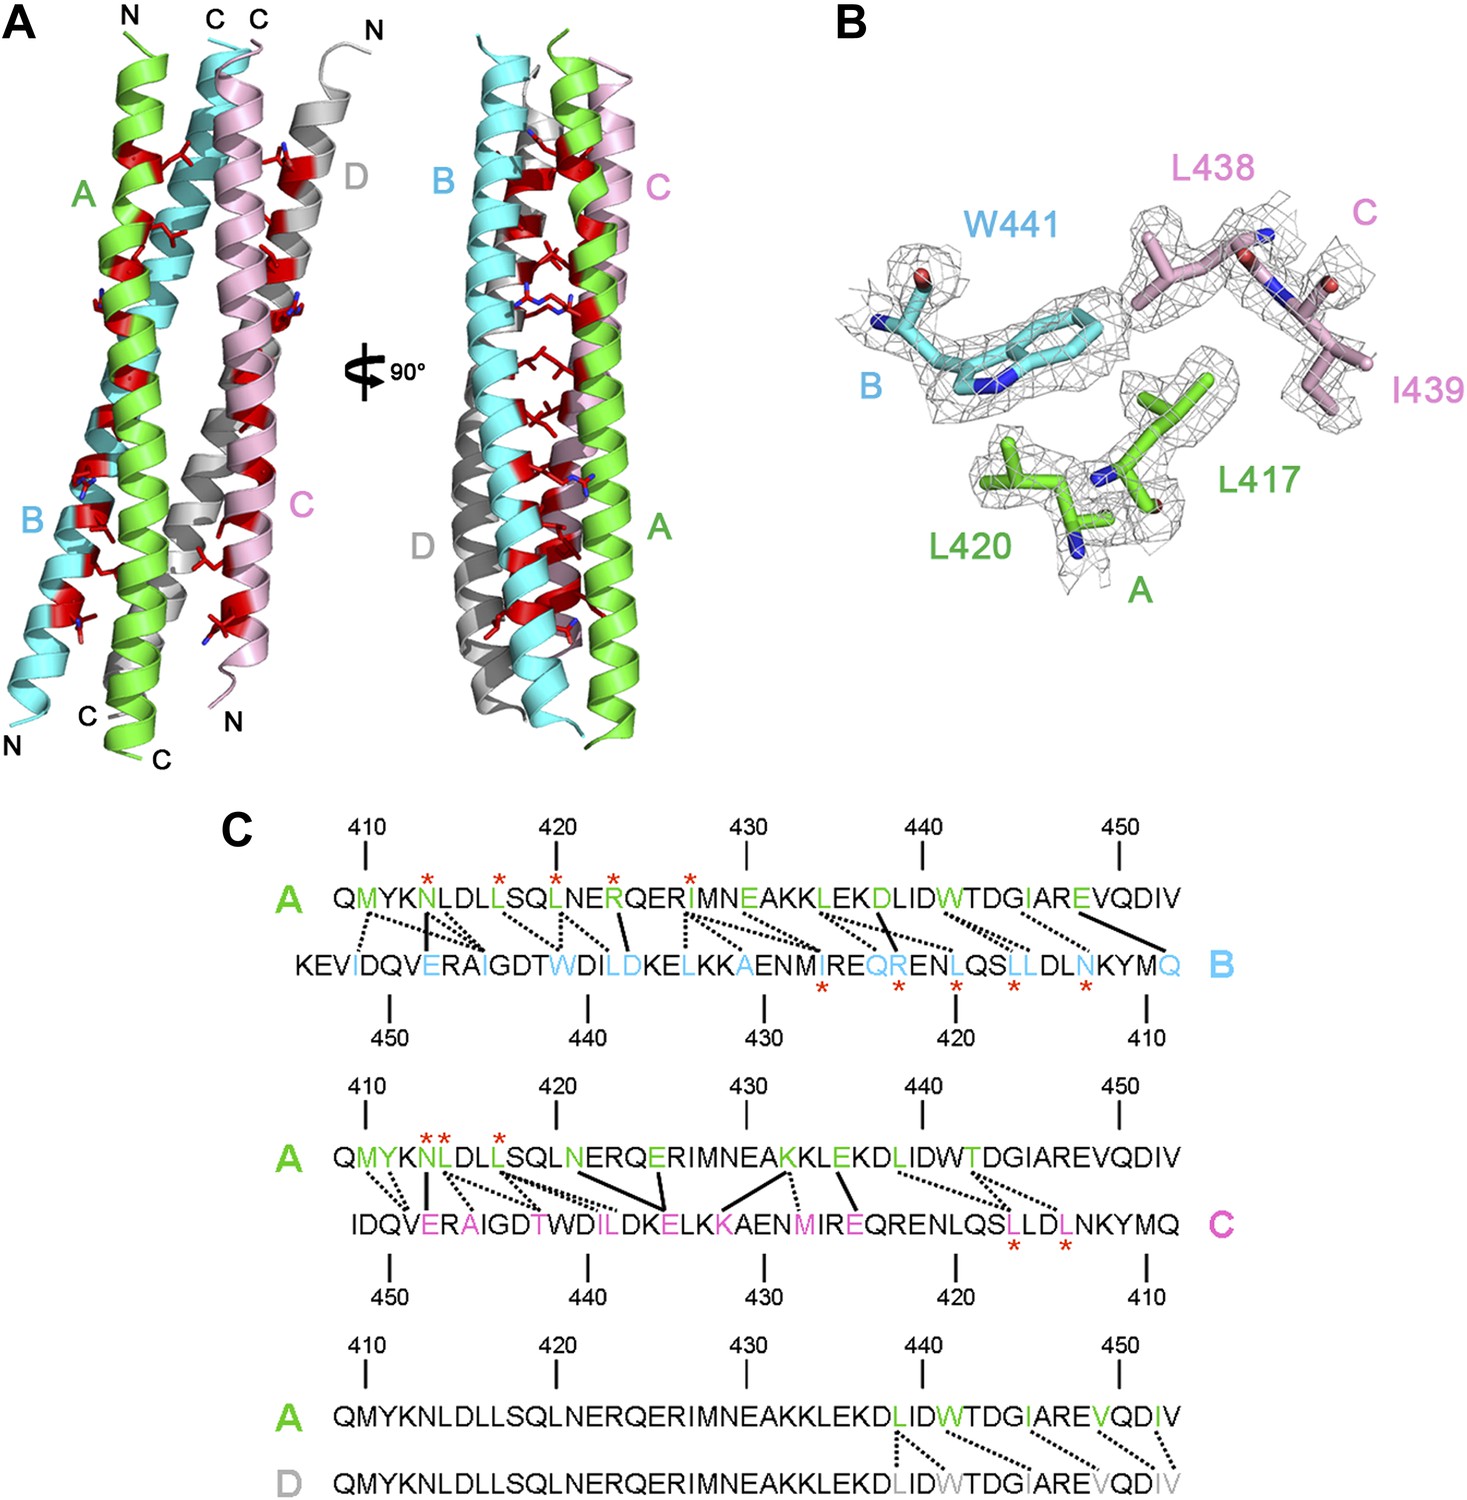
Crystal structure of Rabex-5CC.
(A) A ribbon representation of the overall structure of Rabex-5CC. There are four Rabex-5CC in the asymmetric unit with monomers A, B, C, and D shown in green, cyan, pink, and gray, respectively; two of them (monomers A and B or C and D) dimerize in anti-parallel to form a two-helix bundle and the two dimers further dimerize to form a tight four-helix bundle. Each monomer interacts via the nonpolar surface with the other three in a similar way. For example, monomer A interacts extensively with monomers B and C in anti-parallel which buries a total of solvent accessible surface area of 1880 Å2 and 1692 Å2, respectively, and interacts with monomer D through their C-terminal regions in parallel which buries a total of solvent accessible surface area of 490 Å2. Most of the residues responsible for the autoinhibition of the Rabex-5 GEF activity (Delprato and Lambright, 2007) (shown with side chains in red) are buried in the interaction interfaces. (B) Representative simulated annealing composite omit map of Rabex-5CC. The map is contoured at 1.0σ with the final structure shown in stick models. (C) A schematic diagram showing the interactions of monomer A with monomers B, C, and D. The interacting residues are colored the same as in (A). The hydrophilic interactions are indicated with solid lines and the hydrophobic interactions with dotted lines. The autoinhibitory residues are marked with red asterisks.
Figure 1—figure supplement 5
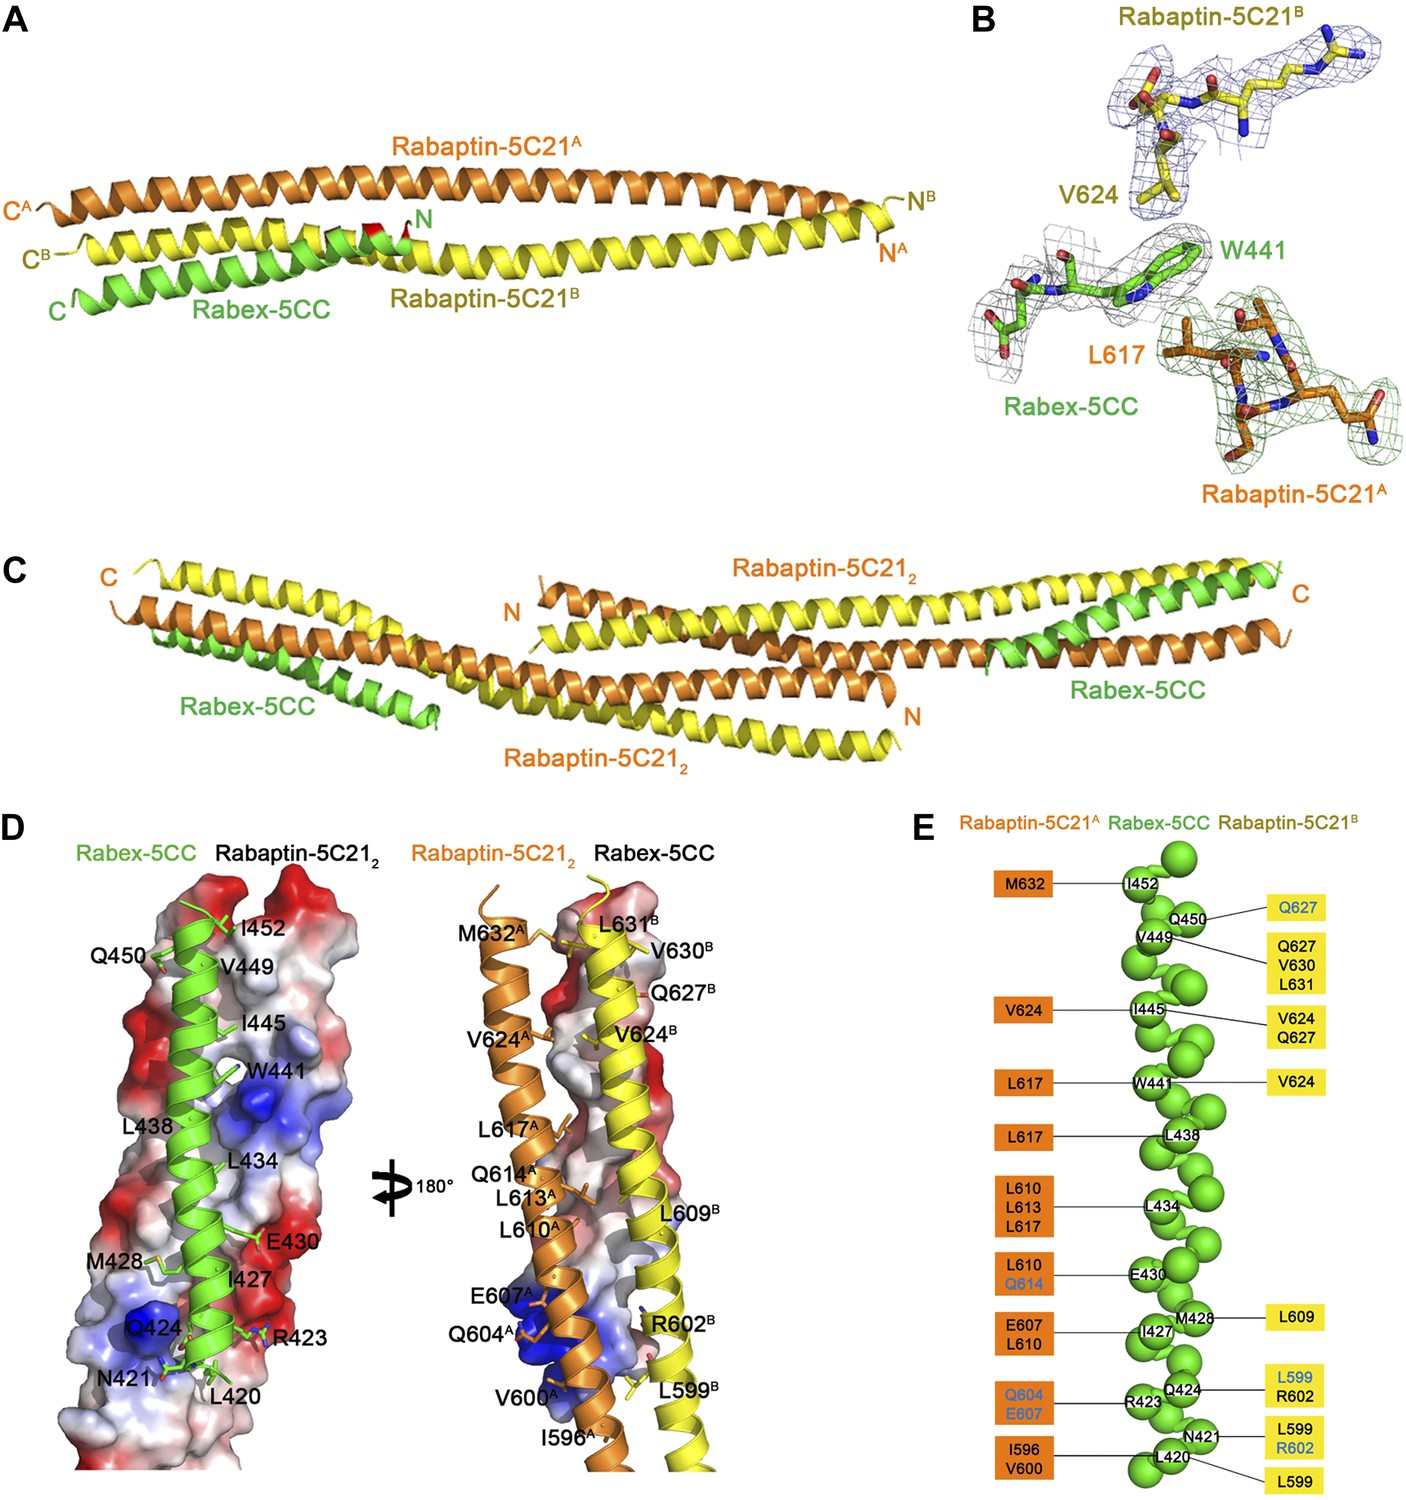
Crystal structure of the Rabex-5CC-Rabaptin-5C212 complex.
(A) A ribbon representation of the overall structure of the Rabex-5CC-Rabaptin-5C212 complex. Rabex-5CC is colored in green and the two Rabaptin-5C21 in orange and dark yellow, respectively. The autoinhibitory residues are colored in red. In this complex, Rabex-5CC forms a long α-helix with a length of 52 Å which is slightly shorter than that in the structures of Rabex-5CC (65 Å) and the Rabex-5Δ-Rabaptin-5C212 complex (60 Å) due to disordering of several N-terminal residues. Similar to the Rabex-5Δ-Rabaptin-5C212 complex, Rabex-5CC packs in parallel with the C-terminal regions of Rabaptin-5C212 to form a tight three-helix bundle with its nonpolar surface buried in a hydrophobic surface groove of Rabaptin-5C212 and a total of buried solvent accessible surface area of 2612 Å2. (B) Representative simulated annealing composite omit map of the Rabex-5CC-Rabaptin-5C212 complex. The map is contoured at 1.0σ with the final structure shown in stick model. (C) The dimeric Rabex-5CC-Rabaptin-5C212 complex. Two Rabex-5CC-Rabaptin-5C212 complexes related by a two-fold crystallographic symmetry form a dimer through the N-terminal regions (residues 552–592) of Rabaptin-5C212. (D) Interactions between Rabex-5CC and Rabaptin-5C212. Left panel: Rabex-5CC is shown in ribbon representation and Rabaptin-5C212 in electrostatic surface representation. Right panel: Rabex-5CC is shown in electrostatic surface representation and Rabaptin-5C212 in ribbon representation. The interacting residues are shown with side chains. The autoinhibitory residues of Rabex-5CC are involved in the interactions with Rabaptin-5C212. The interactions between Rabex-5CC and Rabaptin-5C212 are essentially the same as those in the Rabex-5Δ-Rabaptin-5C212 complex. (E) A schematic diagram showing the interactions of Rabex-5CC with Rabaptin-5C212. Rabex-5CC is shown with a ball model with the residues participating in the interactions labeled. Residues of Rabaptin-5C21A and Rabaptin-5C21B are shown on the left side and the right side, respectively, with those involved in the hydrophobic interactions colored in black and the hydrophilic interactions in blue. The detailed interactions are available in Figure 1—source data 2.
Figure 2 with 2 supplements
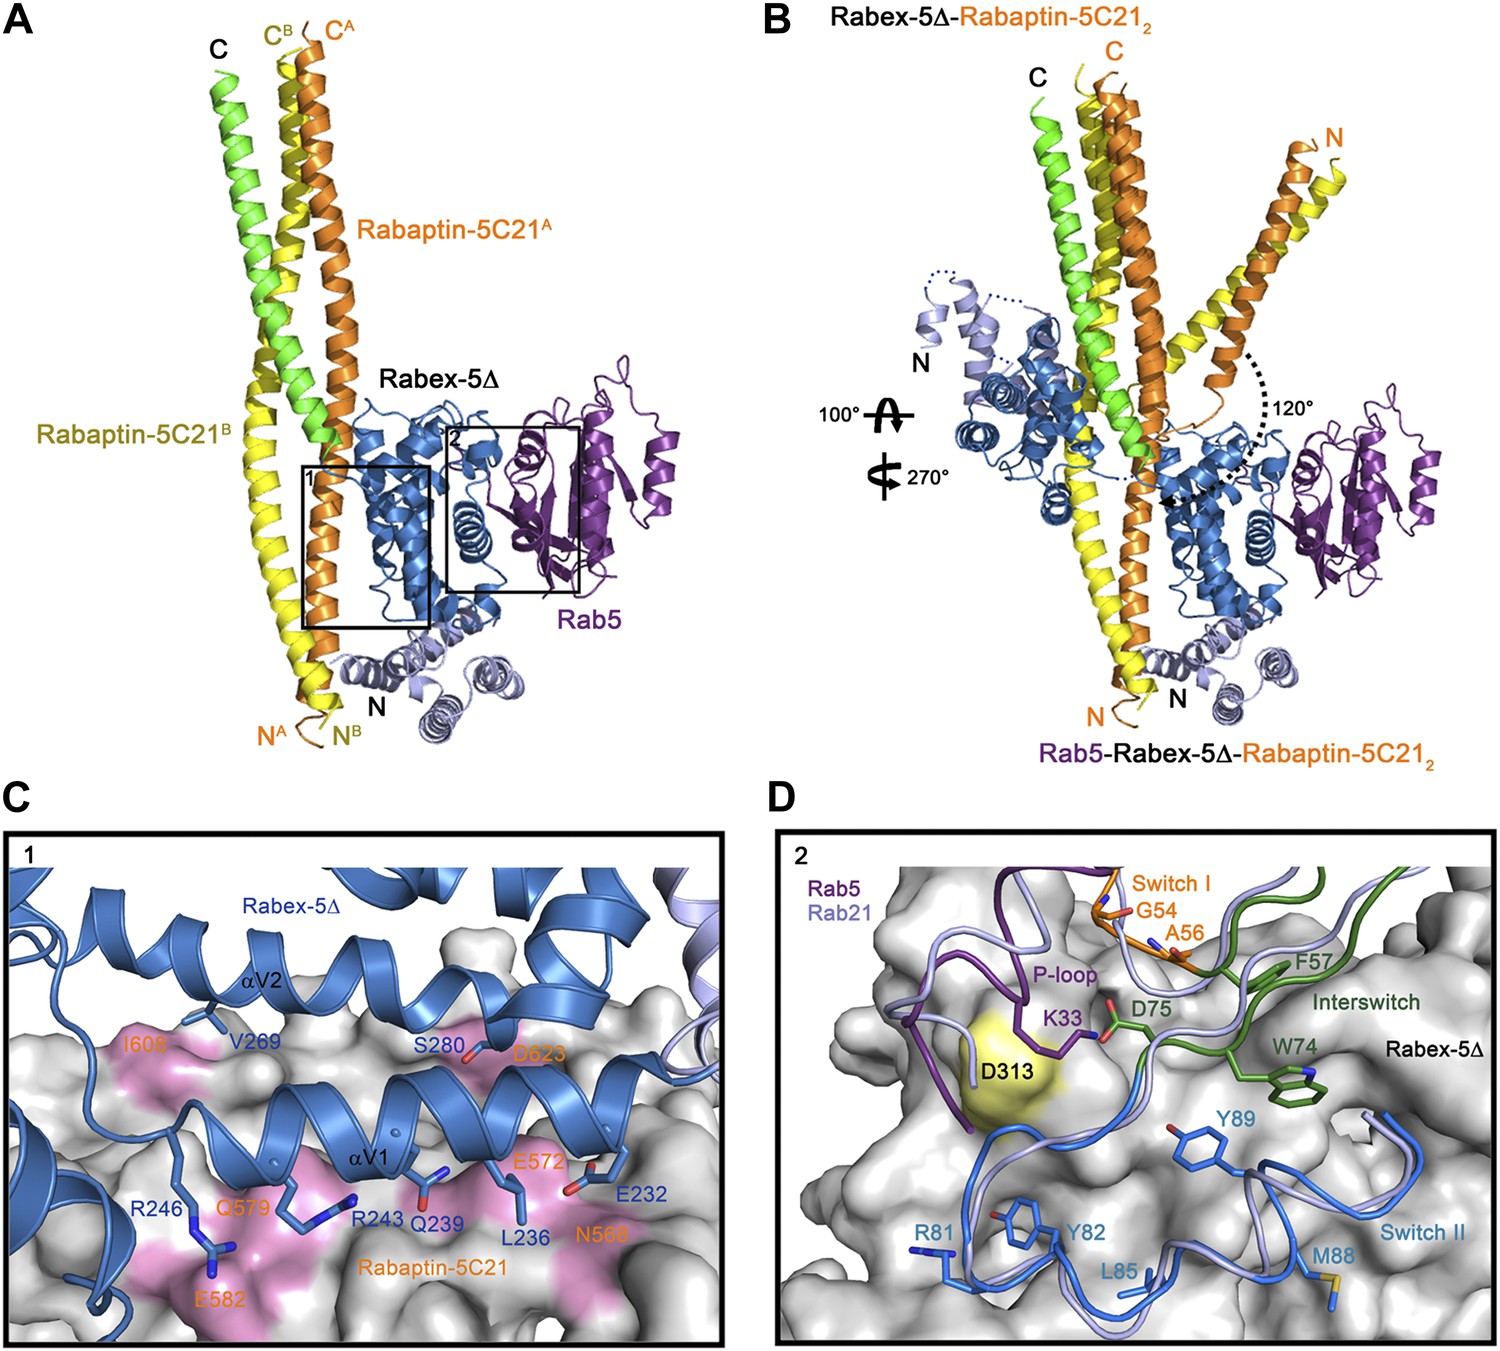
Crystal structure of the Rab5-Rabex-5Δ-Rabaptin-5C212 complex.
(A) A ribbon representation of the overall structure of the Rab5-Rabex-5Δ-Rabaptin-5C212 complex. Only one Rab5-Rabex5Δ-Rabaptin5C212 complex in the asymmetric unit is shown with Rab5 in purple and Rabex-5 and Rabaptin-5C21 in the same colors as in Figure 1A. (B) Comparison of the Rab5-Rabex-5Δ-Rabaptin-5C212 complex and the Rabex-5Δ-Rabaptin-5C212 complex based on superposition of the three-helix bundle formed by Rabex-5CC and the C-terminal regions of Rabaptin-5C212. (C) Interactions between the Rabex-5 GEF domain and Rabaptin-5C212. The GEF domain is shown in ribbon representation in blue and the interacting residues are shown with side chains. Rabaptin-5C212 is shown in surface representation with the interacting residues colored in pink. (D) Interactions between Rab5 and the Rabex-5 GEF domain. Rab5 is shown in coil representation with the P-loop, switch I, switch II, and interswitch region colored in purple, orange, blue, and dark green, respectively. Several key residues are shown with side chains. The GEF domain is shown in surface representation with Asp313 colored in yellow. For comparison, Rab21 in its complex with the Rabex-5 GEF domain (Delprato and Lambright, 2007) is shown in coil representation in light blue.
Figure 2—figure supplement 1
Crystal structure of the Rab5-Rabex-5Δ-Rabaptin-5C212 complex.
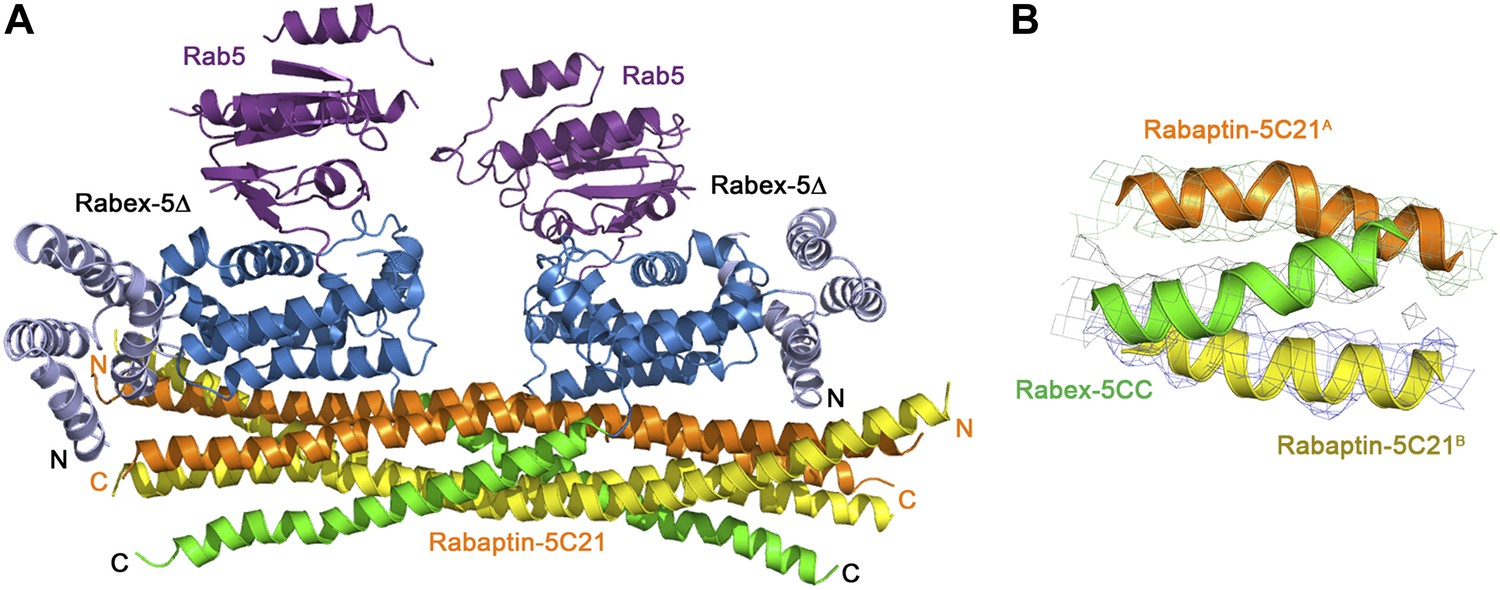
(A) A ribbon representation of the overall structure of the dimeric Rab5-Rabex-5Δ-Rabaptin-5C212 complex in an asymmetric unit. There are two Rab5-Rabex5-Rabaptin5C212 complexes related by a two-fold non-crystallographic symmetry in the asymmetric unit. Rab5, Rabex-5Δ, and Rabaptin-5C21 are colored the same as in Figure 2A. Rabaptin-5C21 and Rabex-5 are well defined in the electron density map; however, only one Rab5 is fairly defined while the other is poorly defined. (B) Representative simulated annealing composite omit map of the Rab5-Rabex-5Δ-Rabaptin-5C212 complex. The map is contoured at 1.0σ with the final structure shown in ribbon model.
Figure 2—figure supplement 2
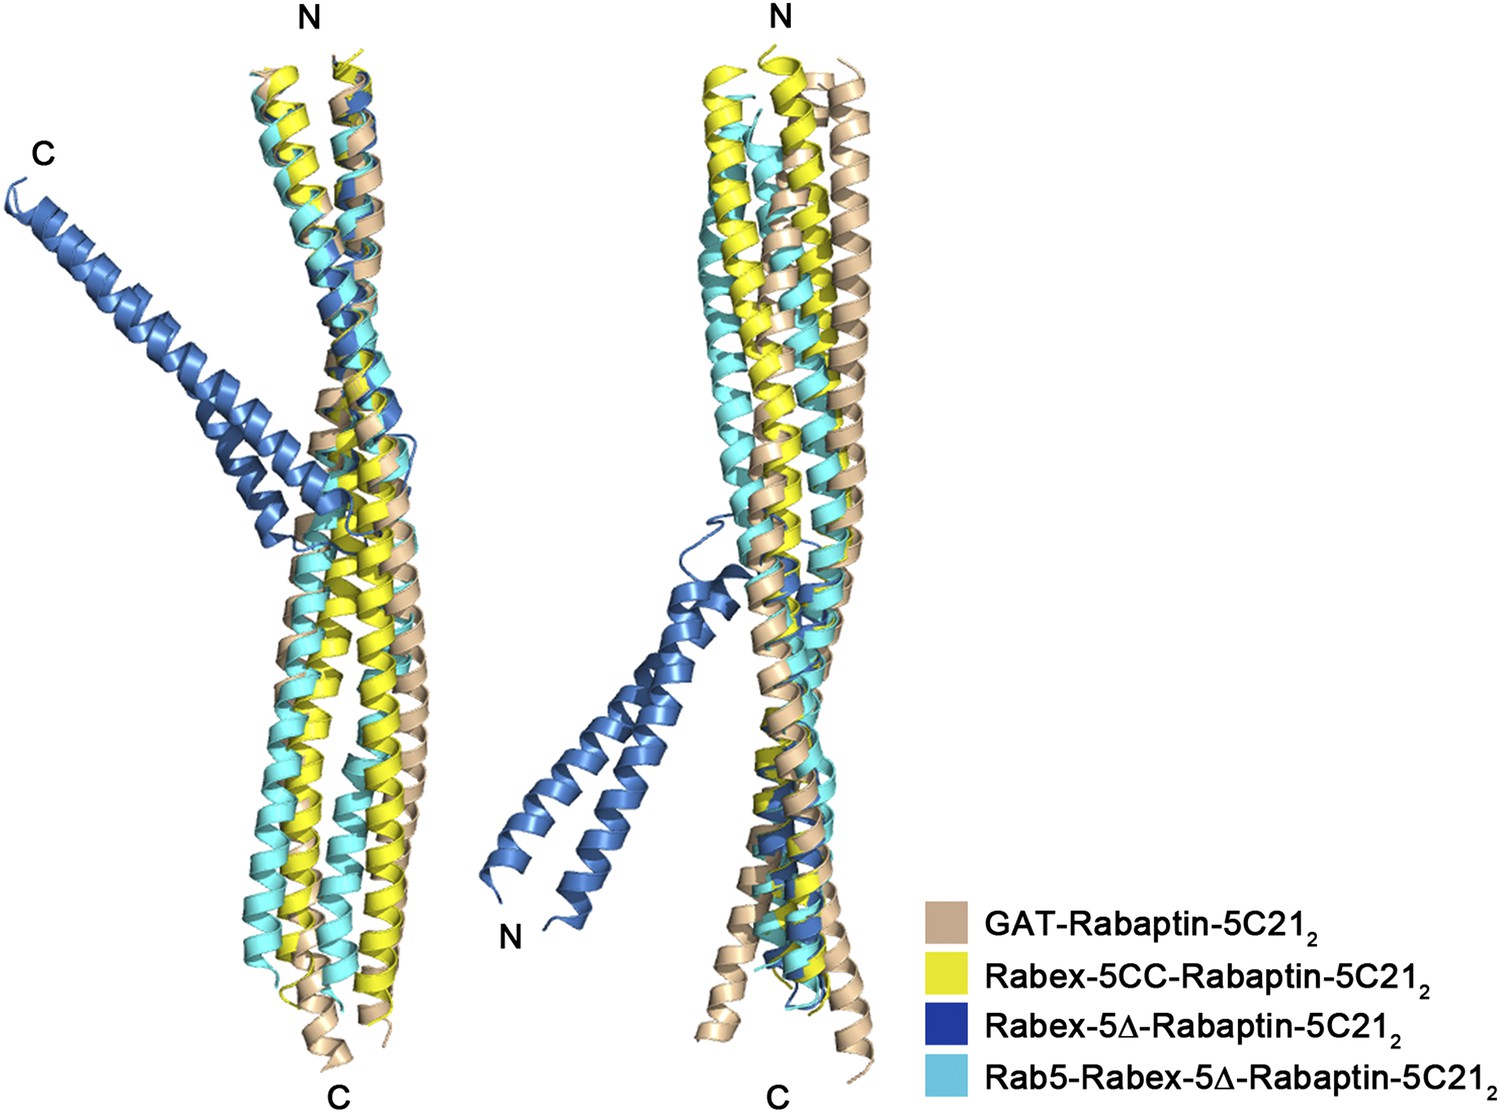
Superposition of Rabaptin-5C212 in different complexes.
Rabex-5CC-Rabaptin-5C212: yellow, Rabex-5Δ-Rabaptin-5C212: blue, Rab5-Rabex-5Δ-Rabaptin-5C212: cyan, and GAT-Rabaptin-5C212 (PDB code 1X79) (Zhu et al., 2004a): light orange. The N-terminal regions of Rabaptin-5C212 in these complexes can be superimposed well (RMSD of ∼1.0 Å for 31 Cα atoms) (left panel); however, the C-terminal regions cannot (RMSD of ∼3.6 Å for 42 Cα atoms) (right panel). The angle between the two regions also differs substantially which is about 40° in the Rabex-5Δ-Rabaptin-5C212 complex, and about 180° in the Rabex-5CC-Rabaptin-5C212 complex, the Rab5-Rabex-5Δ-Rabaptin-5C212 complex, and the GAT-Rabaptin-5C212 complex.
Figure 3 with 1 supplement
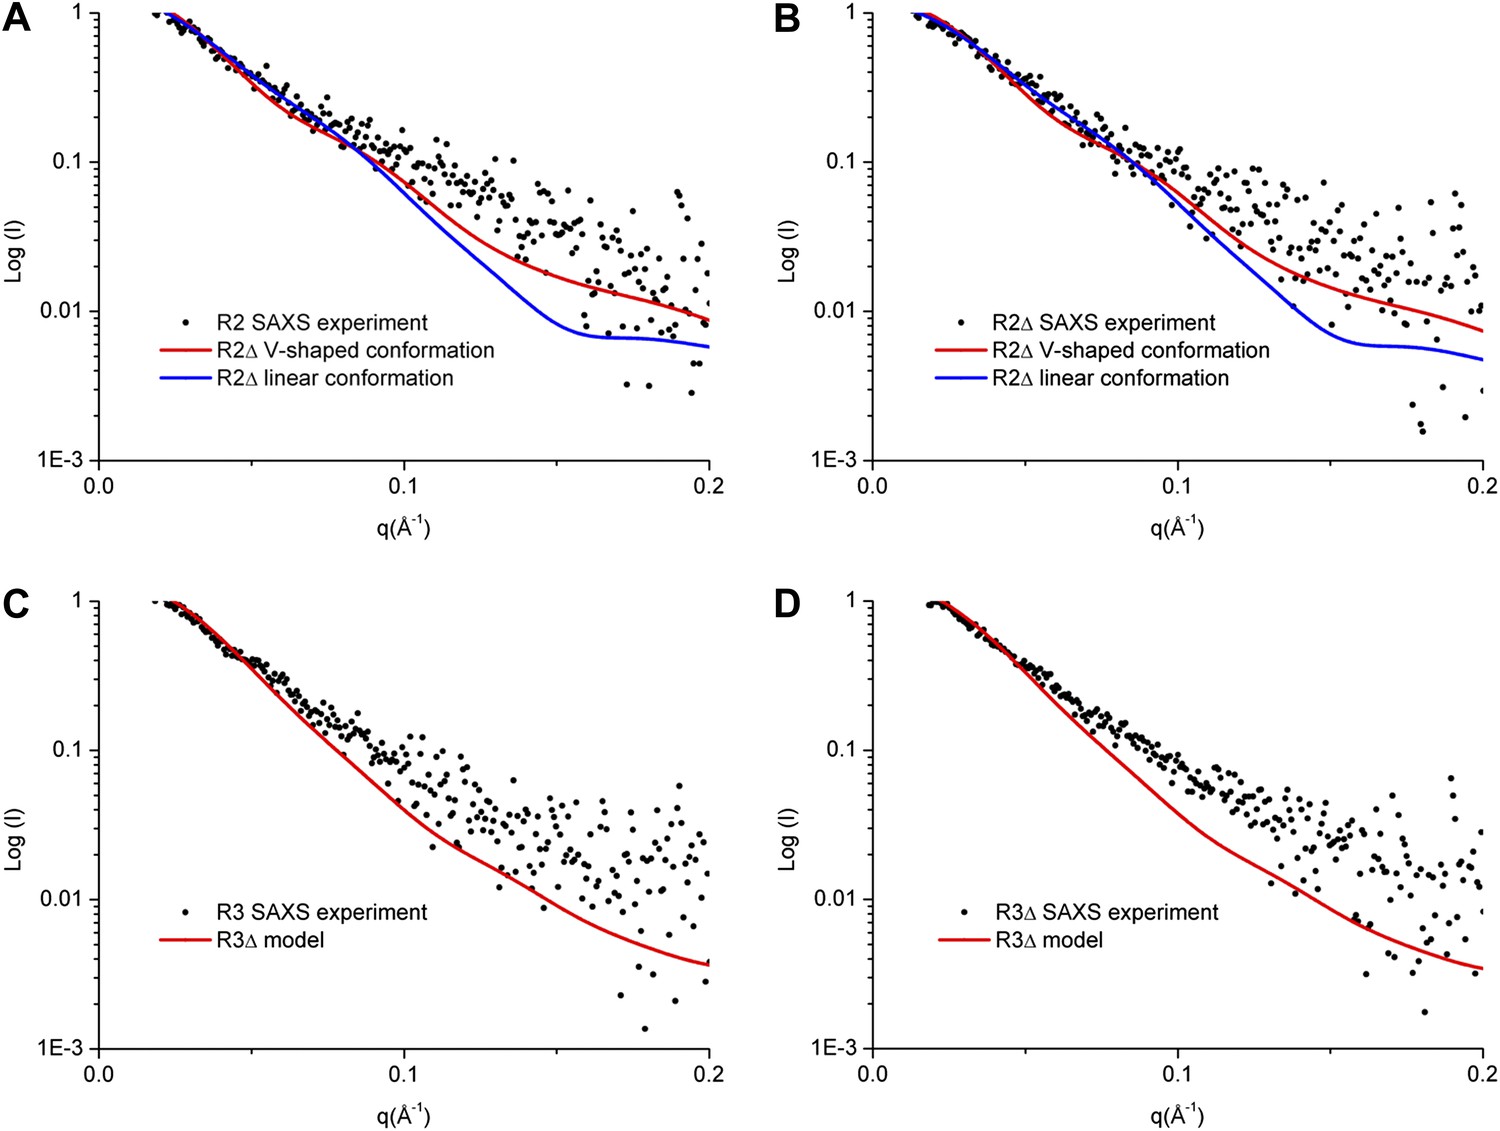
SAXS analyses of the R2 and R3 complexes.
(A and B) Comparison of the experimental data with the theoretical scattering curves calculated from the structure models of R2Δ with the V-shaped conformation observed in the R2Δ structure and the linear conformation observed in the R3Δ structure for the R2 complex (A) and the R2Δ complex (B). (C and D) Comparison of the experimental data with the theoretical scattering curve calculated from the structure model of R3Δ observed in the R3Δ structure for the R3 complex (C) and the R3Δ complex (D). The observed and calculated values of Rg, Dmax, and Porod volume are summarized in Figure 3—source data 1.
-
Figure 3—source data 1
SAXS analysis parameters.
- https://doi.org/10.7554/eLife.02687.016
Figure 3—figure supplement 1

SAXS analyses of the R2 and R3 complexes.
(A-B) SAXS experimental data derived P(r) (pair-distance) distributions of the R2 and R2Δ complexes (A) and the R3 and R3Δ complexes (B). (C-D) Theoretical P(r) distributions calculated from the structure models of the R2Δ complex with the V-shaped conformation and the linear conformation (C) and the R3Δ complex (D).
Figure 4 with 1 supplement
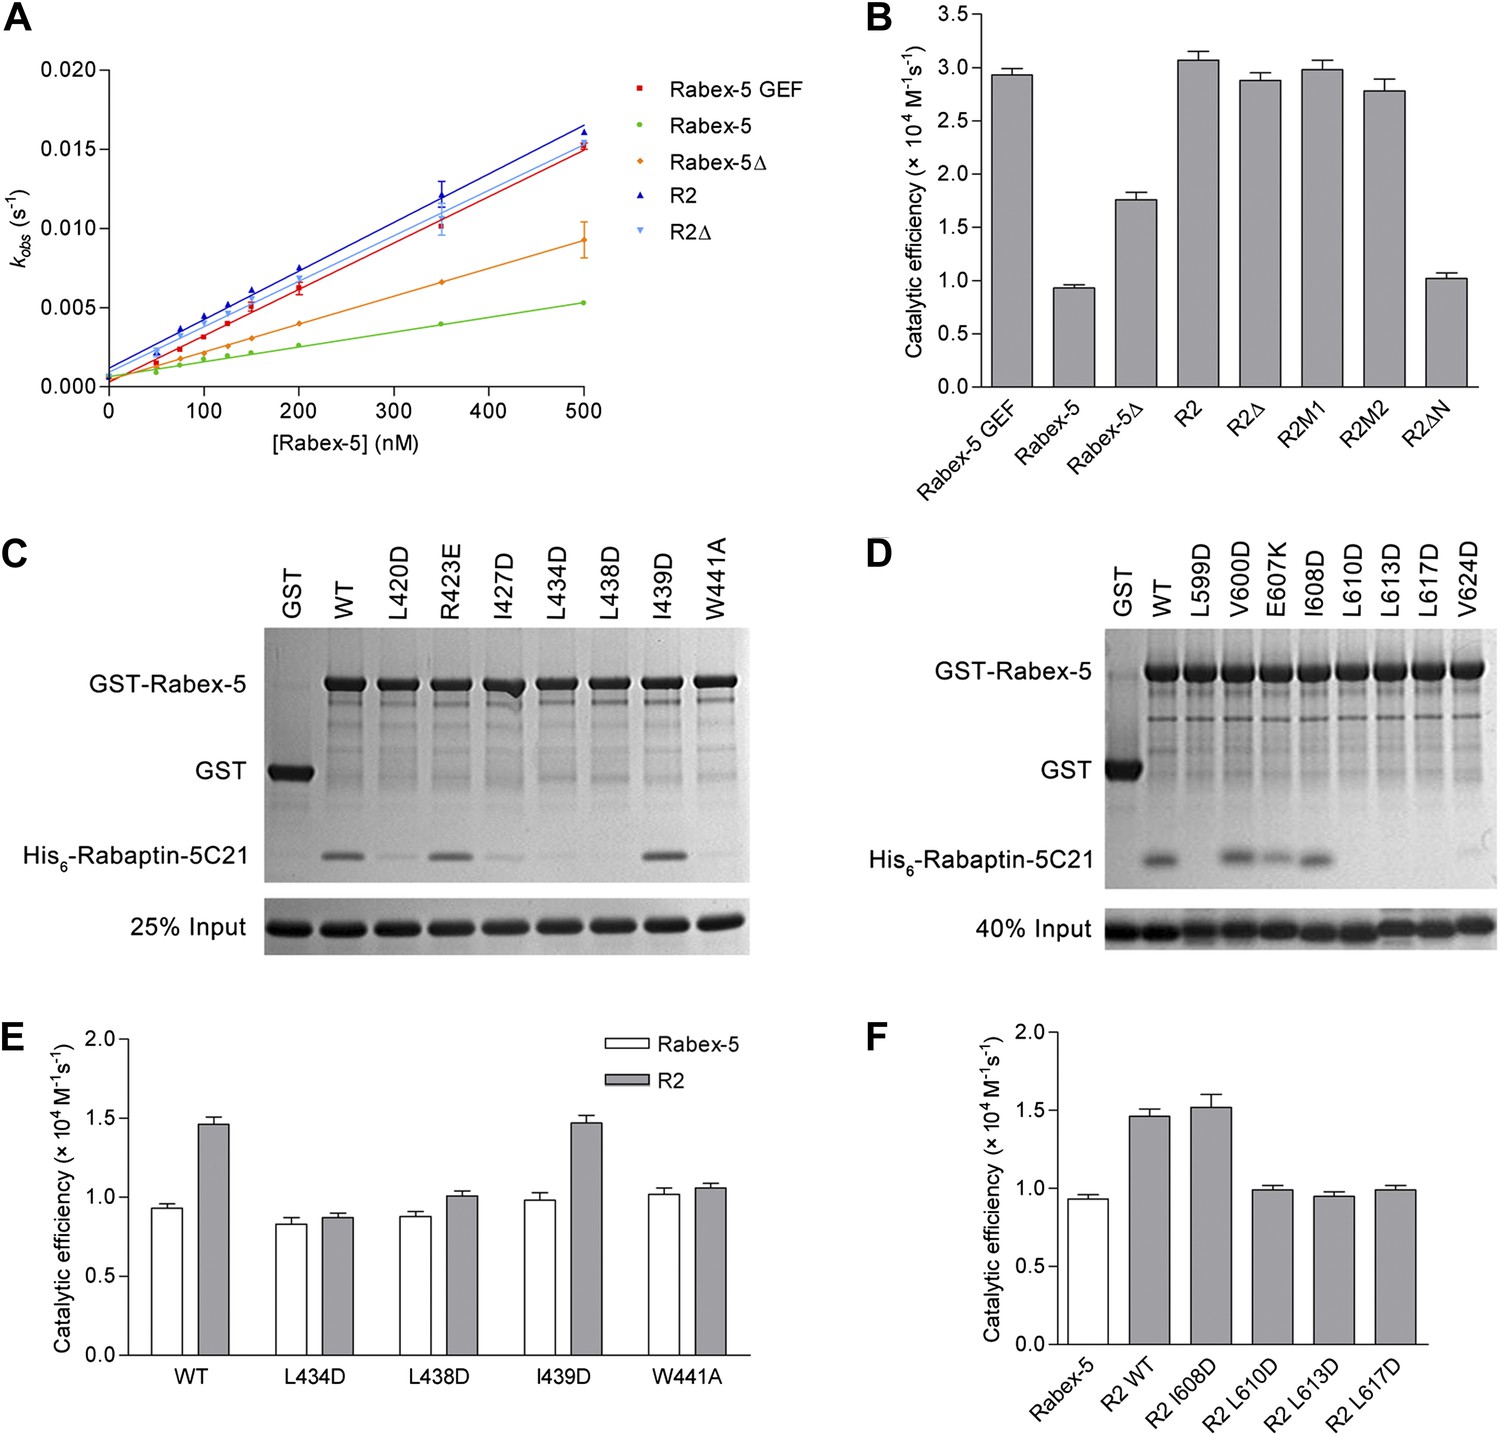
In vitro functional analyses of the Rabex-5-Rabaptin-5 complex.
(A) GEF activity of Rabex-5 in different forms. Catalytic efficiency (kcat/Km) was obtained from the slope of a linear least-squares-fit of the kobs values against the concentrations of Rabex-5 from two independent measurements. (B) Histogram of the catalytic efficiencies of Rabex-5 variants alone and in complexes with different Rabaptin-5C21 mutants or variant. Values are means ± SEM of two independent measurements. R2M1: the R2 complex in which Rabaptin-5C21 contains a quadruple mutation N568A/E572A/Q579A/E582A; R2M2: the R2 complex in which Rabaptin-5C21 contains a double mutation I608A/D623A; R2ΔN: the R2 complex in which the N-terminal half of Rabaptin-5C21 (residues 552–592) is deleted. The complexes in (A) and (B) were co-expressed and co-purified. (C) GST pull-down assays for the interactions between the wild-type and mutant GST-Rabex-5 and the wild-type His6-Rabaptin-5C21. The gel was stained by Coomassie blue. (D) GST pull-down assays for the interactions between the wild-type GST-Rabex-5 and the wild-type and mutant His6-Rabaptin-5C21. (E) Histogram of the catalytic efficiencies of the wild-type and mutant Rabex-5 alone and in complexes with the wild-type Rabaptin-5C21. (F) Histogram of the catalytic efficiencies of the wild-type Rabex-5 alone and in complexes with the wild-type and mutant Rabaptin-5C21. For the assays in (E) and (F), Rabex-5 and Rabaptin-5C21 were expressed and purified separately and then mixed together in a 1:2 molar ratio overnight prior to the assay. Tables of the GEF activities are available in the Figure 4—source data 1–3.
-
Figure 4—source data 1
GEF activity of different Rabex-5 variants alone and in complexes with different Rabaptin-5C21 mutants or truncates.
- https://doi.org/10.7554/eLife.02687.019
-
Figure 4—source data 2
GEF activity of different Rabex-5 mutants alone and in complexes with wild-type Rabaptin-5C21.
- https://doi.org/10.7554/eLife.02687.020
-
Figure 4—source data 3
GEF activity of wild-type Rabex-5 in complexes with different Rabaptin-5C21 mutants.
- https://doi.org/10.7554/eLife.02687.021
Figure 4—figure supplement 1
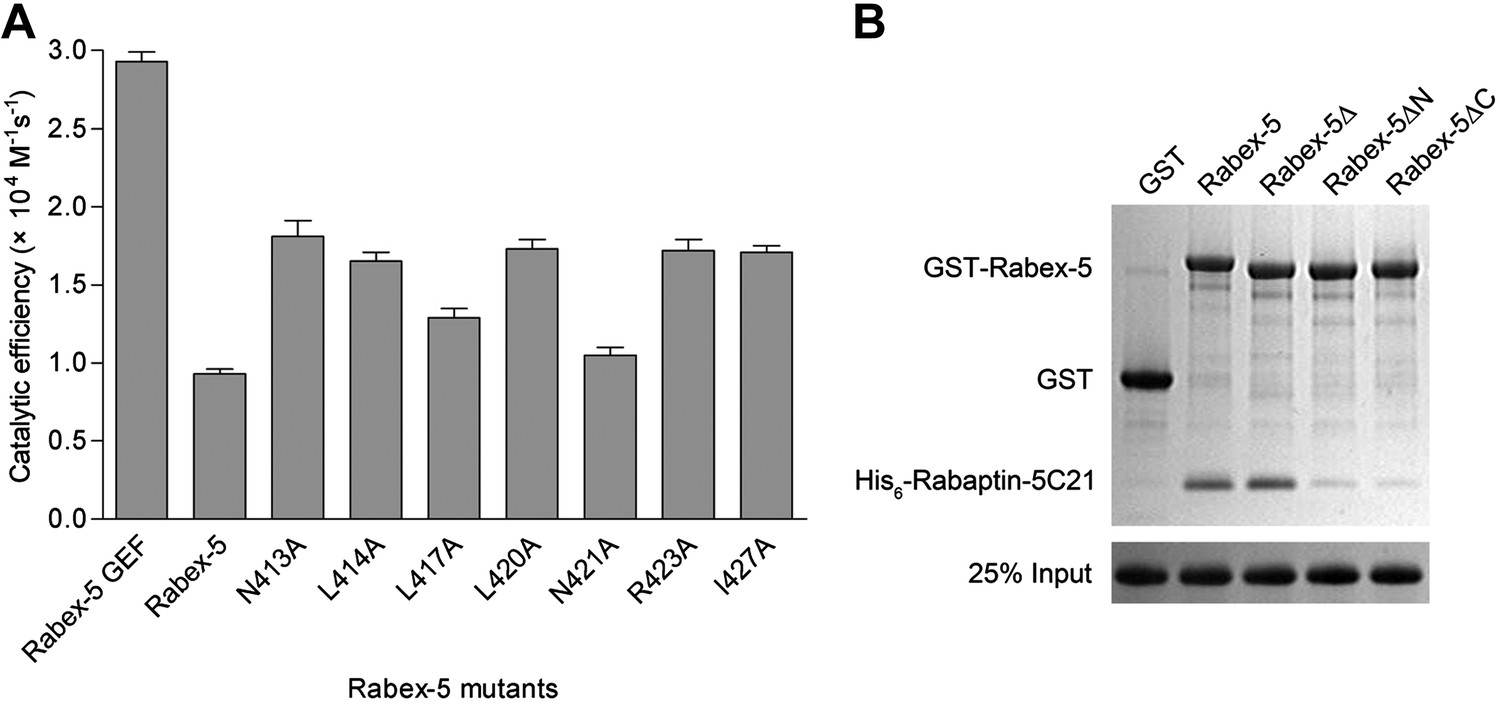
Functional roles of the Rabex-5 CC domain (Rabex-5CC) in the autoinhibition of the Rabex-5 GEF activity.
(A) Histogram of the catalytic efficiencies of the wild-type and mutant Rabex-5. The residues contributed to the autoinhibition on the nonpolar surface of Rabex-5CC (Delprato and Lambright, 2007) were individually mutated to alanine and the GEF activities of these mutants were detected to confirm their functional roles in the autoinhibition. Values are means ± SEM of two independent measurements. (B) GST pull-down assay of Rabex-5 with Rabaptin-5C21. Rabex-5Δ: deletion of the linker region, Rabex-5ΔN and Rabex-5ΔC: deletion of the N- and C-terminal part of the CC domain, respectively.
Figure 5

Molecular mechanism of the regulation of the Rabex-5 GEF activity.
In the free-form Rabex-5, the CC domain binds weakly via the nonpolar surface to the substrate-binding site of the GEF domain, leading to occlusion of the substrate-binding site and thus a weak autoinhibition of the GEF activity (State I). The free-form Rabex-5 can directly target to the early endosomes to activate Rab5 at the basal level. In the cells, most Rabex-5 forms a binary complex with Rabaptin-5 which can be recruited to early endosomes via the binding of the C-terminal region of Rabaptin-5 to GTP-bound Rab5. The binding of Rabaptin-5C21 to Rabex-5 pulls Rabex-5CC away from the GEF domain to form a binary complex with the V-shaped conformation and a largely exposed substrate-binding site, leading to the relief of the autoinhibition (State II). The binding of Rab5 induces further conformational changes of the Rabex-5-Rabaptin-5 complex such that Rabaptin-5C212 transforms from the V-shaped to the linear conformation, and the substrate-binding site of the GEF domain is completely exposed to the solvent to bind and activate Rab5 (State III). The positive feedback loop among Rab5, its effector Rabaptin-5, and its GEF Rabex-5 can lead to a robust activation of Rab5, which then promotes the fusion of early endosomes efficiently.
Tables
Table 1
Summary of diffraction data and structure refinement statistics
| Rabex-5CC | Rabex-5CC-Rabaptin-5C212 | Rabex-5Δ-Rabaptin-5C212 | Rab5-Rabex-5Δ-Rabaptin-5C212 | |
|---|---|---|---|---|
| Diffraction data | ||||
| Wavelength (Å) | 0.9200 | 1.0000 | 0.9793 | 0.9785 |
| Space group | P21 | C2 | P3121 | P41212 |
| Cell parameters | ||||
| a (Å) | 46.8 | 90.0 | 87.2 | 174.8 |
| b (Å) | 40.3 | 28.9 | 87.2 | 174.8 |
| c (Å) | 51.6 | 108.0 | 168.9 | 149.0 |
| α (°) | 90.0 | 90.0 | 90.0 | 90.0 |
| β (°) | 95.1 | 102.2 | 90.0 | 90.0 |
| γ (°) | 90.0 | 90.0 | 120.0 | 90.0 |
| Resolution (Å) | 50.0–2.00 | 50.0–2.20 | 50.0–3.10 | 50.0–4.60 |
| (2.07–2.00)* | (2.28–2.20) | (3.21–3.10) | (4.76–4.60) | |
| Observed reflections | 38,445 | 47,482 | 79,255 | 124,340 |
| Unique reflections (I/σ(I) > 0) | 12,748 | 13,816 | 13,730 | 12,699 |
| Average redundancy | 3.0 (3.0) | 3.4 (3.0) | 5.8 (6.0) | 9.8 (9.0) |
| Average I/σ(I) | 23.6 (14.0) | 21.2 (3.4) | 20.1 (2.4) | 18.2 (2.8) |
| Completeness (%) | 96.4 (97.7) | 97.7 (85.8) | 98.1 (100.0) | 97.6 (95.8) |
| Rmerge (%)† | 5.3 (9.3) | 6.0 (28.0) | 8.2 (64.3) | 11.7 (94.3) |
| Refinement and structure model | ||||
| Reflections (Fo ≥ 0σ(Fo)) | ||||
| Working set | 11,437 | 12,433 | 10,806 | 11,982 |
| Test set | 622 | 691 | 601 | 631 |
| Rwork/Rfree (%)‡ | 19.1/23.4 | 19.3/23.5 | 26.4/31.5 | 25.1/34.3 |
| No. of atoms | 1726 | 1814 | 3074 | 9679 |
| Protein | 1621 | 1627 | 3074 | 9679 |
| Water | 105 | 187 | – | – |
| Average B factor (Å2) | ||||
| All atoms | 22.8 | 58.5 | 72.0 | 187.3 |
| Main-chain atoms | 17.9 | 51.8 | 72.6 | 186.9 |
| Side-chain atoms | 25.9 | 64.0 | 70.7 | 187.7 |
| Water | 34.9 | 63.5 | - | - |
| RMS deviations | ||||
| Bond lengths (Å) | 0.018 | 0.014 | 0.005 | 0.015 |
| Bond angles (°) | 1.61 | 1.37 | 1.27 | 1.87 |
| Ramachandran plot (%) | ||||
| Most favored | 99.5 | 99.5 | 92.1 | 93.8 |
| Allowed | 0.5 | 0.5 | 7.6 | 5.8 |
| Generously allowed | 0.0 | 0.0 | 0.3 | 0.5 |
-
*
Numbers in parentheses represent the highest resolution shell.
-
†
Rmerge = ∑hkl∑i|Ii(hkl)i−<I(hkl)>|/∑hkl∑iIi(hkl).
-
‡
R = ∑hkl‖Fo|−|Fc‖/∑hkl|Fo|.
Download links
A two-part list of links to download the article, or parts of the article, in various formats.
Downloads (link to download the article as PDF)
Open citations (links to open the citations from this article in various online reference manager services)
Cite this article (links to download the citations from this article in formats compatible with various reference manager tools)
Molecular mechanism for Rabex-5 GEF activation by Rabaptin-5
eLife 3:e02687.
https://doi.org/10.7554/eLife.02687


