Mismatch repair deficiency endows tumors with a unique mutation signature and sensitivity to DNA double-strand breaks
- VIB Vesalius Research Center, KU Leuven, Belgium
- KU Leuven, Belgium
- University Hospital Gasthuisberg, Belgium
- VIB Center for the Biology of Disease, KU Leuven, Belgium
- Queensland Institute of Medical Research, Australia
- PO Royal Brisbane Hospital, Australia
Figures
Figure 1 with 3 supplements
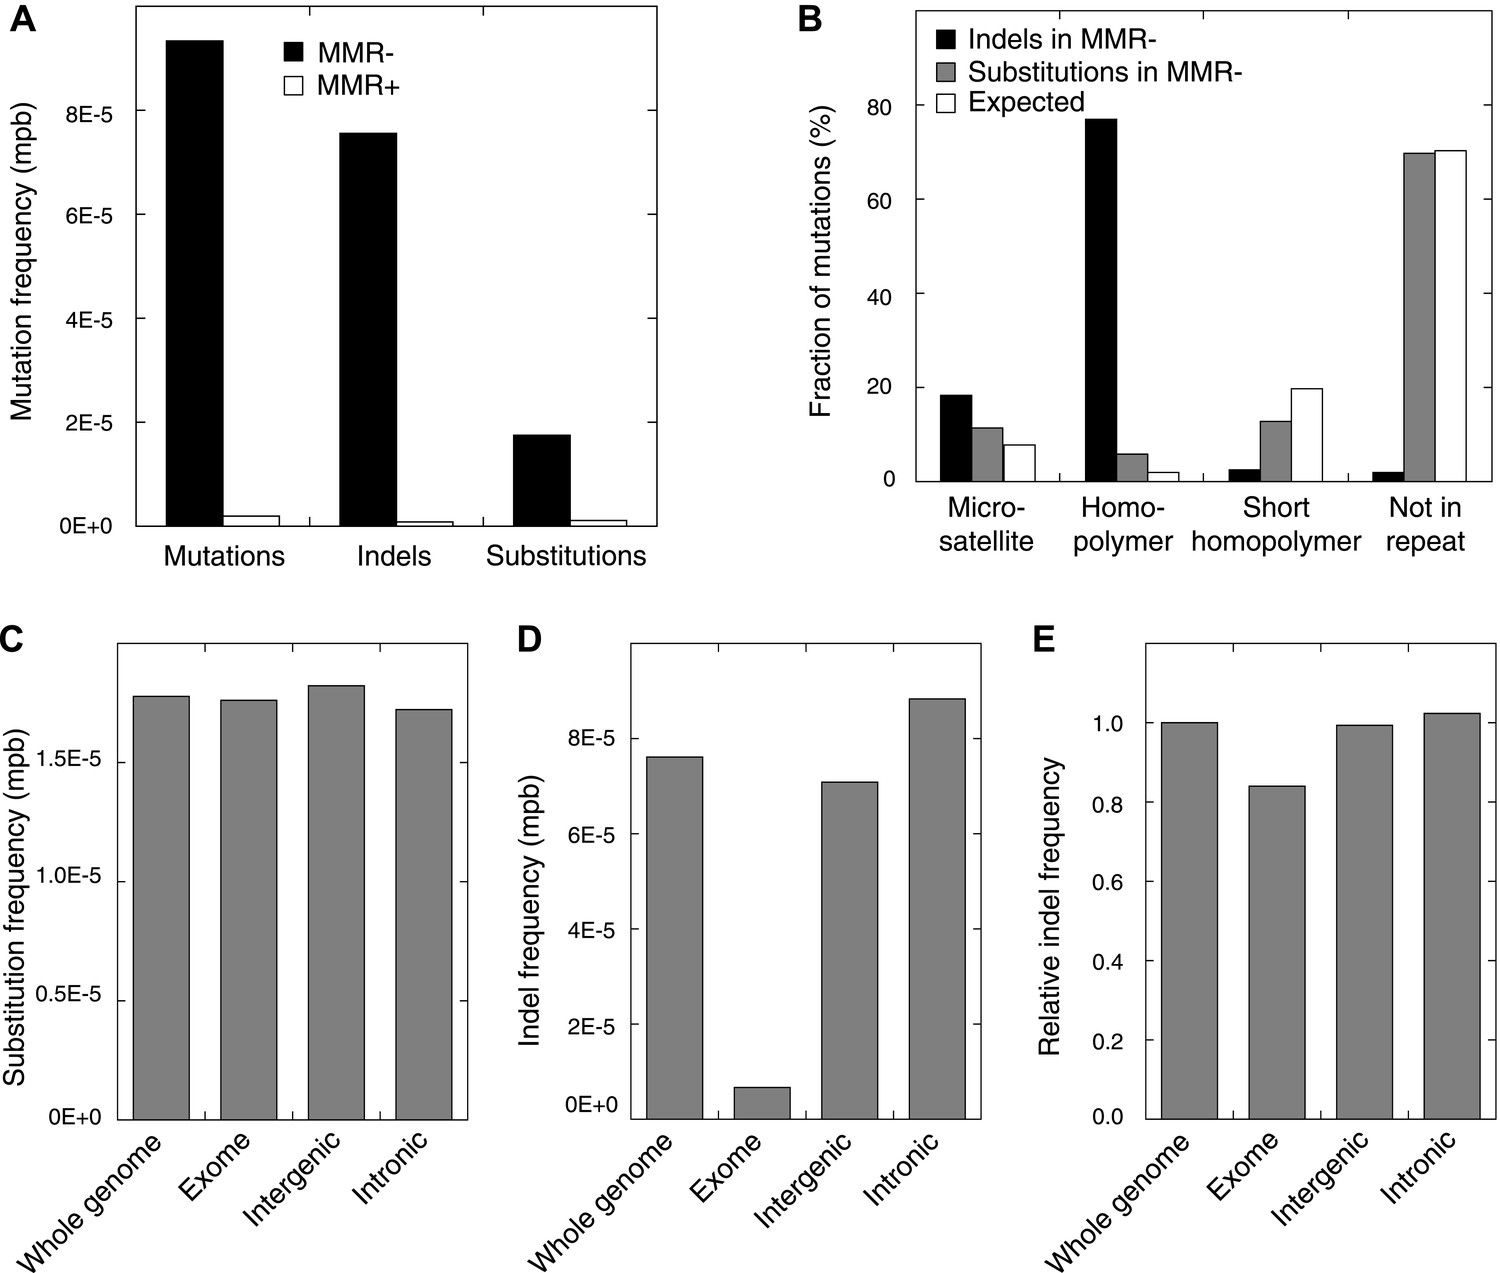
Somatic mutations in MMR-deficient tumors.
(A) The average frequency of mutations, indels, and substitutions in MMR-deficient tumors vs MMR-proficient tumors, expressed as number of mutations per base (mpb). (B) The fraction of indels and substitutions observed in microsatellites, homopolymers (length over 5 bp), short homopolymers (length of 3–5 bp), and ‘not in repeat regions’ compared to their expected fraction in these regions. (C and D) Frequencies of substitutions (C) and indels (D) in MMR-deficient tumors stratified into exonic, intergenic, and intronic regions. (E) Indel frequencies corrected for homopolymer number, length, and base composition. Indel frequencies in MMR-deficient tumors represent estimates only, as orthogonal technologies revealed false-positive rates of 12%, while false-negative rates in CG and Illumina whole-genomes were estimated to be 27.7% and 0.5%, respectively, by Zook et al. (2014). In MMR-proficient tumors all detected somatic indels were independently validated.
-
Figure 1—source data 1
Sequence statistics of MMR-proficient and MMR-deficient whole genome sequenced tumour samples, and a list of somatic substitutions detected therein.
- https://doi.org/10.7554/eLife.02725.005
-
Figure 1—source data 2
List of somatic indels detected in the MMR-proficient and MMR-deficient, whole genome sequenced tumour samples.
- https://doi.org/10.7554/eLife.02725.006
-
Figure 1—source data 3
List and overview of validated somatic mutations, detected in the MMR-proficient and MMR-deficient whole genome sequenced tumour samples.
- https://doi.org/10.7554/eLife.02725.007
Figure 1—figure supplement 1
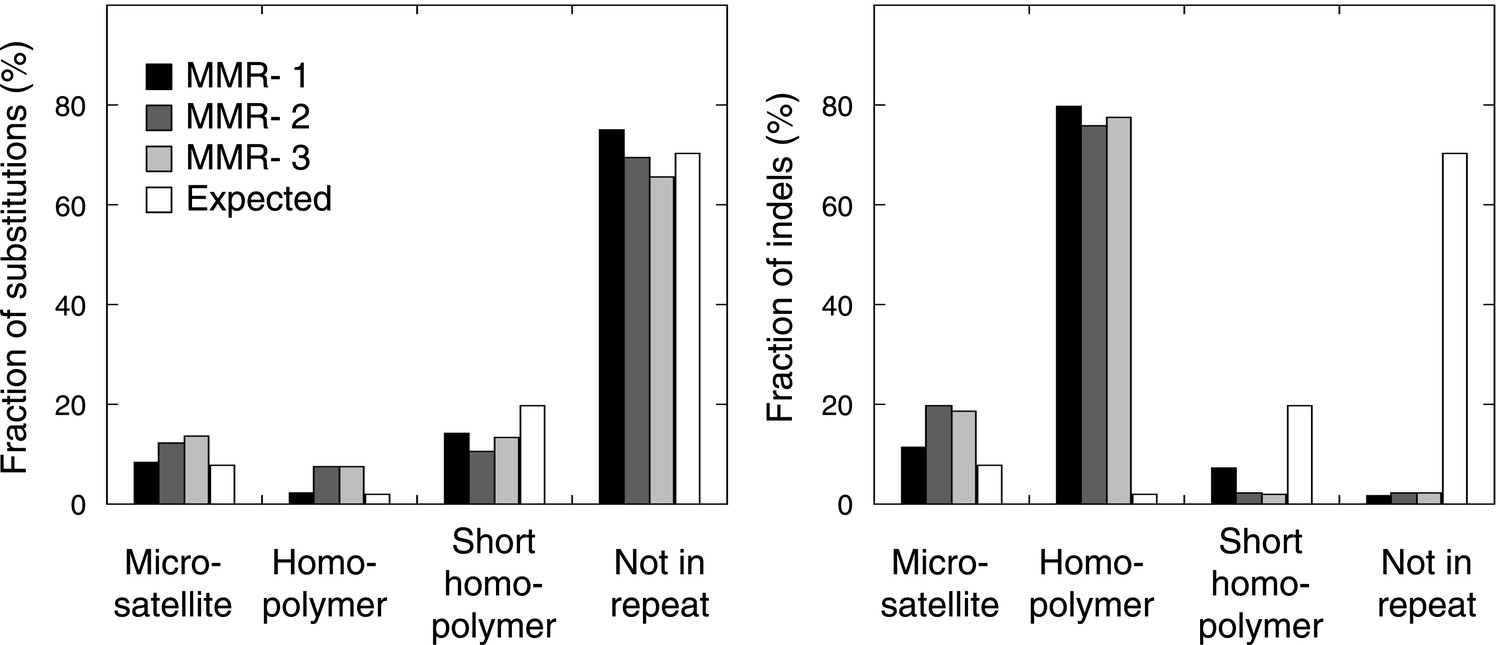
The fraction of indels (left panel) and substitutions (right panel) observed in microsatellites, homopolymers, short homopolymers and in nonrepeat regions compared to their expected fraction in these regions.
Data are shown for the individual MMR-deficient tumors. In all three tumors, substitutions predominantly affected non-repeat regions, while indels were mainly confined to homopolymers.
Figure 1—figure supplement 2
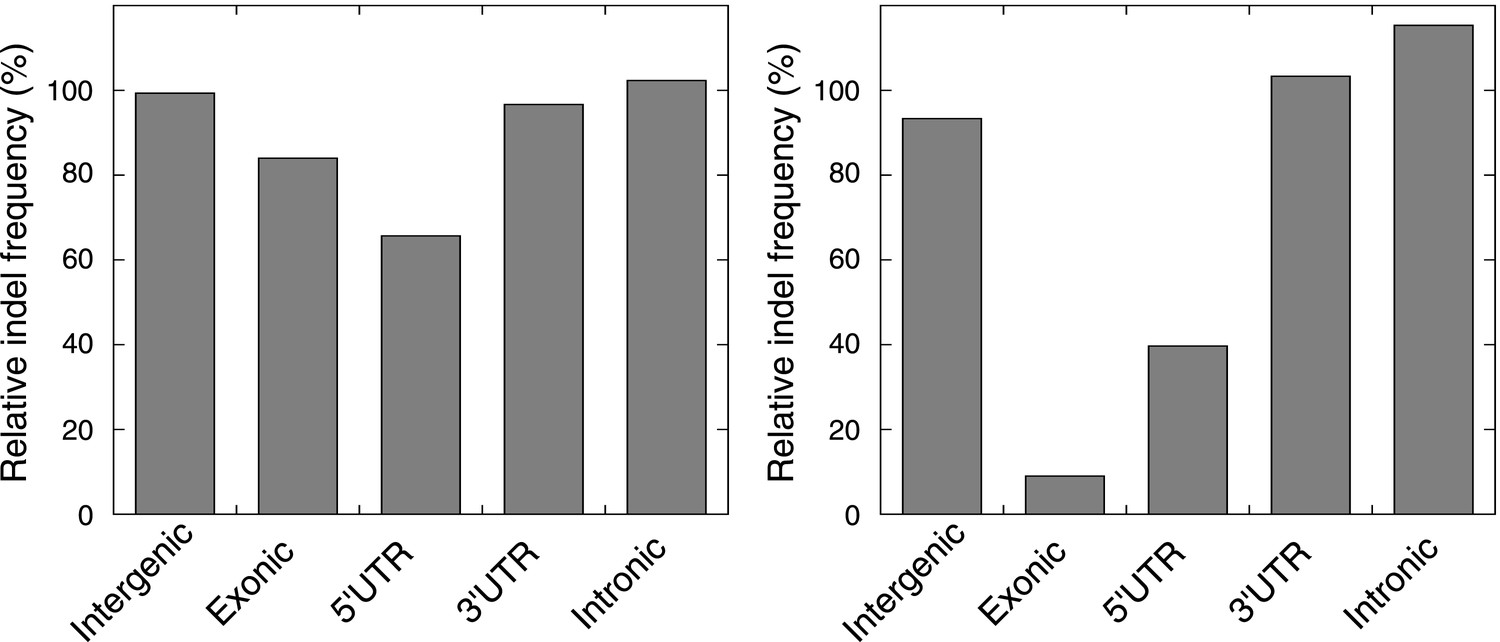
The relative indel frequency defined as the number of indels divided by the total bases of non-homopolymer regions in MMR-deficient tumors stratified into intergenic, exonic, 5′UTR, 3′UTR, and intronic regions is shown.
Indel frequencies in homopolymers are shown in the left panel, whereas indel frequencies in non-homopolymer regions are shown in the right panel. The algorithm we used to correct for homopolymer content, composition, and length can be found in the ‘Materials and methods’ section under the header ‘Evidence of negative clonal selection’. In homopolymer regions, there was a 16% decrease in indel frequency in exonic regions. In non-homopolymer regions, a clear decrease was also observed for exonic regions, confirming that the decrease in exonic indels is not only due to differences in homopolymer characteristics between exonic regions and the rest of the genome. This reveals apparent negative selection in exonic regions, independent of homopolmer content, composition or length of the homopolymers.
Figure 1—figure supplement 3
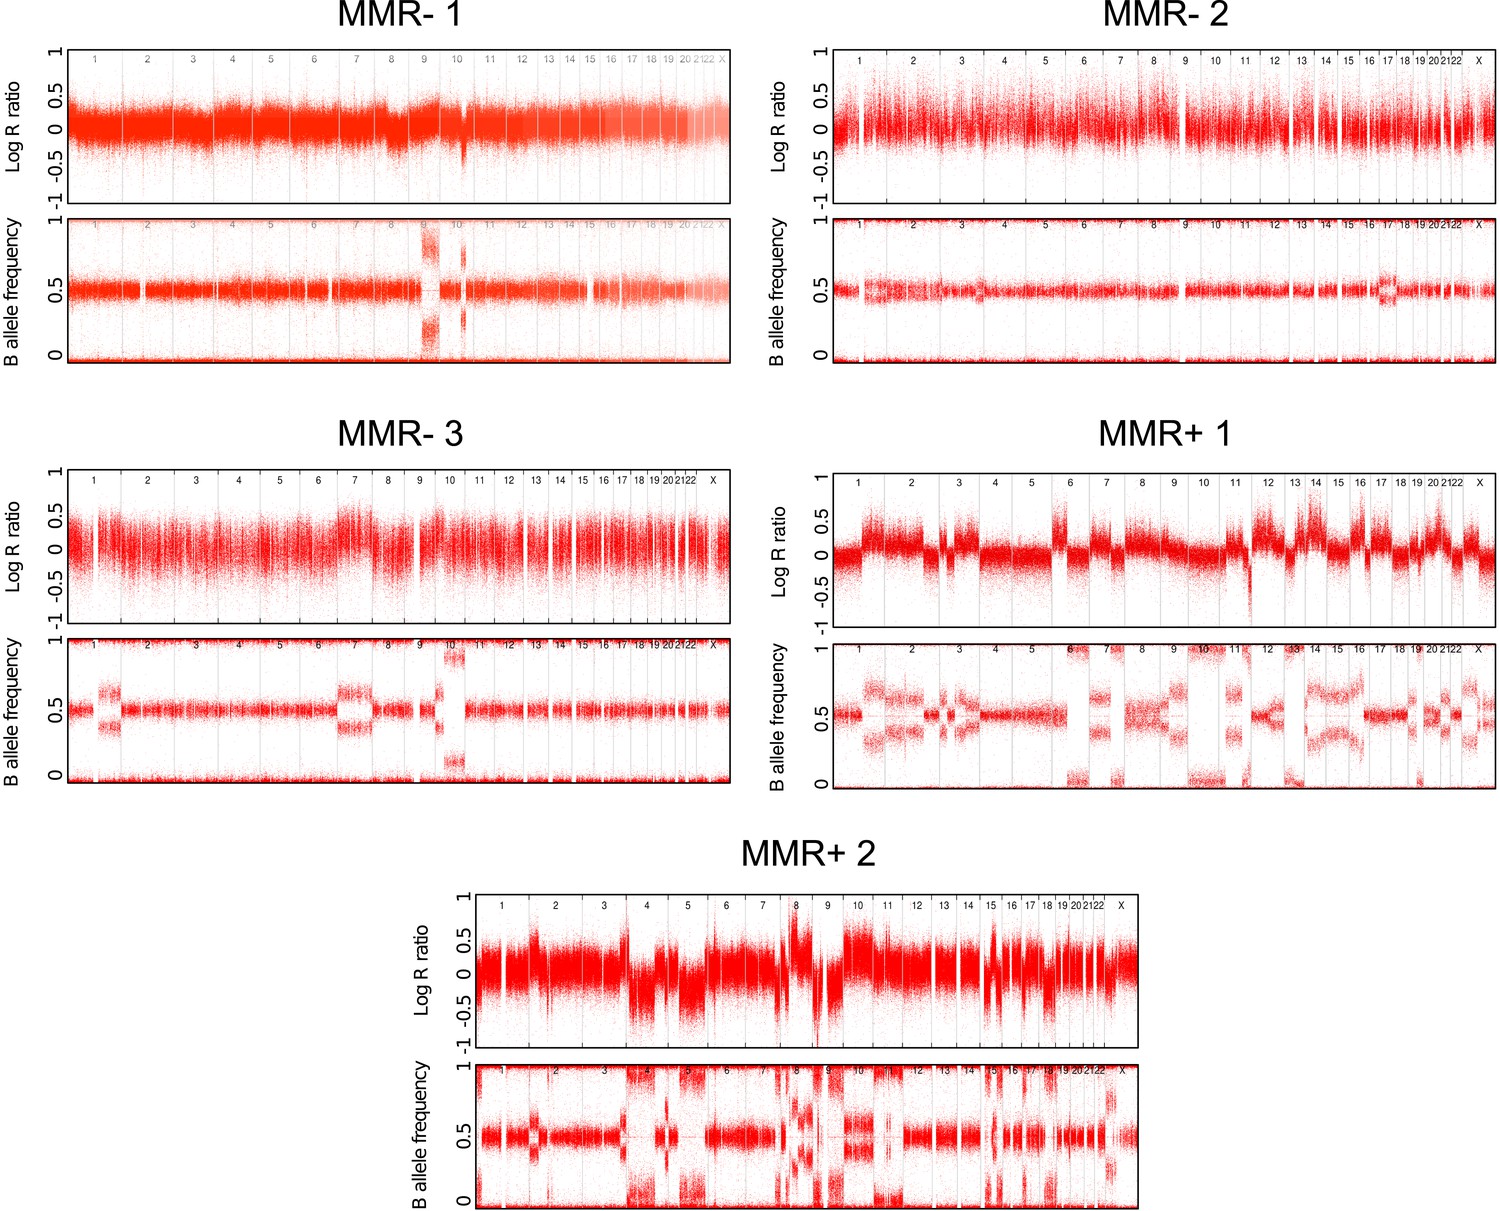
Copy number status of the 5 whole-genomes assessed by Illumina Human-Omni1 and CytoSNP-12 chips.
https://doi.org/10.7554/eLife.02725.010
Figure 2 with 5 supplements
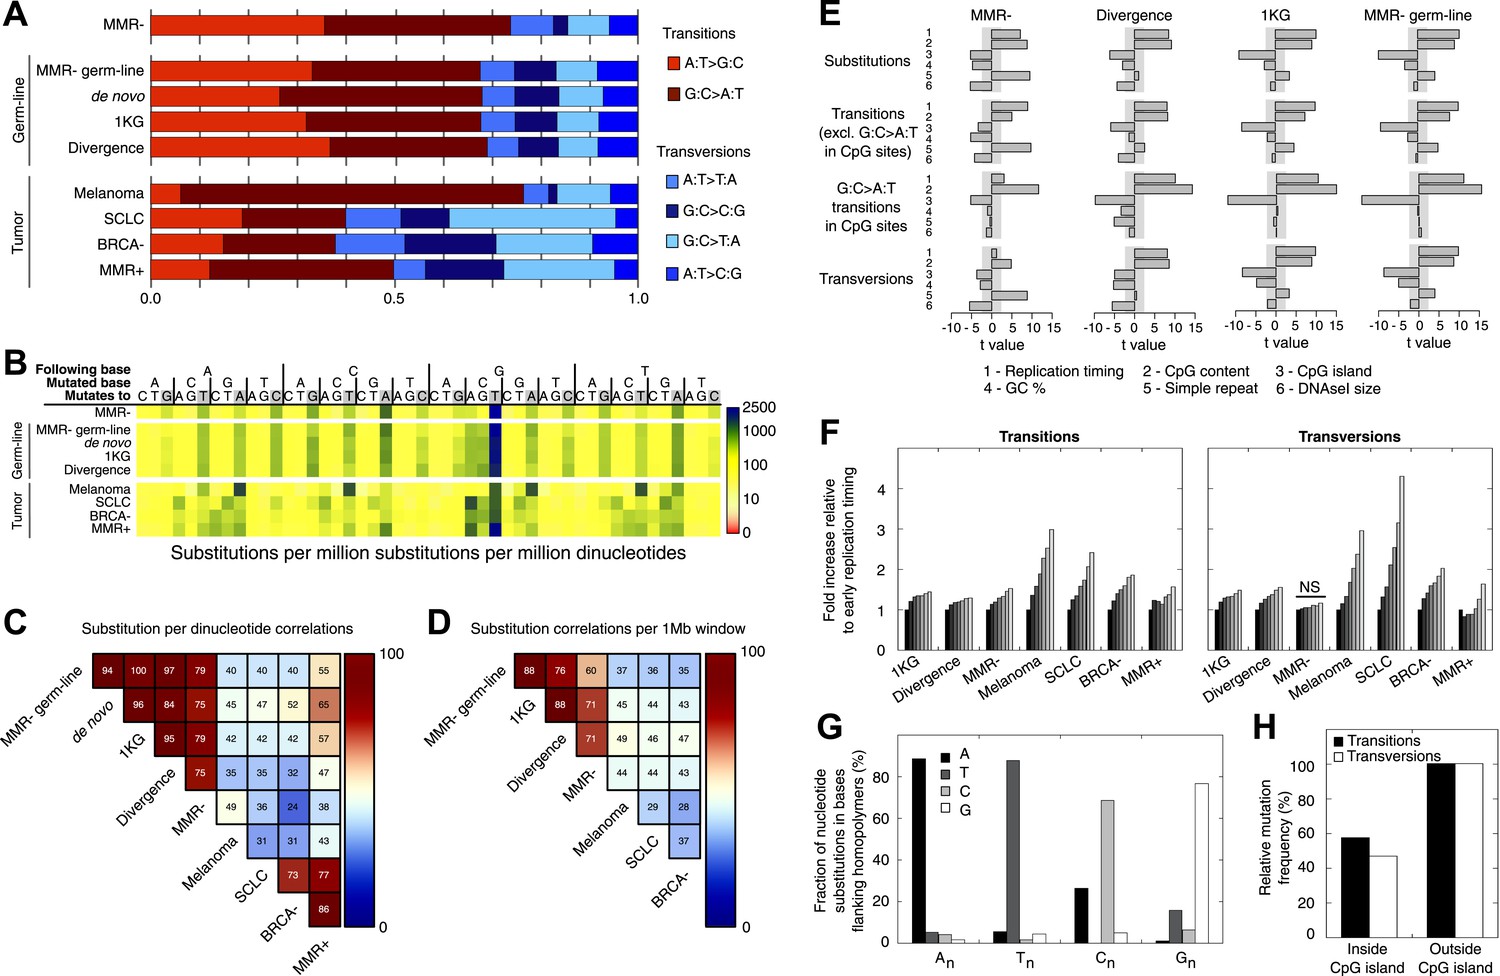
Somatic substitution patterns in MMR-deficient tumors.
(A) Somatic substitution patterns in whole-genome sequences of MMR-deficient endometrial tumors (MMR−), matched germ-line (peripheral white blood cell) DNA from MMR-deficient tumors (MMR-germ-line), de novo mutations as identified in parent-offspring trios (de novo), 1000 Genomes Project (1 KG), the human–chimpanzee divergence panel (Divergence), melanoma and small-cell lung cancer (SCLC), BRCA-deficient breast tumors (BRCA−), MMR-proficient endometrial tumors (MMR+). (B) Somatic substitution frequency per million dinucleotides and per million substitutions. The first row lists the base following the mutated base, the second row lists the base that was mutated, and the third row lists the new base. Gray boxes indicate transitions. Frequencies are depicted color-coded following a logarithmic distribution as shown by the gradient on the left. (C and D) Squared coefficients of correlation (R2) between dinucleotide substitution patterns (C) and between the number of intergenic substitutions per 1 Mb window (D). Substitutions in MMR-proficient and de novo data sets were too sparse for correlations at a 1 Mb scale. (E) Multivariate linear regression modeling of genomic features predicting substitutions frequencies per 1 Mb window in MMR-deficient tumors, and the outcome of the same multivariate linear regression modeling in the germ-line genetic variability panels. T-values resulting from the linear model are displayed as bar plots and indicate direction and significance of correlation (shaded grey box equals p > 0.05, Bonferroni-corrected per model). The de novo substitution frequency was too low to be modeled at this resolution. (F) Frequency of transitions (excluding G:C>A:T in CG) and transversions per 1 Mb window, binned per replication time. Frequencies are displayed relative to the earliest replicating bin. Linear regression analysis was performed to assess whether observed increases were significant and independent of other genomic features. All Bonferroni-corrected p-values were significant (p < 2.0E−5) except for transversions in MMR-deficient tumors, which were not significant (NS; p = 0.23). (G) Effect of homopolymer nucleotide composition (An, Tn, Cn, or Gn) on substitutions immediately flanking a homopolymer. For example, the nucleotide B next to the poly-A repeat 'NNB(A)nBNN' is mostly converted to an A (NNB(A)nANN) and not to a C, G, or T. The modest increase in A substitutions next to Cn homopolymers and T substitutions near Gn homopolymers is caused by C:G>T:A transitions in a CpG context. (H) Substitution frequency in and outside CpG islands, relative to genome-wide substitution frequencies. Data combined for all three MMR-deficient genomes are represented for (B, E–H), but individual MMR-deficient genomes display similar patterns (Figure 2—figure supplements 1–5).
Figure 2—figure supplement 1
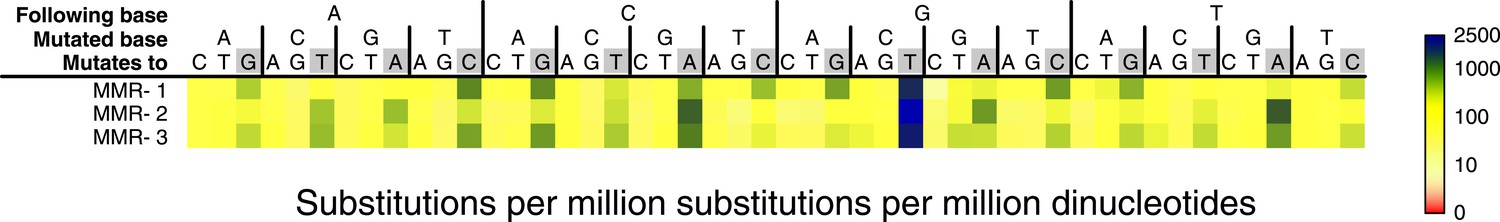
Somatic substitution frequency per million dinucleotides and per million substitutions for the individual MMR-deficient genomes.
The first row lists the base following the mutated base, the second row the base that was mutated, and the third row the new base. Transitions are indicated by grey boxes. Frequencies are depicted color-coded following a logarithmic distribution as shown by the gradient on the right. The average R2 between the MMR-deficient tumors is 0.75.
Figure 2—figure supplement 2
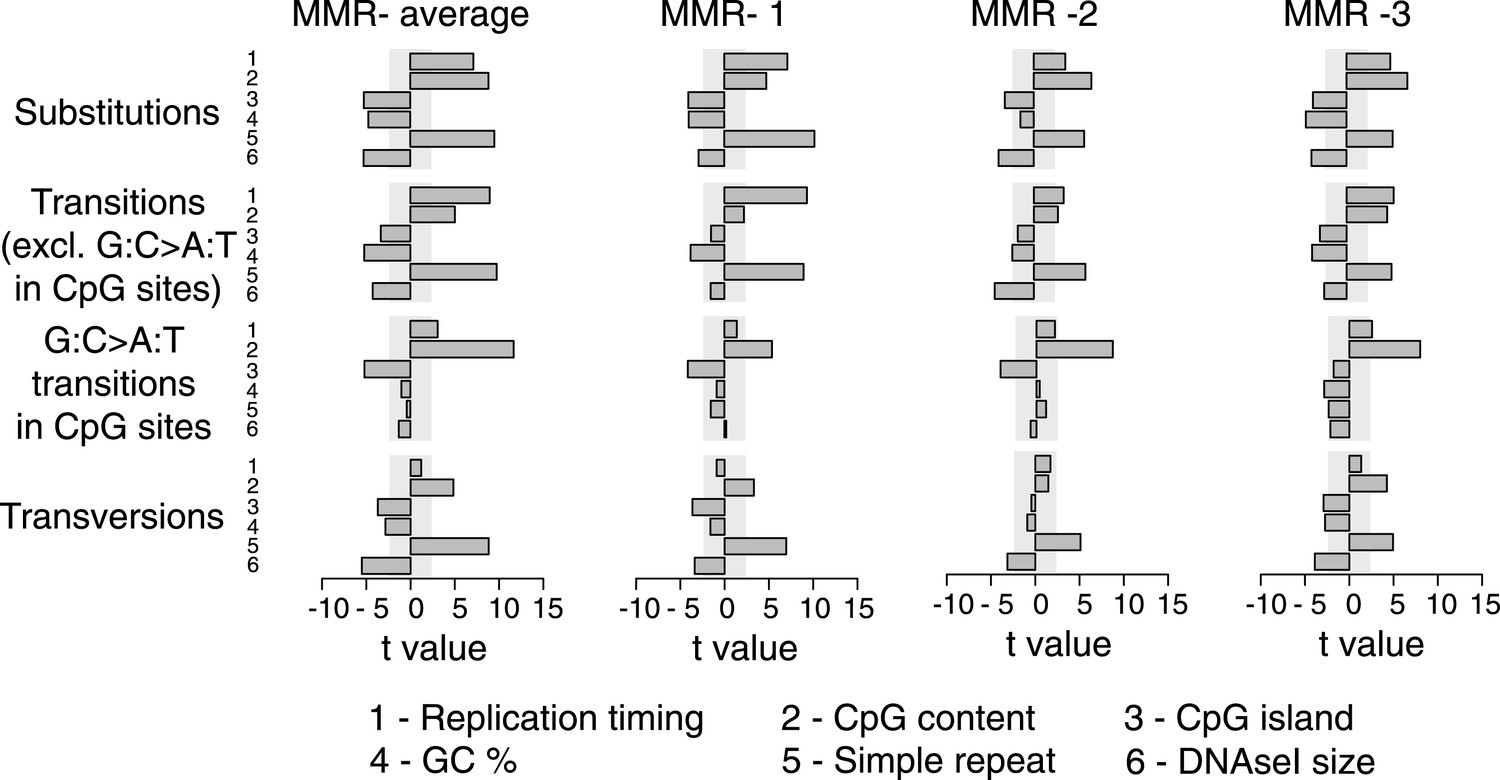
Multivariate linear regression modeling of genome features predicting substitutions frequencies per 1 Mb window in the individual MMR-deficient genomes.
T-values resulting from the linear model are displayed for each genome feature in the bar plots and indicate significance (shaded grey box equals p > 0.05, Bonferroni-corrected per model) and direction of the correlation. High concordance between the individual tumors is observed.
Figure 2—figure supplement 3

Frequency of transitions (excluding G:C>A:T in CG) and transversions per 1 Mb window, binned per replication time, relative to the earliest replicating bin.
Mutations are divided in 7 bins (left to right bins represent early to late replication timing events). Linear regression analysis was performed to assess whether observed increases were significant and independent of other genomic features. Bonferroni-corrected p-values were significant (p < 2.0E−5) for transitions and nonsignifciant for transversions. In none of the individual MMR-deficient genomes, transversions were significantly correlated to replication timing, whereas transitions correlated for each of the MMR-deficient genomes.
Figure 2—figure supplement 4

Effect of homopolymer nucleotide composition (An, Tn, Cn, or Gn) on substitutions immediately flanking a homopolymer in the individual MMR-deficient genomes.
The slight increase in A substitutions next to Cn homopolymers and T substitutions near Gn homopolymers is exclusively caused by C:G>T:A transitions in a CpG context, indicating they are likely deaminations of methylated cytosines.
Figure 2—figure supplement 5
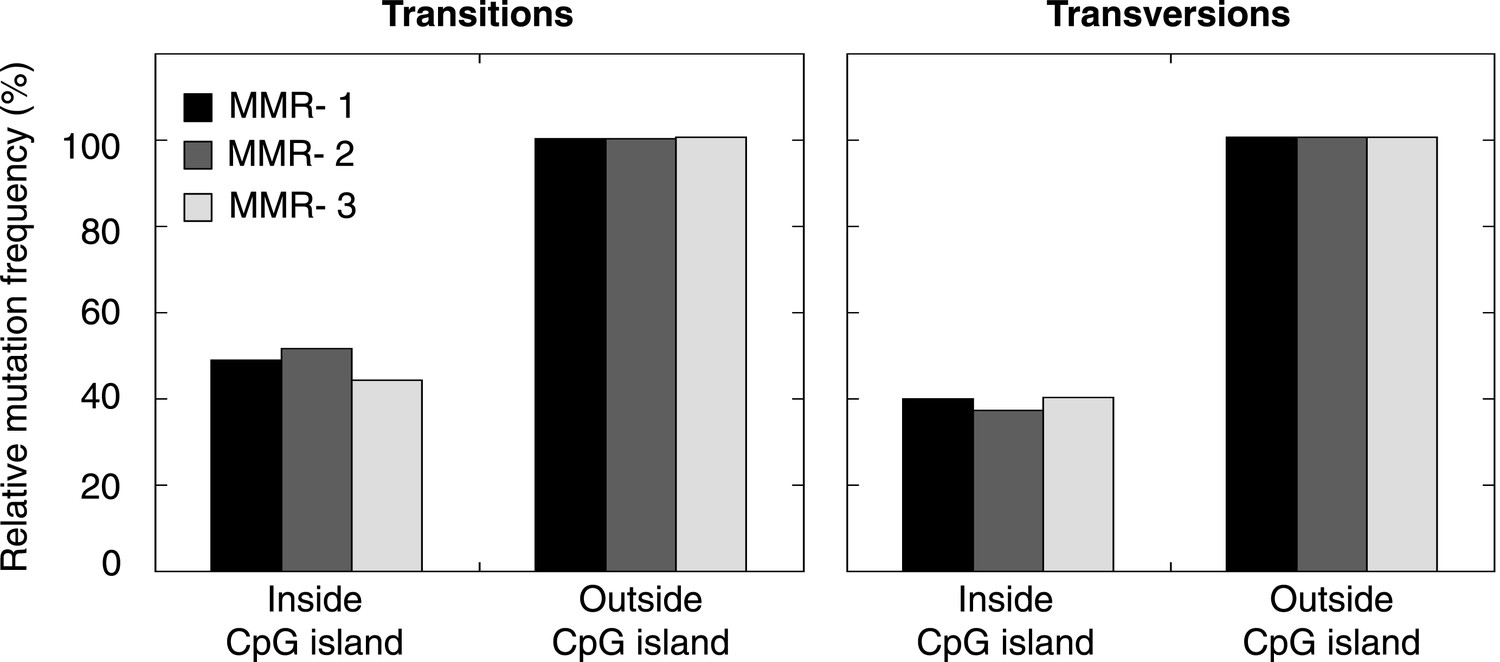
Frequency of transitions and tranvsersions in and outside of CpG Islands in the individual MMR-deficient genomes.
The frequency of transitions and transversions inside and outside CpG islands was determined as the number of mutations divided by the total size of each of the features, and expressed relative to the general, genome-wide frequencies of transitions and transversions. Individual genomes display similar patterns.
Figure 3 with 1 supplement
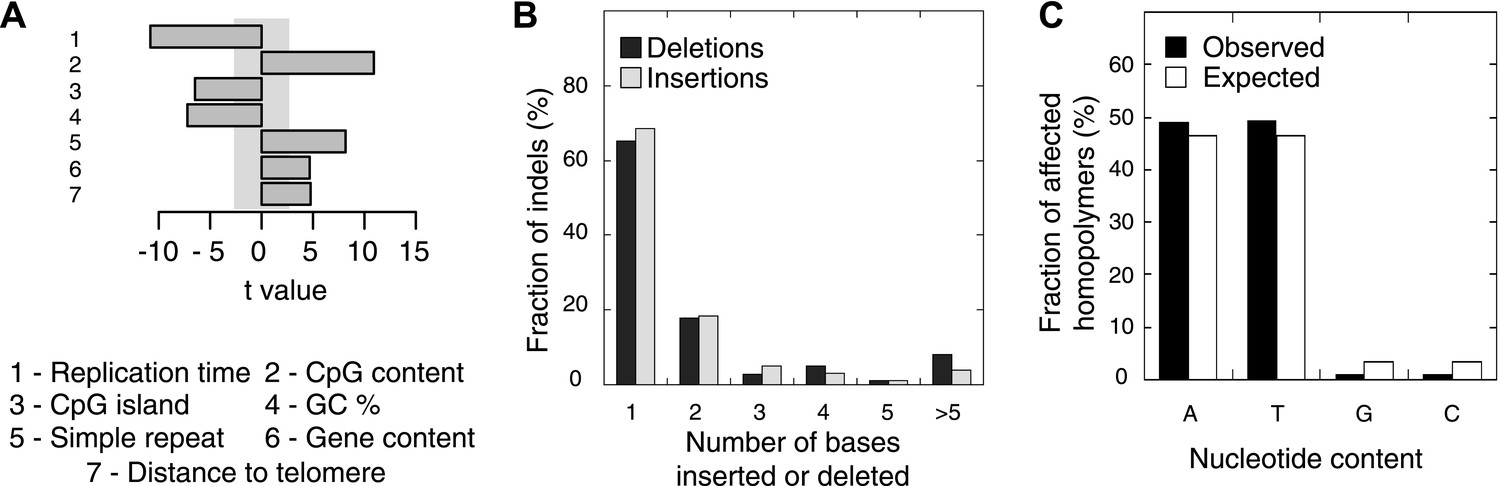
Somatic indel patterns in MMR-deficient tumors.
(A) Impact of genomic features in MMR-deficient tumors on indel frequency as assessed by multivariate linear regression modeling. T-values resulting from the linear model are displayed for each genomic feature in the bar plots and indicate significance (shaded grey box equals p > 0.05, Bonferroni-corrected per model) and direction of the correlation. (B) Fraction of all indels inserting or deleting the indicated number of bases. (C) Fraction of homopolymers affected by an indel stratified per nucleotide, compared to the genome-wide fraction of homopolymers with that nucleotide content.
Figure 3—figure supplement 1
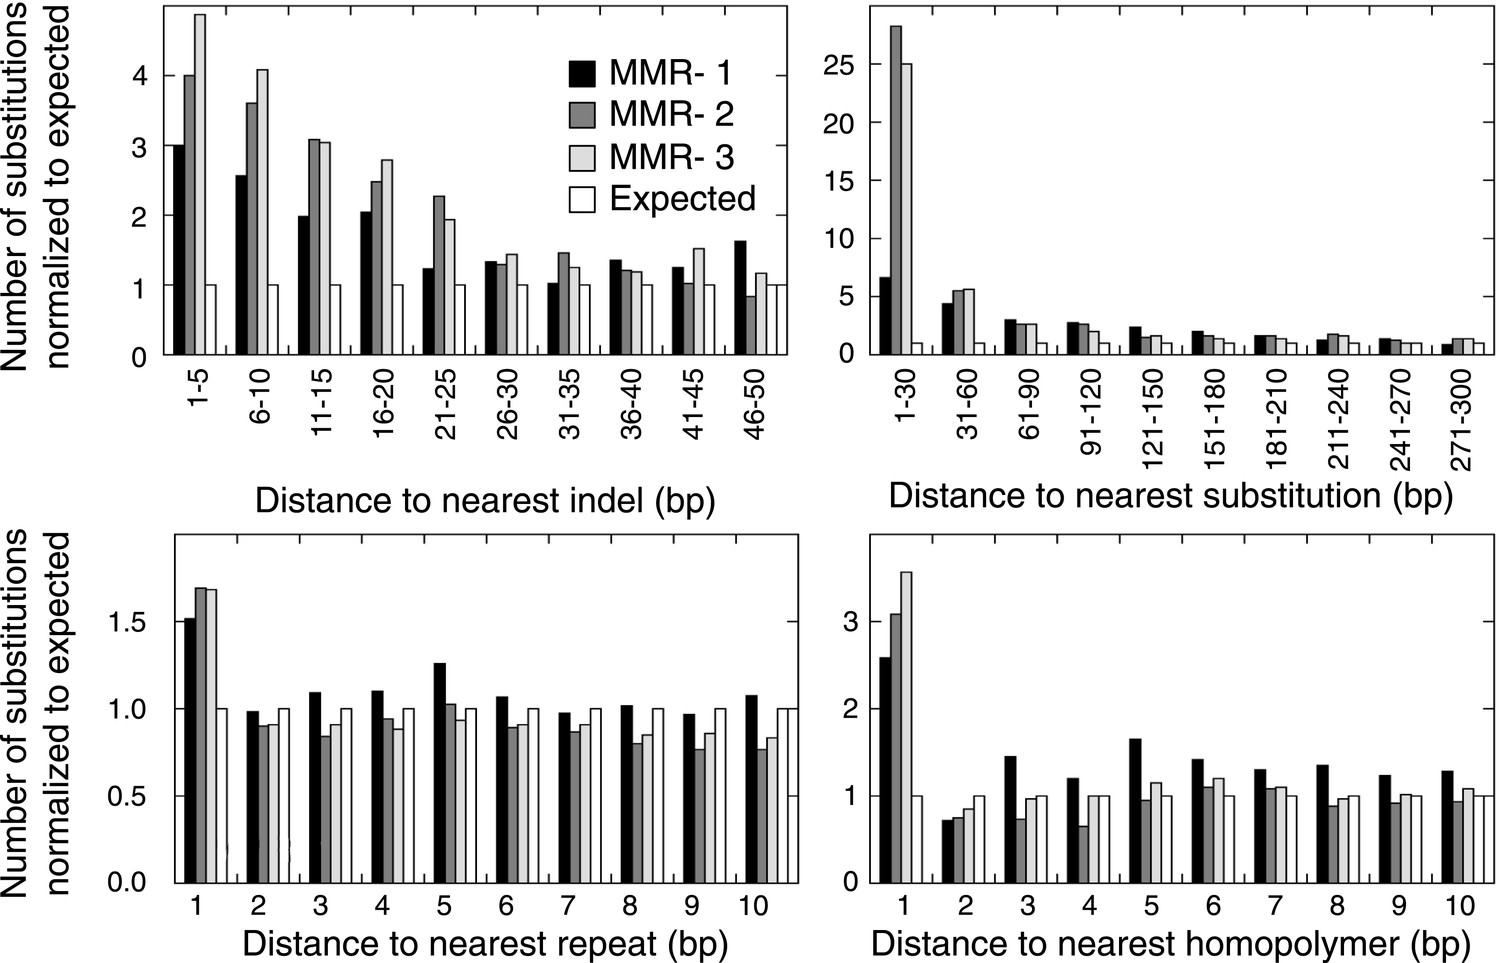
The distance between a somatic substitution and the nearest somatic indel (top left), substitution (top right), repeat (bottom left), or homopolymer (bottom right) in the individual MMR-deficient genomes, and the expected distance based on 200 random models.
The substitutions located nearby indels and substitutions were enriched respectively within a range of ∼30 bp and ∼200 bp, whereas substitutions near repeats were enriched only at the base immediately flanking the repeat.
Figure 4 with 5 supplements
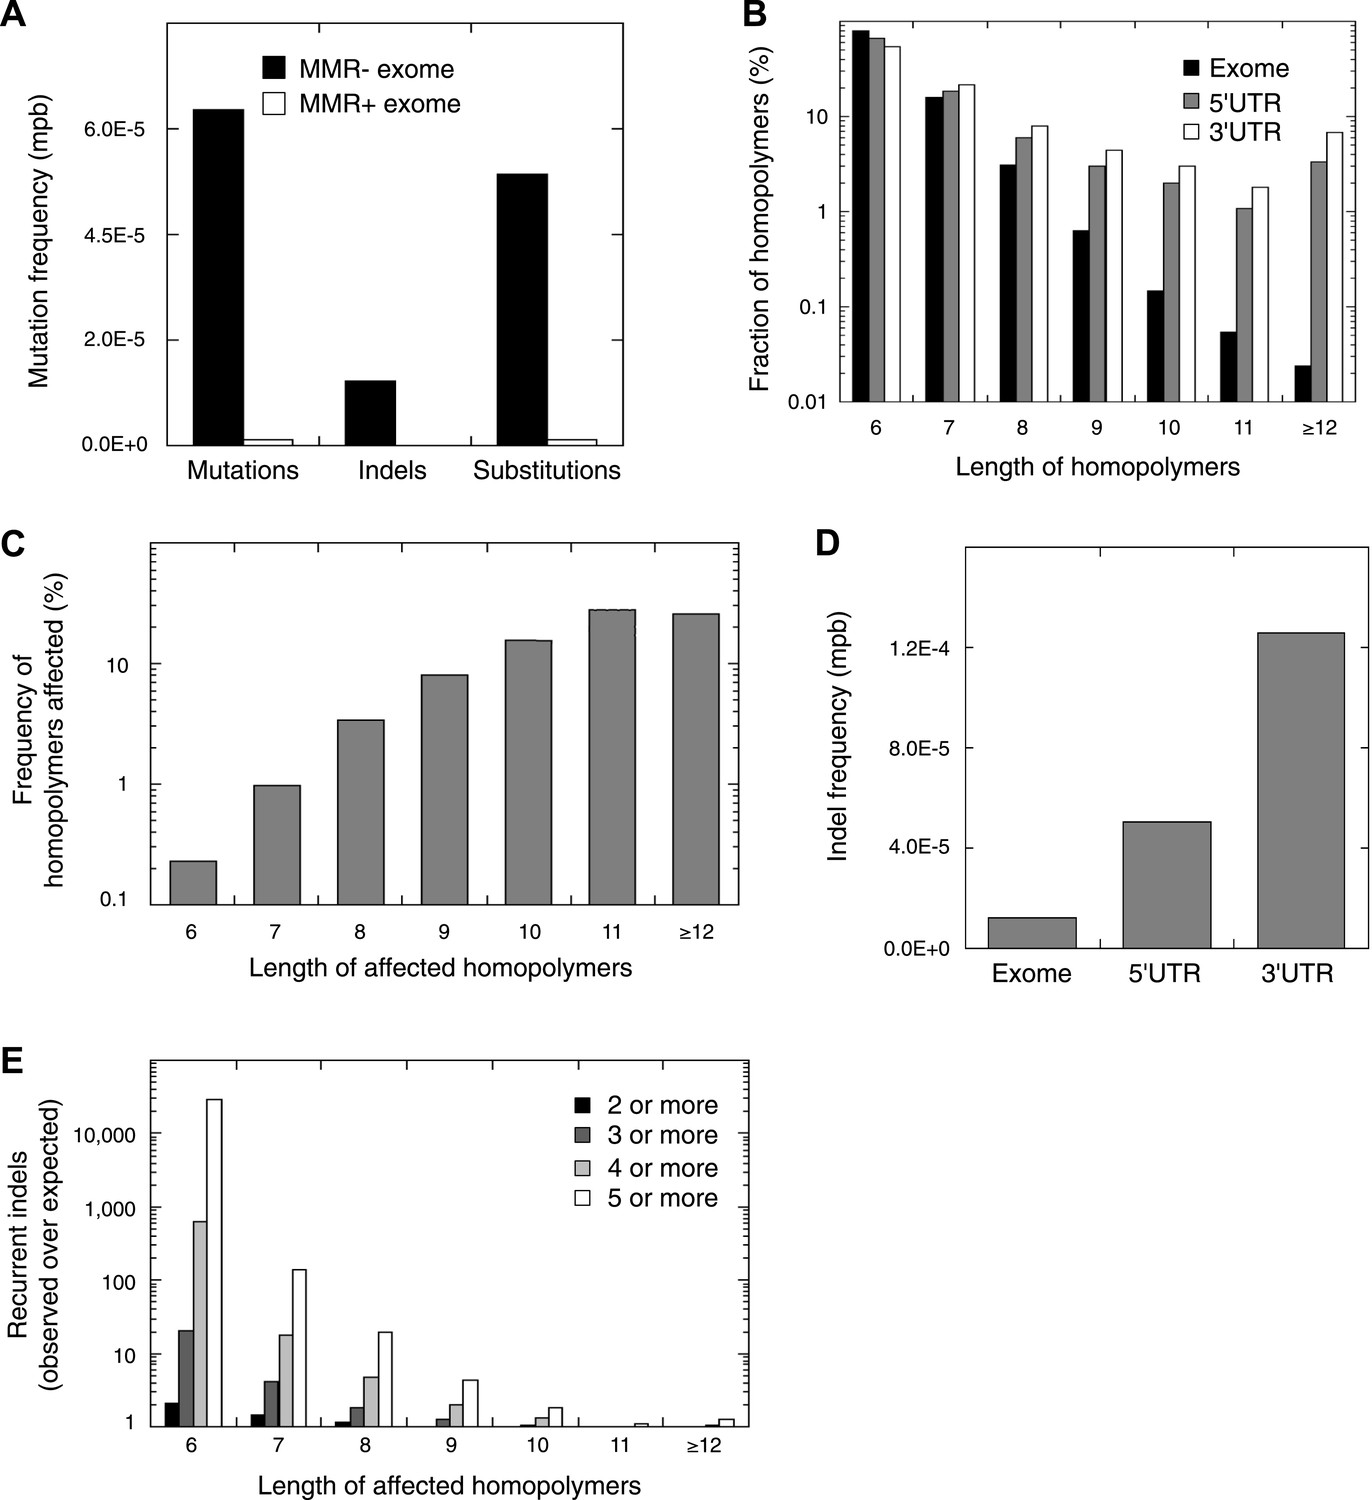
Recurrent somatic indels.
(A) The average mutation frequencies in the exons of 13 MMR-deficient tumors and four MMR-proficient tumors. No obvious difference was observed between MLH1-, MSH2-, and MSH6- deficiency in terms of the mutation frequencies, substitution patterns, and indel compositions (Figure 4—figure supplement 5). (B) Fraction of homopolymers affected by an indel in function of the homopolymer length stratified for exons, 5′ and 3′UTRs. (C) The fraction of homopolymers in exons, 5′ and 3′UTRs that are affected by an indel in function of the homopolymer length. (D) Average somatic indel frequencies in exons, 5′ and 3′UTRs of 16 MMR-deficient tumors. (E) The enrichment of observed over expected frequencies of recurrent indels. Enrichments were stratified by length of the affected homopolymer and calculated for recurrent indels in 2, 3, 4, and 5 or more out of 16 MMR-deficient tumors.
-
Figure 4—source data 1
Sample info and sequence statistics of MMR-deficient whole exome sequenced tumour samples, a list of somatic substitutions detected therein and results of validation of somatic substitutions.
- https://doi.org/10.7554/eLife.02725.020
-
Figure 4—source data 2
A list of somatic indels detected in the MMR-deficient whole exome sequenced tumour samples, and results of their validation.
- https://doi.org/10.7554/eLife.02725.021
-
Figure 4—source data 3
Somatic substitutions and indels in homopolymers together with their recurrence rate as identified by whole-exome and whole-genome sequencing.
- https://doi.org/10.7554/eLife.02725.022
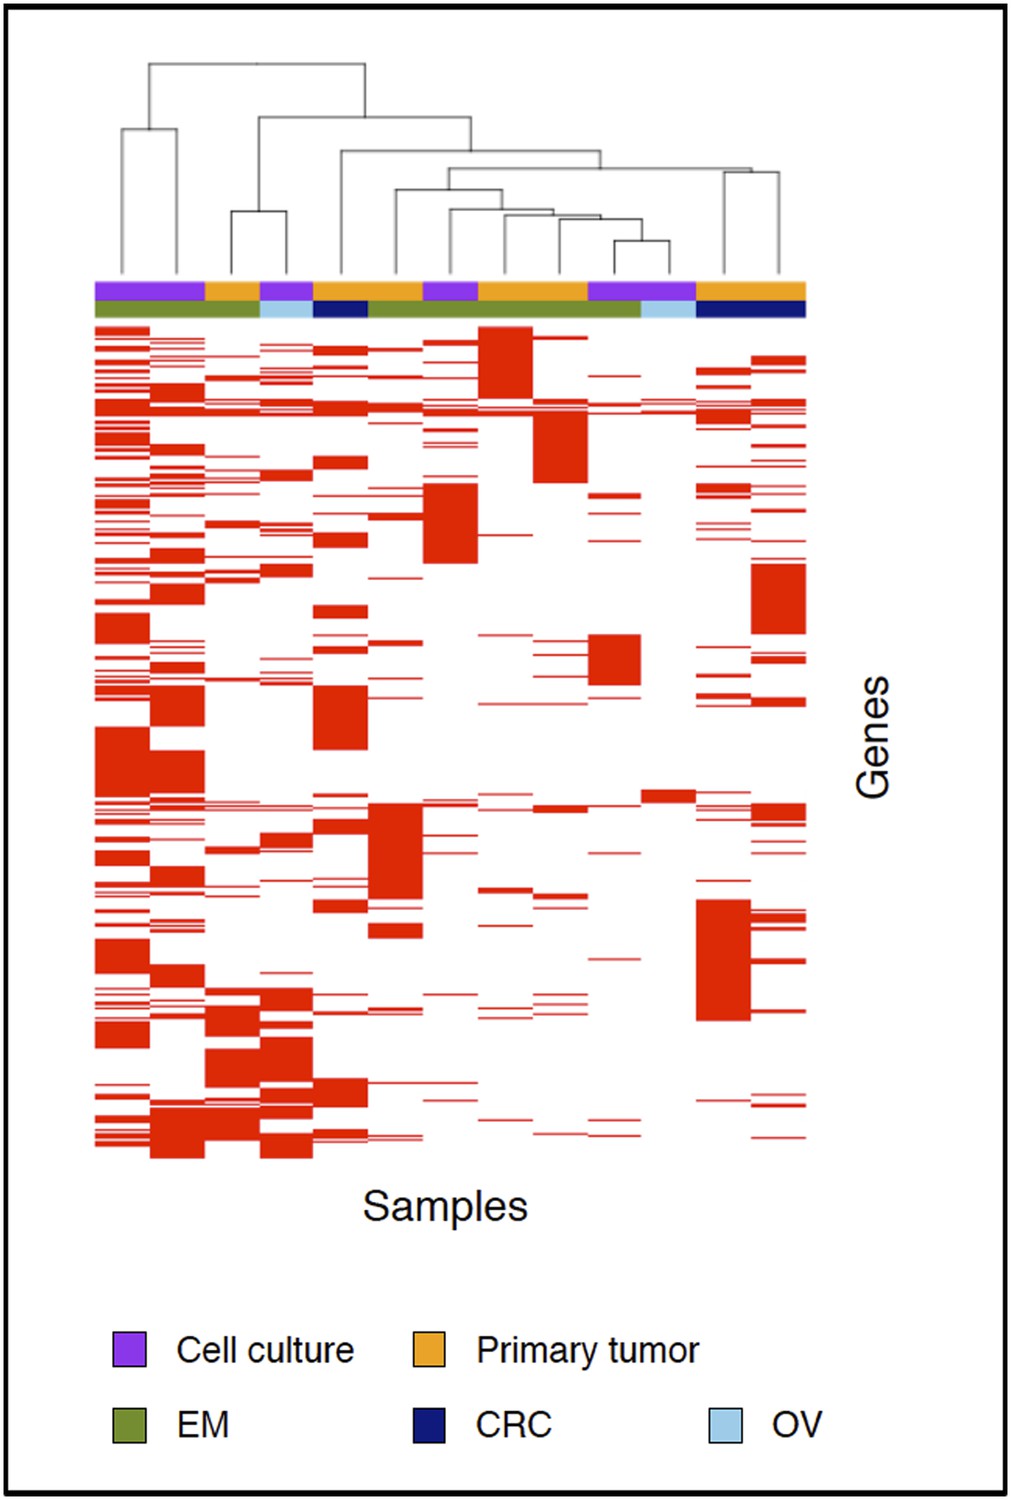
Figure 4—figure supplement 1
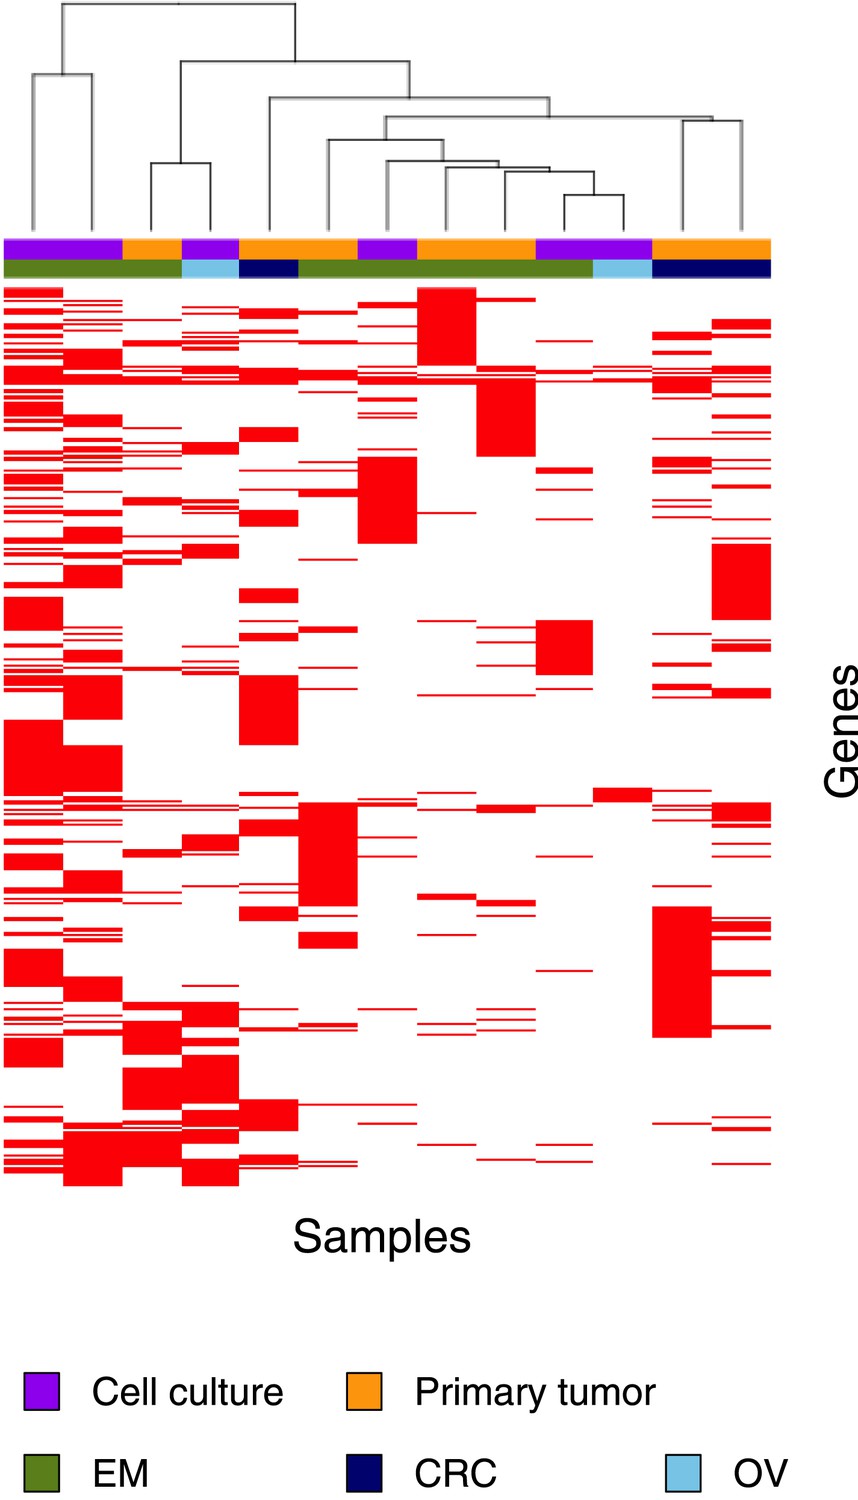
Clustering analysis of 13 MMR-deficient exomes for the genes affected by either a somatic substitution or indel in the coding regions.
No obvious subgroups in terms of cancer of origin or between primary tumors and cell cultures were observed.
Figure 4—figure supplement 2

The fraction of indels (left panel) and substitutions (right panel) identified by whole-exome sequencing, as observed in microsatellites, homopolymers (length over 5 bp), short homopolymers (length of 3–5 bp) and ‘not in repeat regions’ compared to their expected fraction in these regions.
Indels mainly affected homopolymers (59.0%), whereas microsatellites and short homopolymers were affected at a frequency that was expected based on their genome-wide occurrence. In contrast, indels were depleted in non-repeat regions. Substitutions affected the exome independent of repeat composition. These distributions mirror our observations in the MMR-deficient tumors undergoing whole-genome sequencing.
Figure 4—figure supplement 3

Characteristics of the exonic homopolymers recurrently affected.
For the 477 homopolymers affected in at least 2 out of 16 tumors, respectively 176, 135, 85, and 81 consisted of A, T, G, or C stretches. Out of the 34 homopolymers affected in at least 6 out of 16 tumors, 15, 15, 1, and 3 consisted of A, T, G, or C stretches, respectively. The length of recurrently affected homopolymers (in at least 2 out of 16 tumors) varied from 6 nucleotides to 25 nucleotides, but recurrence was biased towards homopolymers with length 7–9 nucleotides.
Figure 4—figure supplement 4
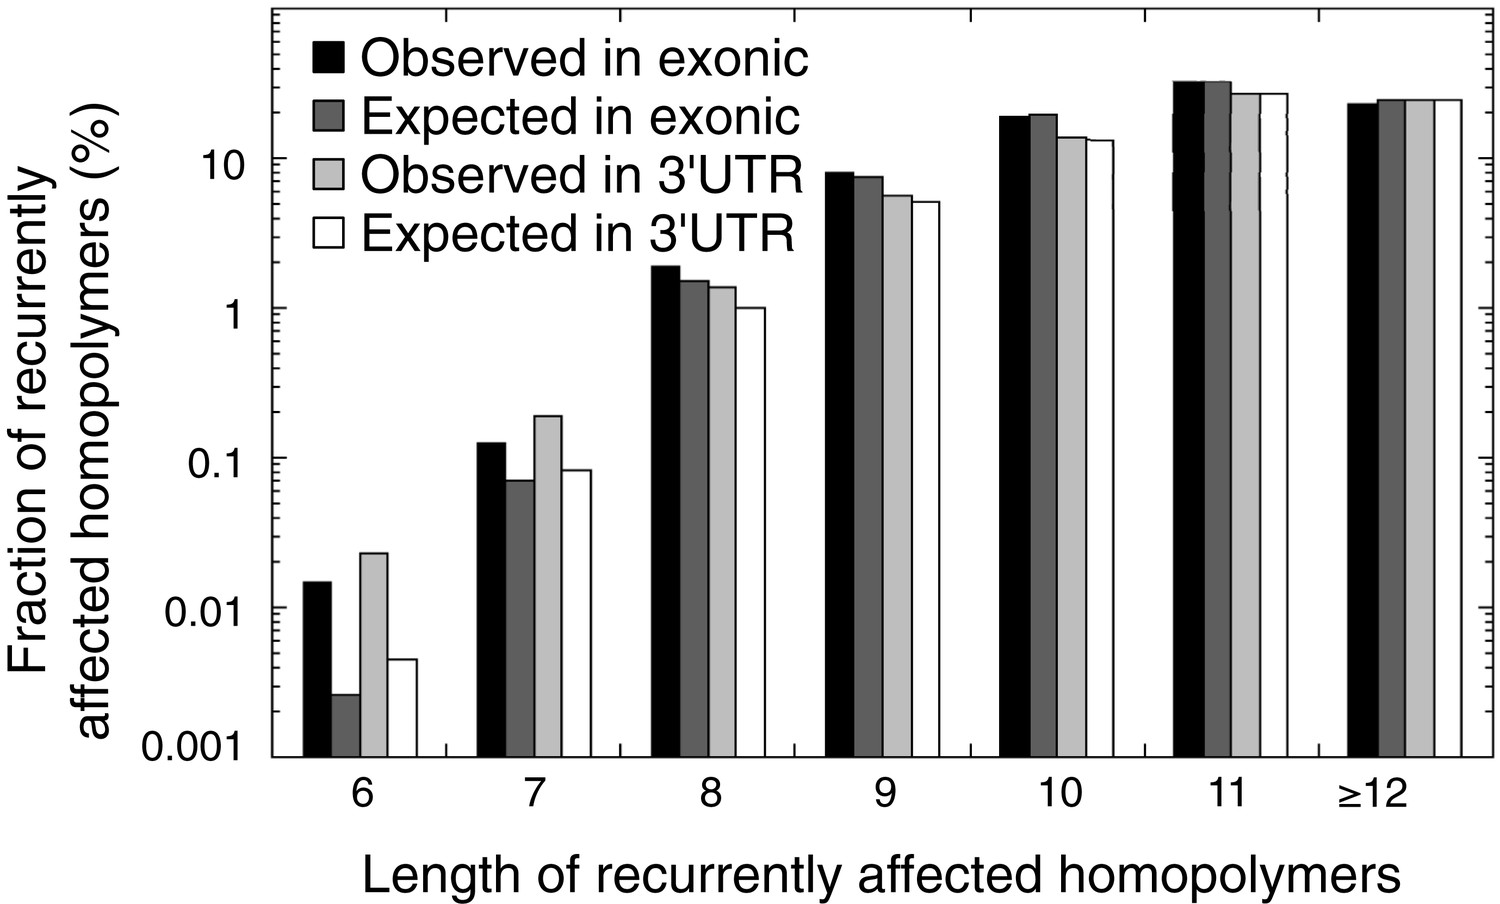
The observed and expected frequencies of indels recurrently affected in homopolymers (in at least 2 out of 16 tumors) stratified for homopolymer length and for those affecting coding exonic regions and the 3′UTR.
The difference between observed and expected recurrent indels is high for short homopolymers, but non-existent for long homopolymers.
Figure 4—figure supplement 5
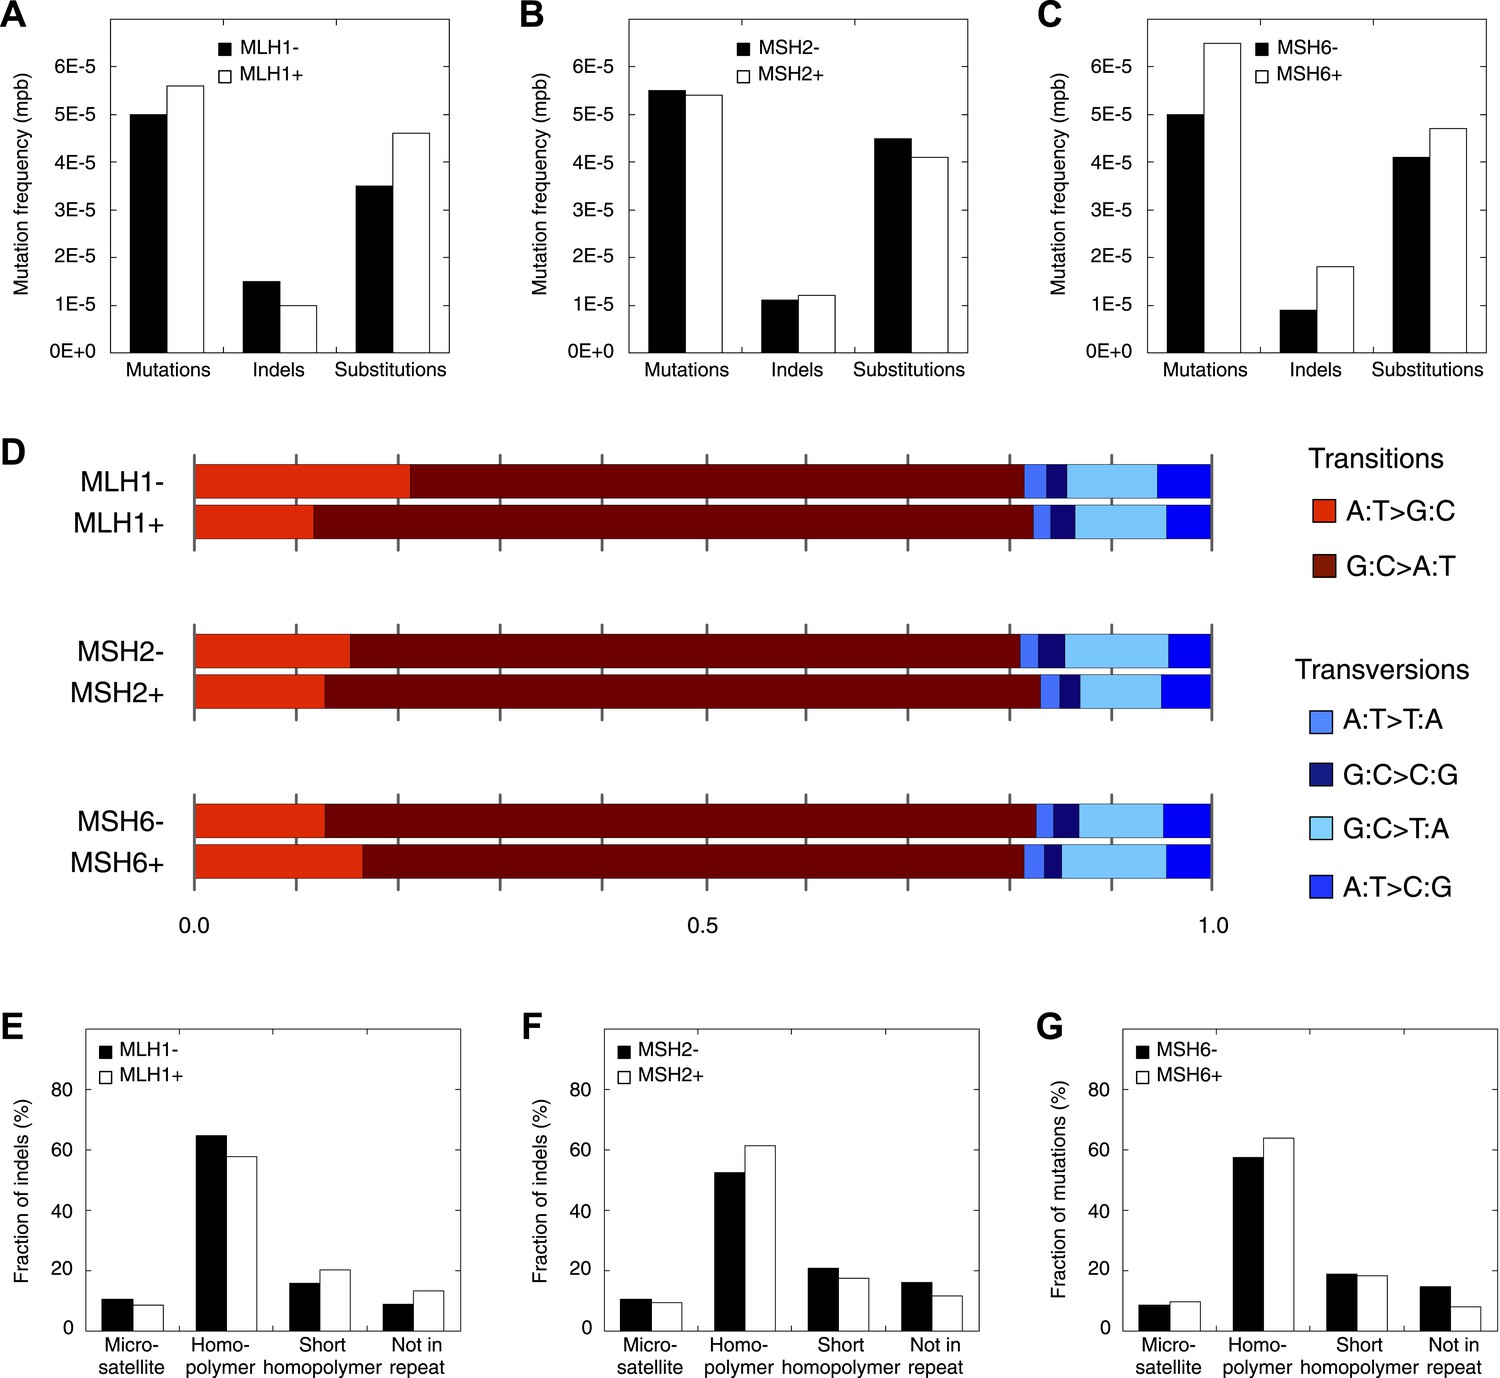
Mutation patterns obtained from MLH1-deficient, MSH2-deficient, and MSH6-deficient exomes.
(A–C) Mutation frequencies. (D) Somatic substitution patterns. (E–G) Indel compositions. No obvious difference is observed.
Figure 5
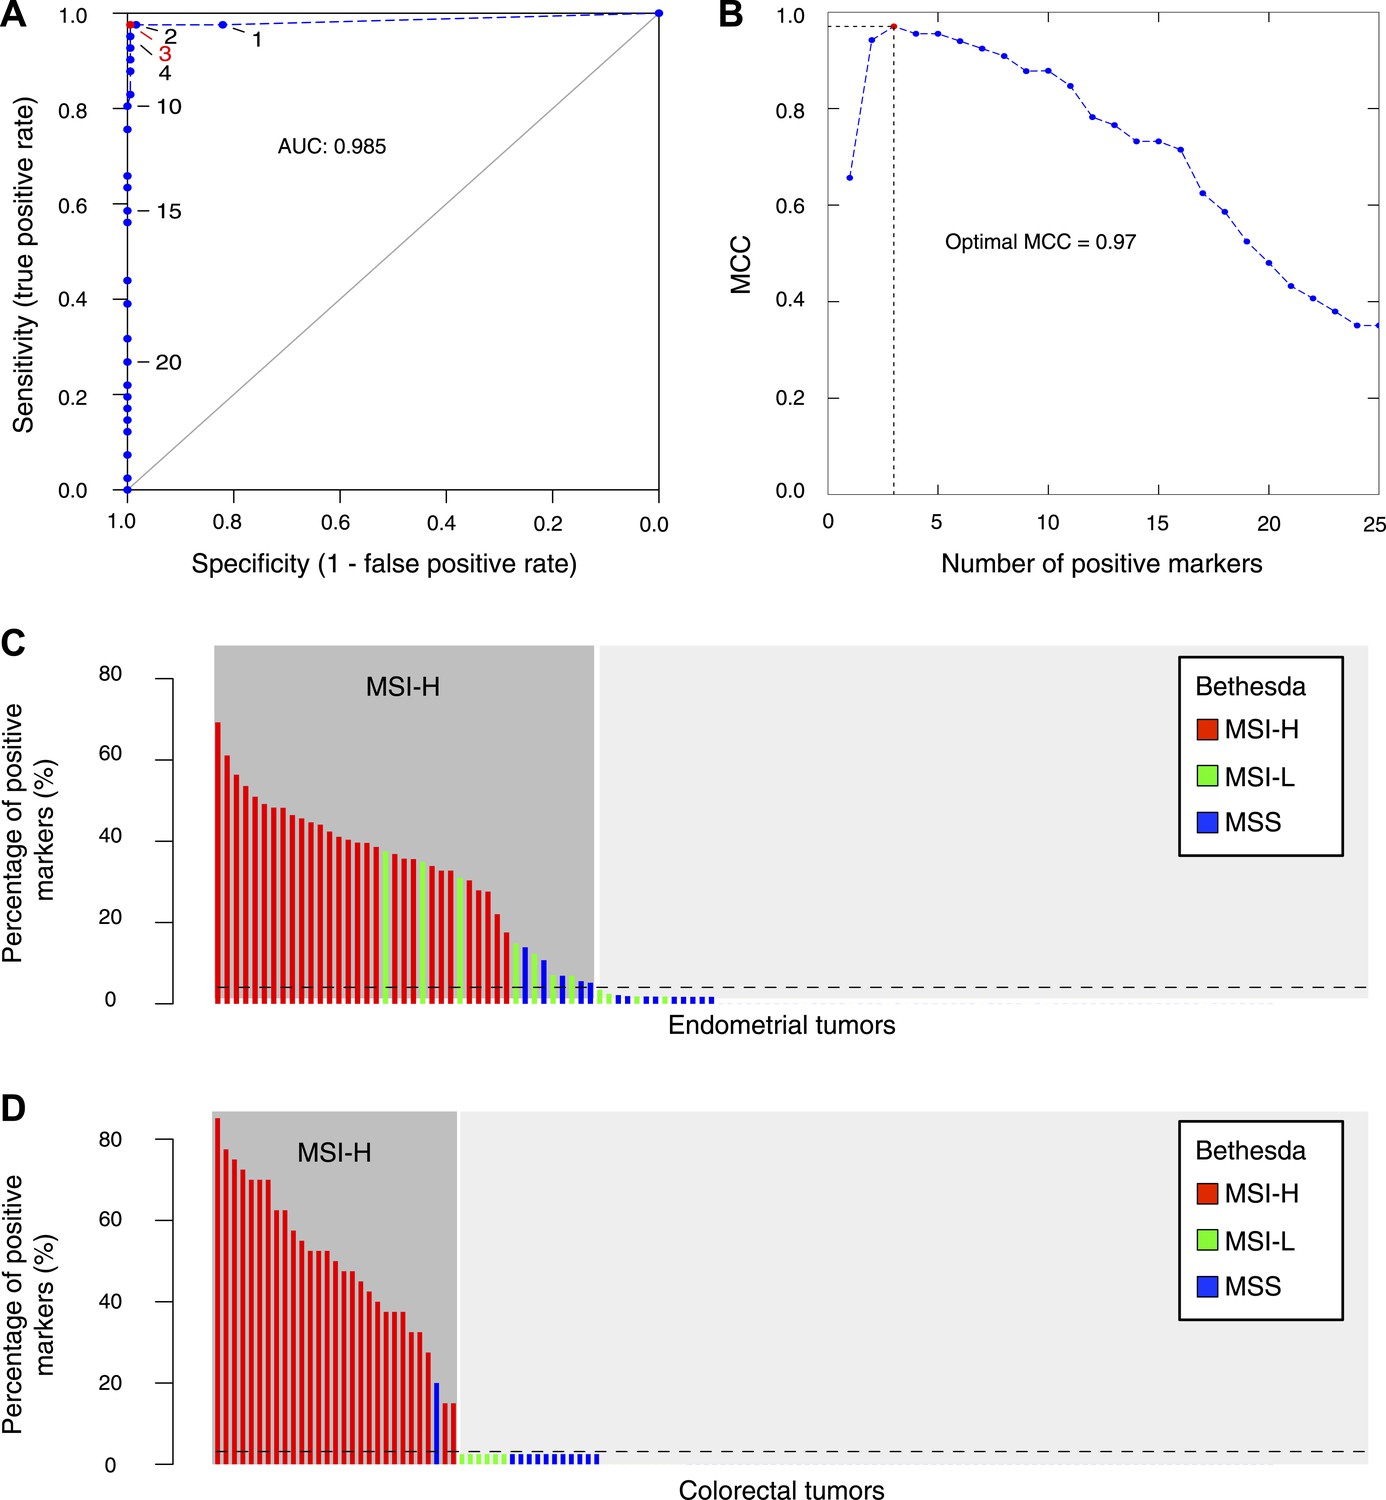
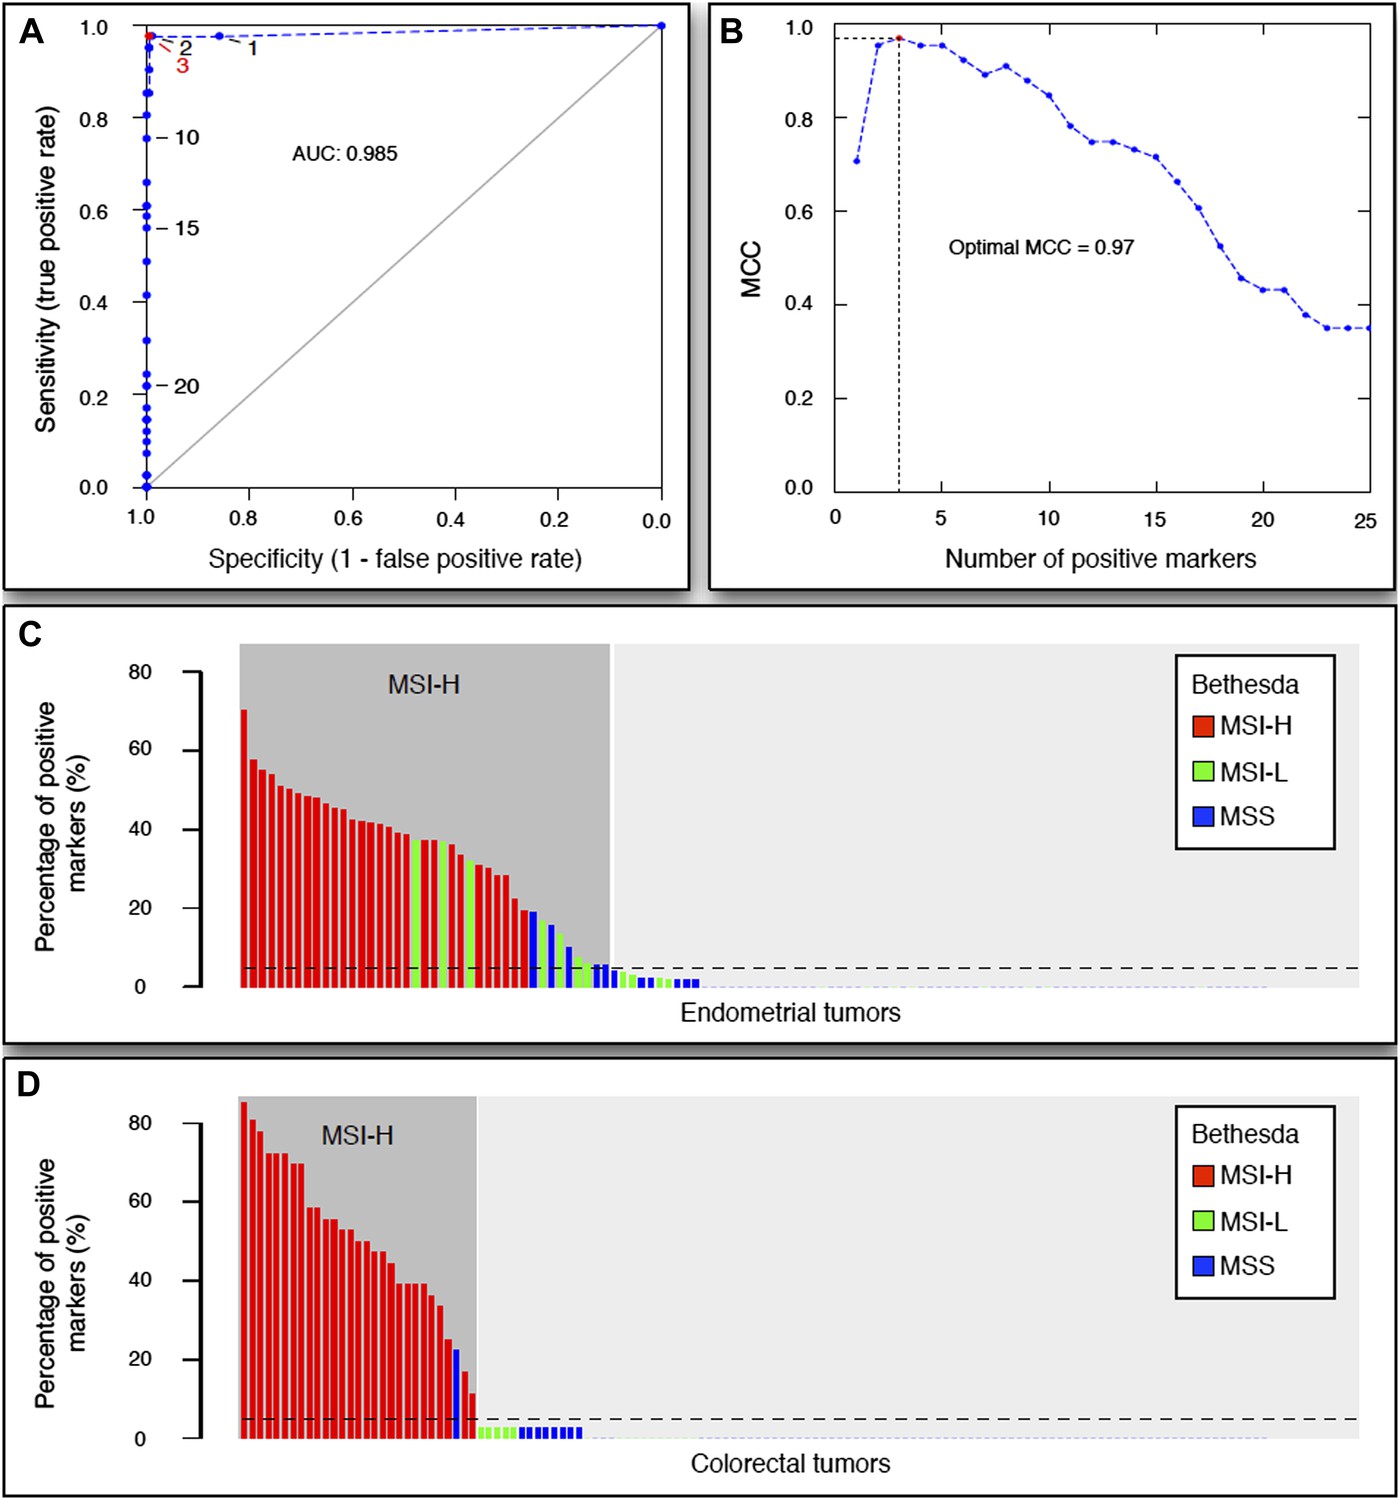
The 56-marker panel for MSI testing.
(A) Receiver–operator curve assessing the impact of the number of positive homopolymer markers (out of 59) on the sensitivity and specificity of MSI testing, based on a panel of 236 EM tumors immunohistochemically characterized for their MMR status. (B) The Matthew Correlation Coefficient (MCC) of the ROC curve was calculated for each threshold, and a threshold of 3 resulted in the highest MCC-value (MCC = 0.97). (C and D) The extended Bethesda panel and the 59-marker panel were compared in an independent series of 114 unselected primary endometrial tumors (C) and 126 stage II or III CRC tumors (D). Results were color-coded according to high microsatellite instability (MSI-H; more than 1 markers positive), low microsatellite instability (MSI-L; 1 marker positive), or microsatellite stable status (MSS; 0 markers positive) as determined with the extended Bethesda panel. For endometrial tumors, 71 tumors (62%) were defined as MSS/MSI-L and 43 tumors (38%) as MSI-H by the 59-marker panel. Out of these 43 MSI-H tumors, Bethesda identified 32 tumors as MSI-H (>2 markers positive), 7 tumors as MSI-L, and 5 tumors as MSS. Vice versa, Bethesda did not identify any MSI-H tumor that was not identified by our panel. For colorectal tumors, there were 97 MSS tumors in our 59-marker panel that were concordantly called MSS or MSI-L by the Bethesda panel. The remaining 29 samples were detected as MSI in the 59-marker panel. 28 of these were also called MSI-H by the Bethesda panel, whereas one was called MSS by the Bethesda panel.
-
Figure 5—source data 1
Recurrent indels selected for the 59-marker MSI panel and the results of a logistic regression analysis to detect differences between MSI-H and MSI-L/MSS tumors.
- https://doi.org/10.7554/eLife.02725.029
-
Figure 5—source data 2
Clinical information, MMR-mutation status and sequencing statistics for ovarian tumors and leukemias.
- https://doi.org/10.7554/eLife.02725.030
Figure 6 with 3 supplements
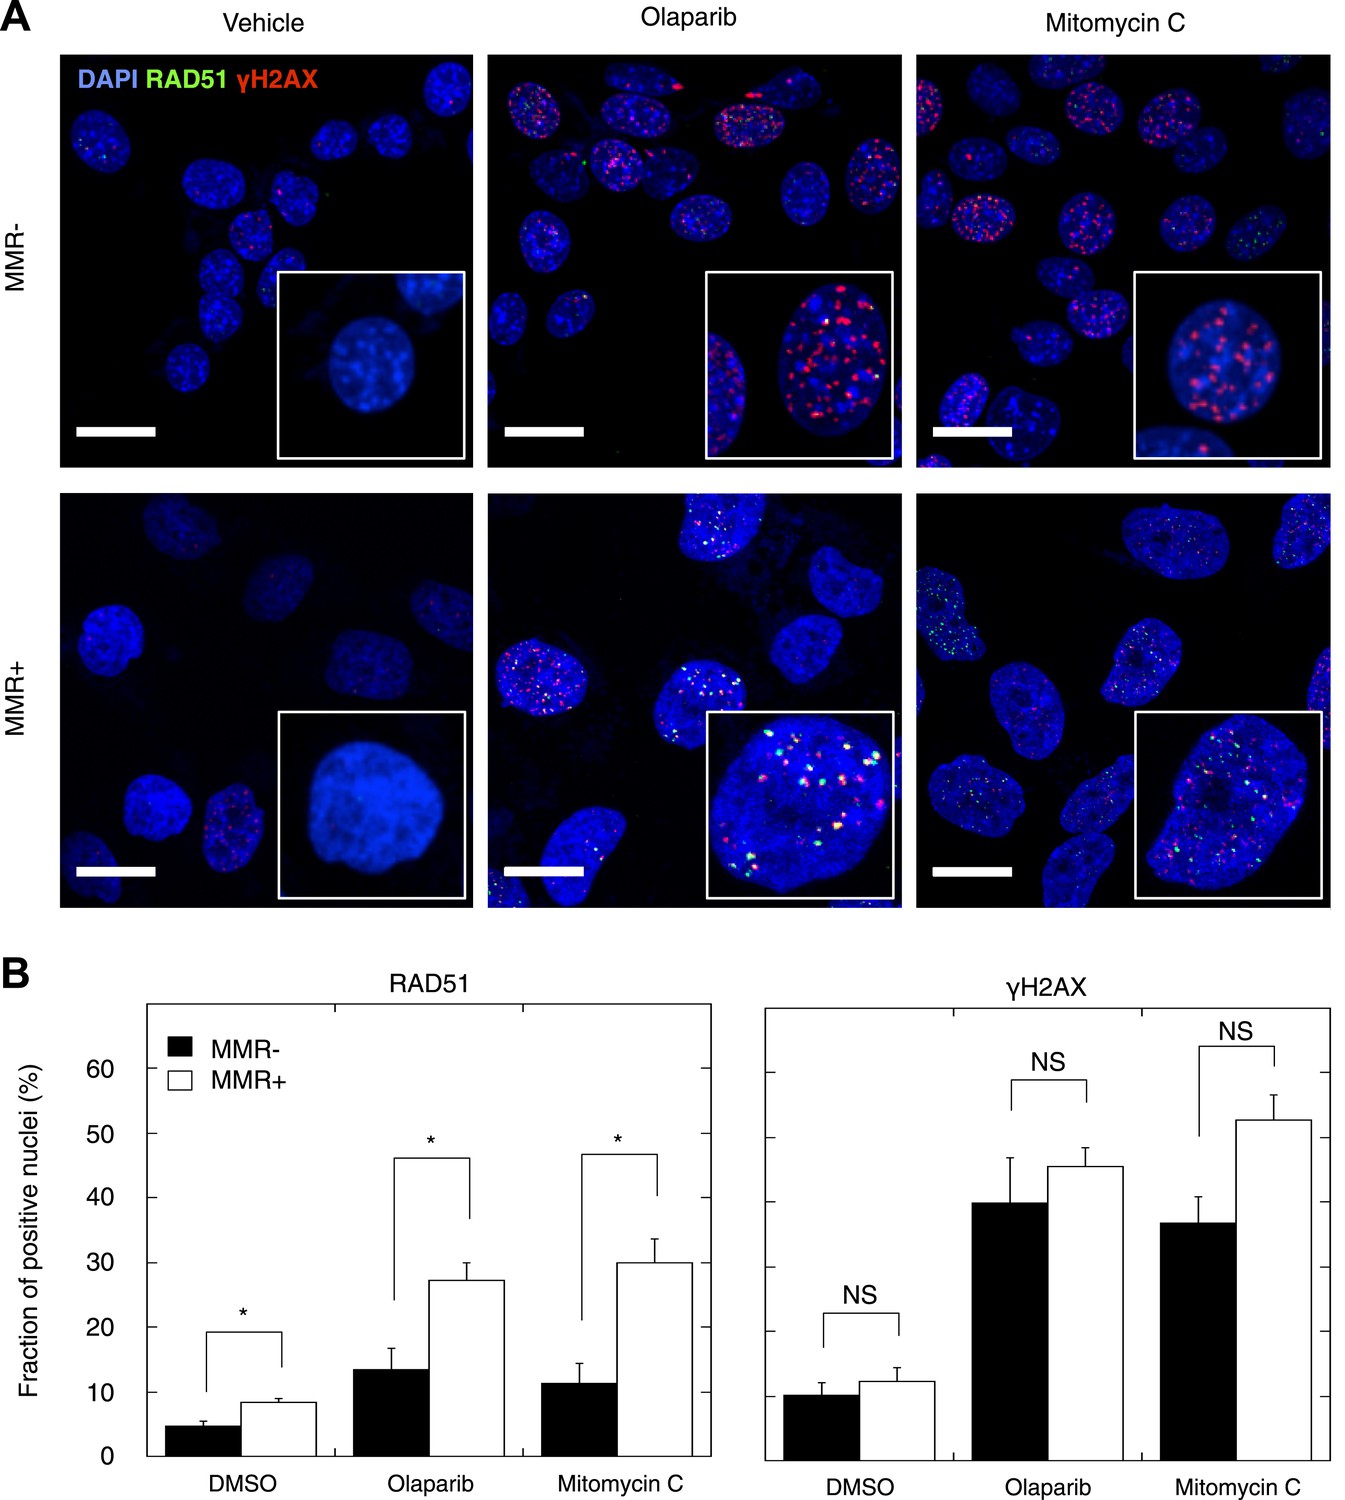
Reduced DSBR by HR activity in MMR-deficient cells.
(A) Representative confocal images of MMR-deficient and MMR-proficient primary tumor cells exposed for 24 hr to vehicle, 26 μM olaparib, or 300 nM mitomycin C stained for the homologous repair marker RAD51 (green), the DNA damage marker γH2AX (red), and counterstained with DAPI (blue). The bar is 10 µm wide. (B) Quantification of cells containing >5 RAD51 or γH2AX foci. Averages are shown for MMR-deficient and MMR-proficient primary tumor cultures after 24 hr of treatment with vehicle, 26 μM olaparib or 300 nM mitomycin C.
Figure 6—figure supplement 1
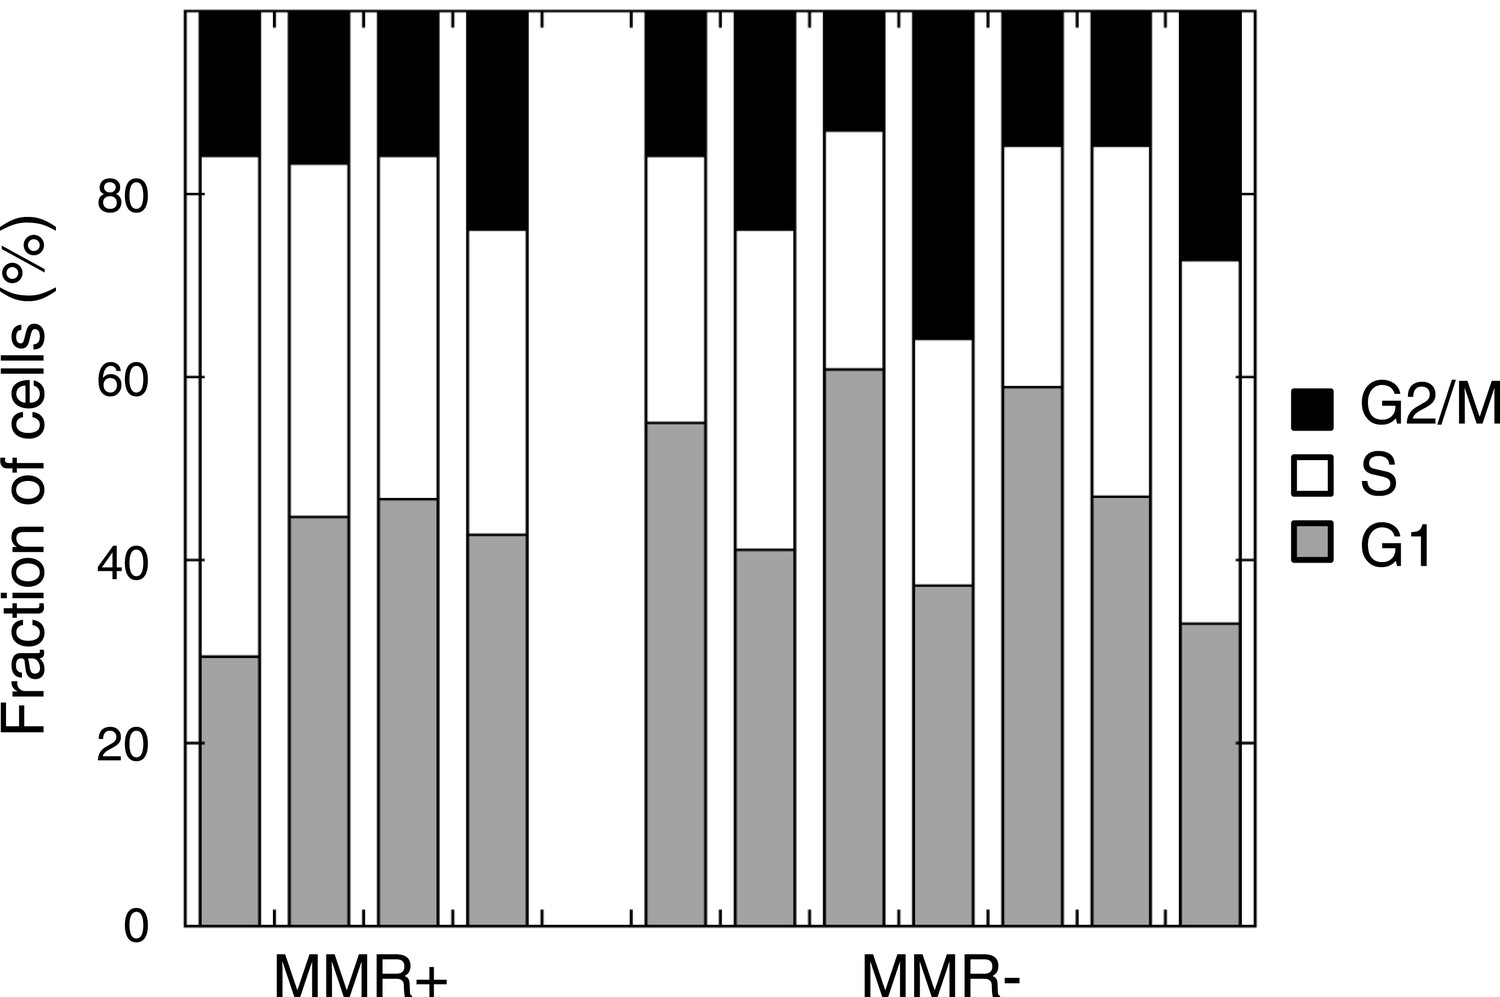
Cell cycle distribution in untreated MMR-deficient and MMR-proficient cell cultures.
No difference was observed in G1, S, or G2/M phase frequency between 7 MMR-deficient and 4 MMR-proficient cultures (p = 0.45, 0.30 or 0.94).
Figure 6—figure supplement 2
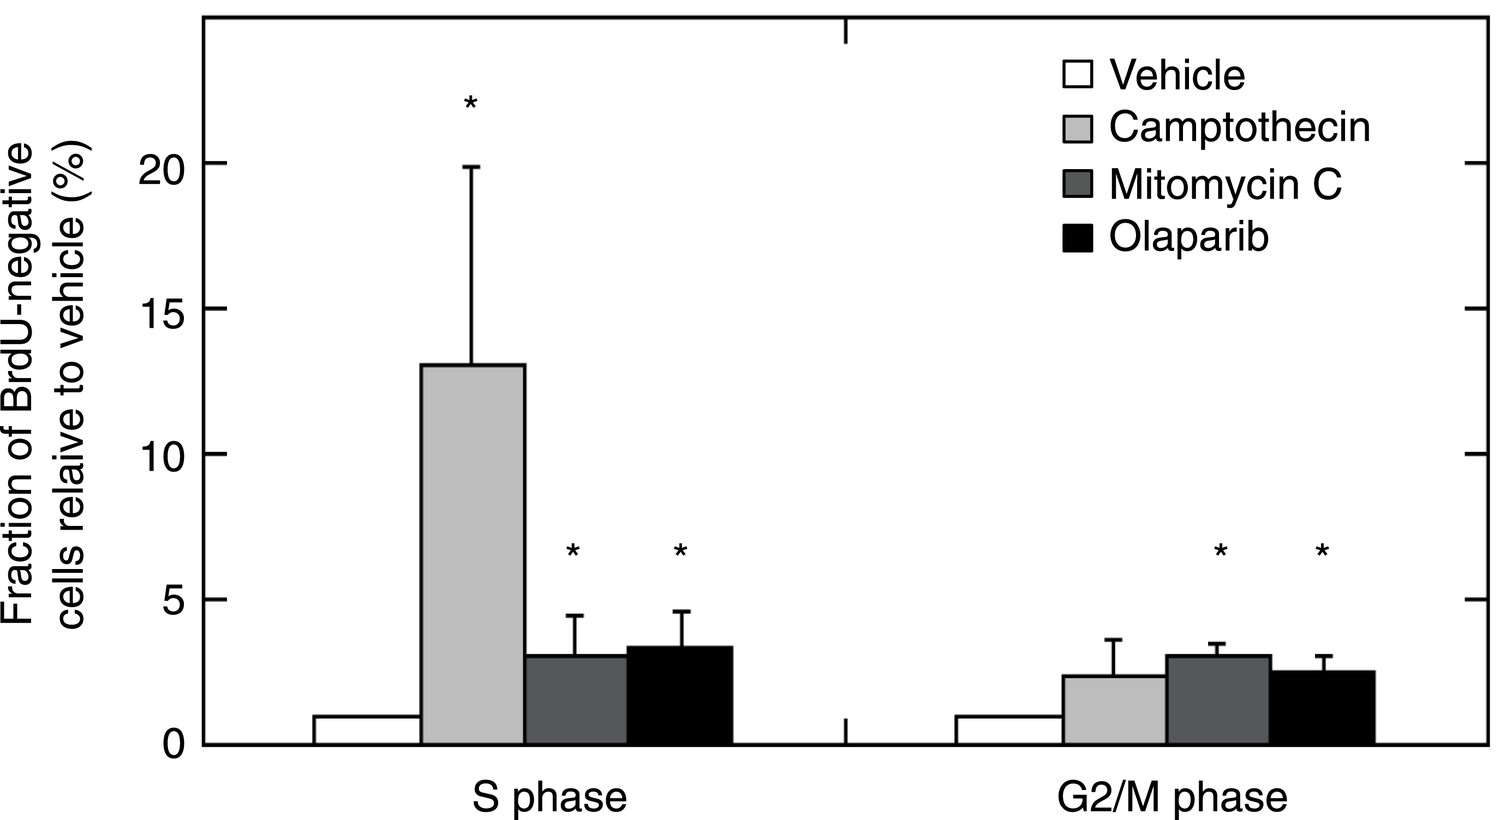
MMR-deficient tumor cultures were challenged with olaparib (26 μM), camptothecin (30 nM), or mitomycin C (300 nM) for 24 hr, pulsed with BrdU for 2 hr and analyzed for cell cycle by propidium iodide staining (DNA content analysis) using flow cytometry.
The bar plot shows the fraction of unlabeled (arrested) cells in S and G2/M, normalized to the G1 fraction; bars indicate SEM; data represent the results from 7 cultures. All experiments were repeated twice. DNA damage provoked by exposure to camptothecin consistently increased stalled (BrdU-negative) cells in S phase (average 13-fold increase; p = 5.23E−5). Mitomycin C caused an increase of stalled cells in S phase (3.08-fold; p = 5.8E−3) and in G2/M phase (3.12-fold; p = 2.2E−7). Olaparib induced, as expected, an increase in stalled cells in S and G2/M (respectively, a 3.35 and a 2.54-fold increase; p = 2.1E−3 and 5.2E−4). Overall, this indicates that MMR-deficient cultures did not exhibit any loss of G2/M cell cycle checkpoints or DNA damage signaling.
Figure 6—figure supplement 3
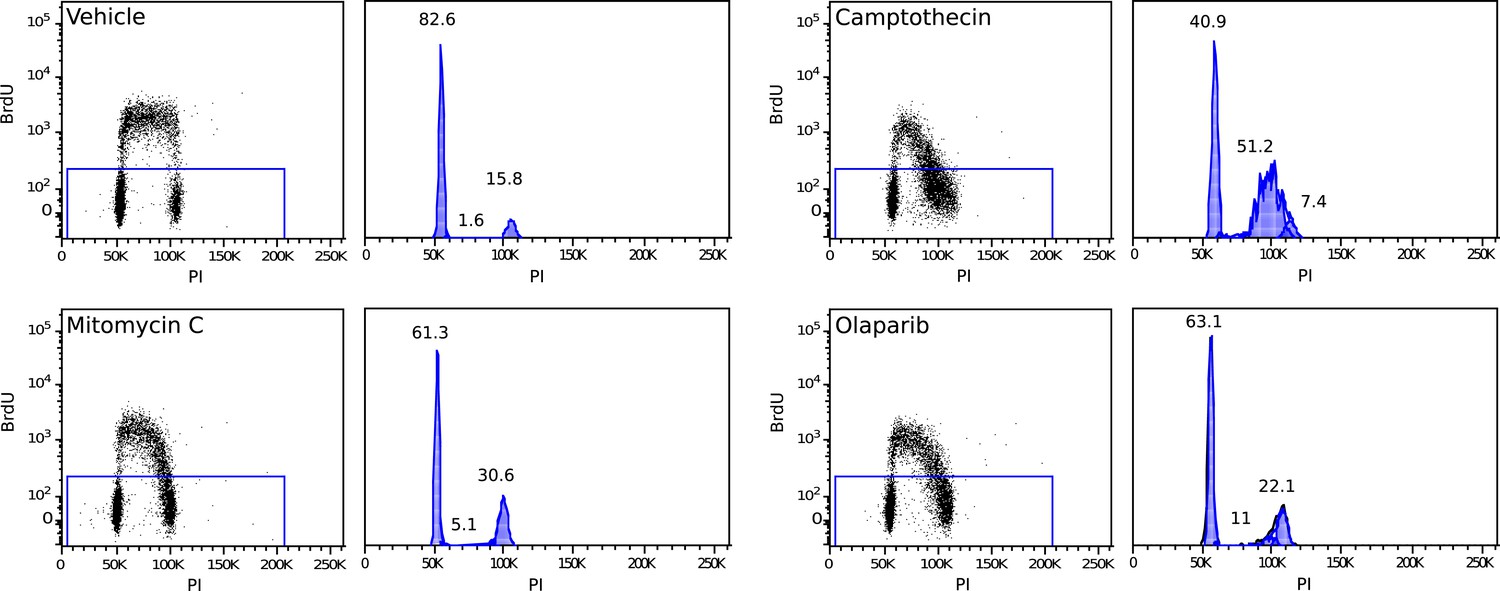
Example of a 2 hr BrdU pulse-labeled MMR-deficient cell culture, demonstrating S-phase stalling and G2/M stalling upon mitomycin C exposure, S-phase stalling upon camptothecin exposure and S-phase stalling and G2/M stalling upon olaparib exposure.
Cell cycle phases in unlabeled (stalled) fractions were determined as described by Watson et al.
Figure 7 with 1 supplement
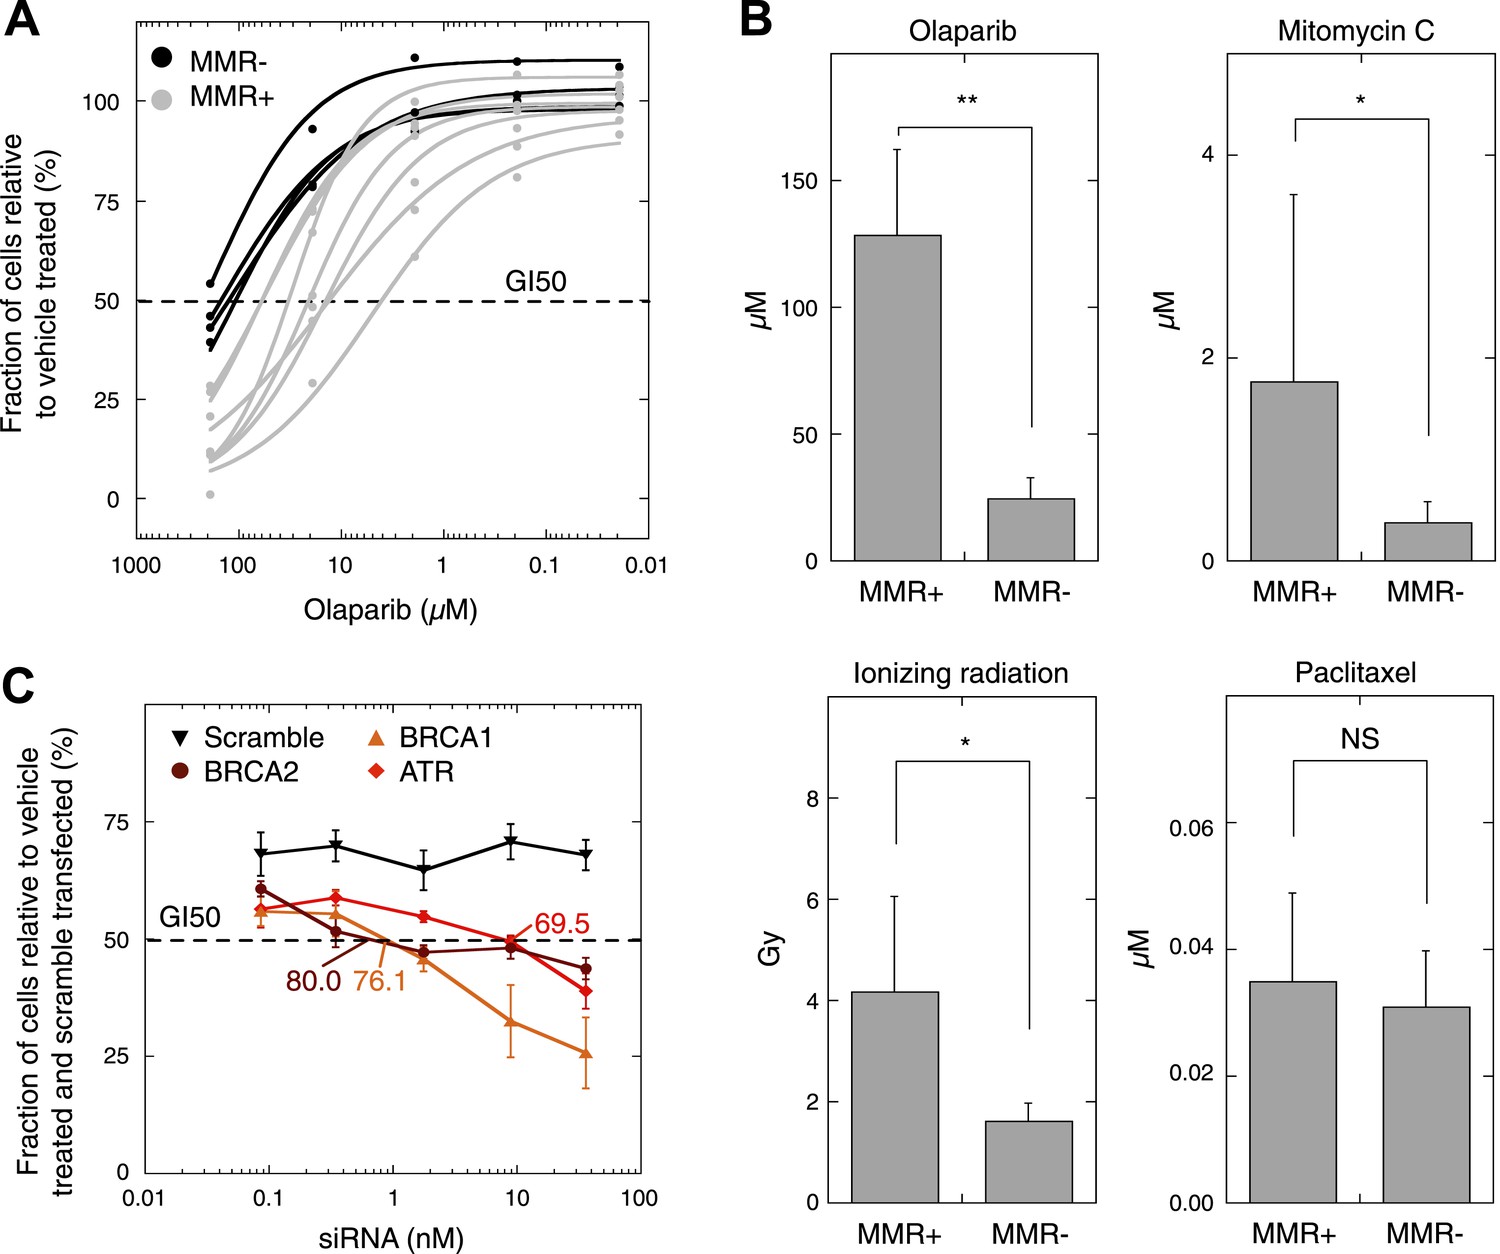
MMR-deficient cells are sensitive to PARP inhibition.
(A) Dosimetry experiments assessing the effect of decreasing concentrations of olaparib on in vitro cell proliferation relative to the corresponding untreated cultures as measured by sulforhodamine B assays. (B) Cytotoxicity of olaparib, mitomycin C, ionizing radiation and paclitaxel as measured by sulforhodamine B assays. Displayed are the average concentrations (μM) or dose (Grey, Gy) that inhibit 50% of the normal growth. p-values are 0.0077, 0.040, and 0.038 for olaparib, mitomycin C, and ionizing radiation, while p-value is not significant (NS) for paclitaxel. (C) Effect of knock-down of BRCA1, BRCA2, and ATR mRNA on olaparib sensitivity of the MMR-proficient, HR-proficient MCF7 cell line. Cells were transfected with the indicated siRNA concentration (X axis), and after 24 hr incubated with 26 µM olaparib or vehicle. Another 48 hr later, cell viability was assessed using the sulforhodamine B assay. The siRNA concentration corresponding to a growth inhibition of 50% was subsequently assessed for the level of knock-down induced. The resulting values are indicated on the plots and are expressed as %. Values plotted were normalized to vehicle-treated cells transfected with a scrambled siRNA of matching concentration.
Figure 7—figure supplement 1
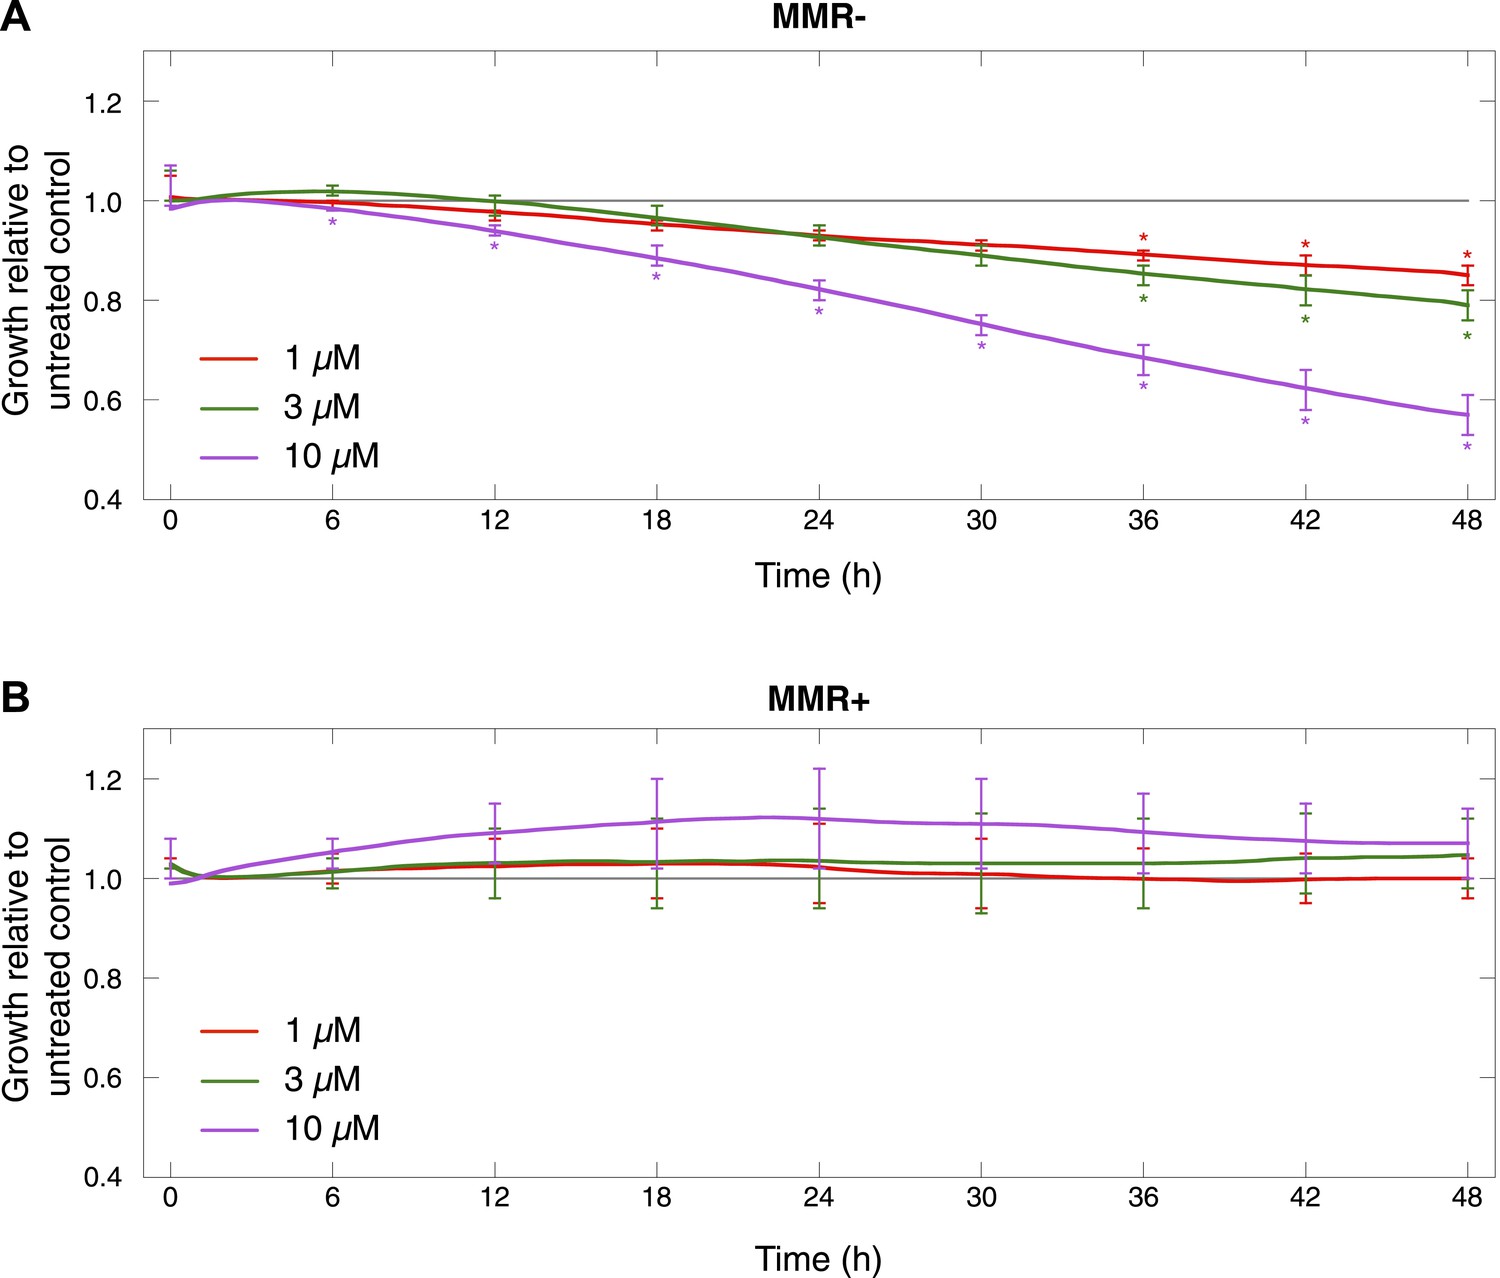
Cell proliferation of MMR-deficient cultures was measured in real-time using the xCELLigence RTCA DP system (for up to 48 hr after treatment).
Values are normalized to the vehicle-treated control. Error bars represent SEM. The average cell proliferation of 7 MMR-deficient cells (A) and 4 MMR-proficient cells (B) with increasing concentrations of olaparib (1 μM, 3 μM, 10 μM) is shown. Overall, MMR-deficient cultures were characterized by a dose-dependent decrease in proliferation, whereas MMR-proficient cells did not response to olaparib.
Author response image 1
The 54-marker panel generated from 13 Illumina-sequenced exomes for MSI testing.
Author response image 2
Clustering analysis of all samples based on the genes carrying somatic mutations in their coding regions.
Tables
Table 1
Standard diagnostic tests to assess MMR-deficiency
| Tumor | Histopathology | Grade | Stage | Coverage | IHC | MSI | MLH1 hyper-methylation | |||
|---|---|---|---|---|---|---|---|---|---|---|
| Tumor | Germ-line | MLH1 | MSH2 | MSH6 | ||||||
| MMR− 1 | Endometrioid | 3 | IIIc | 87.1 | 81.1 | + | + | −(*) | + | − |
| MMR− 2 | Serous/clear cell | 3 | Ib | 24.8 | 21.9 | + | − | − | − | − |
| MMR− 3 | Endometrioid | 2 | Ib | 28.5 | 30.0 | − | + | + | + | + |
| MMR+ 1 | Endometrioid | 3 | I | 119.4 | 73.1 | + | + | + | − | + |
| MMR+ 2 | Serous | 3 | Ia | 79.2 | 77.0 | + | + | + | − | − |
-
Tumors and matched germ-line were whole-genome sequenced using either Complete Genomics or Illumina sequencing technology. For each tumor, microsatellite instability (MSI) using the extended Bethesda panel, standard immunohistochemistry of MMR proteins (MLH1, MSH2, and MSH6), and methylation status of the MLH1 promoter are shown.
-
*
a weak positive nuclear staining in the minority of the tumor cells.
Table 2
Pathways most significantly affected by exonic indels
| Database | Pathway | Rank | FDR | Affected samples (n = 16) | Mutations per sample |
|---|---|---|---|---|---|
| *DSBR by HR (custom definition) | n.a. | n.a. | 16 | 3.25 | |
| BioCarta (ranking by GenomeMusic) | *ATR/BRCA pathway | 1 | 1.0E−16 | 15 | 3.50 |
| ATM pathway | 2 | 5.9E−11 | 15 | 2.69 | |
| G2 pathway | 3 | 7.2E−08 | 15 | 2.81 | |
| IL10 pathway | 4 | 2.2E−05 | 12 | 1.75 | |
| CARM1 and regulation of the Estrogen Receptor pathway | 5 | 2.2E−05 | 14 | 3.19 | |
| DNA Repair DB (ranking by GenomeMusic) | *Homologous recombination pathway | 1 | 1.3E−04 | 13 | 1.56 |
| Base excision repair pathway | 2 | 9.0E−02 | 10 | 0.75 | |
| Non-homologous end joining pathway | 3 | 1.7E−01 | 9 | 0.69 | |
| Nucleotide excision repair pathway | 4 | 8.3E−01 | 7 | 0.50 | |
| Reactome (ranking by GenomeMusic) | DNA repair | 1 | 2.5E−11 | 15 | 6.69 |
| Double strand break repair | 2 | 7.2E−08 | 15 | 2.94 | |
| *Homologous recombination repair | 3 | 1.9E−07 | 15 | 2.31 | |
| G2/M checkpoints | 4 | 2.3E−07 | 15 | 3.50 | |
| Cell cycle checkpoints | 5 | 4.5E−05 | 15 | 4.75 | |
| Base excision repair | 15 | 8.3E−03 | 10 | 0.94 | |
| Non-homologous end joining | 59 | 1.0E+00 | 8 | 0.63 | |
| Nucleotide excision repair | 61 | 5.9E−01 | 10 | 1.50 | |
| IPA (ranking by IPA) | *DNA double-strand break repair by homologous recombination | 1 | 4.7E−03 | 15 | 1.56 |
| Ovarian cancer signaling | 4.7E−03 | 16 | 5.75 | ||
| Role of NFAT in cardiac hypertrophy | 3 | 6.8E−03 | 14 | 3.88 | |
| Cell cycle: G2/M DNA damage checkpoint regulation | 4 | 1.3E−02 | 15 | 2.88 | |
| PPARα/RXRα activation | 5 | 1.4E−02 | 15 | 4.63 | |
| DNA double-strand break repair by non-homologous end joining | 60 | 1.7E−01 | 14 | 1.50 |
-
The five top ranking pathways are listed, as well as all annotated pathways relevant for DNA repair. The custom definition used throughout this manuscript was added for illustrative purposes. n.a. = not applicable.
-
*
The DSBR by HR pathway.
-
Table 2—source data 1
Results of pathway enrichments, custom definition of the DSBR by HR pathway and the allelic frequencies of mutations in HR genes.
- https://doi.org/10.7554/eLife.02725.032
Table 1
Validation rate of somatic indels detected upon whole-genome sequencing. These additional validation experiments for indels have been included in the revised manuscript
| Tumor | Somatic Indels | ||
|---|---|---|---|
| Confirmed | Not confirmed | Validation rate | |
| MMR- 1 | 187 | 20 | 90.3% |
| MMR- 2 | 103 | 21 | 83.1% |
| MMR- 3 | 54 | 6 | 90.0% |
| MMR+ 1 | 0 | 9 | 0.0% |
| MMR+ 2 | 2 | 7 | 22.2% |
Additional files
-
Supplementary file 1
- https://doi.org/10.7554/eLife.02725.039
Download links
A two-part list of links to download the article, or parts of the article, in various formats.
Downloads (link to download the article as PDF)
Open citations (links to open the citations from this article in various online reference manager services)
Cite this article (links to download the citations from this article in formats compatible with various reference manager tools)
Mismatch repair deficiency endows tumors with a unique mutation signature and sensitivity to DNA double-strand breaks
eLife 3:e02725.
https://doi.org/10.7554/eLife.02725


