Phasic activation of ventral tegmental neurons increases response and pattern similarity in prefrontal cortex neurons
- National Institutes of Health, United States
Figures
Figure 1
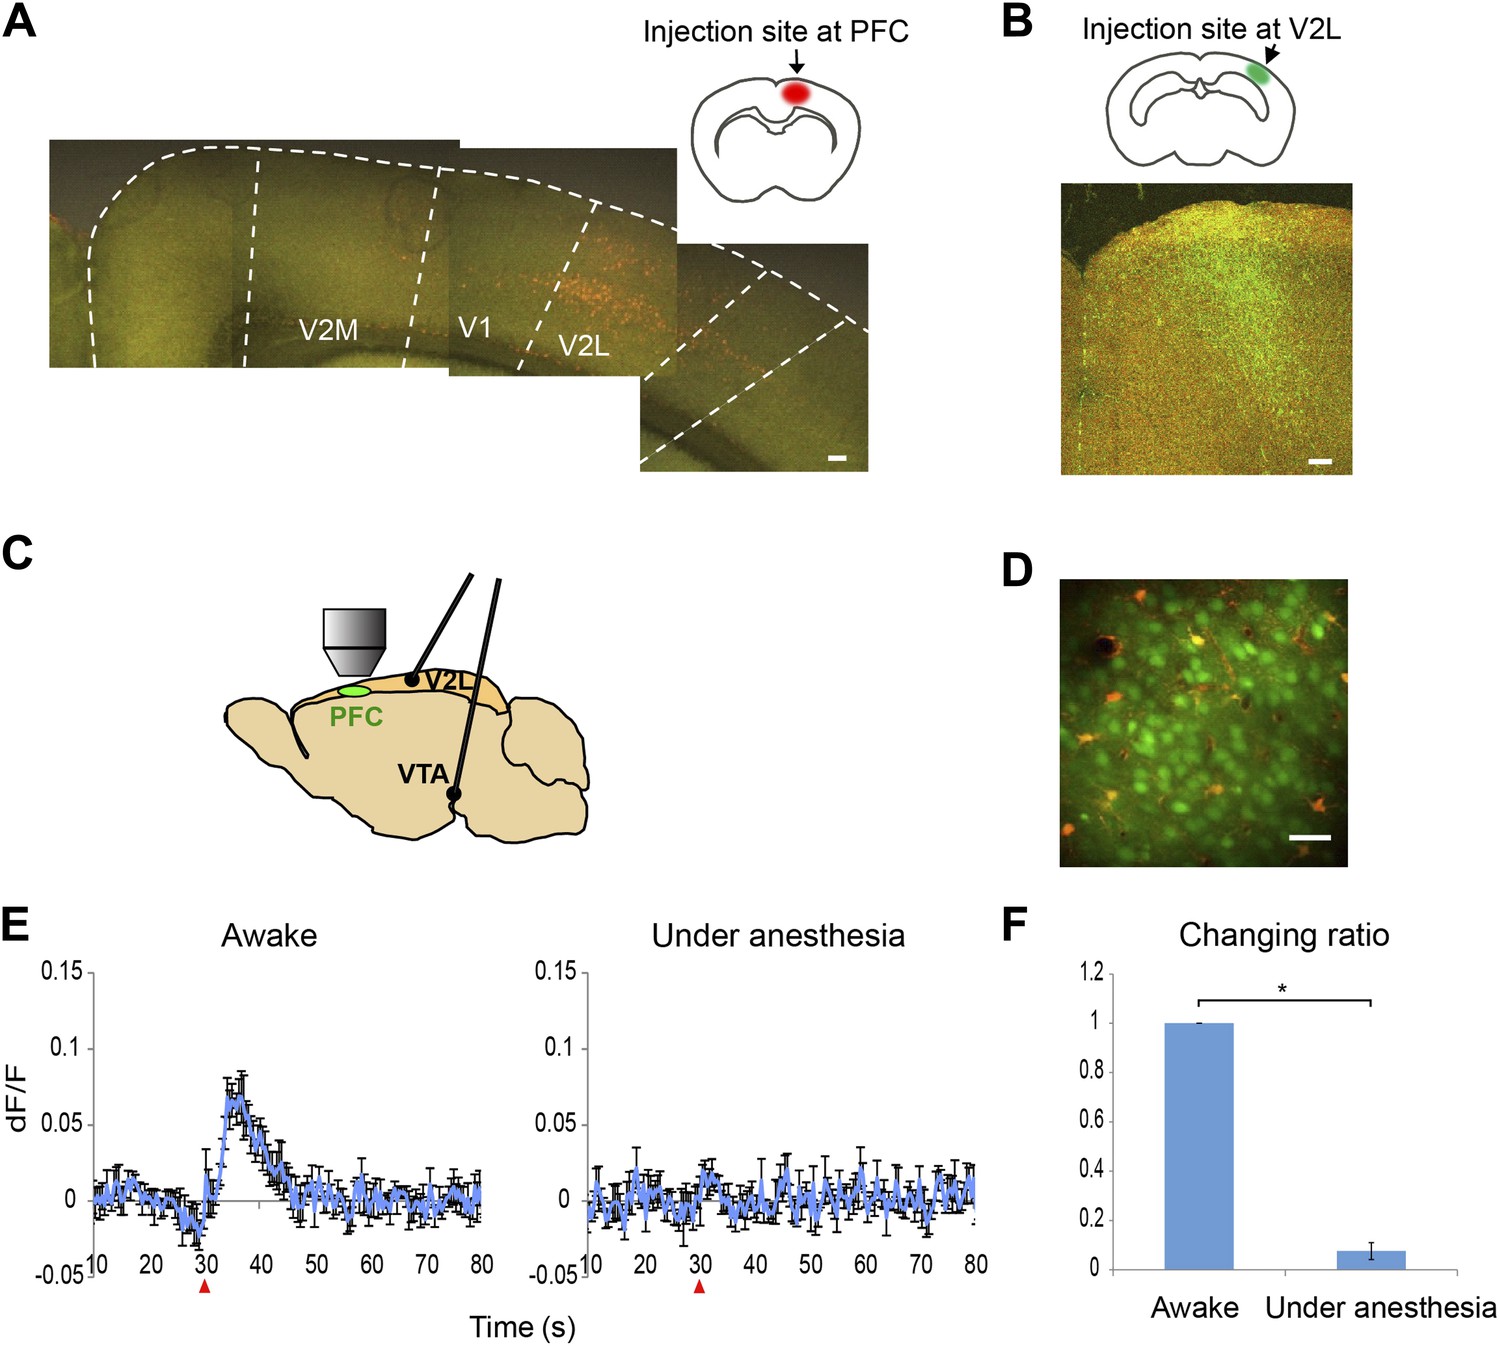
Ca2+ imaging setup and calcium transients in response to VTA stimulation with and without anesthesia.
(A) Retrograde tracing. Fluorogold was injected into the prefrontal cortex (PFC). Cells in the secondary visual cortex lateral area (V2L) were labeled. Scale bar, 250 μm. (B) Anterograde tracing. FITC-dextran was injected into the V2L. Labeled fibers were observed in the PFC. Scale bar, 100 μm. (C) Experimental setup for calcium imaging. A cranial window was opened over M2 (PFC). Two electrodes were implanted in the ventral tegmental area (VTA) and the V2L. (D) Two-photon image of calcium indicator (OGB-1)-labeled layer 2/3 cells in M2 (neurons, green; sulforhodamine-101 counterstained astrocytes, red to orange). Approximately 50–80 cells were analyzed in each animal. Scale bar, 30 μm. (E) The Ca2+ transients evoked in an awake animal and in an animal under anesthesia. Population average of Ca2+ transients (dF/F) in response to 10 pulses at 50 Hz VTA stimulation (n = 4 animals). VTA electrical stimulation was applied at the 30 s time point (red arrowhead). In contrast to a clear response in awake mice (left), the long-lasting Ca2+ transients were not detected in mice under anesthesia (right, 4% isoflurane). The same animals were used for the ‘Awake’ and ‘Under anesthesia’ experiments. (F) The effect of isoflurane on Ca2+ transients. The summed values of Ca2+ transients from the 30 to 50 s time points were compared with the ‘Awake’ value (changing ratio). Paired t test, *p < 0.05. Error bars represent SEM.
Figure 2 with 1 supplement
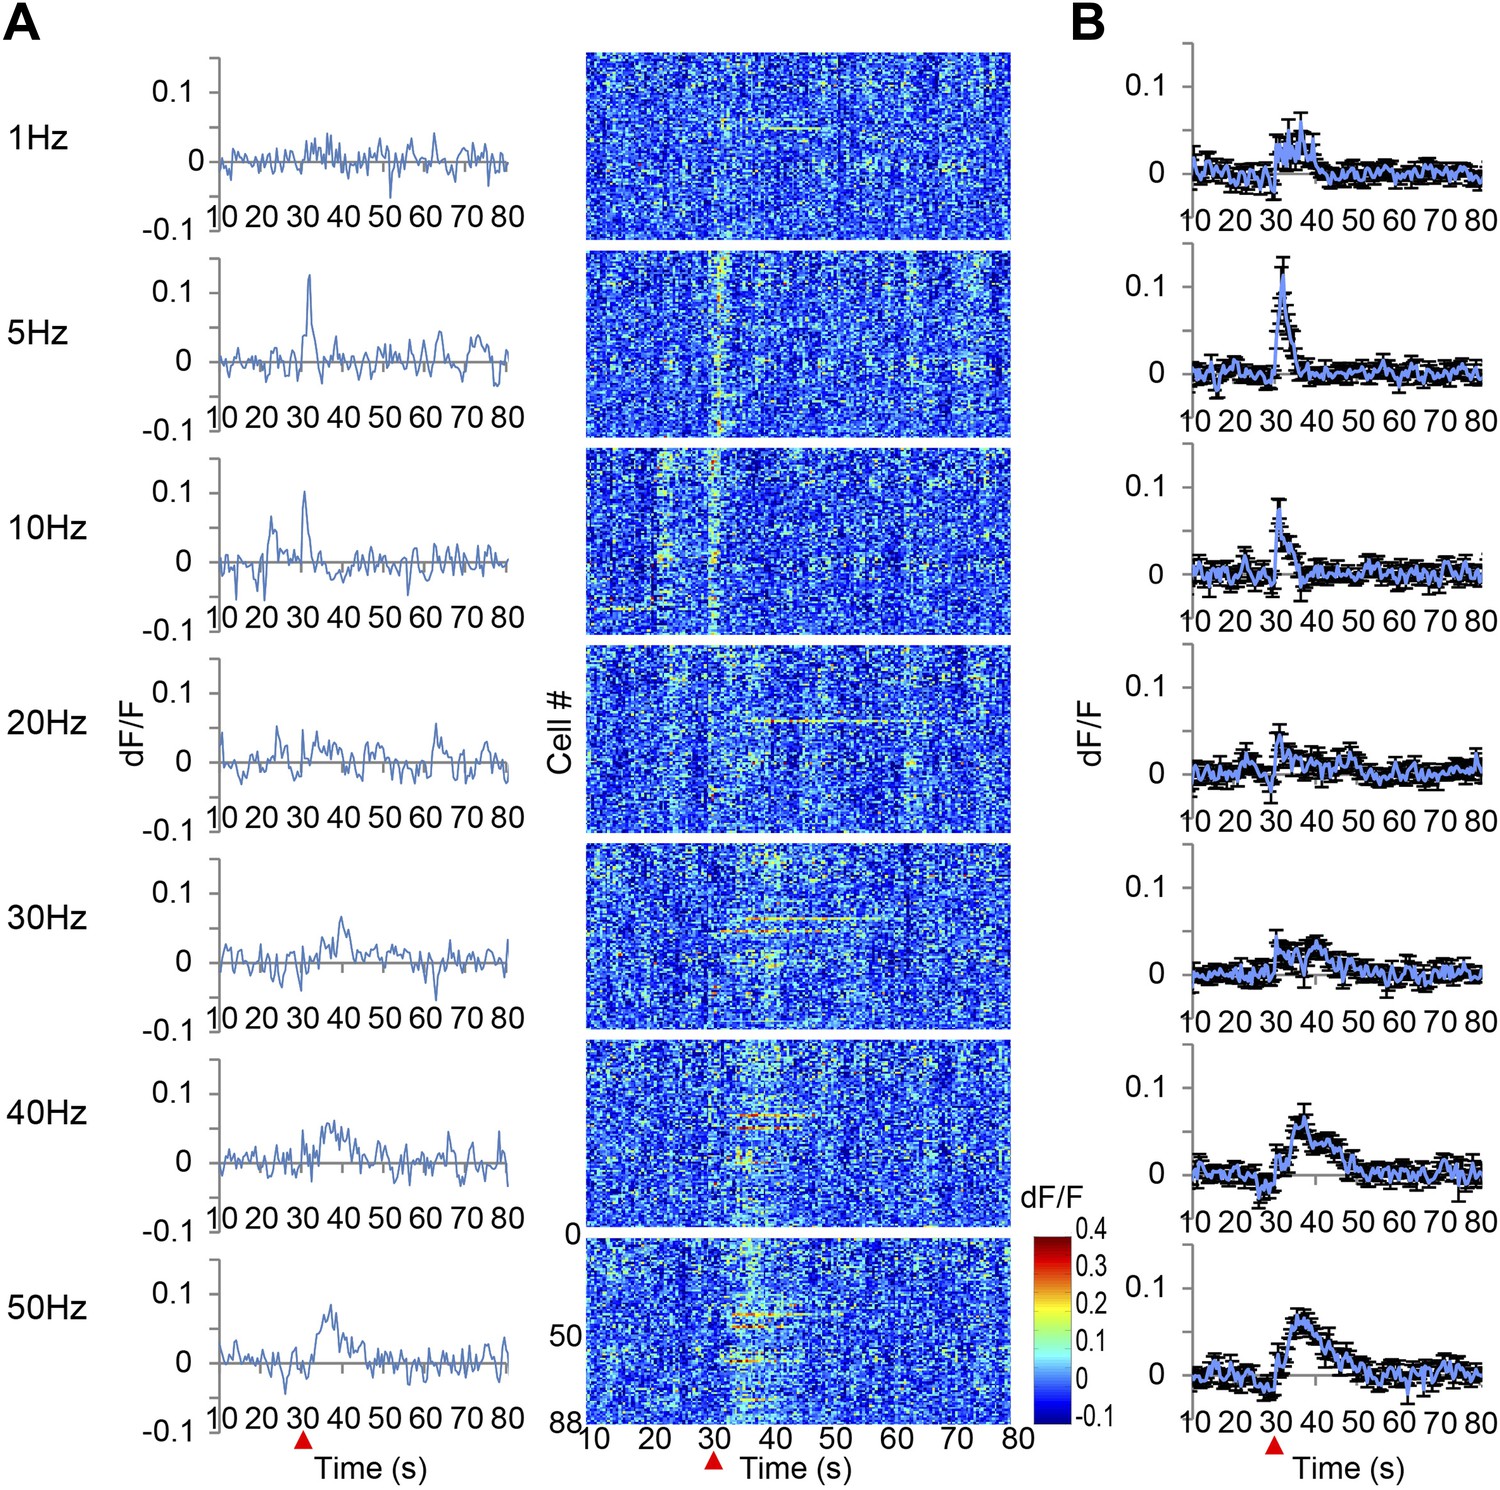
Ca2+ transients in response to ventral tegmental area (VTA) stimulation.
(A) The left panel shows the population average of Ca2+ transients across the cells of a single animal. The right panel shows the Ca2+ transients of each single neuron using a color map according to its dF/F value. A train of 10 pulses was applied at each frequency of VTA stimulation (1, 5, 10, 20, 30, 40, and 50 Hz). (B) Population average of Ca2+ transients across eight animals. VTA electrical stimulation was applied at the 30 s time point (red arrowhead). Error bars represent SEM.
Figure 2—figure supplement 1
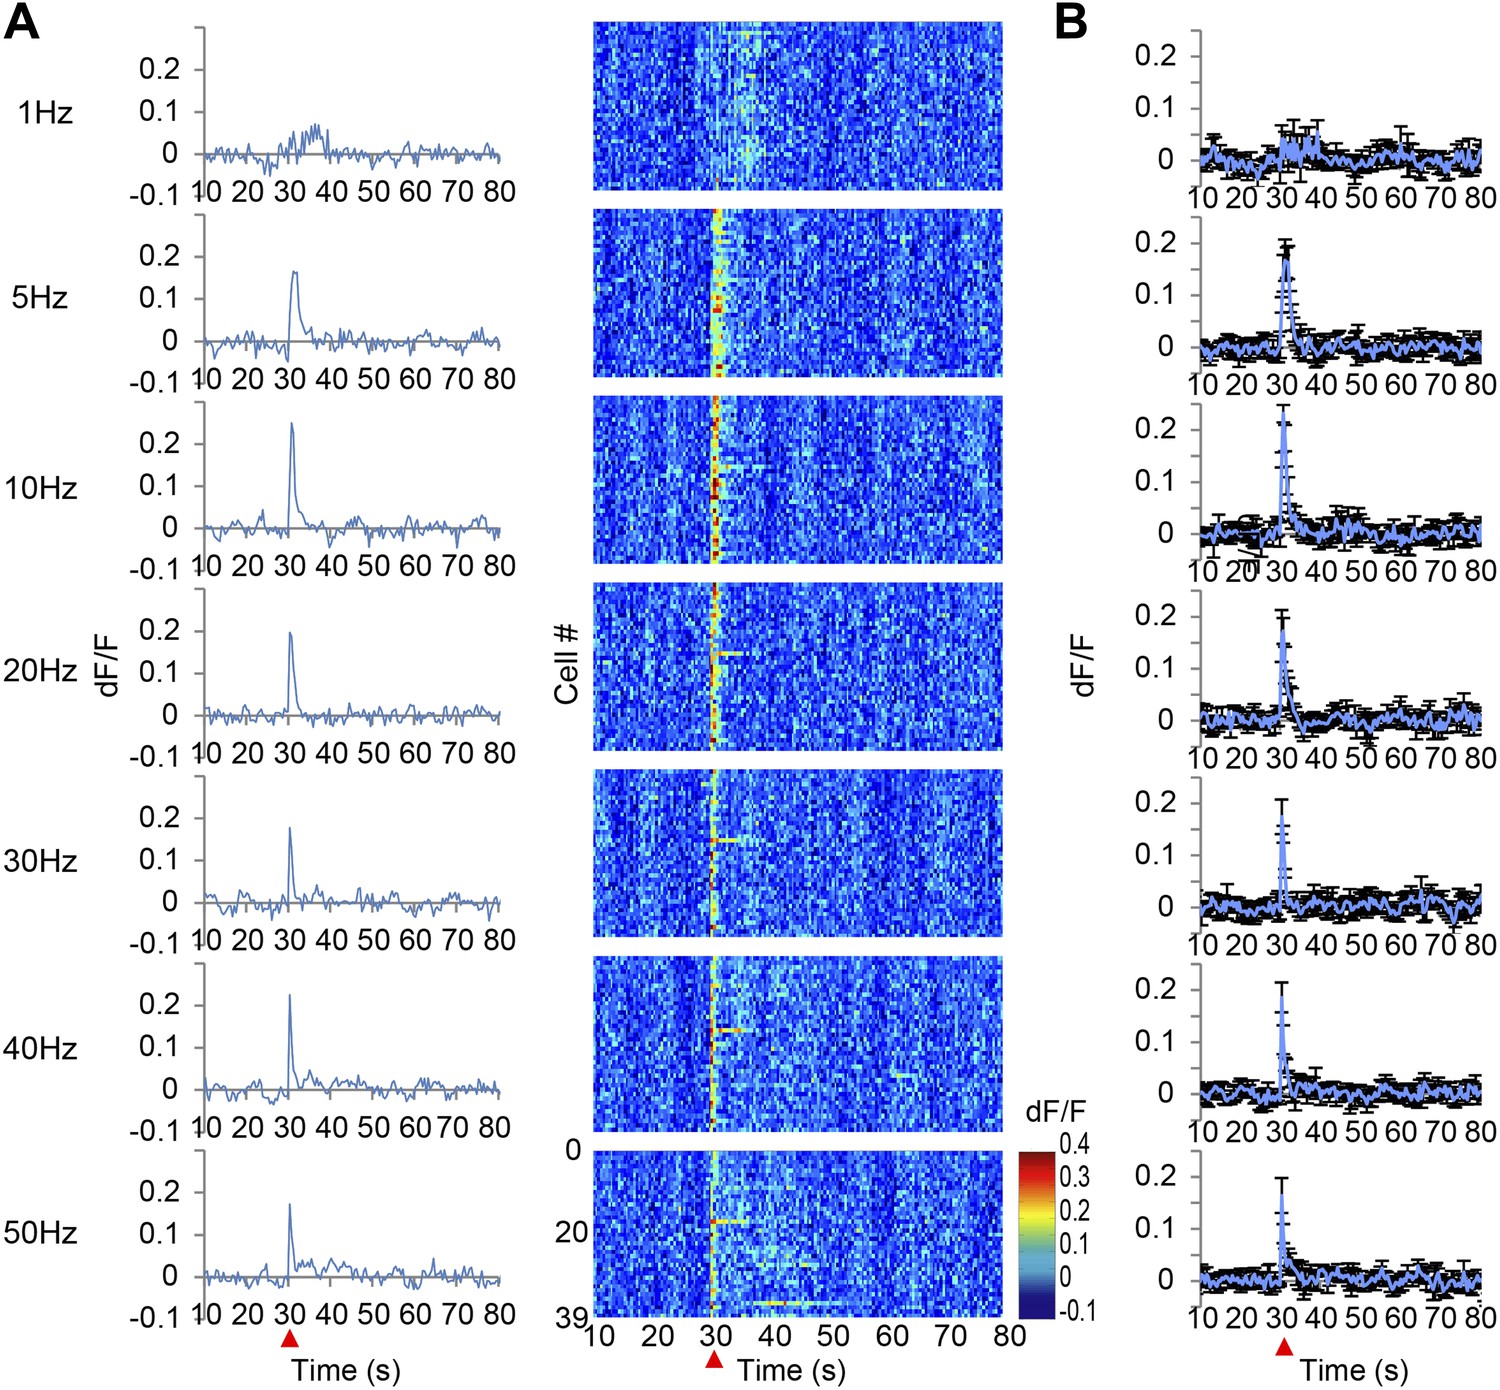
Ca2+ transients in response to secondary visual cortex lateral area (V2L) stimulation.
(A) The left panel shows the population average of Ca2+ transients across the cells of a single animal. The right panel shows the Ca2+ transients of each single neuron indicated in a color map according to its dF/F value. A train of 10 pulses was applied at each frequency of V2L stimulation (1, 5, 10, 20, 30, 40, and 50 Hz). (B) Population average of Ca2+ transients across eight animals. V2L electrical stimulation was applied at a 30 s time point (red arrowhead). Each stimulation frequency evoked a Ca2+ response with a short decay time of 5 s. Error bars represent SEM.
Figure 3 with 1 supplement
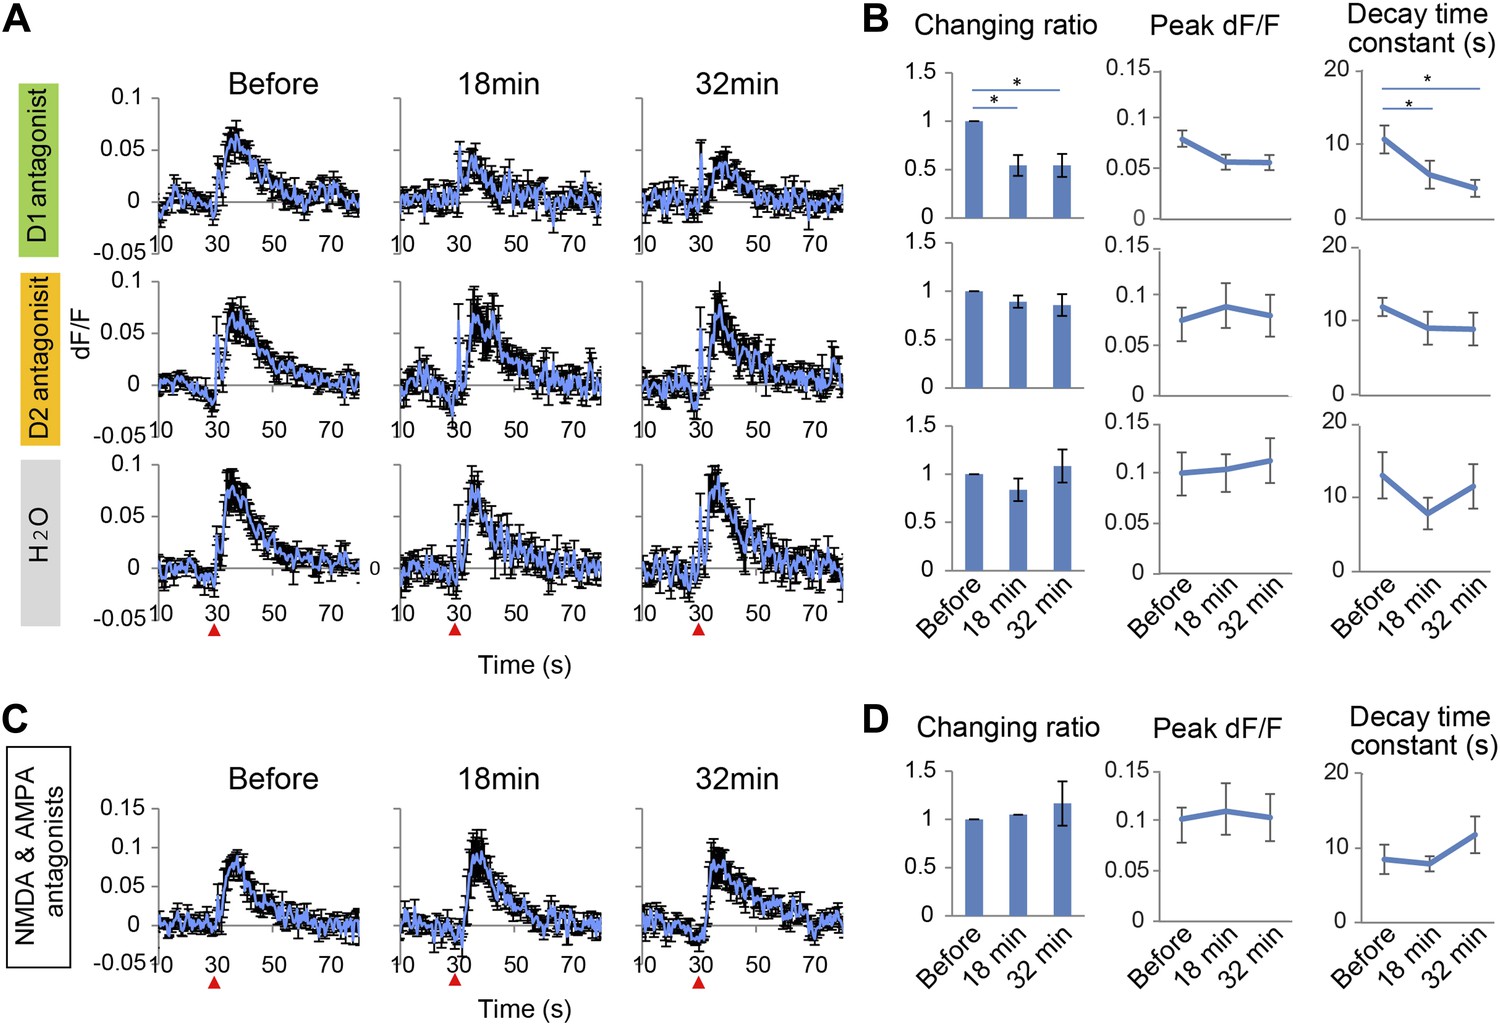
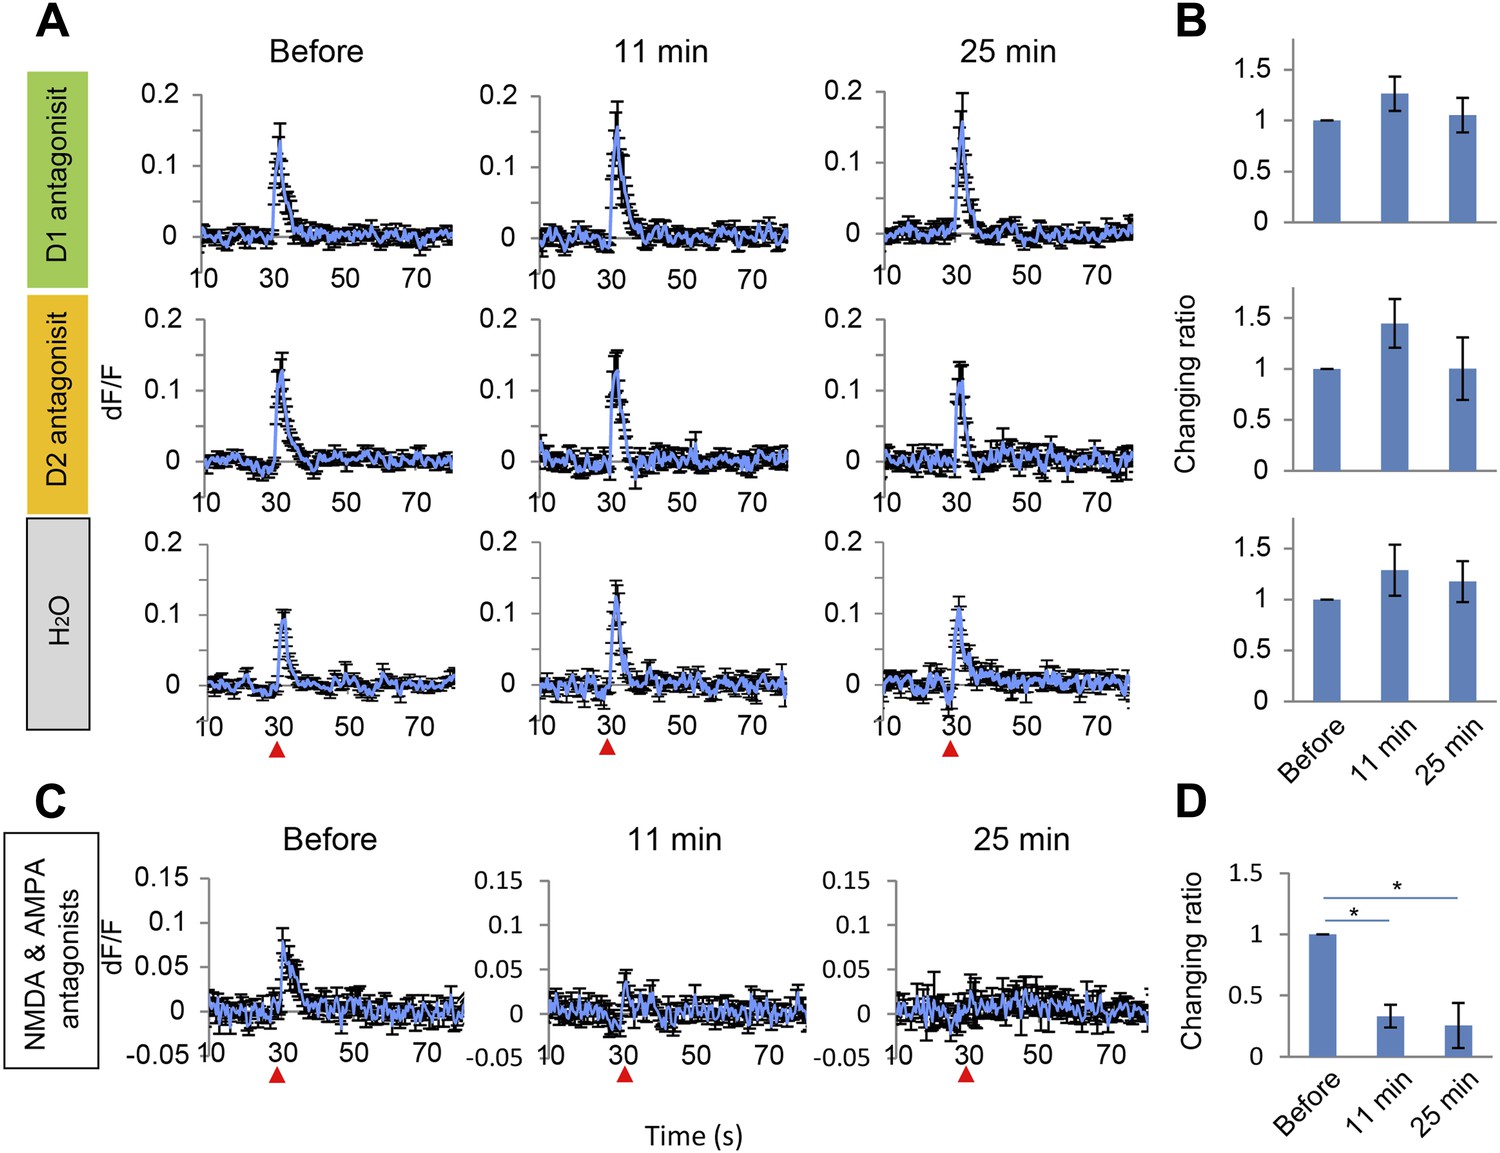
Long-lasting Ca2+ transients depend on D1 receptors.
(A and B) The effect of the D1 antagonist SCH23390 (1 mg/kg) (upper panel), the D2 antagonist eticlopride (0.5 mg/kg) (middle panel), and H2O, used as a control (bottom panel), on the long-lasting Ca2+ transients evoked by 10 pulses at 50 Hz stimulation of the ventral tegmental area (VTA) (n = 6 animals in each experimental group). (C and D) The effect of a cocktail of NMDA and AMPA antagonists (CPP: 3 mg/kg, and CNQX: 10 mg/kg, i.p.) on long-lasting Ca2+ transients (n = 4 animals). (A and C) Population average of Ca2+ transients across animals in each group. VTA electrical stimulation was applied at the 30 s time point (red arrowhead). (B and D) The changing ratio of the summed values of Ca2+ transients between the 30 and 50 s time points compared with the ‘Before’ value (left panels), the peak of dF/F (middle panels), and the decay time constant (right panels). Paired t test with Holm's adjustment, *p < 0.05. Error bars represent SEM.
Figure 3—figure supplement 1
Short Ca2+ transients do not depend on D1 or D2 receptors but on glutamate receptors.
(A and B) The effect of D1 antagonist SCH23390 (1 mg/kg, upper panel), D2 antagonist eticlopride (0.5 mg/kg, middle panel) and H2O, used as a control (bottom panel), on the short Ca2+ transients evoked by 10 pulses at 5 Hz for ventral tegmental area (VTA) stimulation (n = 6 animals in each experimental group). (C and D) The effect of a cocktail of NMDA and AMPA antagonists (CPP: 3 mg/kg, and CNQX: 10 mg/kg, i.p.) on short Ca2+ transients (n = 4 animals). (A and C) Population average of Ca2+ transients across animals in each group. VTA electrical stimulation was applied at a 30 s time point (red arrowhead). (B and D) To evaluate the effect of the drugs, the summed values of Ca2+ transients from the 30 to 35 s time points were compared with the ‘Before’ value (changing ratio). Paired t test with Holm's adjustment, *p < 0.05. Error bars represent SEM.
Figure 4 with 2 supplements

Combined repetitive stimulation of the secondary visual cortex lateral area (V2L) and the ventral tegmental area (VTA) causes a modification of prefrontal cortex (PFC) neuronal response.
(A) Experimental design for stimulation of the V2L and VTA composed of three phases: pre-conditioning, conditioning, and test. Five pulses at 5 Hz and 10–15 pulses at 50 Hz were used for V2L and VTA electrical stimulation, respectively. T1: Timing1; T2: Timing2. (B) Shift in population average of dF/F value. Post hoc tests revealed that dF/F values were significantly different in many of the comparisons between the time points in each conditioning paradigm (Ryan's test). (C) Changing dF/F value calculated by subtracting the ‘Before’ value from the ‘2 hr after’ value (dF/F(2 hr-before)) to simplify the results of (B). The T1 conditioning paradigm showed a significantly larger temporal change than the others. (D) Difference in pattern similarity. Pattern similarity calculated from cosine similarity revealed that only T1 conditioning significantly increased the value of ‘2 hr after’ when compared with the ‘Before’ value. n = 8 animals in each experimental group. Ryan's post hoc test: *p < 0.05, **p < 0.01, *p < 0.001. Error bars represent SEM.
Figure 4—figure supplement 1
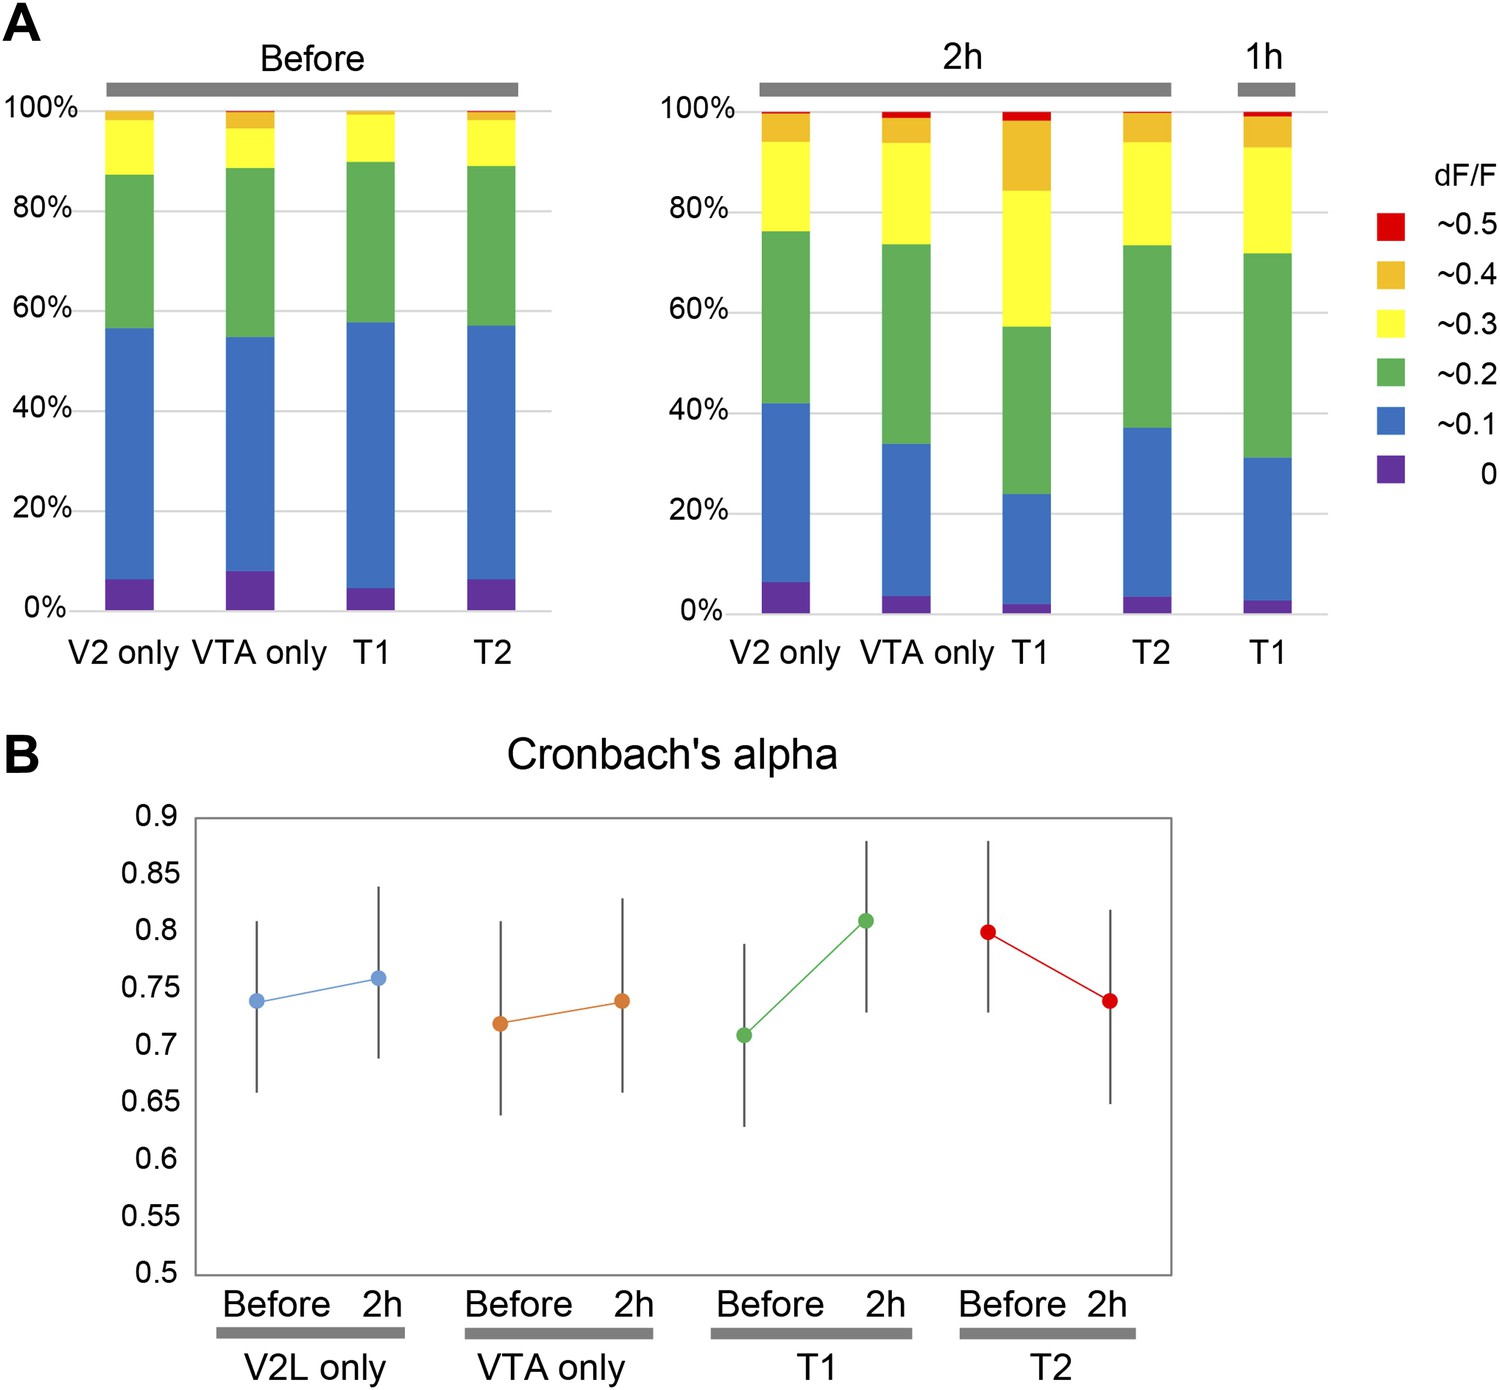
Percentage distributions of neurons by dF/F in each conditioning group and reliability of calcium transients occurrence following three repetitive secondary visual cortex lateral area (V2L) stimulations.
(A) Percentage distributions of neurons, pooled from eight animals in each conditioning group, are shown. The number of neurons showing a dF/F value above 0.2 increased 2 hr after stimulation (right panel) compared with ‘Before’ (left panel), especially in T1 at ‘2 hr after’. Note, the dF/F probability distribution in T1 conditioning at ‘1 hr after’ (far right) is comparable to the ventral tegmental area (VTA) only and T2 at ‘2 hr after’. (B) The reliability of calcium transients occurrence across three repetitive V2L stimulations was calculated by Cronbach's alpha. Error bars represent 95% confidence intervals. None of the conditioning group, including T1, showed a significant shift in the value of Cronbach's alpha, suggesting no reliability shift in either group. T1: Timing1; T2: Timing2.
Figure 4—figure supplement 2
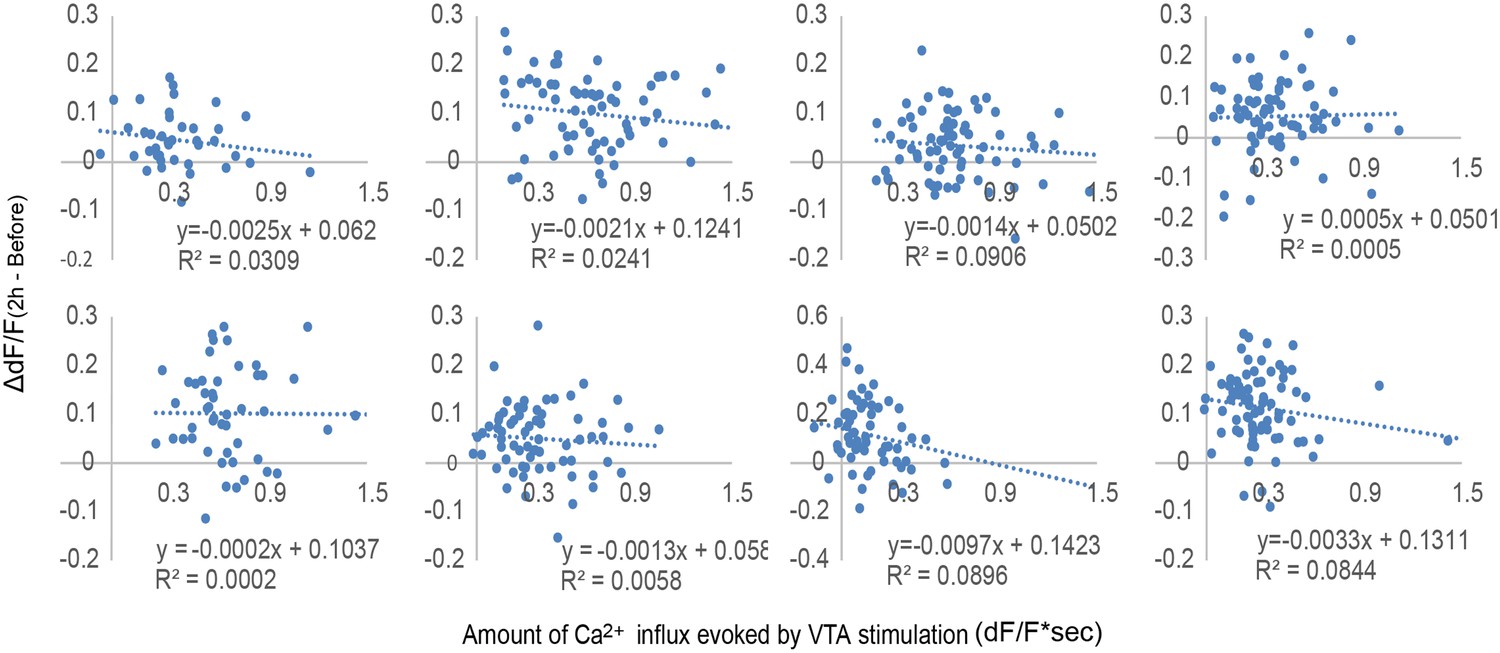
No correlation between Ca2+ influx evoked by ventral tegmental area (VTA) stimulation and neuronal activity increase in response to secondary visual cortex lateral area (V2L) stimulation.
Scatter plots of the Ca2+ transients evoked by VTA phasic stimulation from the 30 to 50 s time points against the increased value of dF/F, calculated by subtracting the dF/F value of ‘Before’ from ‘2 hr after’ conditioning (dF/F(2 hr−Before)) of Timing1 conditioning. Each plot represents one animal and each dot represents a different single neuron of the animal. There is no significant correlation between the amount of Ca2+ transients evoked by VTA stimulation and the increased value of dF/F. This indicates that the higher amount of intracellular Ca2+ is not the main factor modifying the response to input from the sensory cortex.
Additional files
-
Supplementary file 1
ImageJ macros for detecting individual cells.
- https://doi.org/10.7554/eLife.02726.011
Download links
A two-part list of links to download the article, or parts of the article, in various formats.
Downloads (link to download the article as PDF)
Open citations (links to open the citations from this article in various online reference manager services)
Cite this article (links to download the citations from this article in formats compatible with various reference manager tools)
Phasic activation of ventral tegmental neurons increases response and pattern similarity in prefrontal cortex neurons
eLife 3:e02726.
https://doi.org/10.7554/eLife.02726


