Neuronal connectome of a sensory-motor circuit for visual navigation
- Max Planck Institute for Developmental Biology, Germany
Figures
Figure 1 with 9 supplements
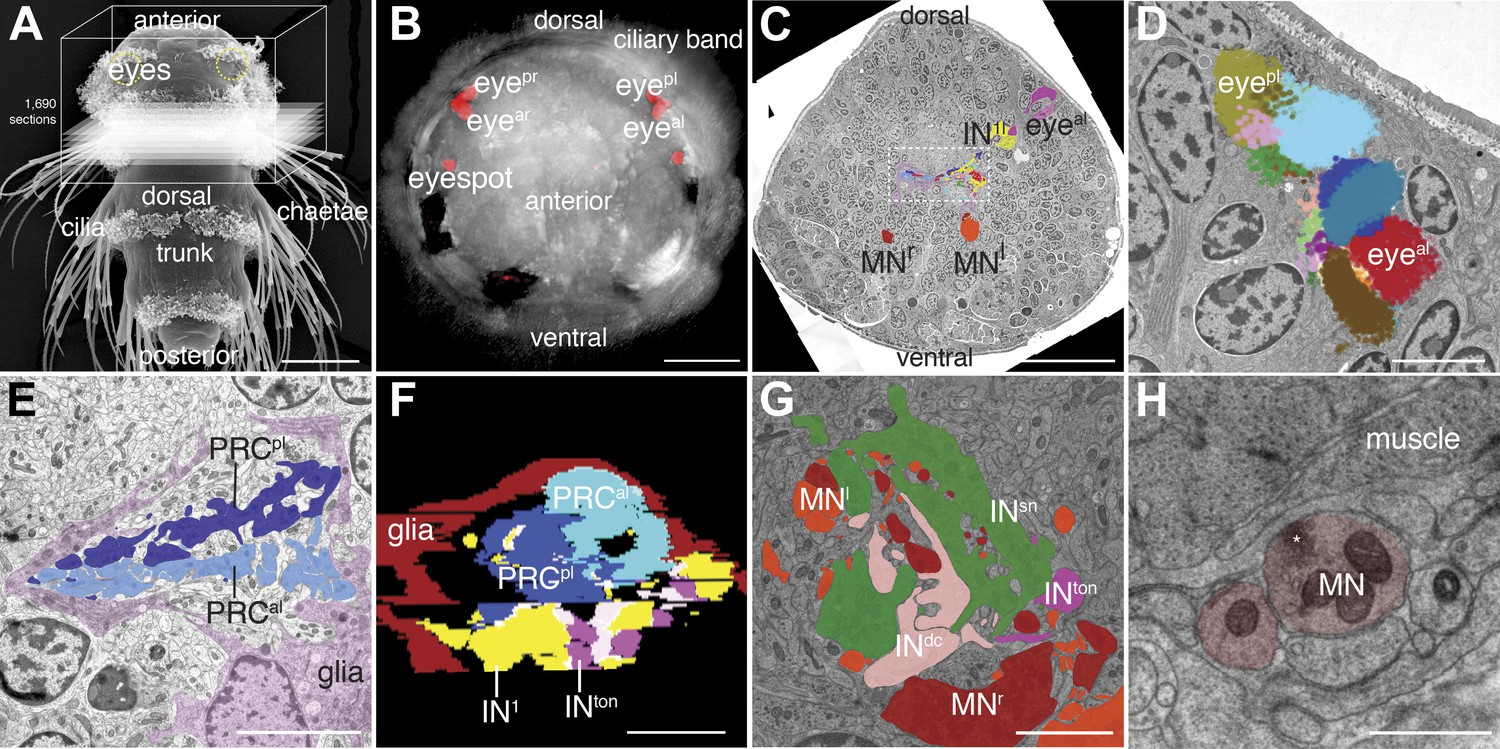
Serial-section electron microscopy imaging of the visual eye circuit in a Platynereis larva.
(A) Scanning electron micrograph of a 72 hr-post-fertilization larva, dorsal view. The boxed volume was sectioned and imaged. (B) Anterior view of a 72 hr-post-fertilization larva visualized with differential interference contrast (DIC) optics (grey) showing the position of the eyes visualized by the reflection of the pigments (red). (C) A representative electron micrograph from the series with traced neurons. The boxed area contains the primary optic neuropil. (D) Reconstruction of the pigment cup of the left anterior and posterior eyes. Pigment granules from the different pigment cells and photoreceptors are colored differently. (E) TEM image of the left primary optic neuropil surrounded by glia (pink), with the photoreceptor projections from the anterior and posterior eye colored differently. (F) A virtual cross-section of the primary optic neuropil based on ssTEM shows the anterior-posterior layering of glia, photoreceptor, primary interneuron (IN1) and trans-optic-neuropil interneuron (INton) processes, anterior is up. (G) TEM image of the secondary optic neuropil, with segmented INton, INsn , INdc and ipsi- and contralateral motorneuron projections. (H) TEM image of a neuromuscular synapse from a motorneuron to the ventral longitudinal muscle. Asterisk marks a cluster of synaptic vesicles. Eyeal, anterior-left eye; eyear, anterior-right eye; eyepl, posterior-left eye; eyepr, posterior-right eye; PRC, photoreceptor; IN, interneuron; MN, motorneuron. Scale bars, 50 µm (A), 30 µm (B and C), 5 µm (D, E, G), 1 µm (F), 0.5 µm (H).
Figure 1—figure supplement 1
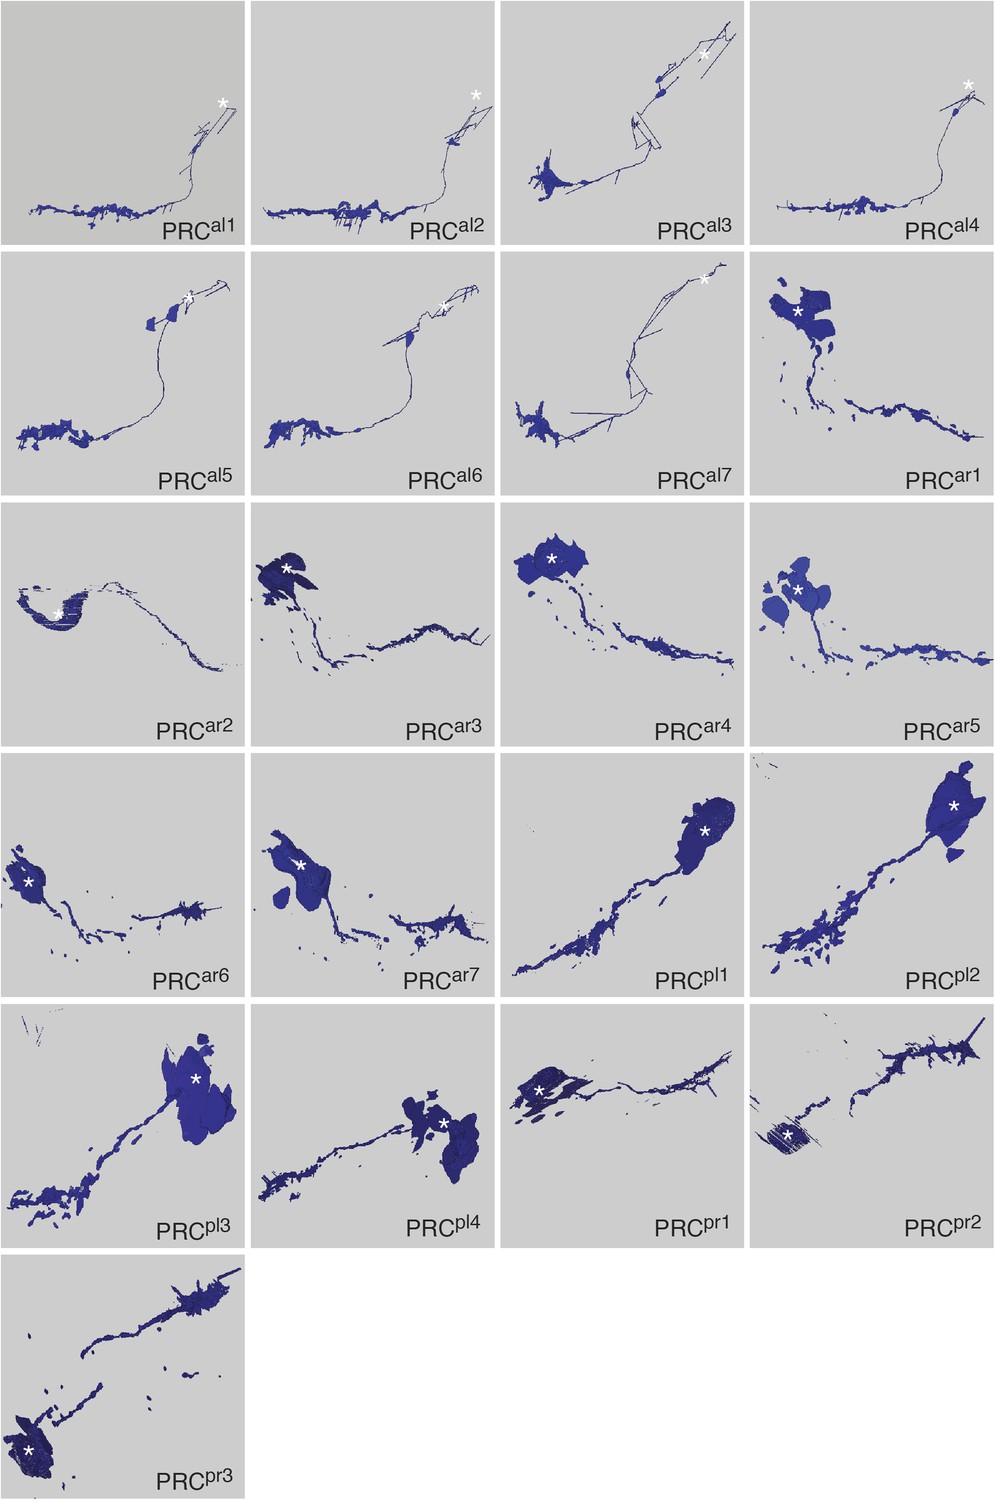
Morphology of photoreceptor cells reconstructed from serial TEM sections.
Tracing of the cell skeletons was complemented with partial volume reconstructions. The position of the cell body is marked with an asterisk.
Figure 1—figure supplement 2
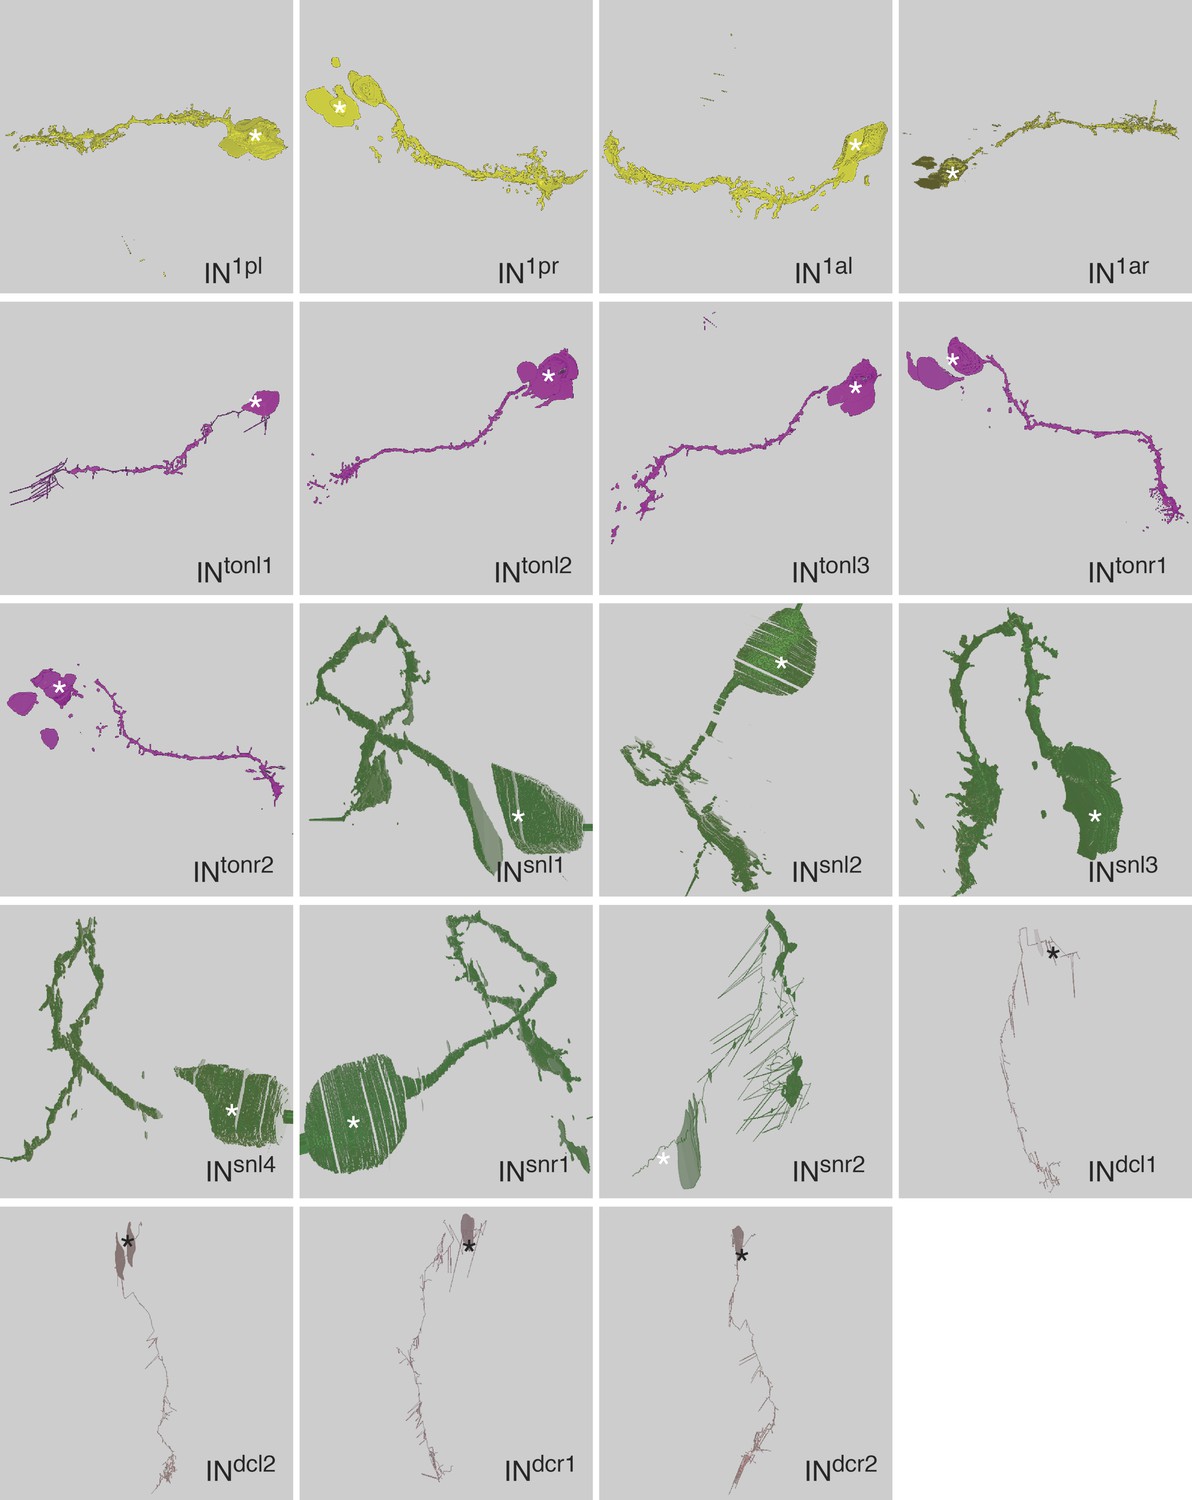
Morphology of IN1, INton, INsn, and INdc cells reconstructed from serial TEM sections.
Tracing of the cell skeletons was complemented with partial volume reconstructions. The position of the cell body is marked with an asterisk.
Figure 1—figure supplement 3
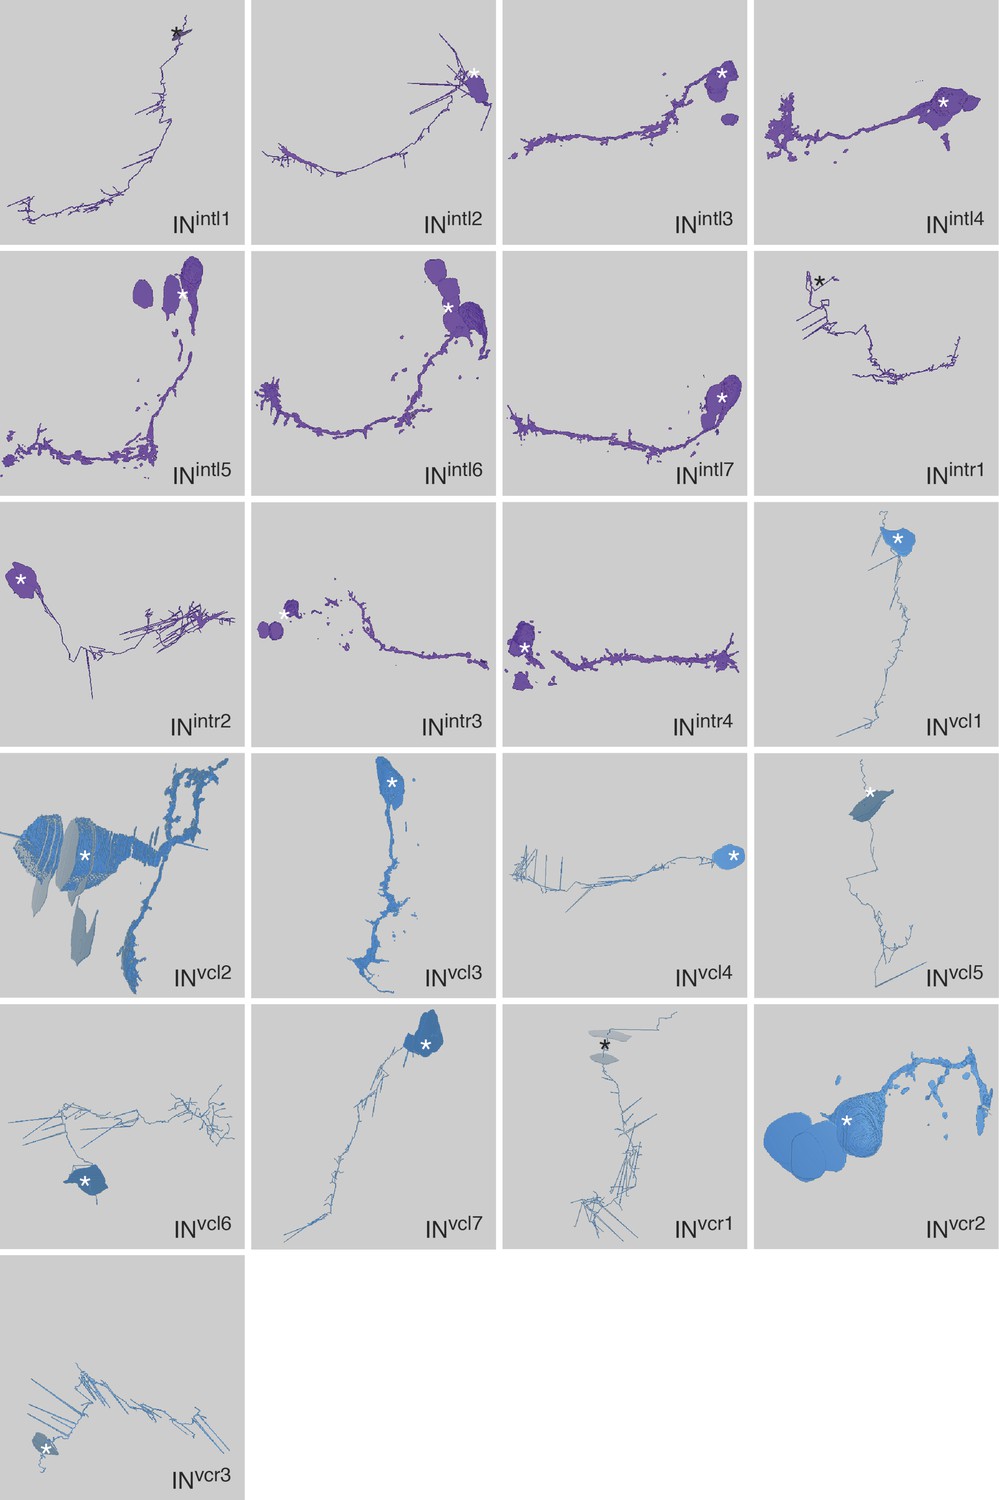
Morphology of INint and INvc cells reconstructed from serial TEM sections.
Tracing of the cell skeletons was complemented with partial volume reconstructions. The position of the cell body is marked with an asterisk.
Figure 1—figure supplement 4
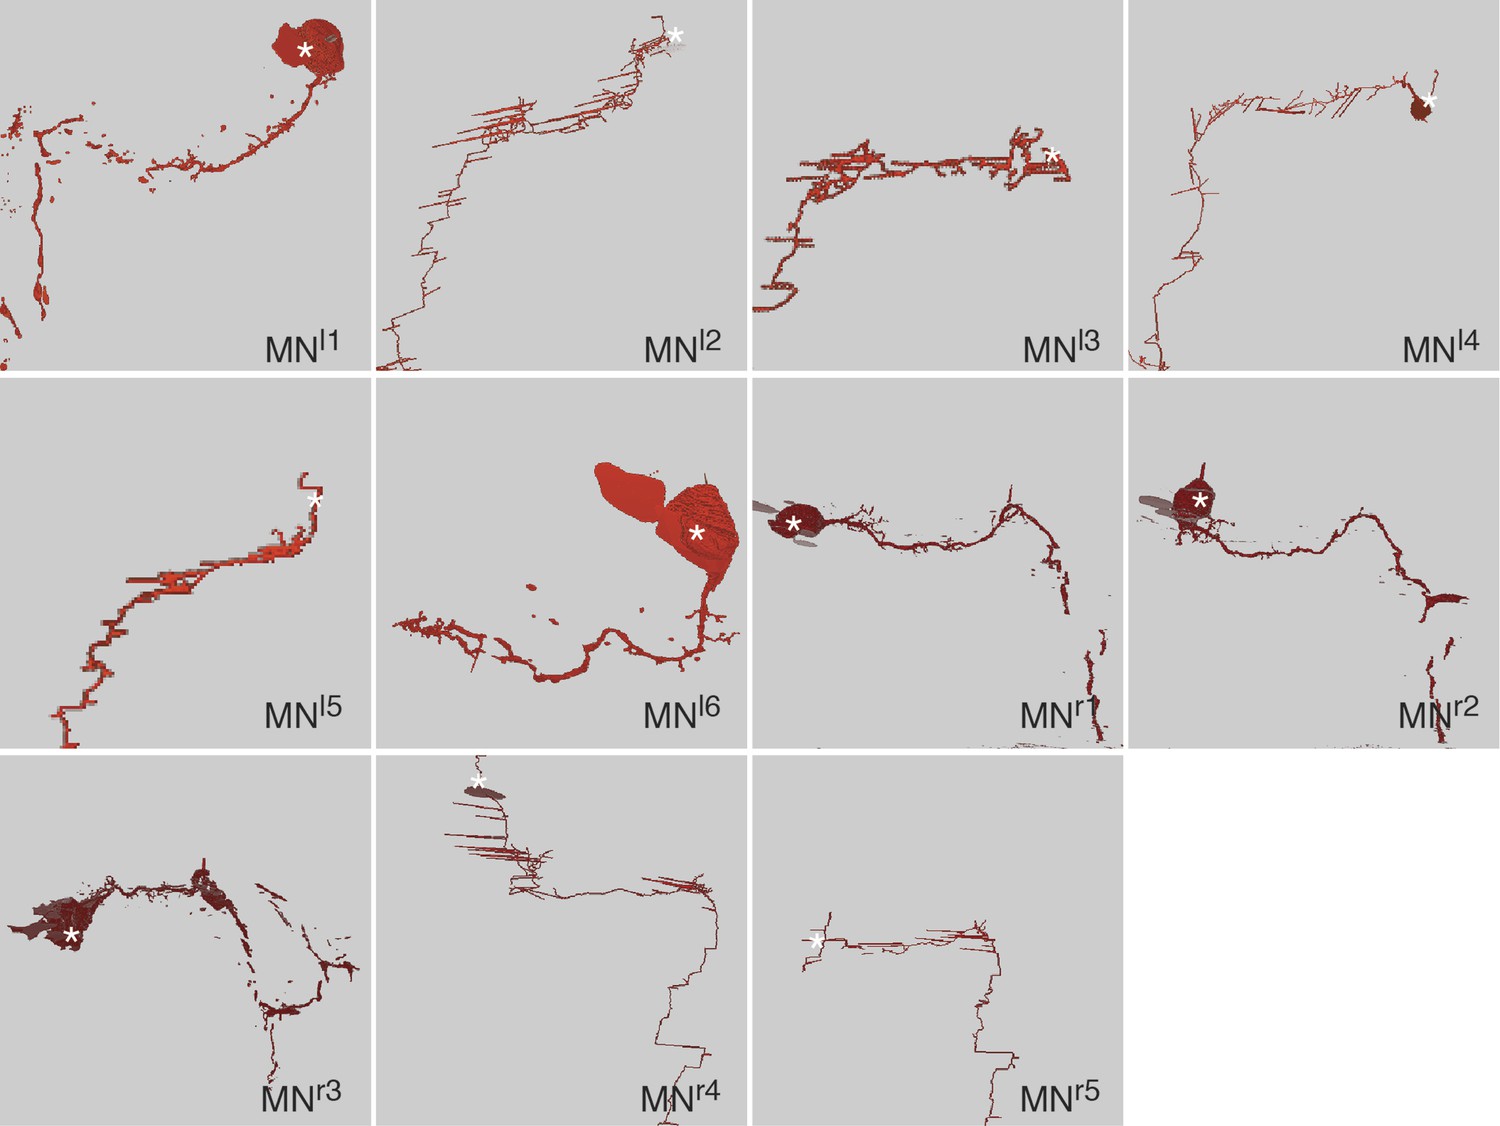
Morphology of motorneurons reconstructed from serial TEM sections.
Tracing of the cell skeletons was complemented with partial volume reconstructions. The position of the cell body is marked with an asterisk.
Figure 1—figure supplement 5
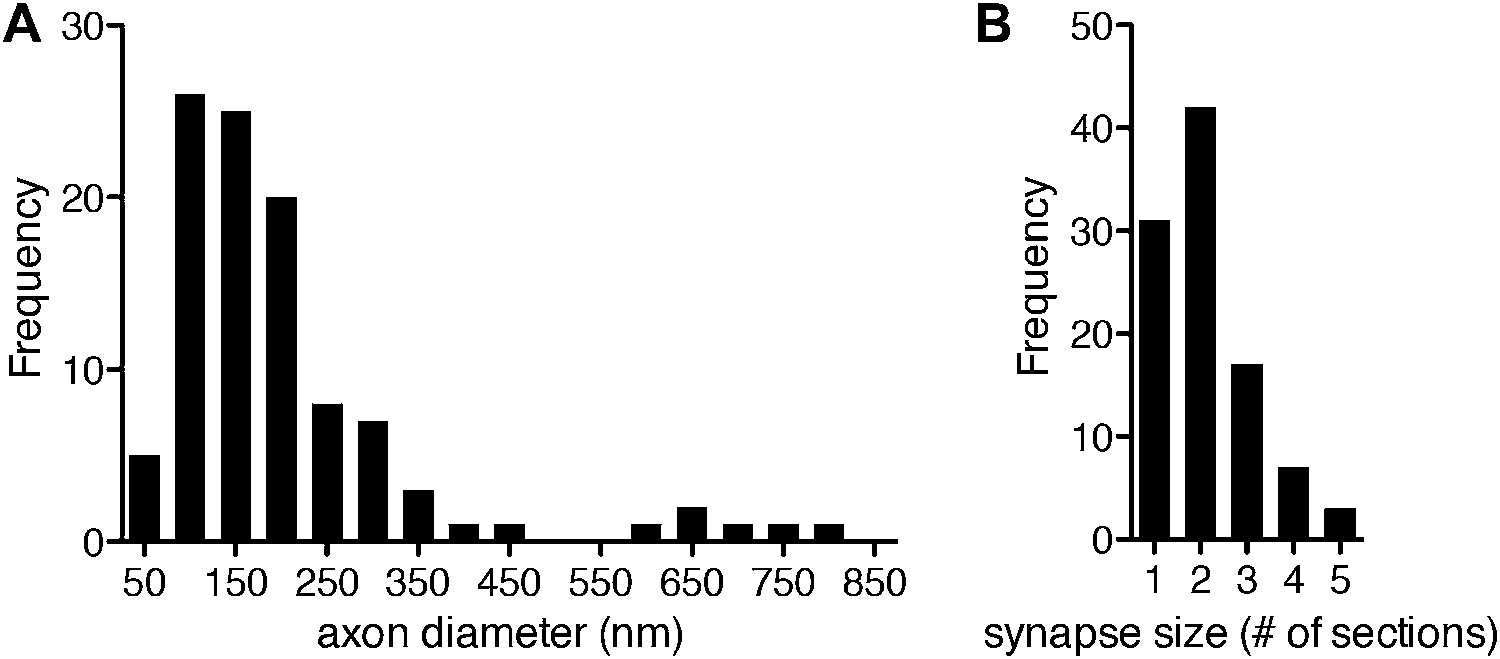
Axon diameter and synapse size in the Platynereis larval connectome.
(A) Histogram showing axon diameter (n = 102). (B) Histogram showing synapse size defined as the number of consecutive sections in which a synapse was visible (n = 100).
Figure 1—figure supplement 6
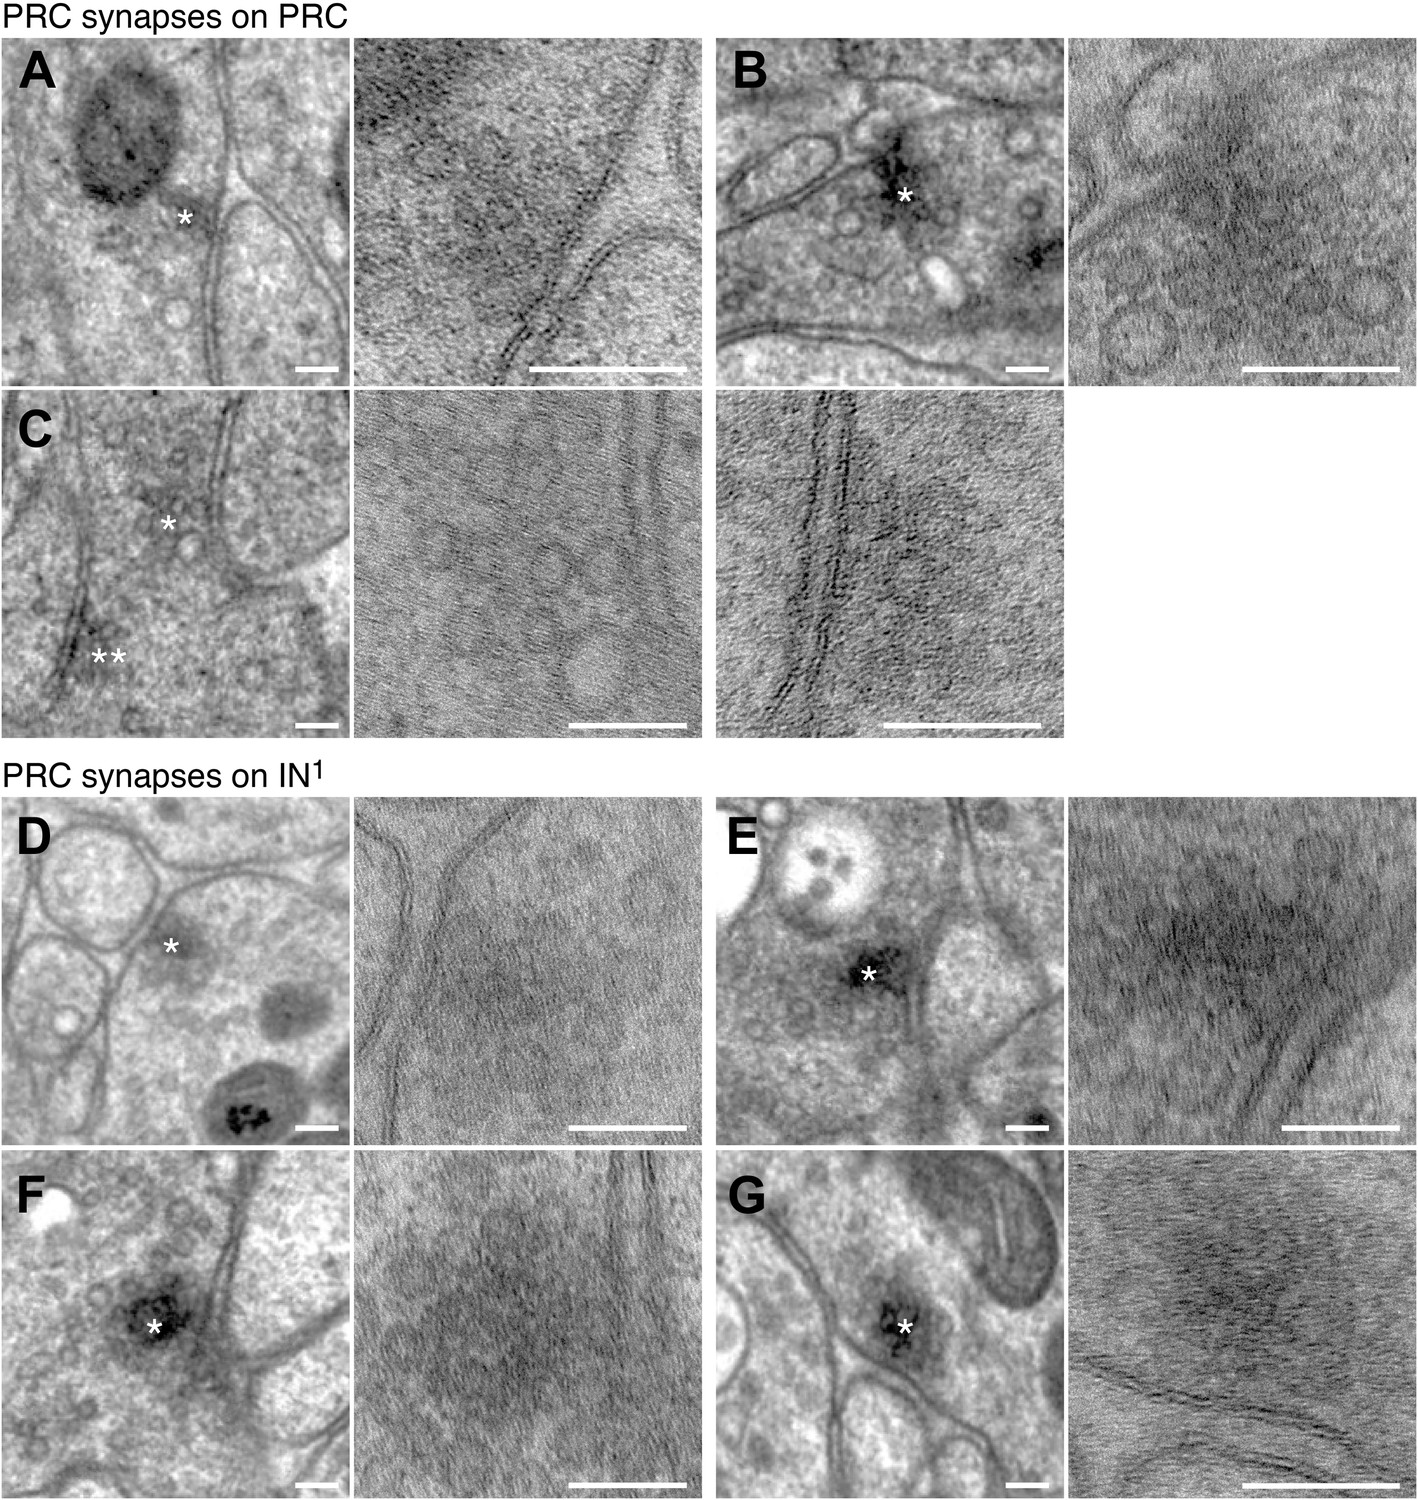
Synapses of photoreceptors and IN1 cells.
Examples of PRC to PRC (A–C) and PRC to IN1 synapses (D–G). The left and right panels show the same synapse at different resolution (left: 3.7 nm/pixel, right: 0.2 nm/pixel). Asterisks mark the synapse, which is shown at higher resolution in the right panel. Scale bar, 100 nm.
Figure 1—figure supplement 7
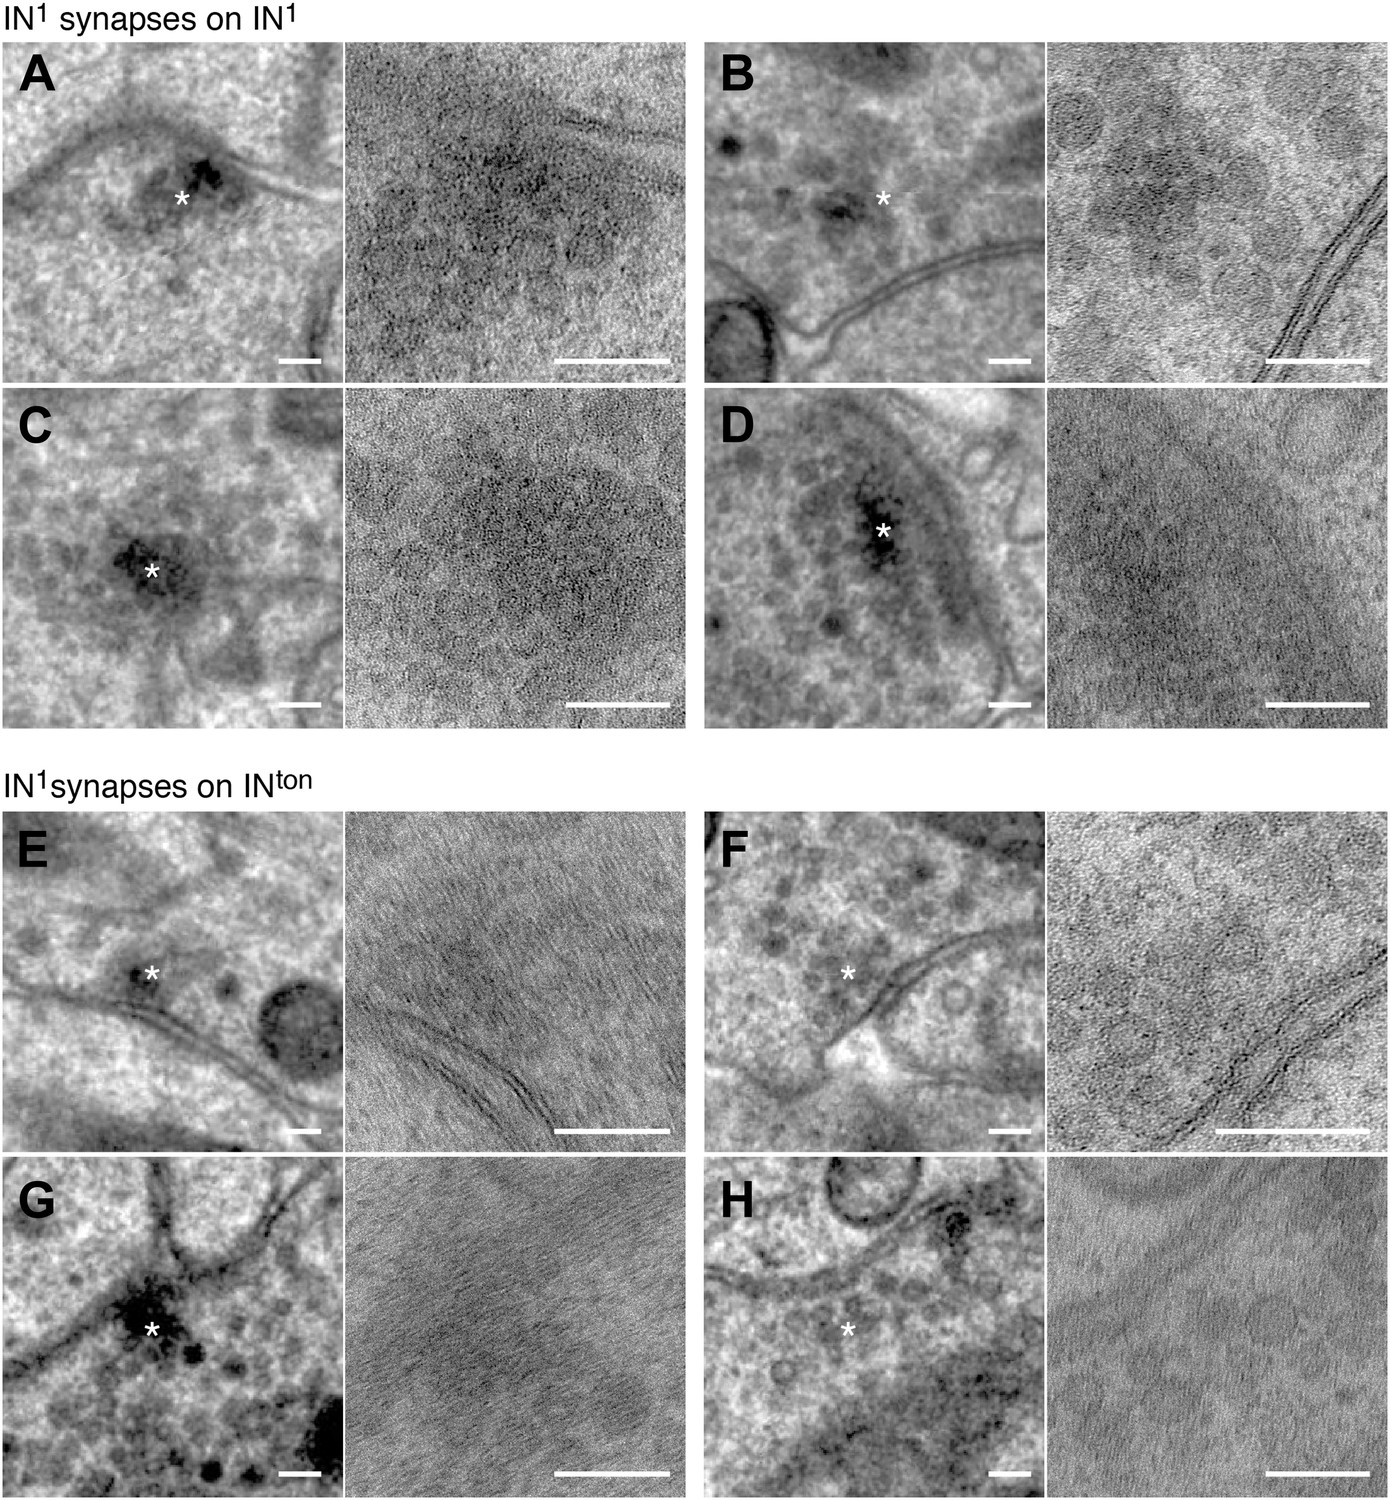
Synapses of IN1 cells.
Examples of IN1 to IN1 (A–D) and IN1 to INton synapses (E–H). The left and right panels show the same synapse at different resolution (left: 3.7 nm/pixel, right: 0.2 nm/pixel). Asterisks mark the synapse, which is shown at higher resolution in the right panel. Scale bar, 100 nm.
Figure 1—figure supplement 8
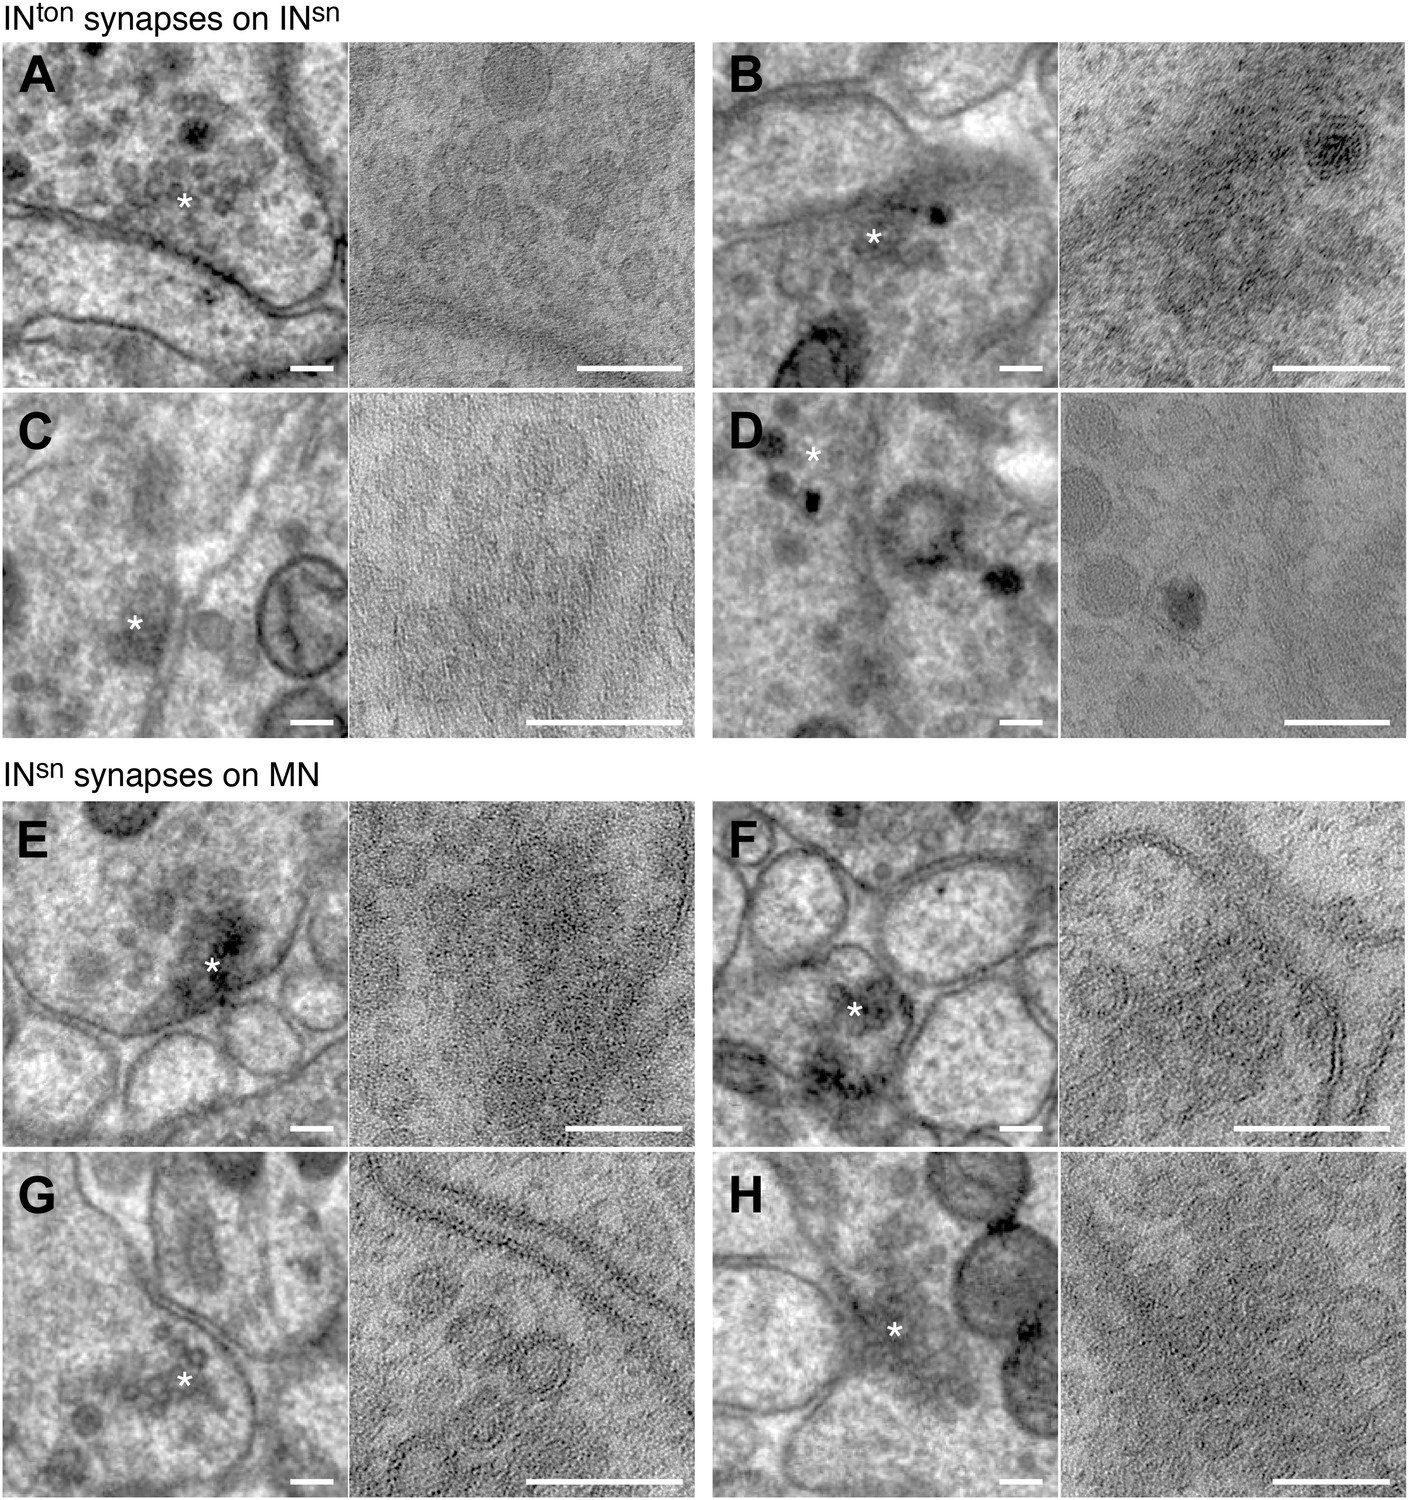
Synapses of INton cells and INsn cells.
Examples of INton to INsn (A–D) and INsn to MN synapses (E–H). The left and right panels show the same synapse at different resolution (left: 3.7 nm/pixel, right: 0.2 nm/pixel). Asterisks mark the synapse, which is shown at higher resolution in the right panel. Scale bar, 100 nm.
Figure 1—figure supplement 9
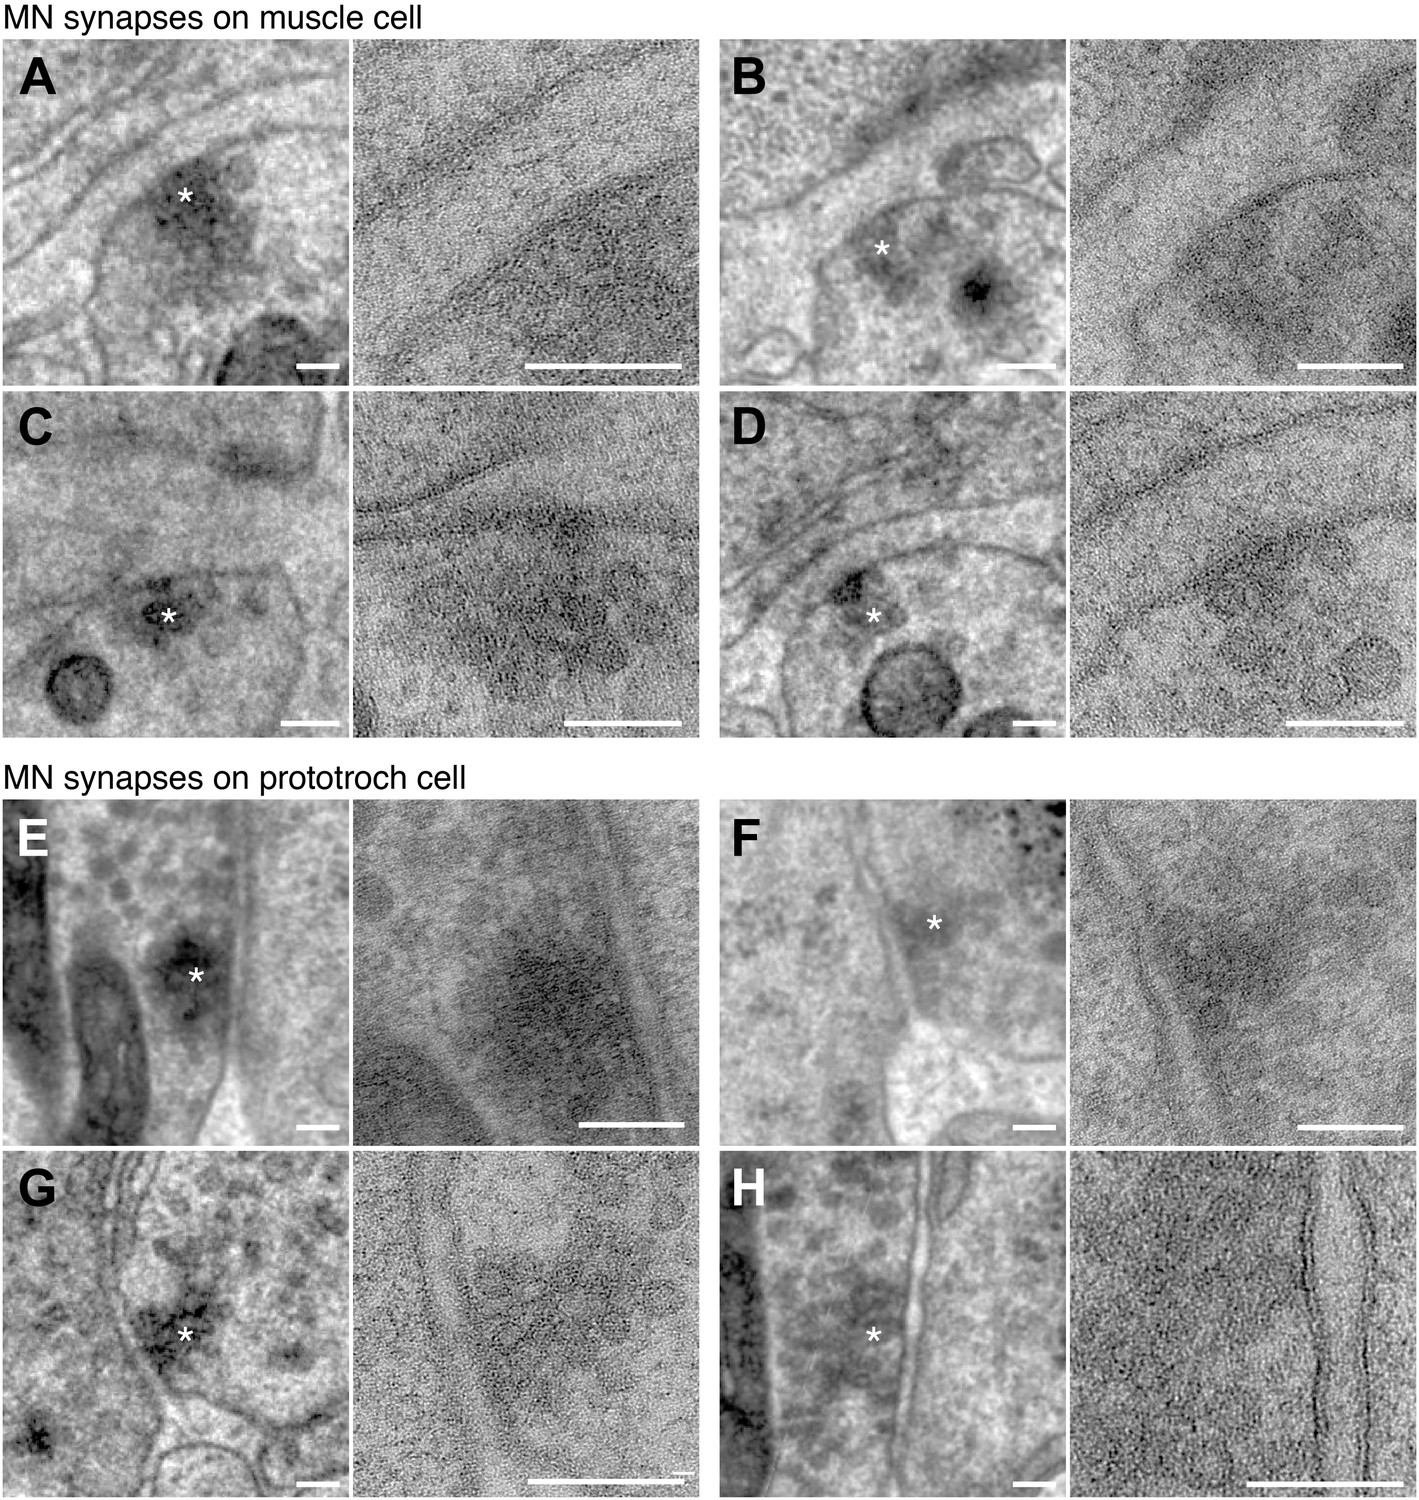
Synapses of motorneurons.
Examples of MN to muscle cell (A–D) and MN to prototroch cell synapses (E–H). The left and right panels show the same synapse at different resolution (left: 3.7 nm/pixel, right: 0.2 nm/pixel). Asterisks mark the synapse, which is shown at higher resolution in the right panel. Scale bar, 100 nm.
Figure 2 with 1 supplement
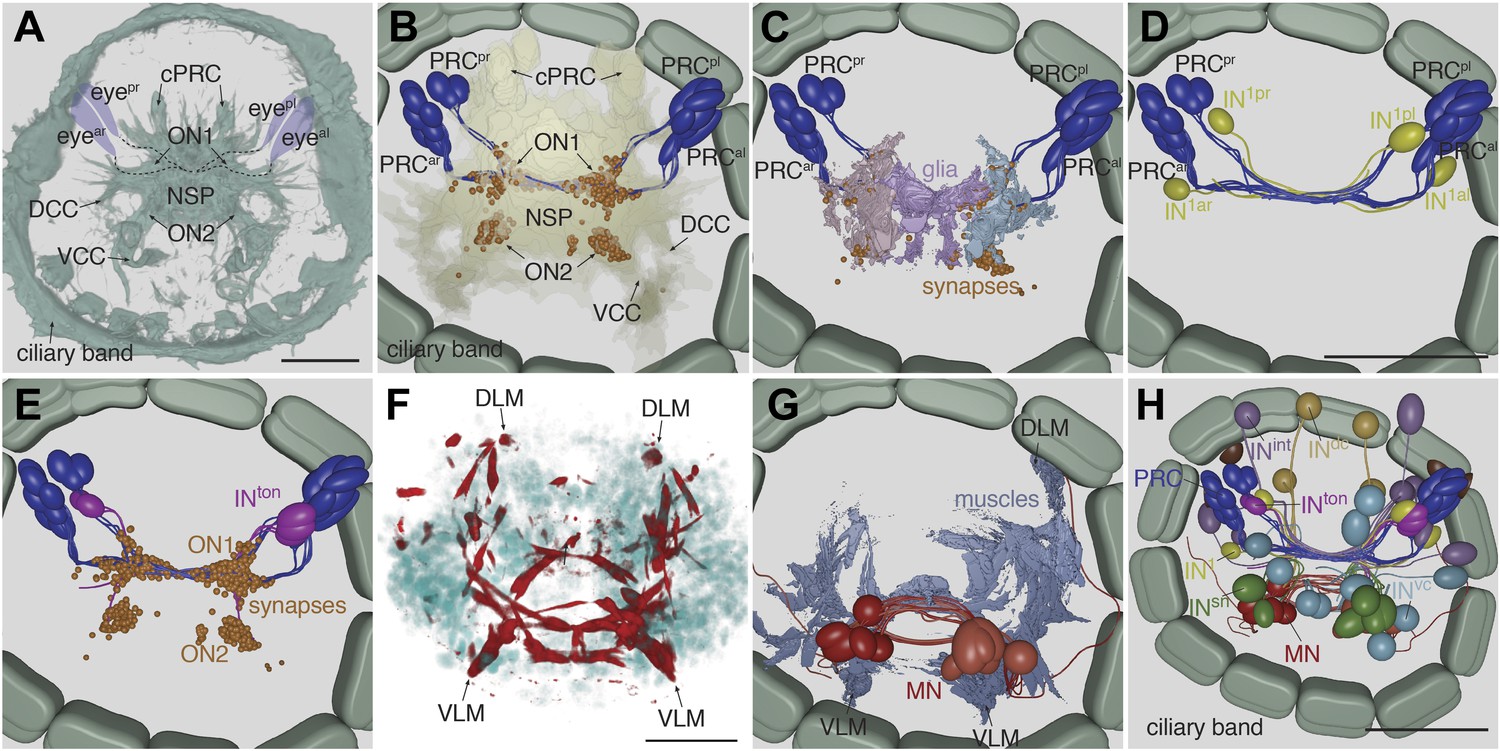
Cell complement of the visual circuit.
(A) Confocal microscopic image of a 3-day-old larva stained with an anti-acetylated tubulin antibody to label neurites and cilia. Anatomical landmarks are labeled. (B) Blender visualization of all photoreceptor cells and all synapses of the minimal eye circuit shown in relation to the outline of neuropil, reconstructed by ssTEM. The position of synapses in the visual circuit reveals the primary and secondary optic neuropils. The schematized ciliary band cells are also shown. (C) ssTEM reconstruction of photoreceptors, glia cells and synapses. (D) ssTEM reconstruction of photoreceptors and primary interneurons (IN1). (E) ssTEM reconstrucion showing the trans-optic-neuropil interneurons (INton) connecting the two optic neuropils. (F) Confocal microscopic image of a 3-day-old larva stained with phalloidin to label the musculature (red) and with DAPI to label nuclei (cyan). (G) ssTEM reconstruction of muscles and motorneurons (MN). (H) ssTEM reconstruction of the complete cell complement of the minimal visual circuit. Neurons are colored by type. Pigment cups are shown in brown. All images show anterior views. PRC, photoreceptor; IN, interneuron; MN, motorneuron; eyeal, anterior-left eye; eyear, anterior-right eye; eyepl, posterior-left eye; eyepr, posterior-right eye; ON, optic neuropil; cPRC, ciliary photoreceptor; DCC, dorsal branch of the circumesophageal connectives; VCC, ventral branch of the circumesophageal connectives; NSP, neurosecretory plexus; DLM, dorsal longitudinal muscle; VLM, ventral longitudinal muscle. The coloring of cell types is consistent throughout the paper (PRC, blue; IN1, yellow; INint, lilac; INton , magenta; INdc, light brown; INvc, cian; INsn, green; MN, red). Scale bars, 30 µm. The Blender atlas with the volume rendering of all cells and synapses is available in Randel et al. (2014).
Figure 2—figure supplement 1
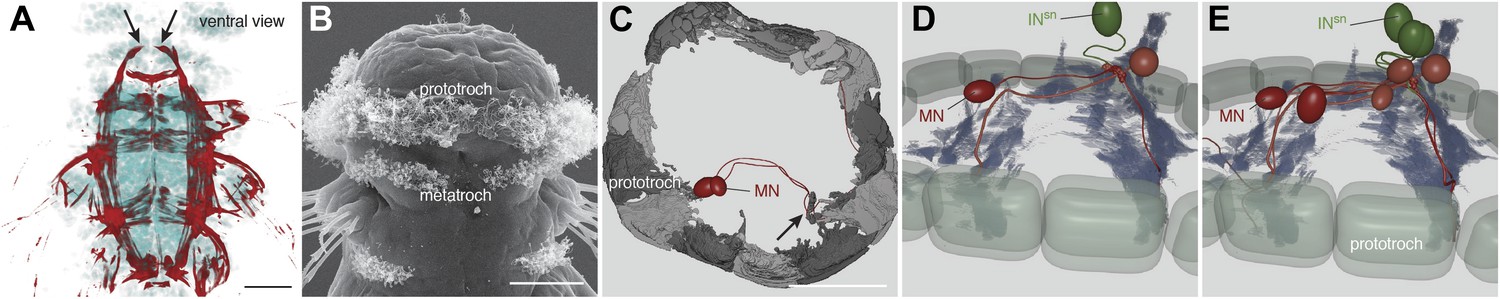
Muscles and ciliary bands in 3-day old larvae.
(A) Phalloidin staining of the musculature (red) in a 3-day-old larva, ventral view. Arrows point at the most anterior tip of the dorsal longitudinal muscles. Nuclei are labeled with DAPI (cyan). (B) SEM micrograph of a 3-day old larva (ventral view) showing the prototroch and metatroch ciliary bands. (C) ssTEM reconstruction of the prototroch cells. Two MN cells are also shown. One of the prototroch cells extends a long projection towards the MN axons and receives synaptic input there (arrow). (D and E) Bilateral divergence of the circuit at the level of the MNs. SN cells connect to both ipsilateral and contralateral MNs at their proximal or distal axon segments respectively. The position of synapses from SN to MN cells are shown. In (D) only two MNs are shown for clarity. Scale bars 30 µm.
Figure 3 with 3 supplements
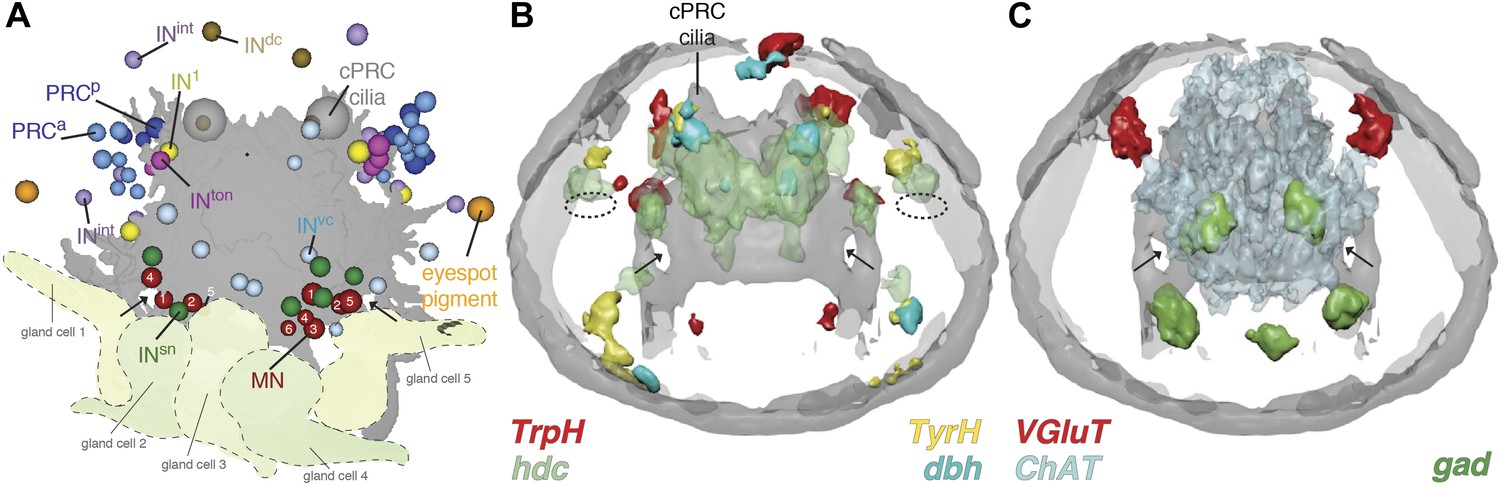
Neurotransmitters of the eye circuit.
(A) Cell body positions of eye circuit neurons relative to the larval axonal scaffold and five large gland cells. Motorneurons are numbered according to the cell identifiers. (B and C) Surface representation of the average expression domains of neurotransmitter marker genes relative to the larval axonal scaffold. The following genes are shown: (B) histaminergic marker histidine decarboxylase (hdc; green), serotonergic marker tryptophan hydroxylase (TrpH; red), dopaminergic marker tyrosine hydroxylase (TyrH; yellow), adrenergic marker dopamine beta hydroxylase (dbh; cyan), (C) glutamatergic marker vesicular glutamate transporter (VGluT; red), cholinergic marker choline acetyltransferase (ChAT; grey), GABAergic marker glutamate decarboxylase (gad; green). The axonal scaffold, based on average acetylated-tubulin signal, is shown in grey. PRC, photoreceptor; cPRC, ciliary photoreceptor; IN, interneuron; MN, motorneuron. In (B) dashed ovals mark the position of the eyespots. Black arrows show the ring formed by the circumesophageal connectives.
Figure 3—figure supplement 1
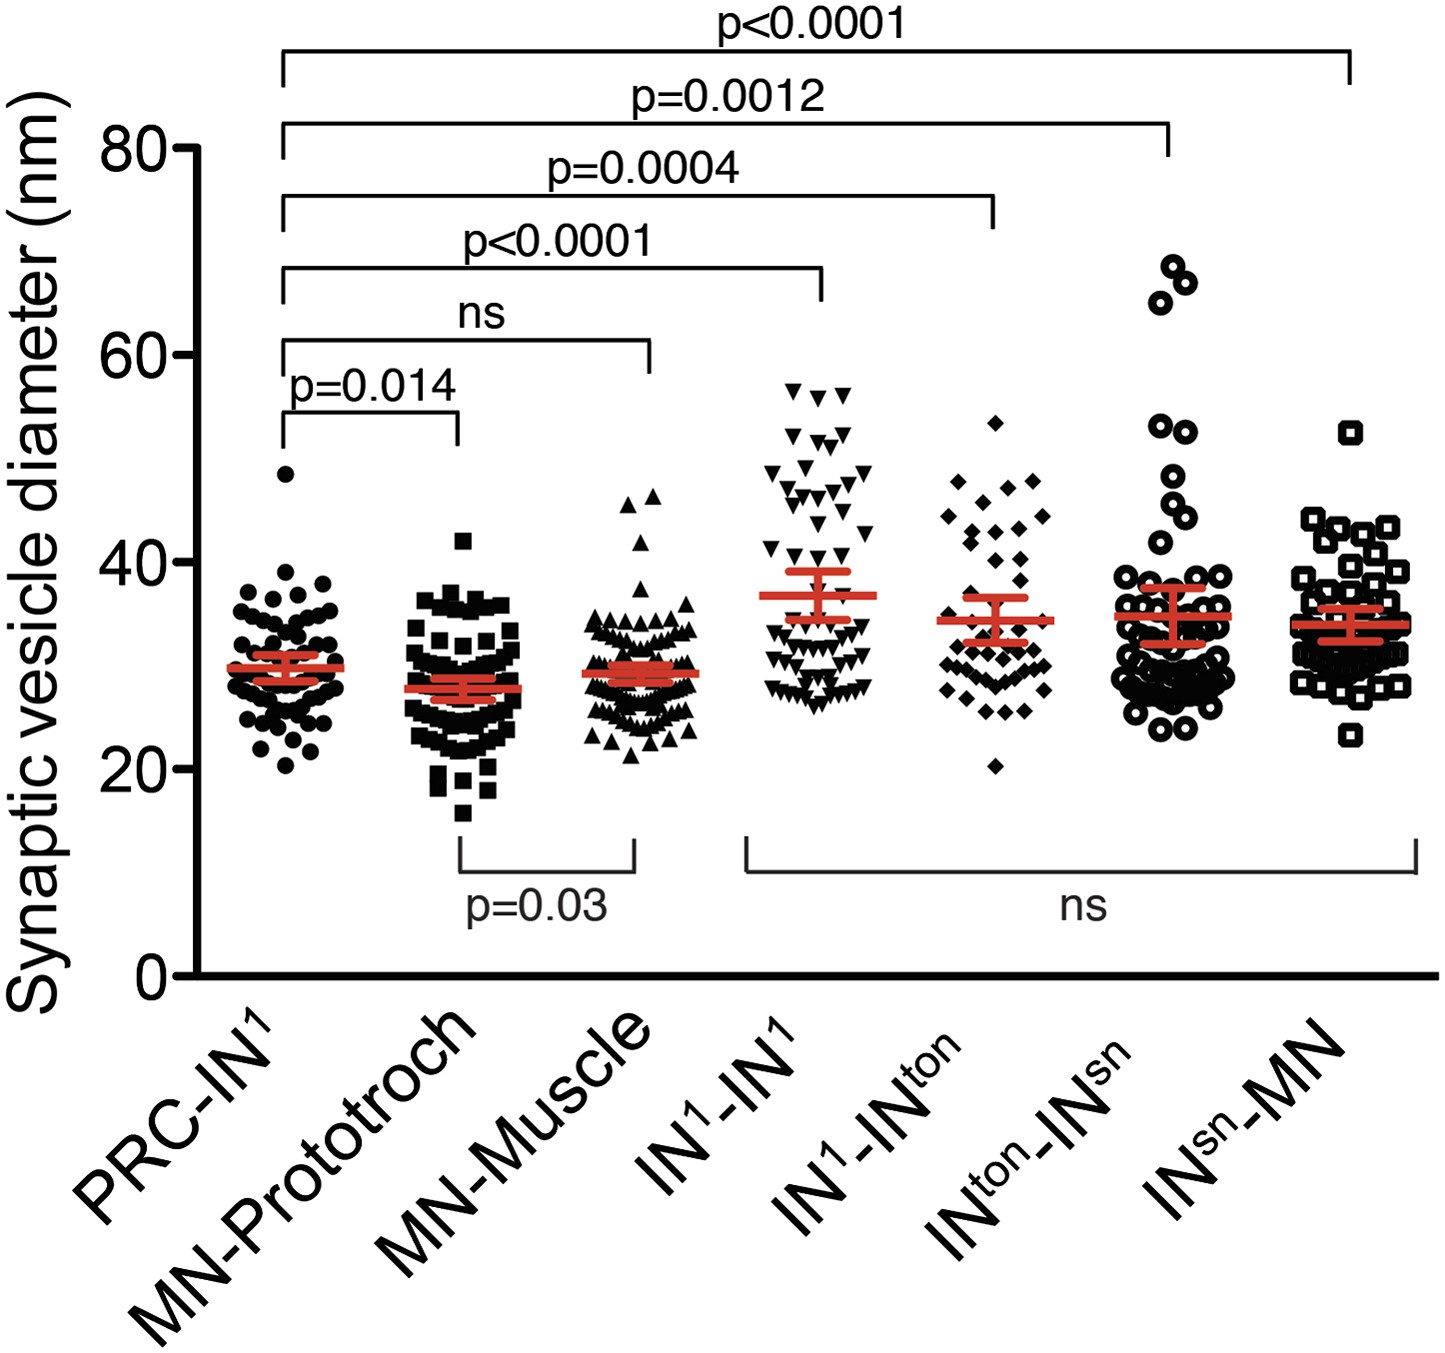
Synaptic vesicle diameter for different synapse types.
Scatter plot of the diameter of synaptic vesicles of different synapse types. The labels indicate the pre- and post-synaptic neurons. Vesicle diameter was measured from high-resolution (0.2 nm/pixel) images. Mean with 95% confidence interval are shown. n >47 vesicles for each synapse type. p-values of an unpaired t test with Welch's correction are indicated relative to synaptic vesicles of the photoreceptors.
Figure 3—figure supplement 2
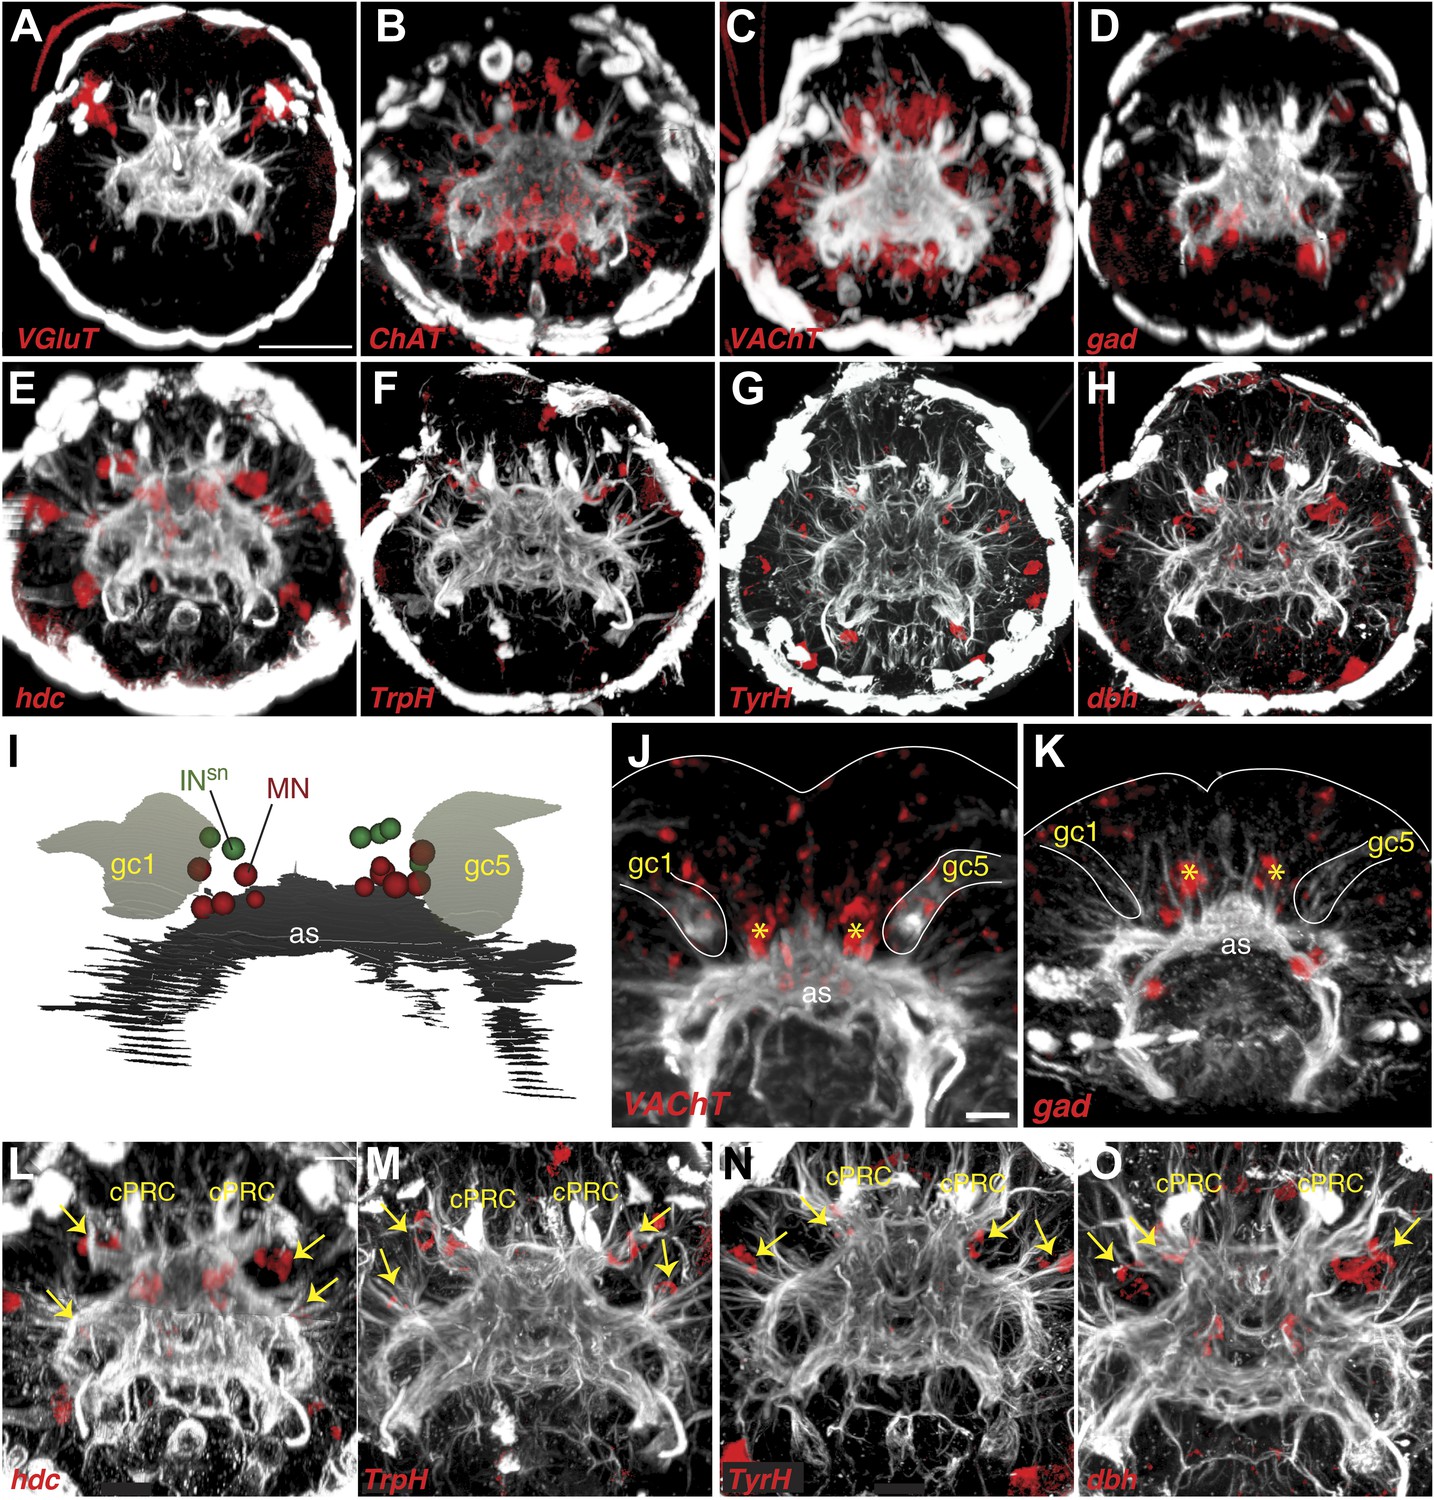
Expression of neurotransmitter markers in the head of Platynereis larva.
(A–H) Whole mount RNA in situ hybridization in 3-day-old larvae for neurotransmitter marker genes (red), counterstained with acetylated tubulin antibody (white). (A) Glutamatergic marker vesicular glutamate transporter (VGluT), (B and C) cholinergic markers choline acetyltransferase (ChAT) and vesicular acetylcholine transporter (VAChT), (D) GABAergic marker glutamate decarboxylase (gad), (E) histaminergic marker histidine decarboxylase (hdc), (F) serotonergic marker tryptophan hydroxylase (TrpH), (G) dopaminergic marker tyrosine hydroxylase (TyrH), and (H) adrenergic marker dopamine beta hydroxylase (dbh). (I) Ventral view schematic based on EM data of cell body positions of motorneurons (MN) and Schnörkel interneurons (INsn) relative to the larval axonal scaffold (as) and two gland cells (gc1, gc5). (J and K) Close-up of whole mount RNA in situ hybridization of (J) cholinergic marker VAChT and (K) GABAergic marker gad. Gland cells (gc) are indicated by a white outline. Yellow asterisks mark the ventral domain of gene expression. (L–O) Close-up of panels (E–H) showing whole mount RNA in situ hybridizations of (L) hdc (M) TrpH (N) TyrH (O) dbh. Yellow arrows indicate areas of gene expression in the region of the interneurons. The sensory cilia of the ciliary photoreceptor cells (cPRC) are indicated. (A–H and L–O) are anterior views, (I–K) are ventral views. Scale bar: (A–H) 50 µM, (J–O) 10 µM.
Figure 3—figure supplement 3
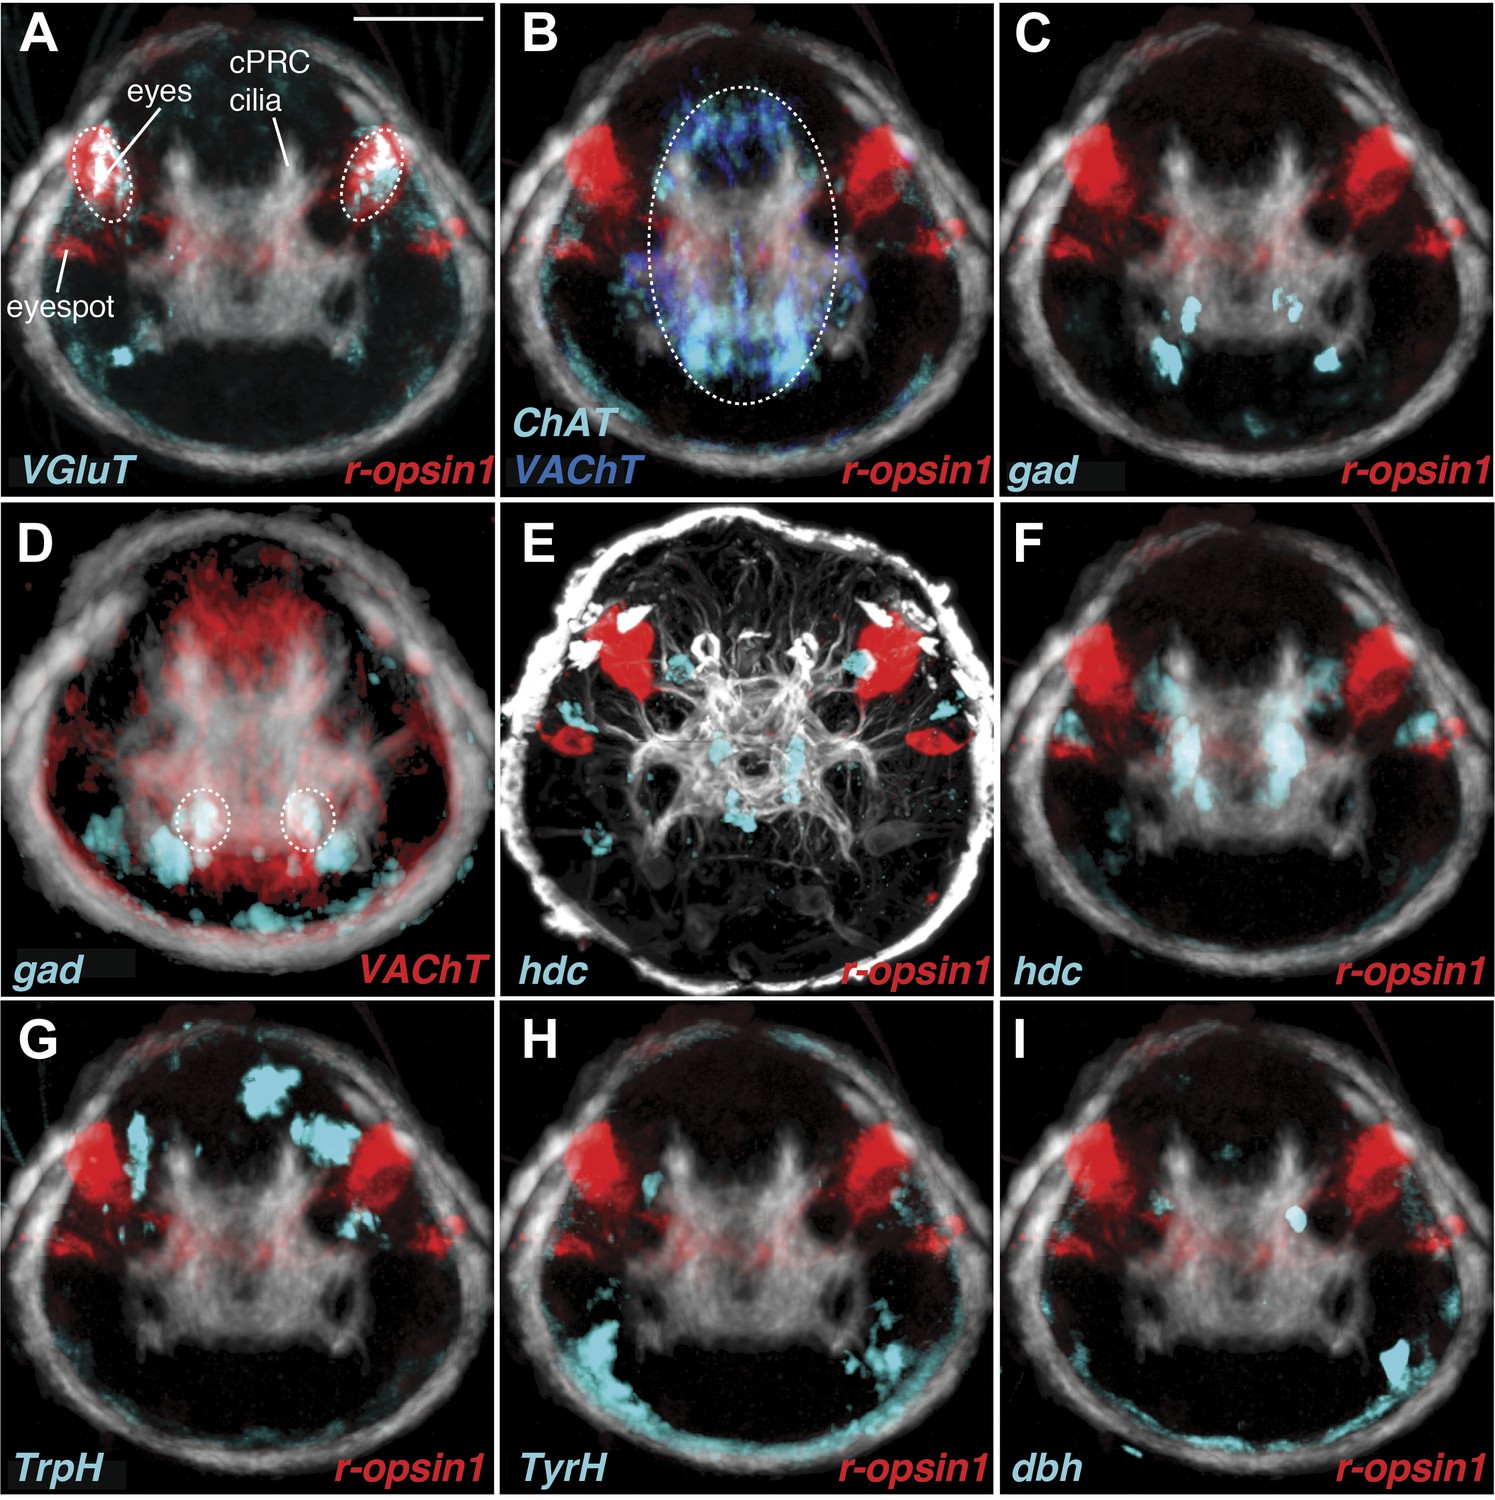
Neurotransmitter marker gene expression profiling.
The spatial relationships and colocalization of neurotransmitter marker genes were characterized by image registration and double RNA in situ hybridization in 3-day-old Platynereis larvae. (A–D and F–I) Average expression patterns of neurotransmitter marker genes and r-opsin1 projected onto a common whole-body nuclear reference template. An average acetylated tubulin signal (white) was also projected onto the reference. Colocalization of registered genes in the average gene expression 3D image stacks is indicated by white and highlighted by dashed circles. (E) Double whole mount RNA in situ hybridization for hdc (cyan) and r-opsin-1 (red) counterstained with acetylated tubulin antibody (white). All images are anterior views. Scale bar 50 µM. Average 3D image stacks are available in Randel et al. (2014).
Figure 4 with 6 supplements
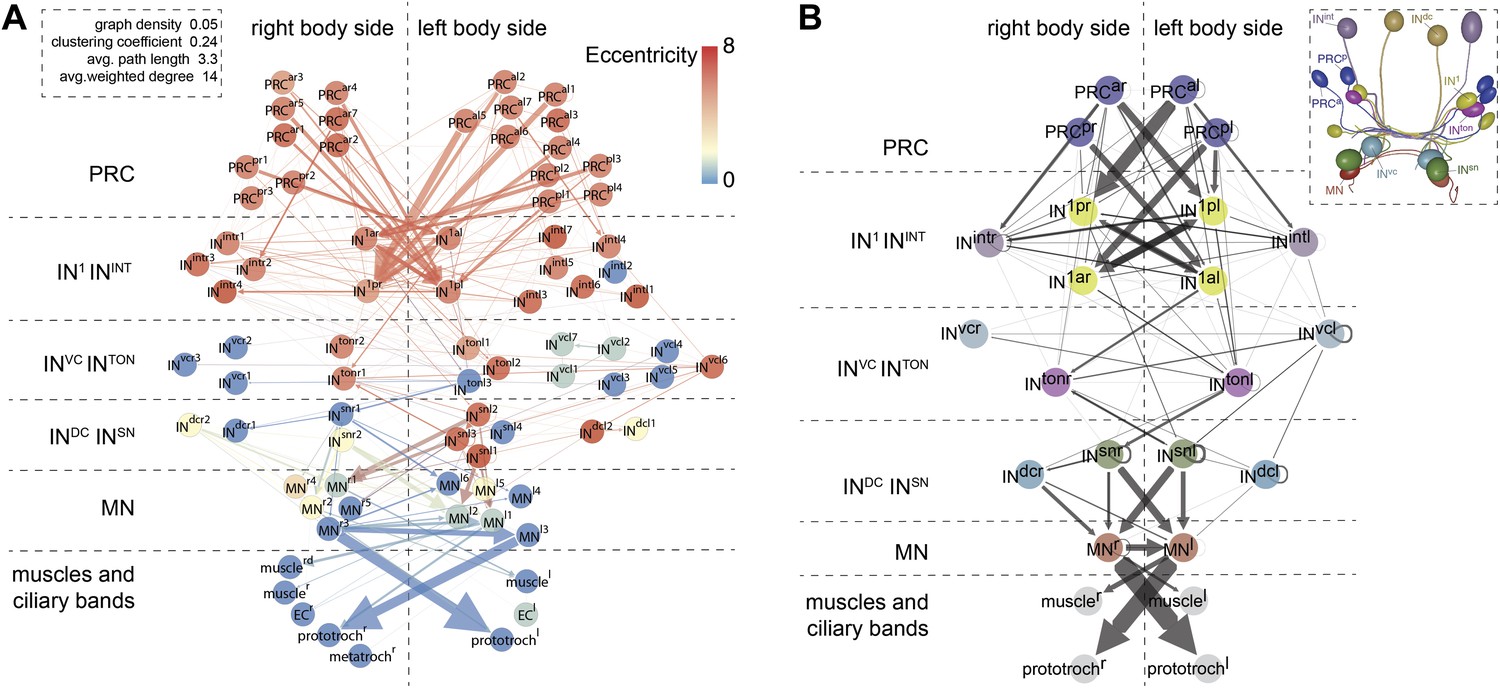
Network analysis of the visual eye circuitry.
(A) Full connectomic graph of the visual eye circuit including 71 neurons and 8 effectors (muscles, ciliary band cells and epithelial cells). The edges are directed from presynaptic cell pointing to postsynaptic cells. Edges are weighted by the number of synapses. Inset shows selected network parameters. (B) Merged graph representation of the visual circuit. Nodes correspond to neuron classes, edges are weighted by the maximum number of synapses between two neuron types of each class. Nodes are colored following the color scheme used to label cell types. Inset shows the anatomical position of the cell types. PRCal, anterior-left photoreceptors; PRCar, anterior-right photoreceptors; PRCpl, posterior-left photoreceptors; PRCpr, posterior-right photoreceptors; IN, interneuron; MN, motorneuron. Matrix files of the complete and the merged networks are available in Figure 4—source datas 1 and 2.
-
Figure 4—source data 1
All-against-all connectivity matrix of the Platynereis eye circuit.
- https://doi.org/10.7554/eLife.02730.025
-
Figure 4—source data 2
Grouped connectivity matrix of the Platynereis eye circuit.
- https://doi.org/10.7554/eLife.02730.026
Figure 4—figure supplement 1
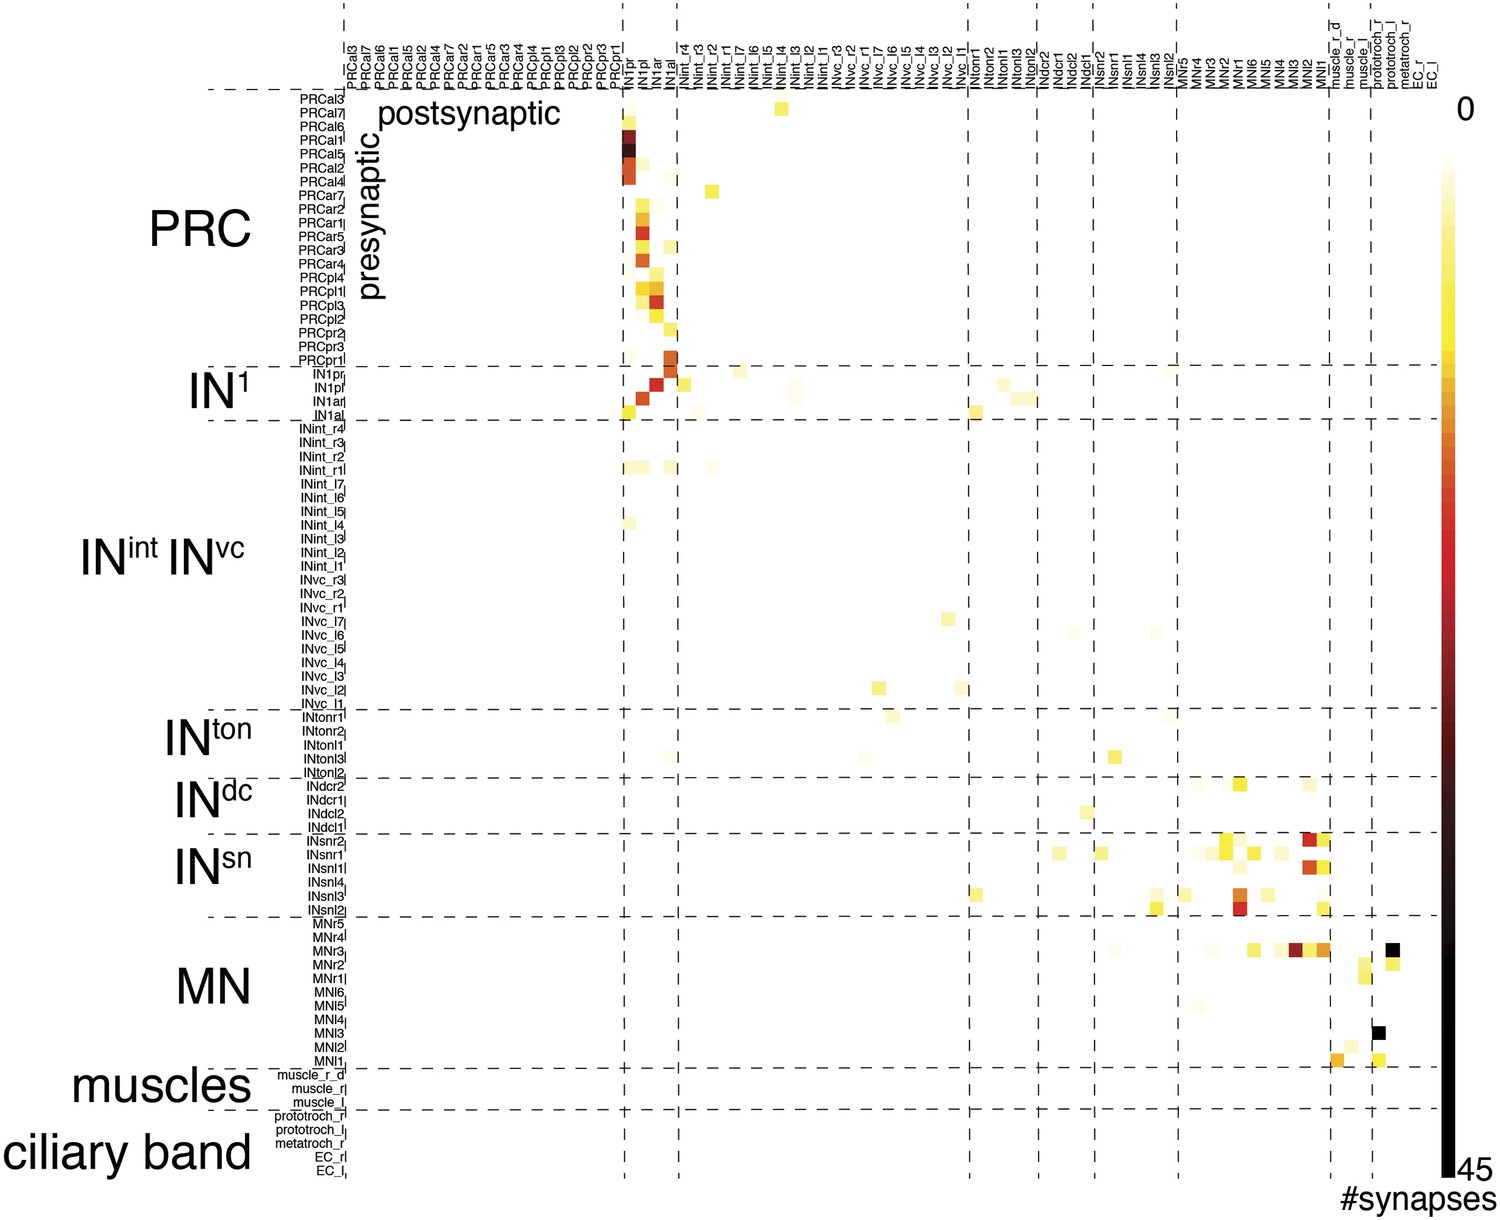
Synaptic connectivity matrix of the Platynereis larval visual circuit.
The synaptic connectivity matrix represents synaptic connections between 71 neurons and 8 effectors.
Figure 4—figure supplement 2
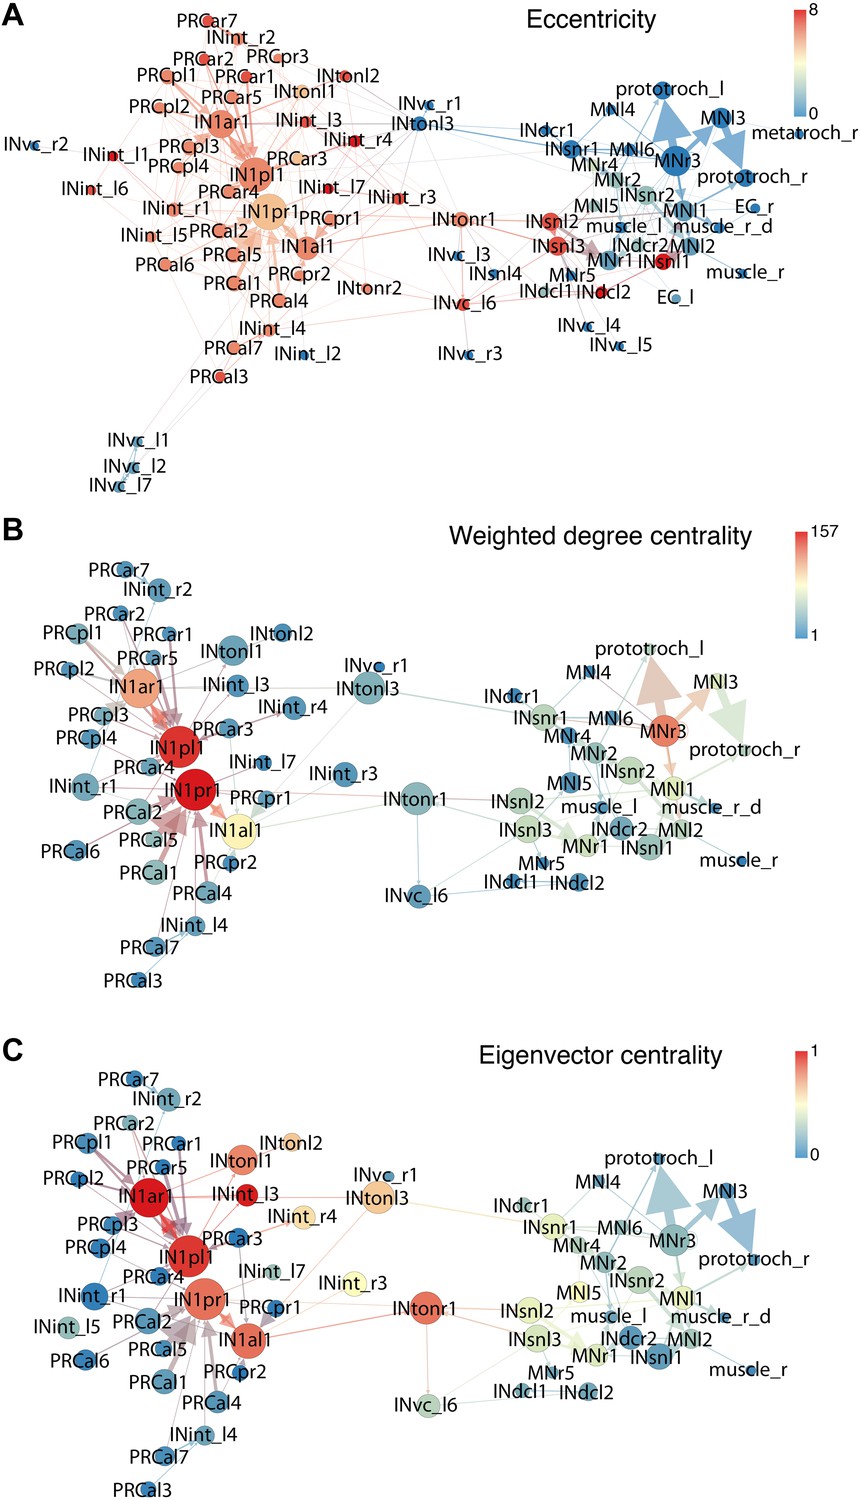
Connectivity graphs of the Platynereis larval visual circuit.
Nodes correspond to single neurons, edges represent connections, weighted by synapse number. The layout is based on force field clustering. Nodes in the full (A) or the trimmed (B and C) graphs were colored by eccentricity (A), weighted degree centrality (B) or eigenvector centrality (C). In (A) all cells and connections of the minimal eye circuit are shown, in (B and C) cells connected with <3 synapses and edges <3 synapses were removed.
Figure 4—figure supplement 3
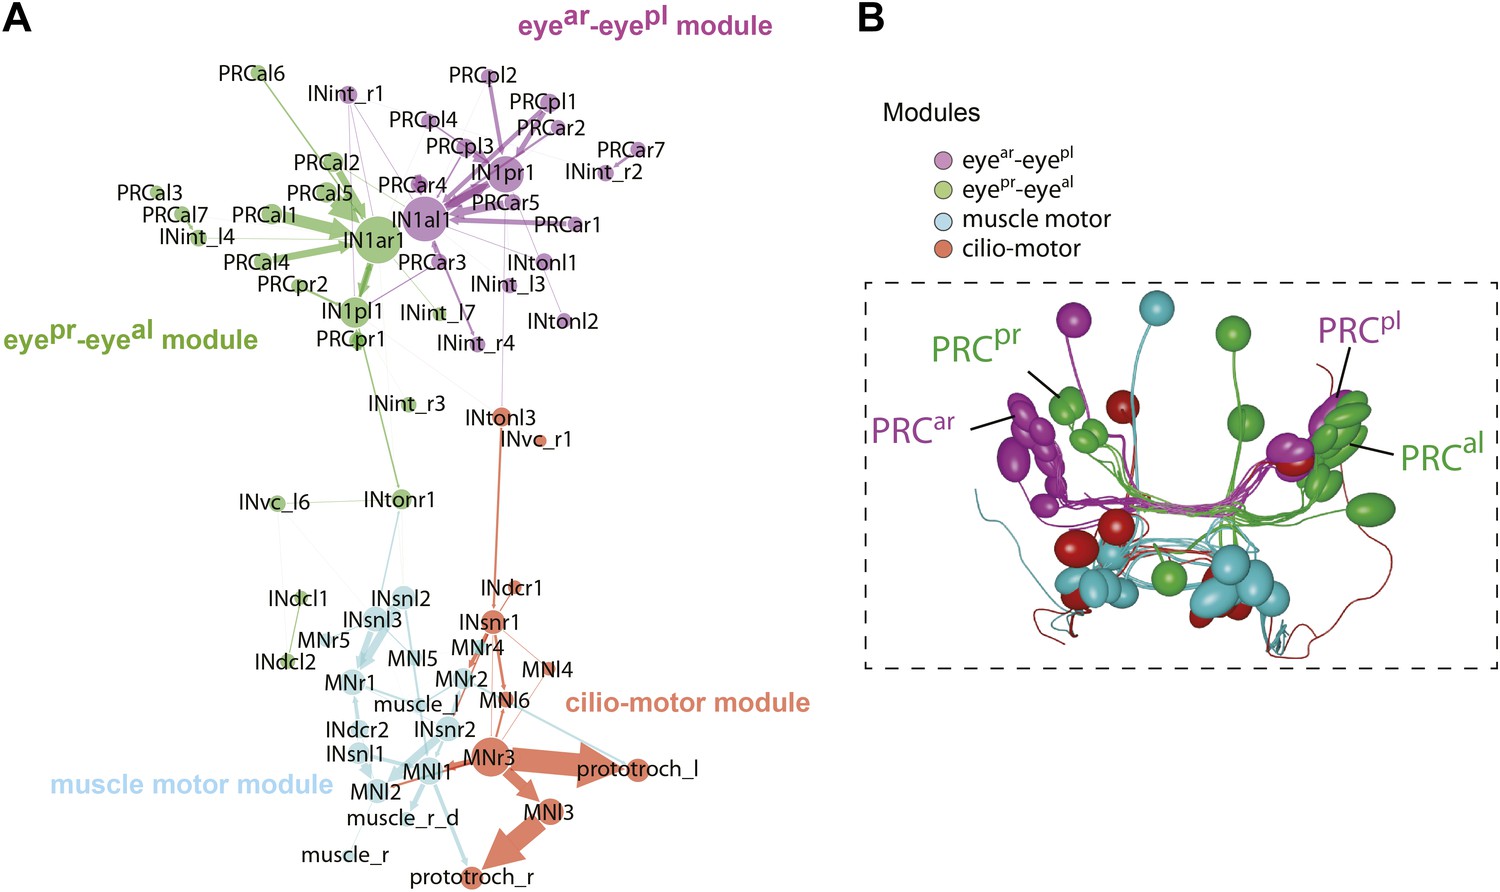
Modules in the eye connectivity graph.
(A) Trimmed connectomic graph of the visual eye circuit including 56 neurons and 5 effectors (muscles and ciliary band cells). Colors indicate the four modules of the network. Edges are colored as their source node. (B) Anatomical position of the cells of the four modules. The cells are colored as in (A), according to their module association.
Figure 4—figure supplement 4
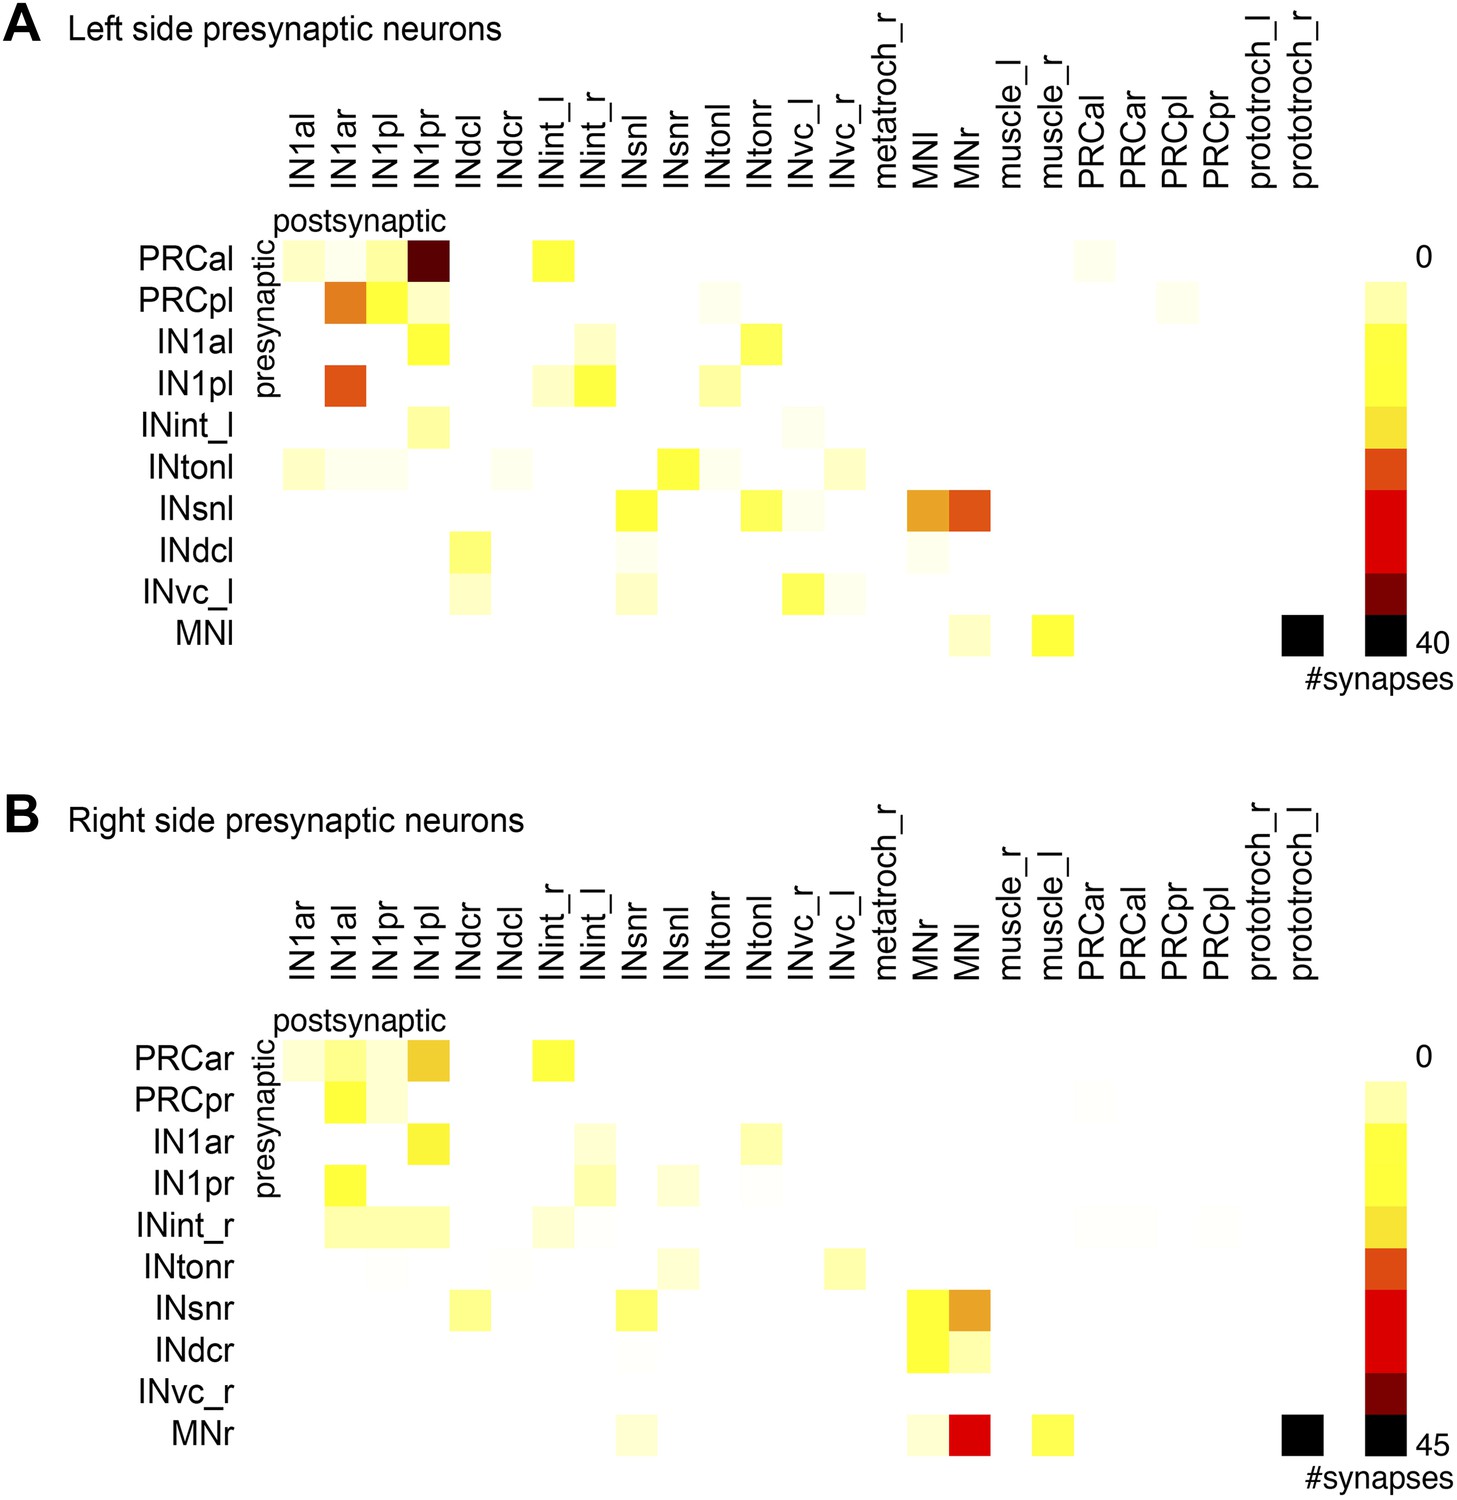
Connectivity matrix of the left and right body sides.
Synaptic connectivity matrix of cells with a cell body on the left (A) and right (B) body side.
Figure 4—figure supplement 5
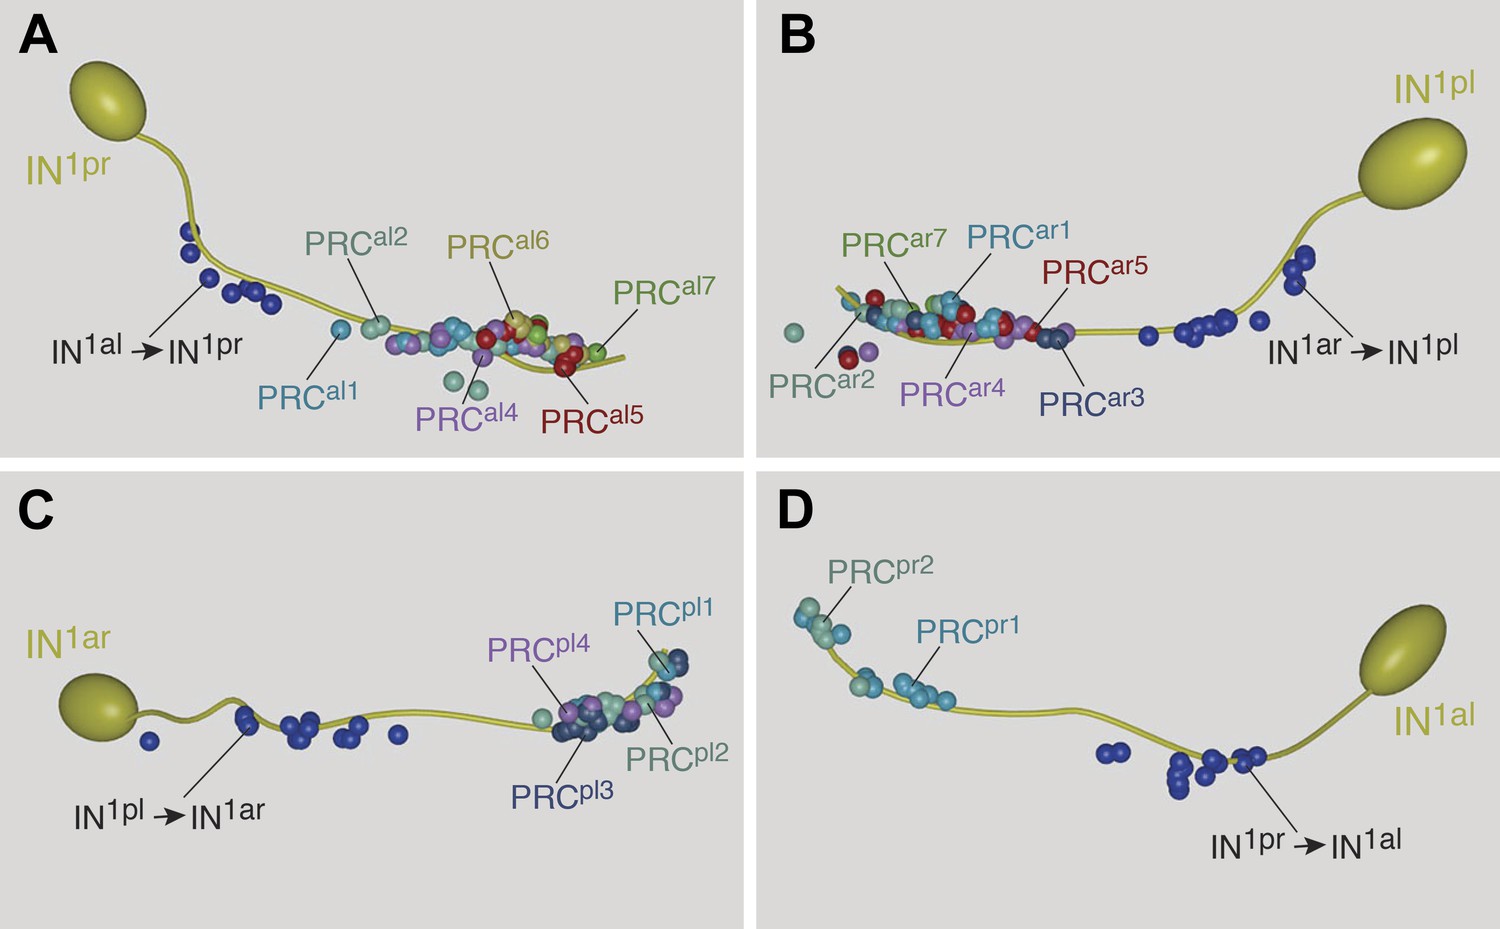
Stereotypy of synapse distribution on IN1 cells.
Spatial distribution of synapses onto axons of the posterior right (A), posterior left (B), anterior right (C), and anterior left (D) IN1 axons. Synapses of individual PRCs to IN1 axons are shown in different colors. The cell-body proximal synapses from the axons of the respective crosswise IN1 cell are also shown.
Figure 4—figure supplement 6
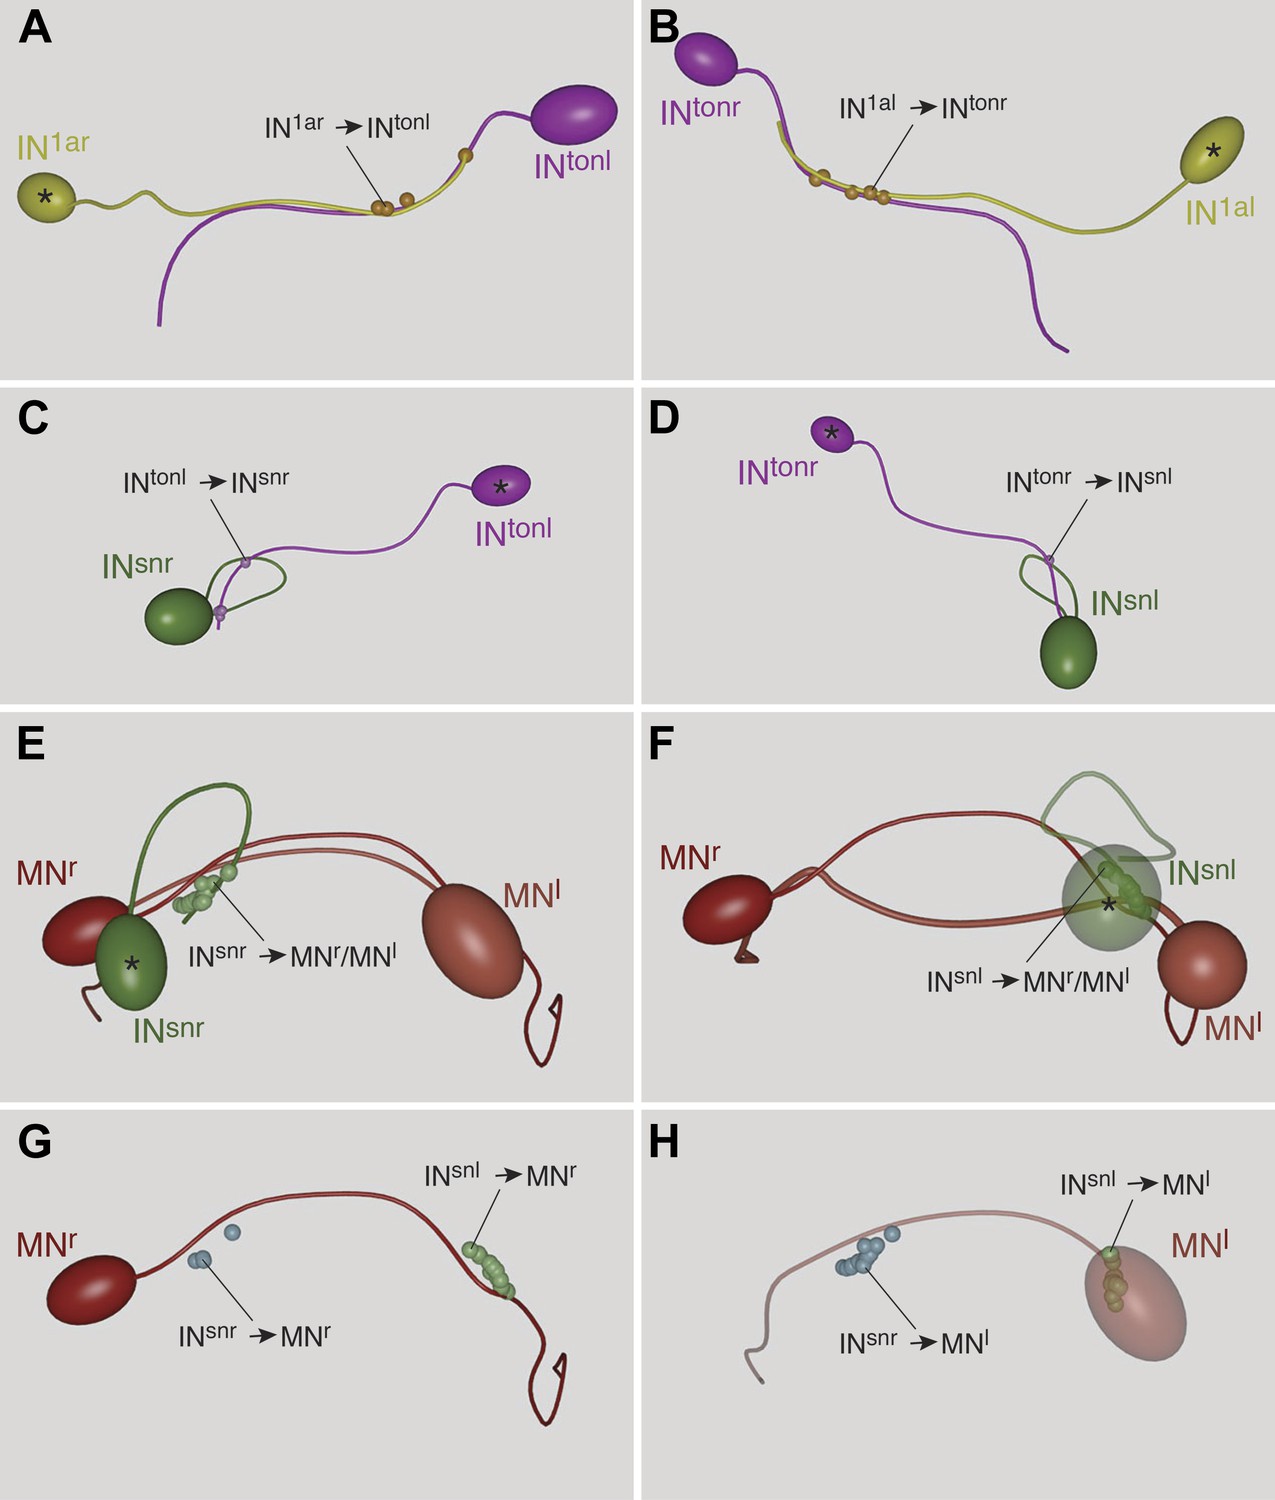
Stereotypy of synapse distribution on INton, INsn and MN cells.
Spatial distribution of synapses between (A and B) IN1 and INton, (C and D) INton and INsn and (E–H) INsn and MN cells. Asterisks mark the presynaptic neuron.
Figure 5
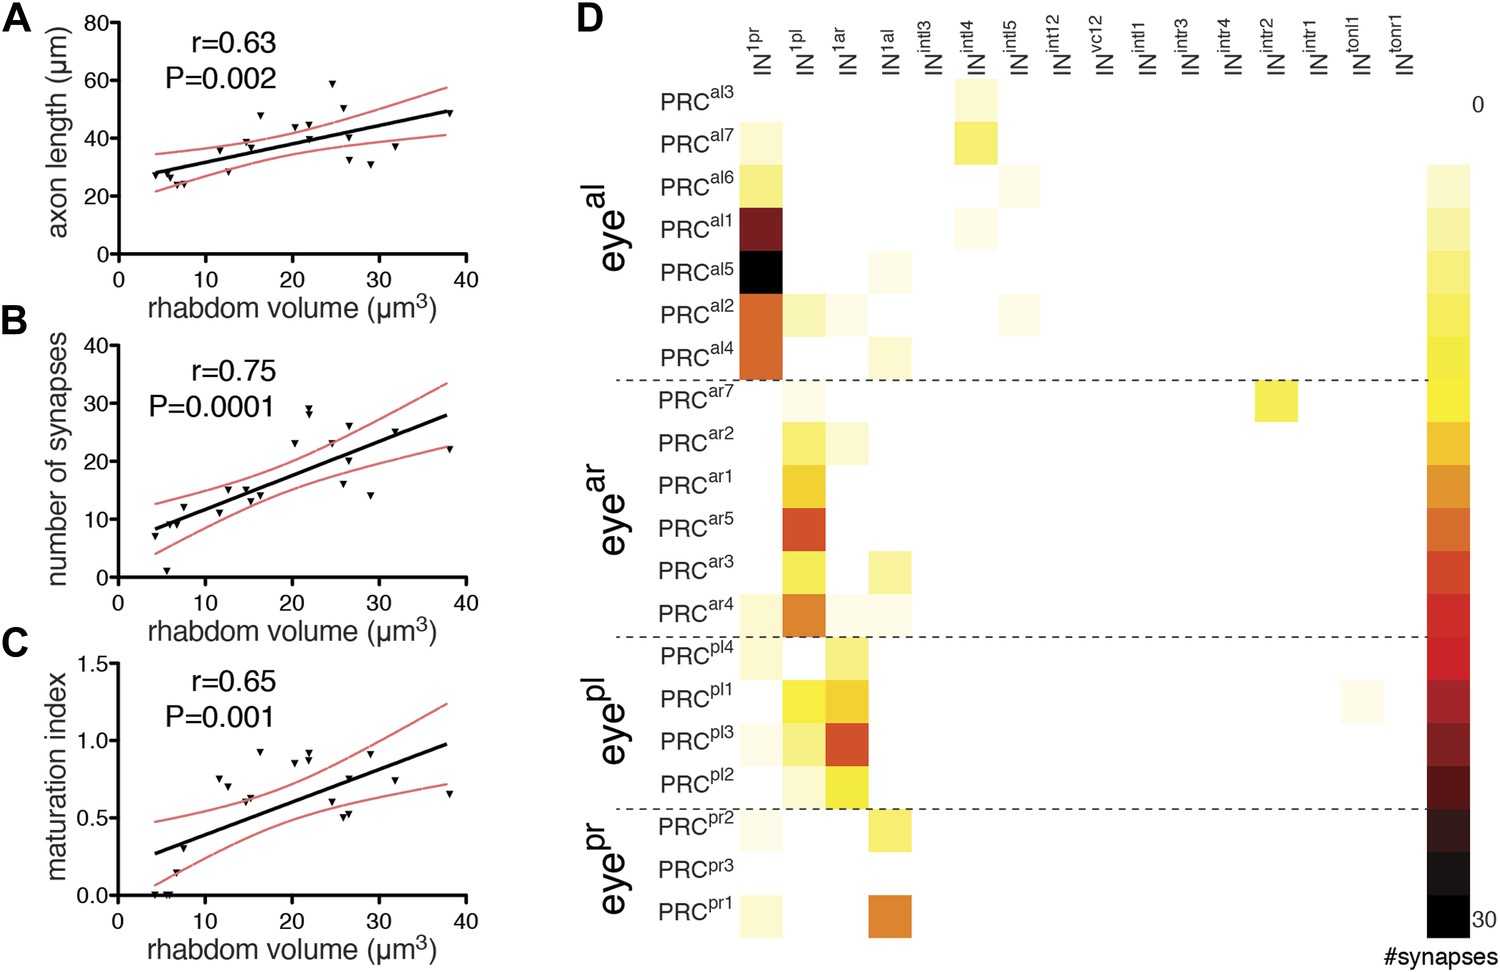
Maturation of photoreceptor connections.
(A) Relationship of rhabdom volume to photoreceptor axon length. (B) Relationship of rhabdom volume to photoreceptor synapse number. (C) Relationship of photoreceptor connectivity-maturation index to rhabdom volume. In A–C the black line shows linear regression with 95% confidence interval (red dashed lines). Pearson r and p-value are shown. (D) Connectivity matrix of the photoreceptors. The matrix is ordered from top to bottom by eye and then for each eye by photoreceptor rhabdom size increasing from top to bottom. Eyeal, anterior-left eye; eyear, anterior-right eye; eyepl, posterior-left eye; eyepr, posterior-right eye.
Figure 6 with 2 supplements

Eyes mediate body bending during visual phototaxis.
(A) Selective eye illumination triggers body bending in an immobilized larva. (B) A larva with both left eyes ablated displays body bending upon uniform illumination with white light (light) but not with a red filter (dark). An asterisk marks the tip of the tail. (C and D) Trajectories of larvae with both left eyes ablated in the dark (red filter) (C) and upon uniform illumination with white light (D). (E) Tail bending upon uniform white light illumination of non-ablated control larvae and larvae lacking the two left eyes. Data are shown as mean ± SEM, n >9 for both condition. p-value of a t test calculated for the last time point is indicated. (F) Percentage of phototactic (red) and non-phototactic (black) larvae among non-ablated control and various eye-ablated larvae. p-values of a chi-square test are indicated relative to non-ablated controls. Only the ‘all eyes’ and ‘two left eyes’ ablated conditions are significantly different from non-ablated control. Number of larvae tested is shown above the columns for each condition. Scale bars, 40 µm (A and B), 1 mm (C and D).
Figure 6—figure supplement 1
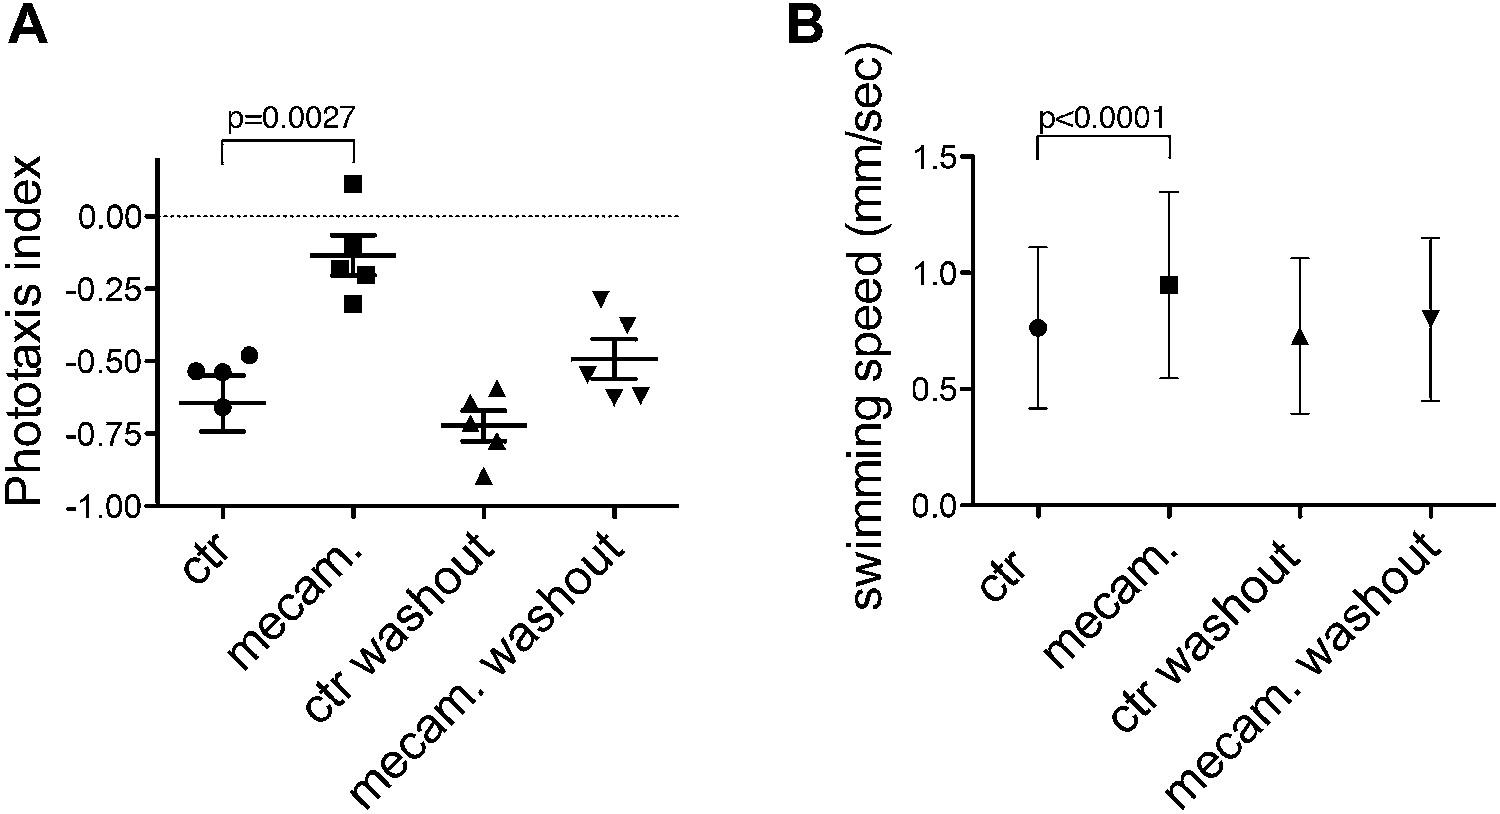
Inhibition of phototaxis by a cholinergic antagonist.
Phototaxis index (A) and swimming speed (B) of control 3-day-old larvae and larvae treated with the acetylcholine receptor antagonist mecamylamine (50 μm). Data are shown as scatter plots with mean ± SEM. The phototaxis index is a population measure, the data are from five replicate experiments, each with >14 larvae. Swimming speed was averaged for single larvae (n >138 larvae). p-values of unpaired t tests relative to control larvae are shown. Source data are available from Randel et al. (2014).
Figure 6—figure supplement 2
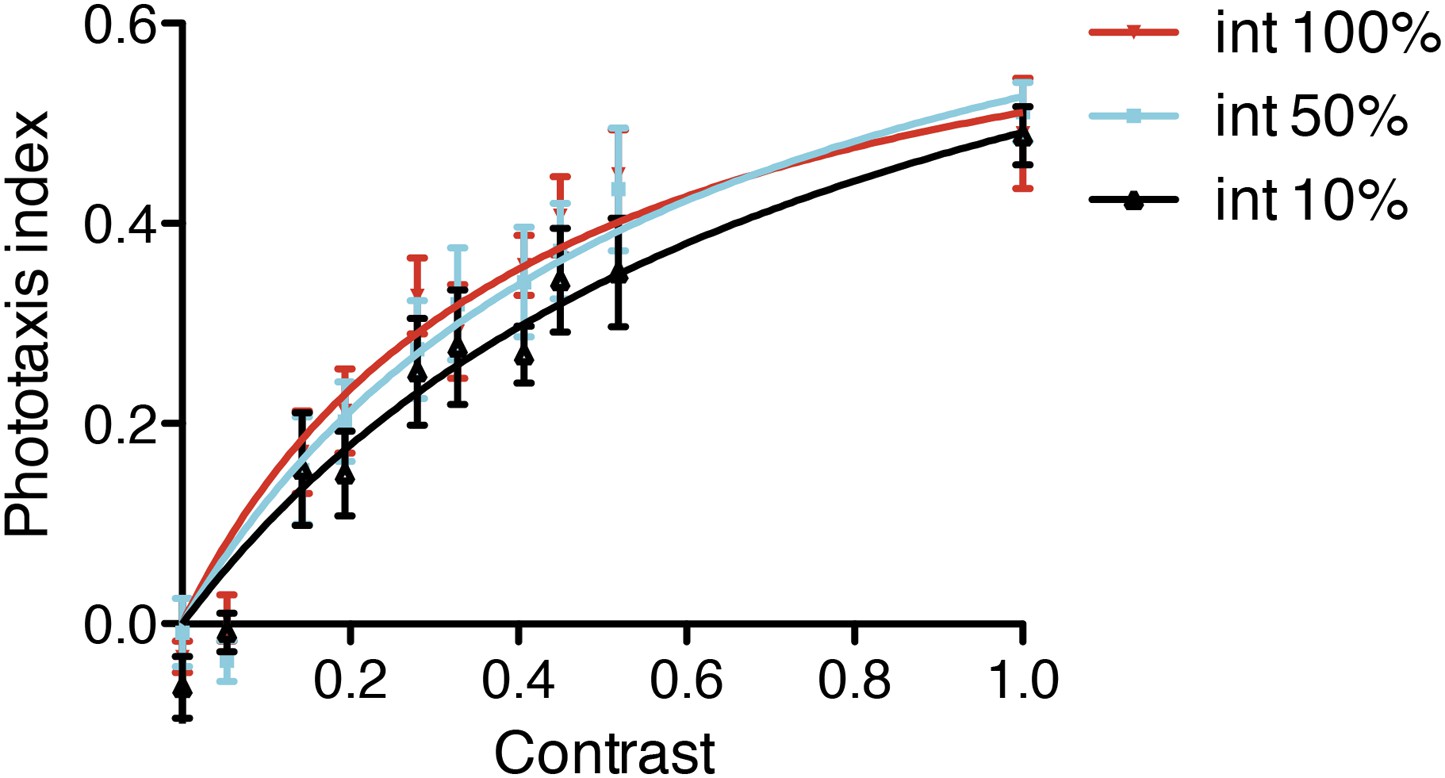
Efficiency of phototaxis depends on contrast, not absolute light levels.
Larval phototaxis was measured in a cuvette illuminated from both sides. The stimulus light was dimmed on one side by adding progressively more 10% or 25% neutral density filters. The experiment was performed with 100%, 50% and 10% starting white light intensity. Data are shown as mean ± SEM. The data points were fitted with a saturation binding-curve. Contrast is defined as (Imax − Imin)/(Imax + Imin) where Imax and Imin are maximum and minimum intensity.
Figure 7

An interneuron motif for enhanced contrast detection.
(A) Strength of reciprocal connections between all neuron pairs in the complete visual circuit. The strength of reciprocal connections was defined as the geometric mean of the number of reciprocal synapses between each neuron pair. The single neuron identifiers are not shown for simplicity. (B) The strongest reciprocal motif in the eye circuit is between the crosswise IN1 pairs. The position and polarity of the synapses are indicated. (C) Quantification of tail bending in different eye ablated larvae under selective eye illumination with a 488-nm laser. Data are shown as mean ± SEM, n >17 for each condition. Larvae lacking two anterior eyes were compared to non-ablated control larvae at each time point (*p value<0.05, **p value<0.01, unpaired t test). (D) Signal-response curve of maximum tail bending upon selective eye illumination in immobilized larvae using 488-nm stimuli of different intensities. The data are fitted with a saturation-binding curve. Data are shown as mean ± SEM, n >24 larvae for each condition (independent from C). p-values of unpaired t tests comparing larvae lacking two anterior eyes to the other conditions are shown. Source bending data from (C and D) are shown in Figure 7—source data 1 and Figure 7—source data 2.
-
Figure 7—source data 1
Source data of tail bending experiments in Figure 7C.
- https://doi.org/10.7554/eLife.02730.041
-
Figure 7—source data 2
Source data of tail bending experiments in Figure 7D.
- https://doi.org/10.7554/eLife.02730.042
Figure 8
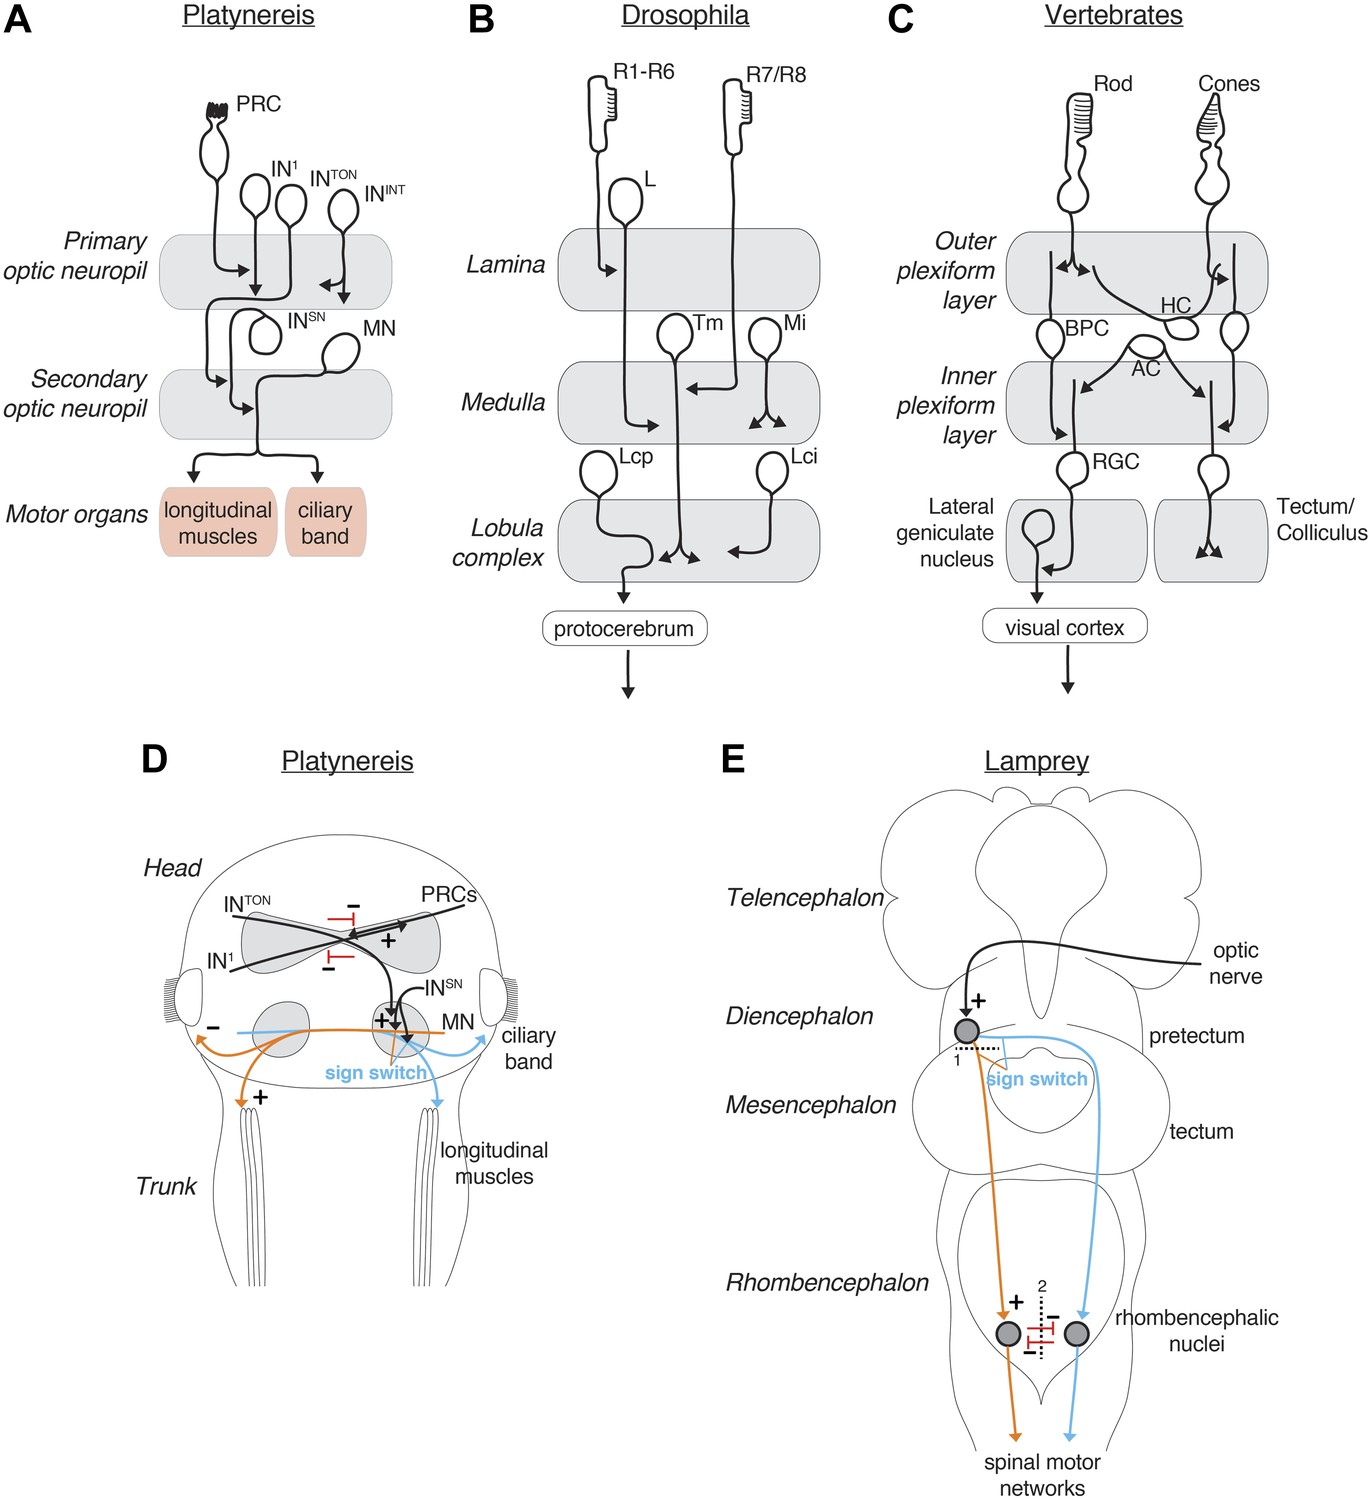
Comparison of the Platynereis, Drosophila and vertebrate visual circuits.
Comparison of the Platynereis visual circuit with the Drosophila and vertebrate visual circuits on the neuronal level (A–C) and with the lamprey phototactic circuit on the circuit level (D and E). In (E) dashed line (1) represents a mesencephalic hemisection, severing connections between the pretectum and the ipsilateral reticulospinal neurons, dashed line (2) represents transection of the ventral rhombencephalic commissure. L, lamina monopolar neuron; Tm, transmedula neuron; Mi, medulla intrinsic neuron; Lcp, lobula complex projection neuron; Lci, lobula complex intrinsic neuron; BPC, bipolar cell; HC, horizontal cell, AC, amacrine cell; RGC, retinal ganglion cell. (B and C) after Erclik et al. (2009); (Sanes and Zipursky, 2010) (E) after Ullén et al. (1997).
Videos
Video 1
Head and first trunk segment of a 3-day-old Platynereis larva.
DIC and reflection imaging of the head and first trunk segment of a 73 hr-post-fertilization Platynereis larva, corresponding to the volume analyzed by ssTEM. The four eyes and the eyespots are visualized based on the reflection of the pigment (red). The frame contains a volume of 151 × 151 × 61 μm. The larva is squeezed dorso-ventrally with the coverslip. Grid spacing is 10 μm.
Video 2
Volume reconstruction of the two left eyecups.
The pigment vesicles of the pigment cells and the rhabdoms of the photoreceptors were reconstructed by ssTEM. The pigment of the photoreceptors is on the convex surface of the pigment cup, shown in different colors. The photoreceptor rhabdoms are inside the pigment cup. Scale bar, 2 μm.
Video 3
Cellular complement of the Platynereis larval visual circuit.
3D reconstruction of the cellular complement of the Platynereis larval visual circuit. The different cell types appear in the following order: photoreceptors, IN1, INint, INton, INsn, INdc, INvc, motorneurons, synapses, glia, muscles.
Video 4
Volume rendering of the left primary optic neuropil.
The reconstructed volume shows parts of two glia cells (pink and light blue), one IN1 axon (yellow) and the photoreceptor axons (different hues of blue) forming synapses on the IN1 axon. The position of the individual synapses to the IN1 axon are indicated in different colors for the different photoreceptors.
Video 5
Volume reconstruction of a Schnörkel interneuron and motorneurons.
3D reconstruction of one Schnörkel interneuron and its postsynaptic motorneuron targets. One Schnörkel interneuron is shown with its five postsynaptic motorneurons. The synapses are indicated. The Schnörkel interneuron connects to both ipsilateral and contralateral motorneurons either at a cell body proximal or a cell body distal position along the motorneuron axon.
Video 6
Mixed positive and negative phototaxis in 3-day-old Platynereis larvae.
Larvae were stimulated with alternating directional white light from the left or the right side of the phototaxis cuvette (shown by white bars on the side). Larvae display mixed phototaxis, some negatively phototactic larvae are tracked. Scale bar, 2 mm. Time increment: 0.07 s.
Video 7
A single phototactic turn in 4-day-old larvae.
The larvae were exposed to a 180-degree change in the direction of the white stimulus light, eliciting a phototactic turn. The stimulus direction is indicated by the white bars at the side of the video. During the turn the larvae are bending due to the contraction of the longitudinal muscles on one body side. Time increment: 0.066 s.
Video 8
Selective illumination of eyes triggers body bending.
Illumination of the eyes on one body side in the area shown by the green signal triggers body bending on the opposite body side, corresponding to negative phototaxis (left), or the same body side, corresponding to positive phototaxis (right). Scale bar, 50 μm. Time increment: 0.43 s.
Video 9
Laser ablation of the eyes.
The position of the four eyes and the two eyespots is shown by changing the imaging focus. The right eyes are ablated. The eye pigment is imaged using reflection imaging (red), and is overlaid on the DIC channel. Scale bar, 25 μm. Time increment: 1.1 s.
Video 10
Uniform illumination triggers body bending following unilateral eye ablation.
Both left eyes were ablated. The larva is imaged with DIC illumination with a 750 nm long-pass filter. The filter is removed to provide uniform white illumination from the microscope lamp at frame 98. The pigment of the right eye is visible. Scale bar, 50 μm. Time increment: 0.1 s.
Video 11
Calcium-imaging in ventral longitudinal muscles.
Calcium-imaging with GCaMP6 in the ventral longitudinal muscle during selective illumination of the right eyes. The larva is ventrally oriented, the eyes are out of focus. The circular ROI shows the illuminated area. The duration of the illuminations is visible in the DIC channel (brighter overall signal). Scale bar, 50 μm. Time increment: 0.57 s.
Video 12
Calcium-imaging in dorsal longitudinal muscles.
Calcium-imaging with GCaMP6 in the dorsal longitudinal muscle during selective illumination of the right eyes. The larva is dorsally oriented, the eyes are visible. The circular ROI shows the illuminated area. The duration of the illuminations is visible in the DIC channel (brighter overall signal). Scale bar, 50 μm. Time increment: 0.57 s.
Download links
A two-part list of links to download the article, or parts of the article, in various formats.
Downloads (link to download the article as PDF)
Open citations (links to open the citations from this article in various online reference manager services)
Cite this article (links to download the citations from this article in formats compatible with various reference manager tools)
Neuronal connectome of a sensory-motor circuit for visual navigation
eLife 3:e02730.
https://doi.org/10.7554/eLife.02730


