TAF7L modulates brown adipose tissue formation
- Howard Hughes Medical Institute, University of California, Berkeley, United States
- CIRM Center of Excellence, Li Ka Shing Center For Biomedical and Health Sciences, University of California, United States
- Fudan University, China
- University of California, Berkeley, United States
- The Hebrew University of Jerusalem, Israel
Figures
Figure 1 with 2 supplements
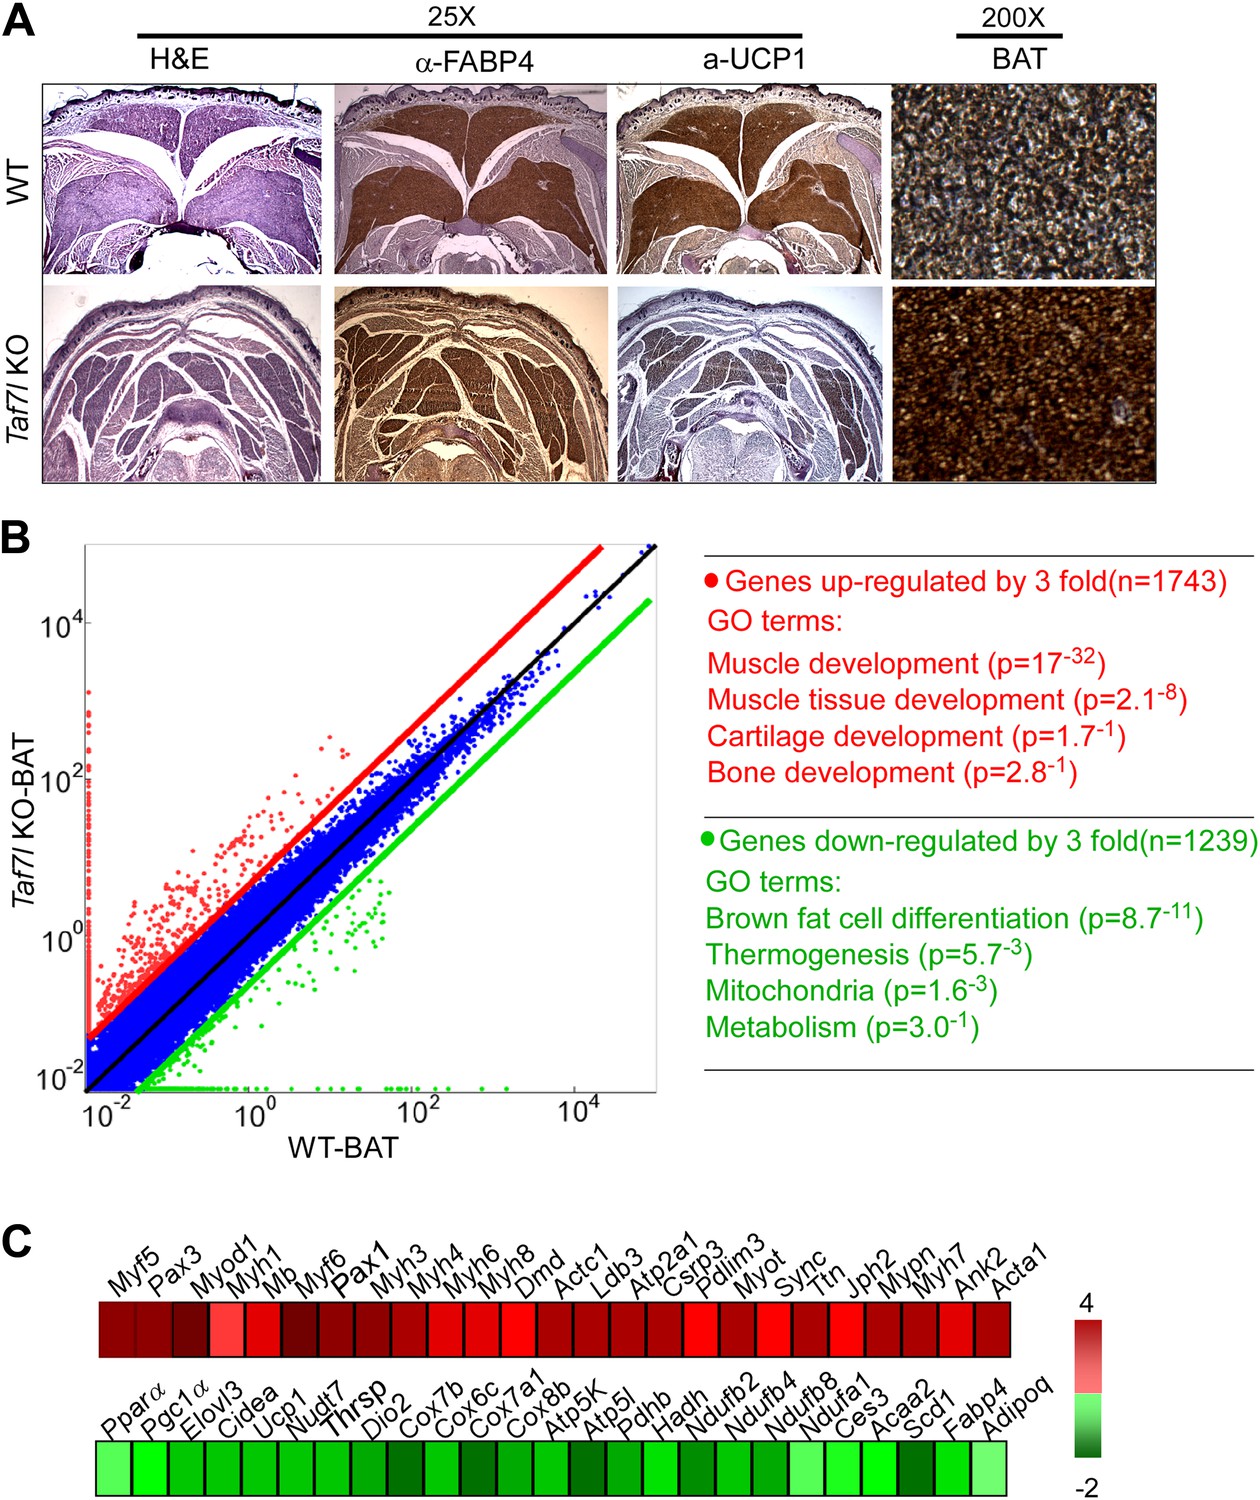
TAF7L is required for proper mouse brown adipose tissue (BAT) formation.
(A) Wild type (WT) and Taf7l knockout (Taf7l KO) interscapular BAT from E18.5 embryos was stained with haematoxylin and eosin (H&E), FABP4, and UCP1 (25X magnification shown). Rightmost panel shows FABP4 staining at 200X magnification. (B) Left panel: scatterplot shows gene expression profile in WT versus Taf7l KO BAT tissue; red dots represent genes up-regulated in Taf7l KO, green dots represent down-regulated genes in Taf7l KO. Right panel: gene ontology analysis shows functional groups of genes changed by at least threefold. (C) Difference in expression of either muscle-specific (top) or brown fat (bottom) genes between WT and Taf7l KO BAT with progressive red and green shades showing degrees of up- and down-regulation, respectively.
Figure 1—figure supplement 1
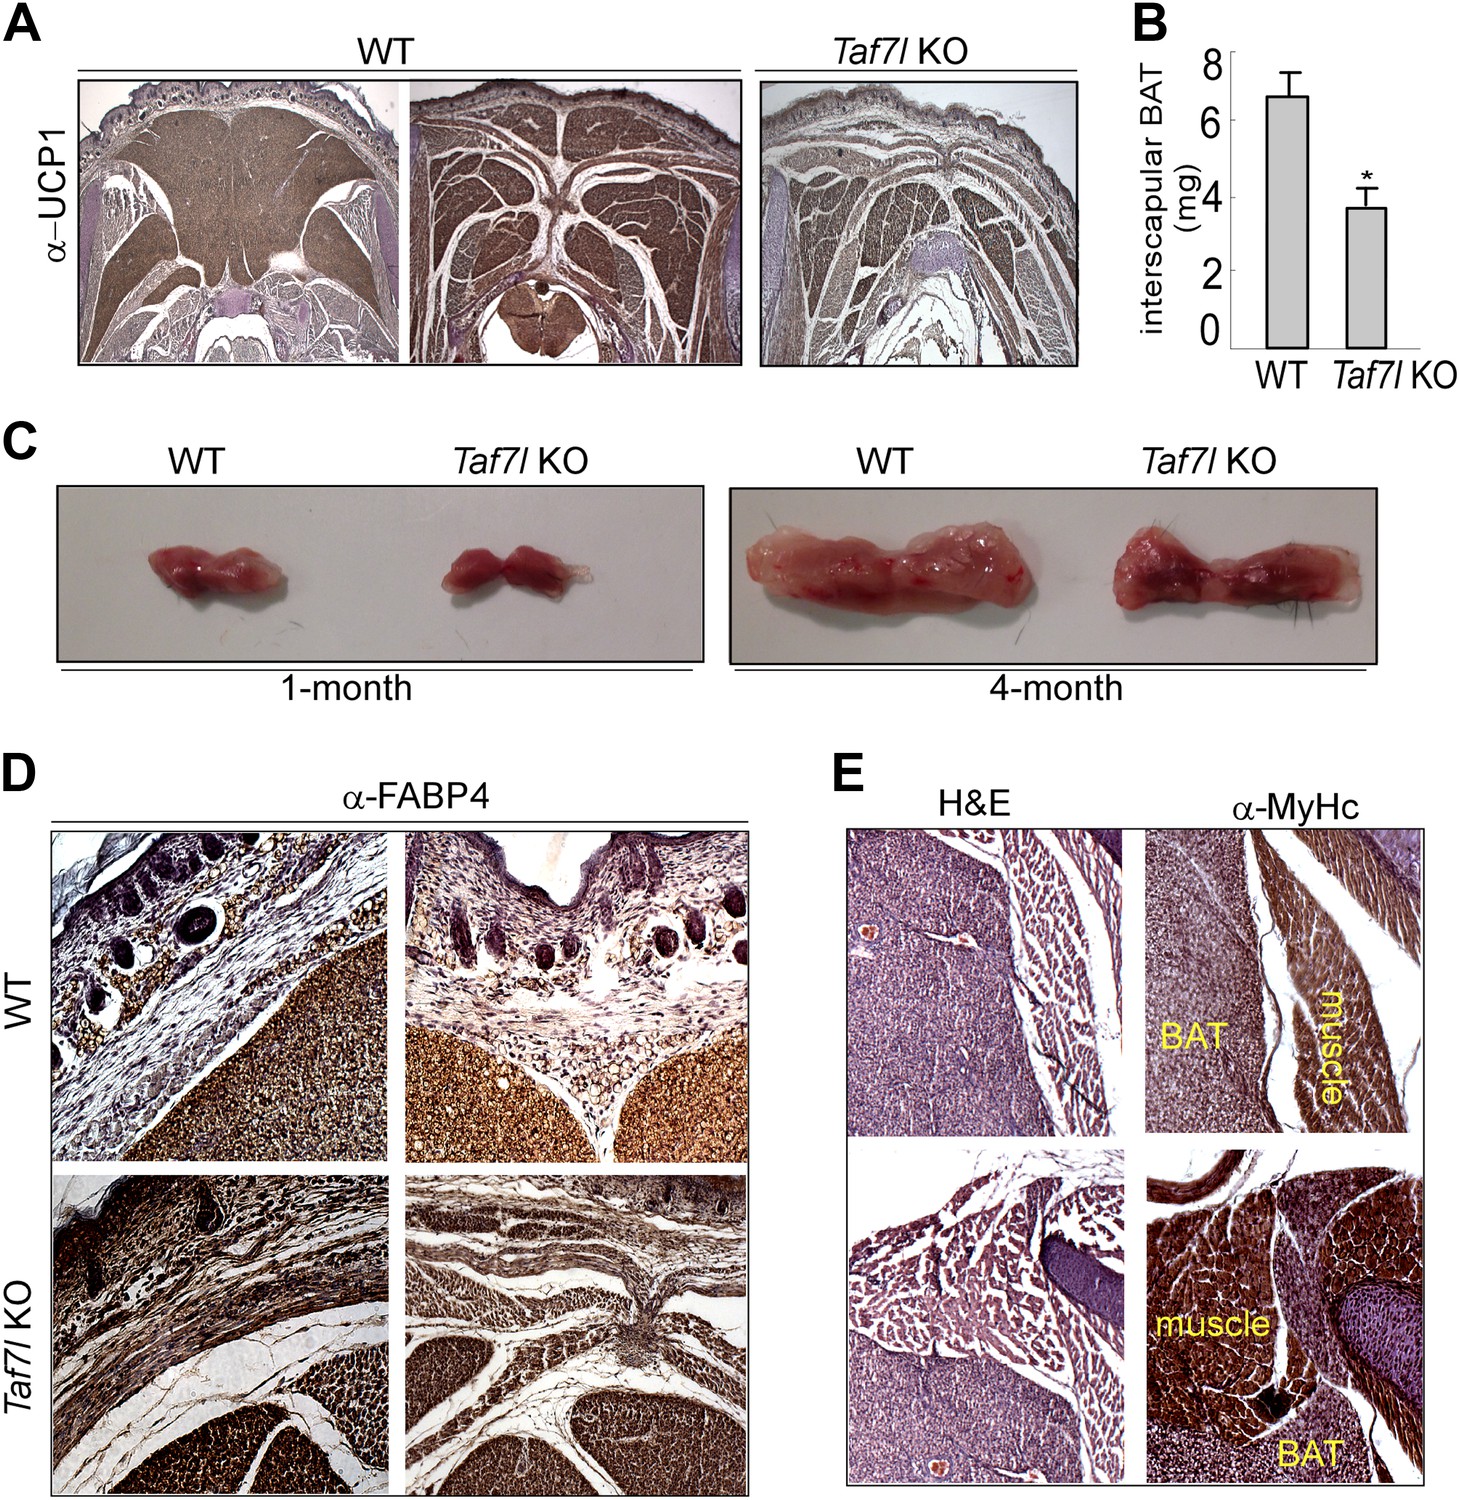
Depletion of TAF7L shifts BAT to muscle lineage.
(A) UCP1-stained BAT samples as in Figure 1A for three additional animals (2WT and 1 TAF7L KO). (B) Average BAT weight from WT (n = 10) and Taf7l KO embryos (n = 9). (C) Photographs of whole BAT from 1- or 4-month-old WT and Taf7l KO mice. (D) High-magnification images (200X) of similar areas of WT and Taf7l KO embryonic BAT stained with FABP4 antibody. (E) Haematoxylin and eosin (H&E) and myosin heavy chain (MYHC) staining of Taf7l KO embryos shows muscle–tissue structures along the BAT at high magnification (200X).
Figure 1—figure supplement 2
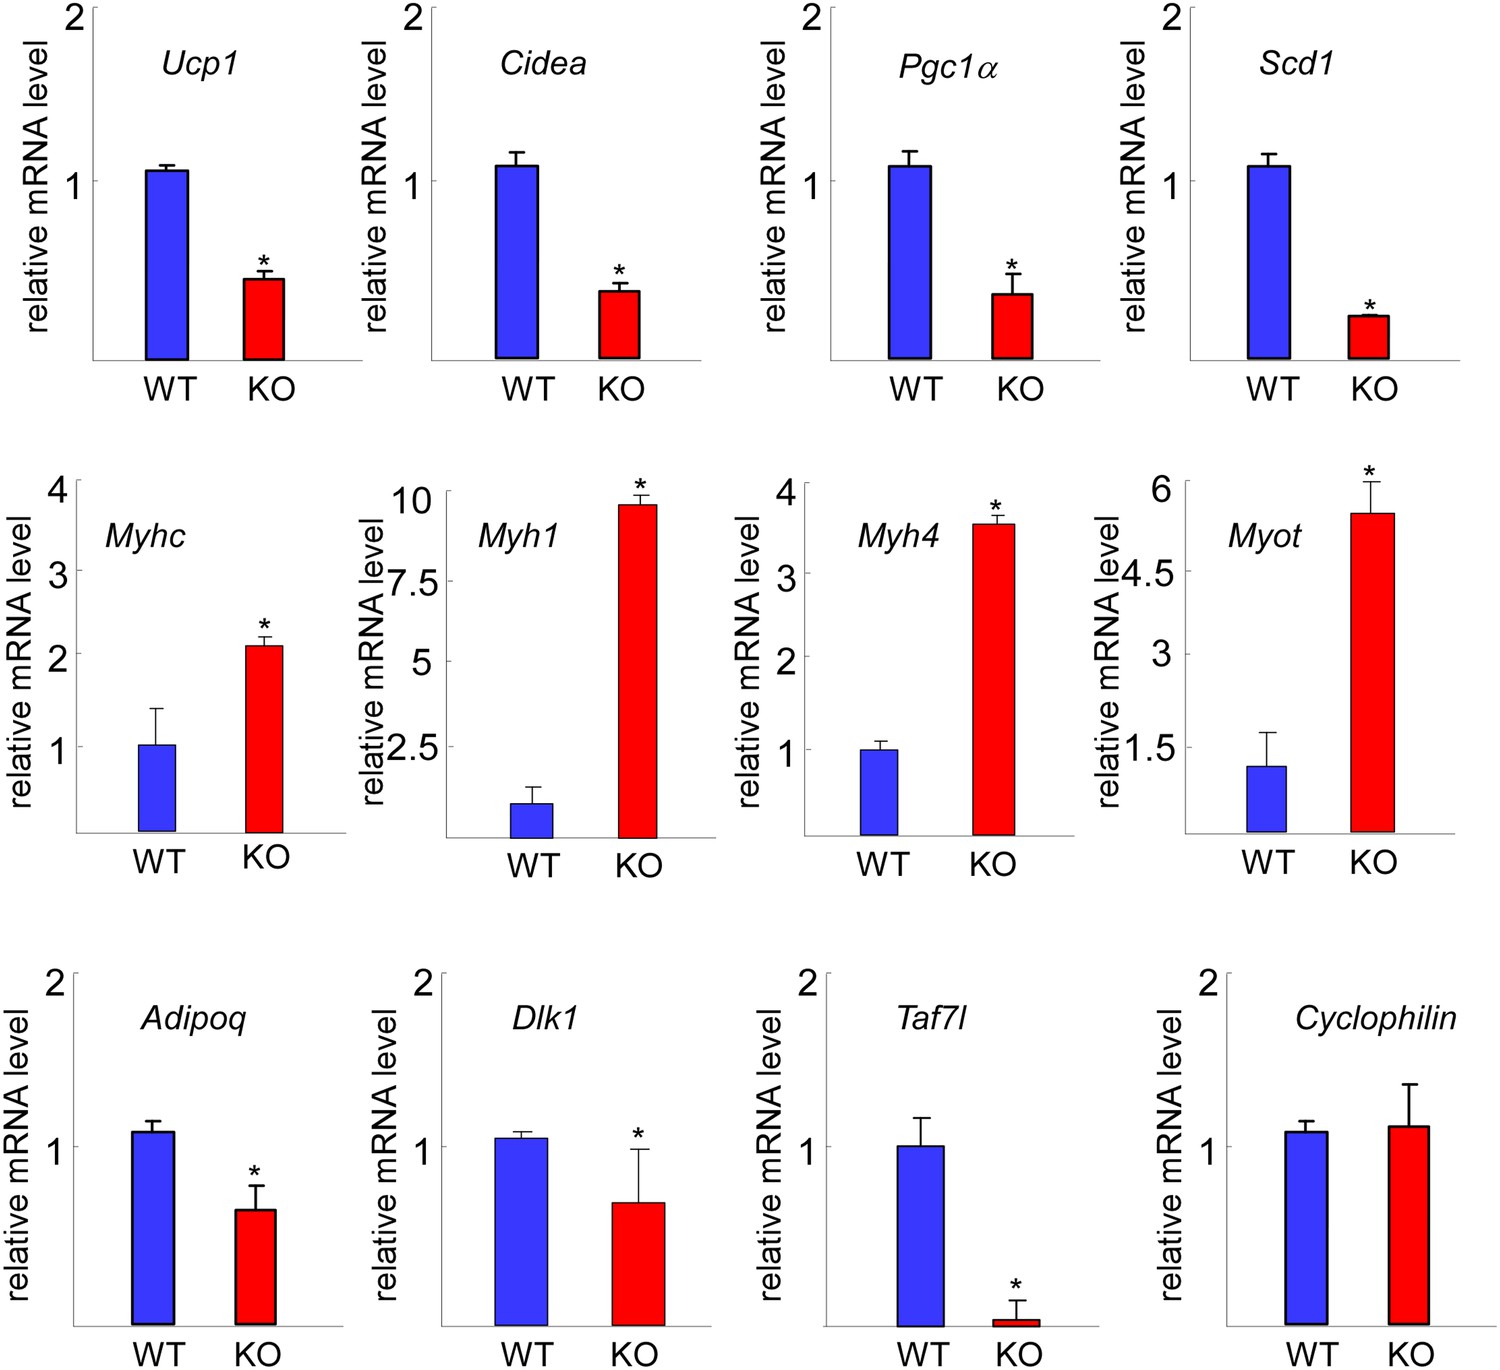
RT-qPCR comparison of gene expression in WT and Taf7l KO BAT.
Expression levels of BAT-specific genes Ucp1, Cidea, Pgc1a, and Scd1, muscle-specific genes Myhc, Myh1, Myh4, and Myot. Common fat marker gene Adipoq, adipocyte progenitor marker Dlk1, Taf7l and Cyclophilin were used as control. mRNA levels in WT BAT was assigned to 1, and mRNA levels of each gene in Taf7l KO BAT was compared to WT BAT. RT-qPCR was normalized to the levels of Cyclophilin (L). *p<0.05, data is mean and SEM is from triplicates.
Figure 2 with 2 supplements
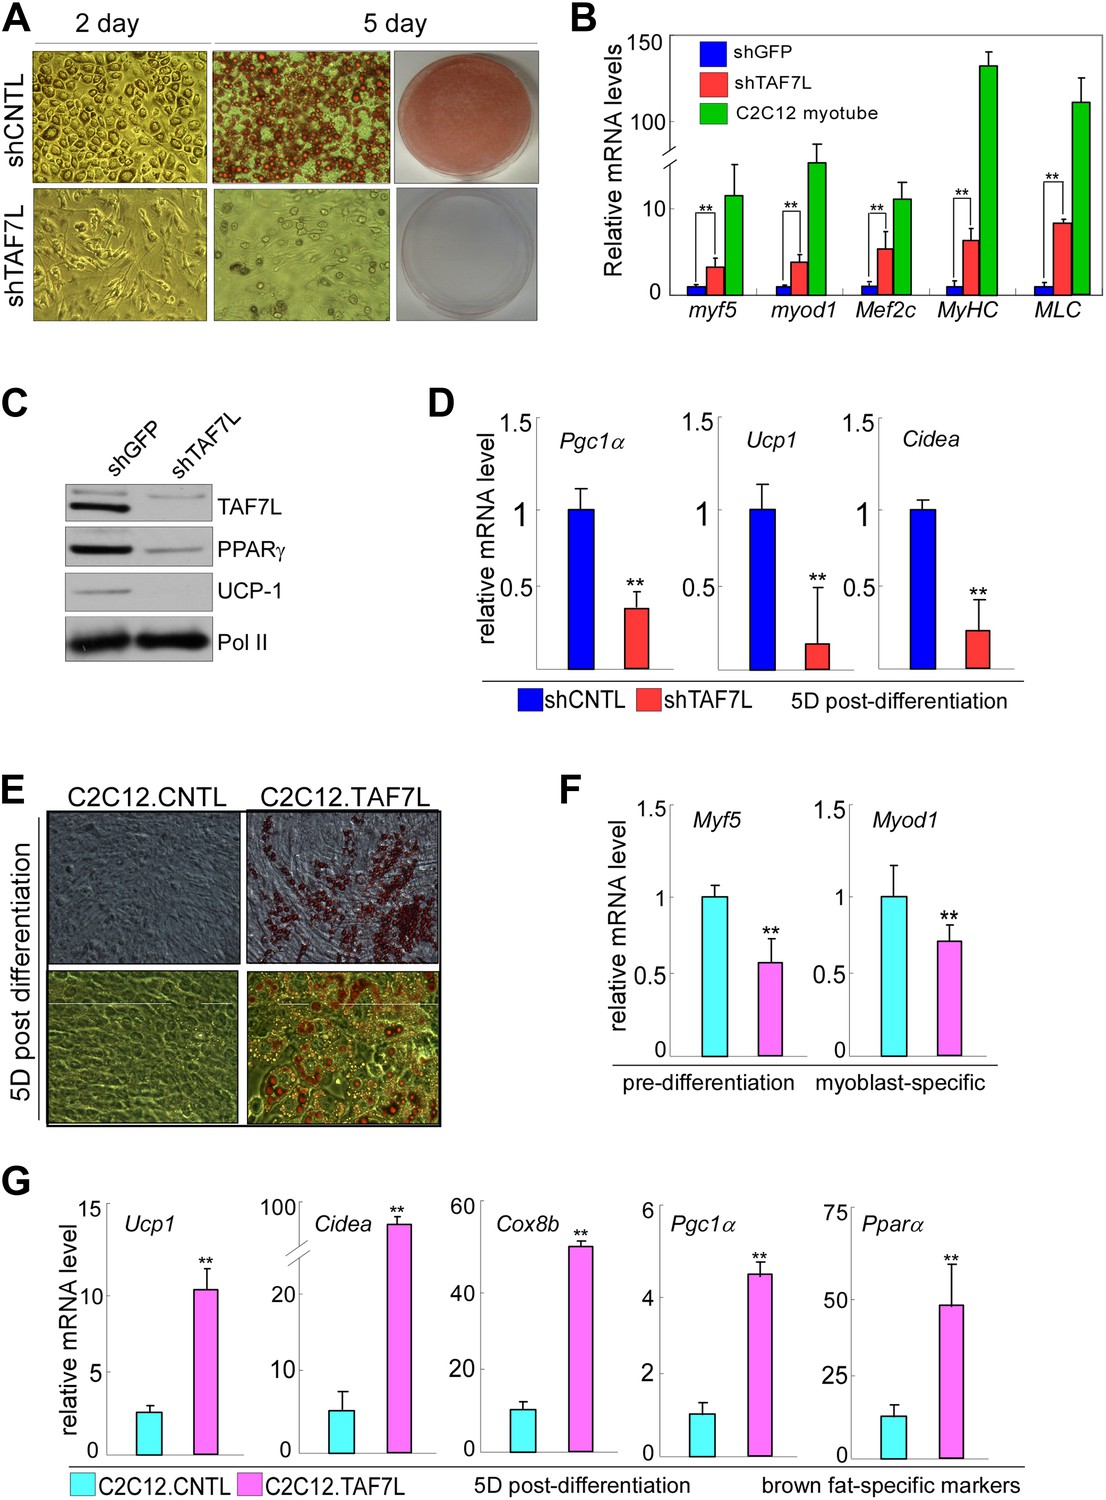
TAF7L bidirectionally regulates BAT/muscle lineages.
(A) 2 days (2D) and 5 days (5D) post-induced control (shCNTL) and TAF7L knockdown (shTAF7L) C3H10T1/2 cells stained with Oil Red O. (B) mRNA levels of myoblast genes Myf5, Myod1, Mef2c, Myhc, and Mlc in 2D post-induced shCNTL and shTAF7L C3H10T1/2 cells, compared to C2C12-induced myotubes. (C) Protein levels of TAF7L, PPARγ, and UCP1 in 5D post-induced shCNTL and shTAF7L cells; Pol II was used as loading control. (D) mRNA levels of brown fat genes (Pgc1a, Ucp1, and Cidea) in 5D post-induced control and shTAF7L cells. (E) 5D post-induced control (C2C12.CNTL) and TAF7L-expressing C2C12 (C2C12.TAF7L) cells were stained with Oil Red O. (F) mRNA levels of myoblast genes Myf5 and Myod1 in pre-induction cells. (G) mRNA levels of BAT-specific genes (Ucp1, Cidea, Cox8b, Pgc1a, and Pparα) 5D post-differentiation. *p<0.05, data is mean and SEM is from triplicates.
Figure 2—figure supplement 1
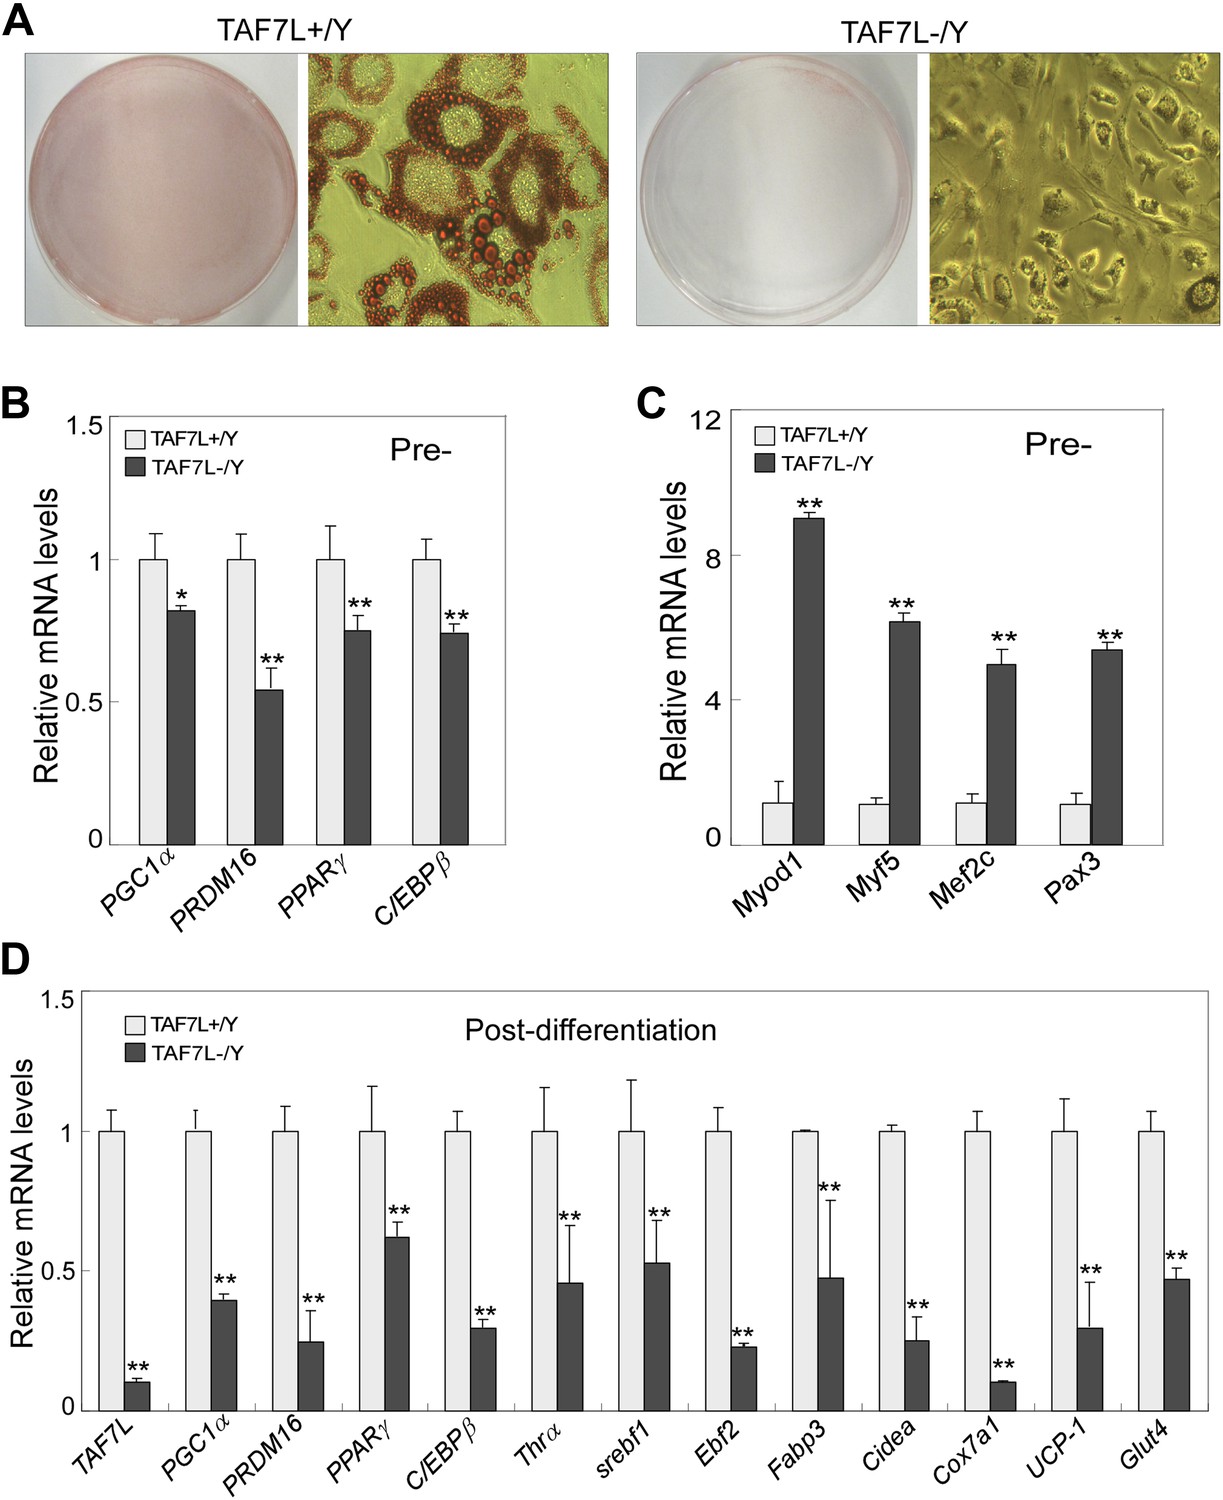
TAF7L is required for brown fat cell differentiation from primary brown adipocytes.
(A) Isolated brown adipose progenitor cells from WT (TAF7L+/Y) and Taf7l KO (TAF7L-/Y) mice was induced with brown adipocyte differentiation regime for 5 days and then stained with Oil Red O. (B and C) mRNA levels of fat-selective genes (B) and muscle-selective genes (C) pre-differentiation. *p<0.05, data is mean and SEM is from triplicates. (D) Expression levels of Taf7l and brown adipocyte marker genes on cells from A, the expression levels of genes in 5D post-induced Taf7l knockout cells were compared to WT cells, whose levels were assigned to 1.
Figure 2—figure supplement 2
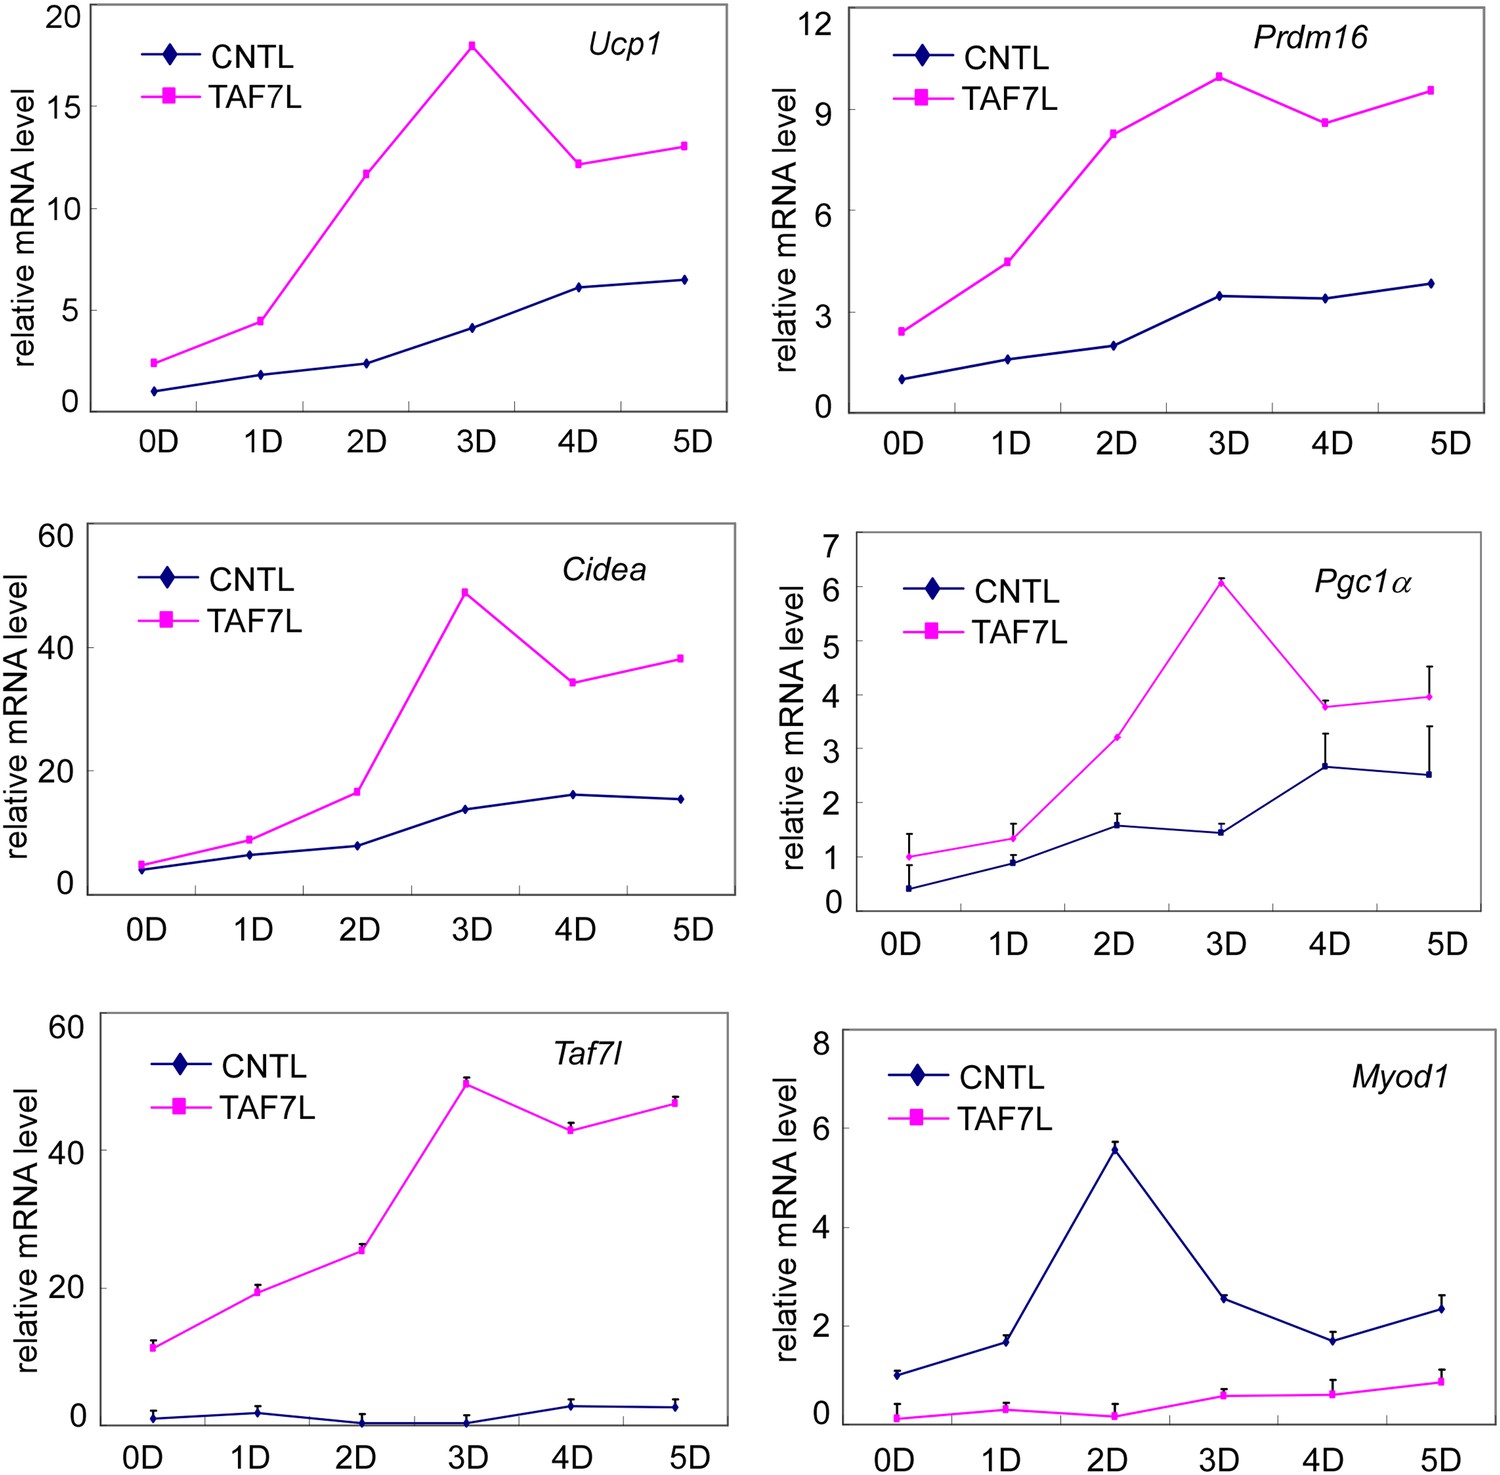
Gene expression analysis of control (CNTL) and TAF7L-expressing (TAF7L) C2C12 cells from 0 (0D) to 5 days (5D) post BAT-induction.
mRNA levels of Ucp1, Prdm16, Cidea, Pgc1a, Taf7l, and Myod1 are plotted as relative value to 0D CNTL cells, data is mean and SEM is from triplicates.
Figure 3 with 1 supplement
TAF7L within a Fat-TFIID associates with PPARγ and facilitates DNA looping formation.
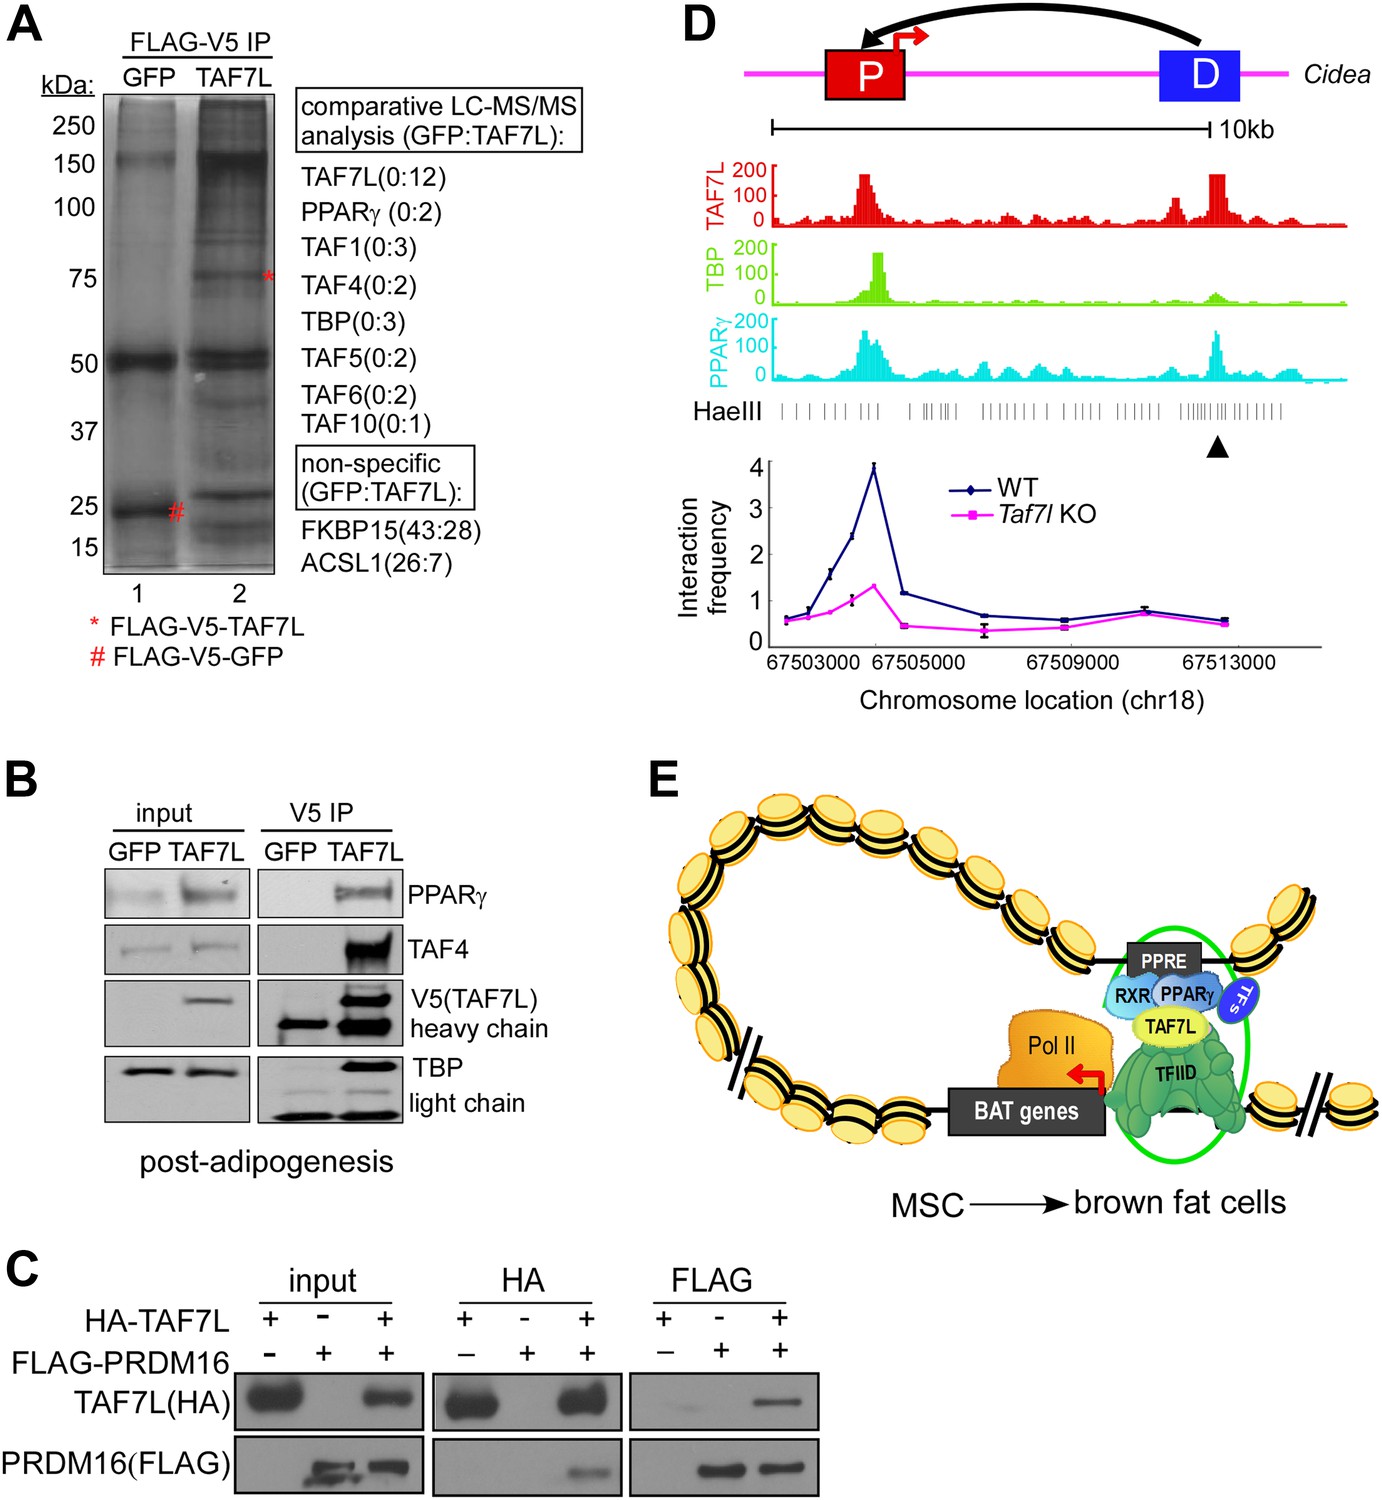
(A) Silver staining shows co-immunoprecipitated proteins in FLAG-V5-GFP-expressing (GFP, lane 1) and FLAG-V5-TAF7L-expressing (TAF7L, lane 2) C3H10T1/2 differentiated fat cells. Comparative LC-MS/MS analysis identified peptides matching with TFIID subunits (TAF1, TAF4, TBP, TAF5, TAF6, and TAF10) and PPARγ in TAF7L-expressing but not in GFP-expressing cells. FKBP15 and ACSL1 are representative non-specific associated proteins. (B) Western blot analyzing input and immunoprecipitated protein levels of PPARγ, TAF4, TAF7L, and TBP in samples from A. (C) HA-tagged TAF7L and FLAG-tagged PRDM16 were overexpressed in 293T cells, immunoprecipitations were performed on both FLAG and HA antibodies and followed by Western blotting with FLAG and HA antibodies. (D) Upper panel, schematic picture shown the distance between distal enhancer (D) and core promoter (P) of Cidea gene; middle panel, read accumulation of TAF7L, TBP, and PPARγ on Cidea locus in differentiated fat cells from ChIP-seq analysis; bottom panel, 3C experiments assess long-range DNA interactions between the TAF7L/PPARγ binding distal enhancer (D) and core promoter (P) sites of Cidea in WT and Taf7l KO BAT. ▲, anchor point. Also see Figure 3—figure supplement 1C. (E) Model shows TAF7L-mediating regulatory DNA looping to specify BAT differentiation from mesenchymal stem cells (MSC).
Figure 3—figure supplement 1
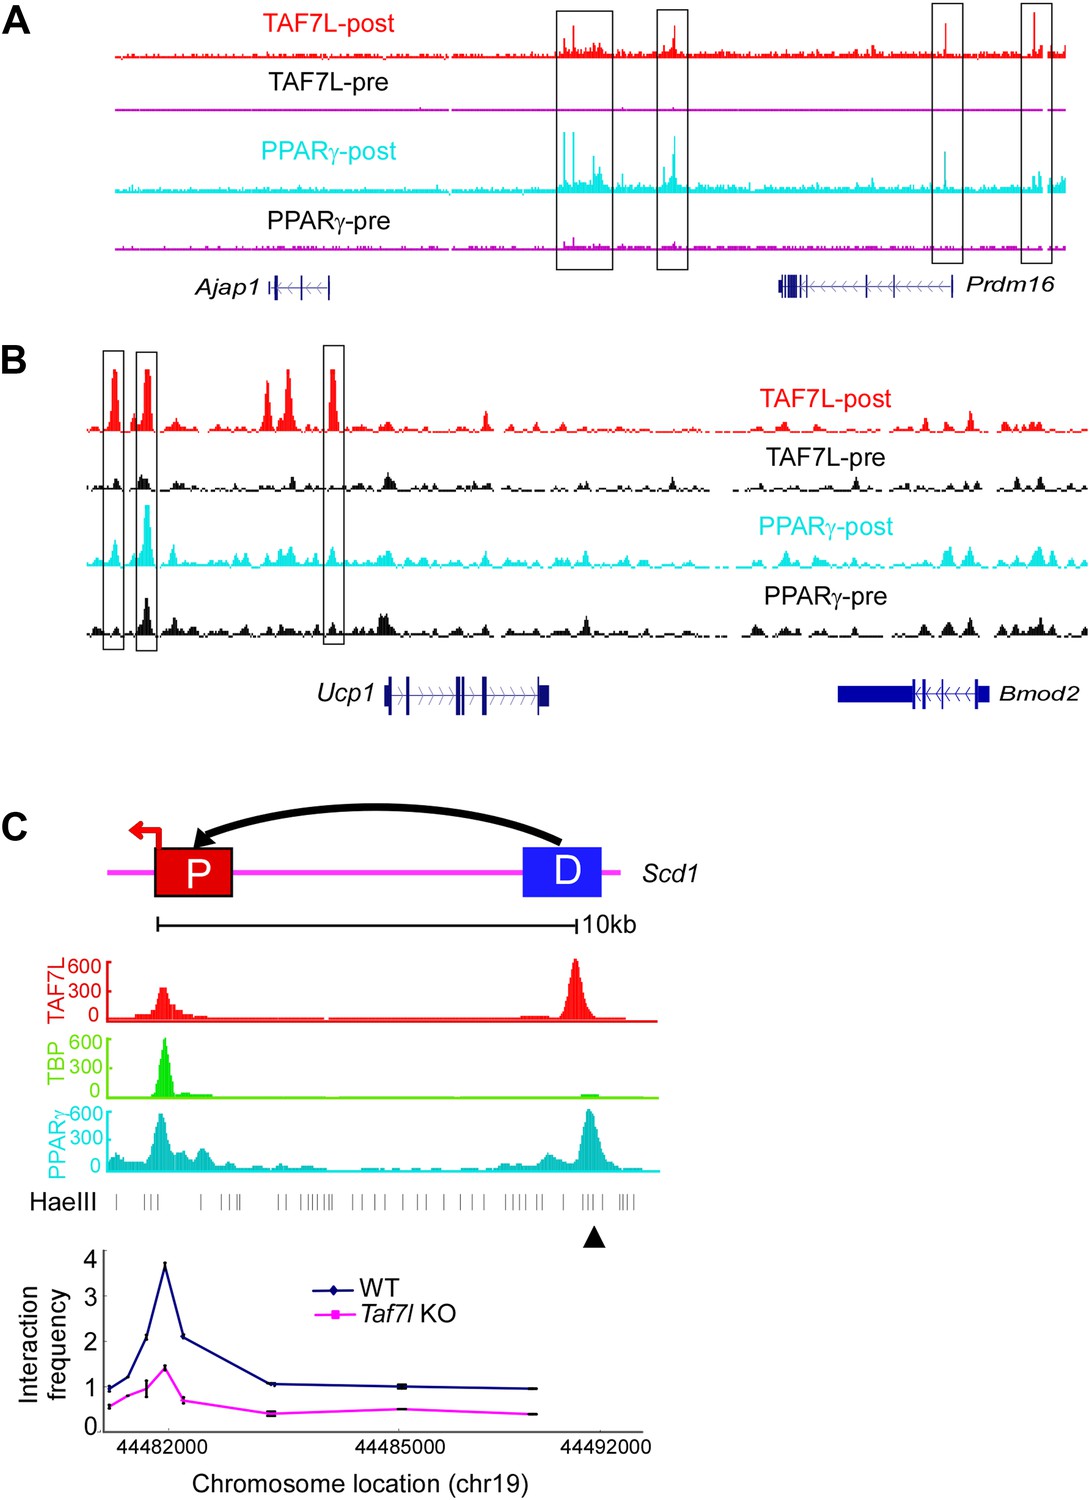
TAF7L colocalizes with PPARγ on core promoters and enhancers of BAT-specific genes.
ChIP-seq read accumulation for TAF7L and PPARγ in both pre- and post-differentiated C3H10T1/2 cells on Ajap1/Prdm16 locus (A) and Ucp1/Bmod2 locus (B). (C) 3C experiments assess long-range interactions between the TAF7L/PPARγ binding distal enhancer (D) and core promoter (P) sites of Scd1 in WT and Taf7l KO BAT. ▲, anchor point.
Additional files
-
Supplementary file 1
Primer sequences for RT-qPCR experiments (upper panel) and 3C experiments (lower panels).
- https://doi.org/10.7554/eLife.02811.011
Download links
A two-part list of links to download the article, or parts of the article, in various formats.
Downloads (link to download the article as PDF)
Open citations (links to open the citations from this article in various online reference manager services)
Cite this article (links to download the citations from this article in formats compatible with various reference manager tools)
TAF7L modulates brown adipose tissue formation
eLife 3:e02811.
https://doi.org/10.7554/eLife.02811


