H3K27 modifications define segmental regulatory domains in the Drosophila bithorax complex
- Massachusetts General Hospital, United States
- Harvard Medical School, United States
Figures
Figure 1 with 2 supplements

Marking single parasegments.
(A) Drivers for the Gal4 activator and the Gal80 repressor, each with a different anterior limit, are combined genetically. Gal4 activity is thus limited to a single parasegment, and is used to activate transcription of a fluorescent nuclear envelope protein. (B) Expression patterns used for isolation of parasegment nuclei are shown, visualized with antibody to the FLAG epitope on the INTACT fusion protein. Each panel shows embryos at about 6, 8, 10, 12, 14, and 16 hr after fertilization, with the stained cells marking the indicated parasegments. Embryos between 5 hr and 13 hr old (or between 4 hr and 10 hr for PS6) were harvested for analysis.
Figure 1—figure supplement 1
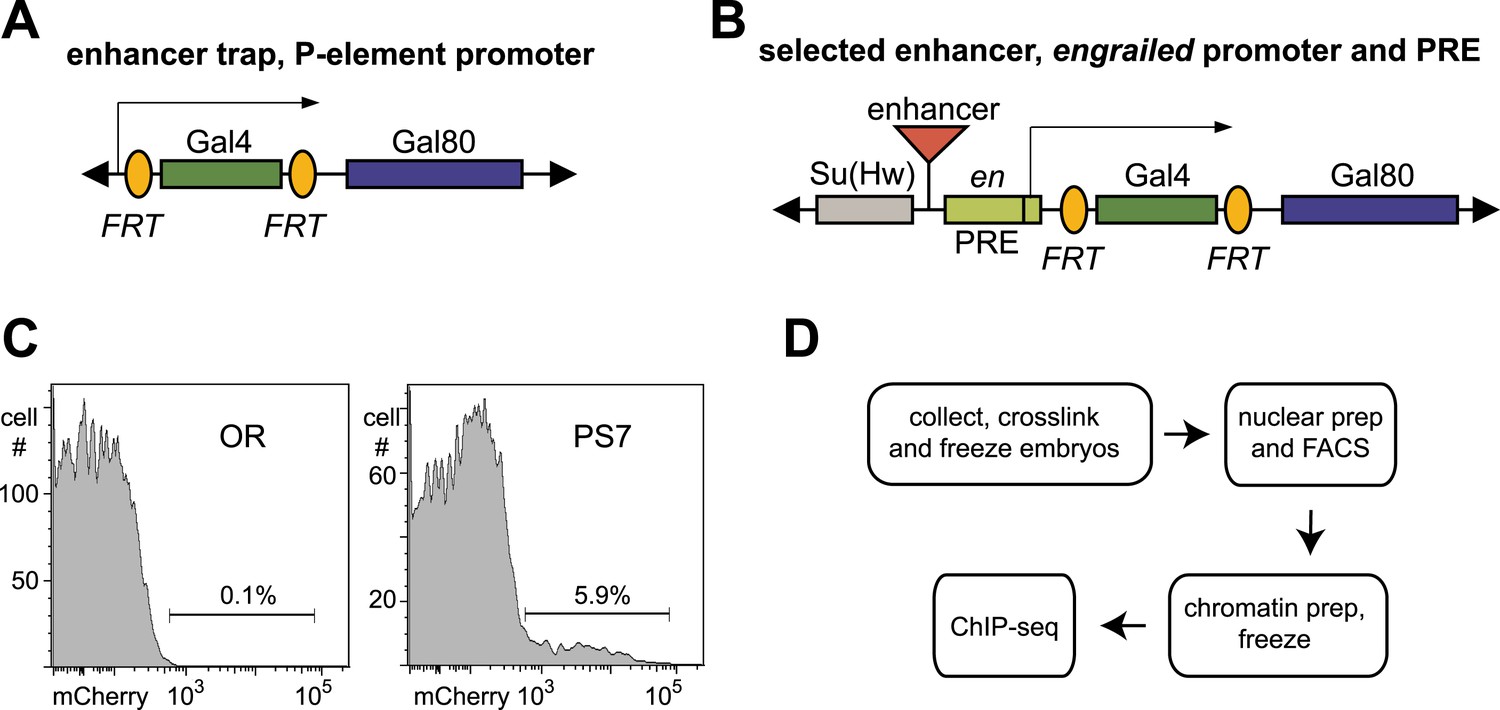
Tools for parasegment-specific ChIP-seq.
(A) A P element was constructed that initially expresses Gal4 from the P promoter, and transgenes were moved into the homeotic gene complexes by P element swapping. Recombination between the FRT sites flanking Gal4 convert the transgene into one expressing Gal80. (B) A second P element expressed Gal4 or Gal80, driven by enhancers from the BX-C. The enhancers were positioned upstream of a promoter and a PRE from the engrailed locus. The PRE helps to maintain the restricted expression by the enhancer in older embryos. A cluster of binding sites for the suppressor of Hairy-wing protein flanks the enhancer, to block potential position effects at random chromosomal locations. (C) Nuclei were sorted using Hoechst 33,342 (to select only single nuclei) and mCherry fluorescence. Nuclei from wild type (Oregon R, OR) embryos were used to set the fluorescence threshold. (D) The flow chart from embryos to sequencing libraries is diagramed; the procedure could be paused at either freezing step.
Figure 1—figure supplement 2
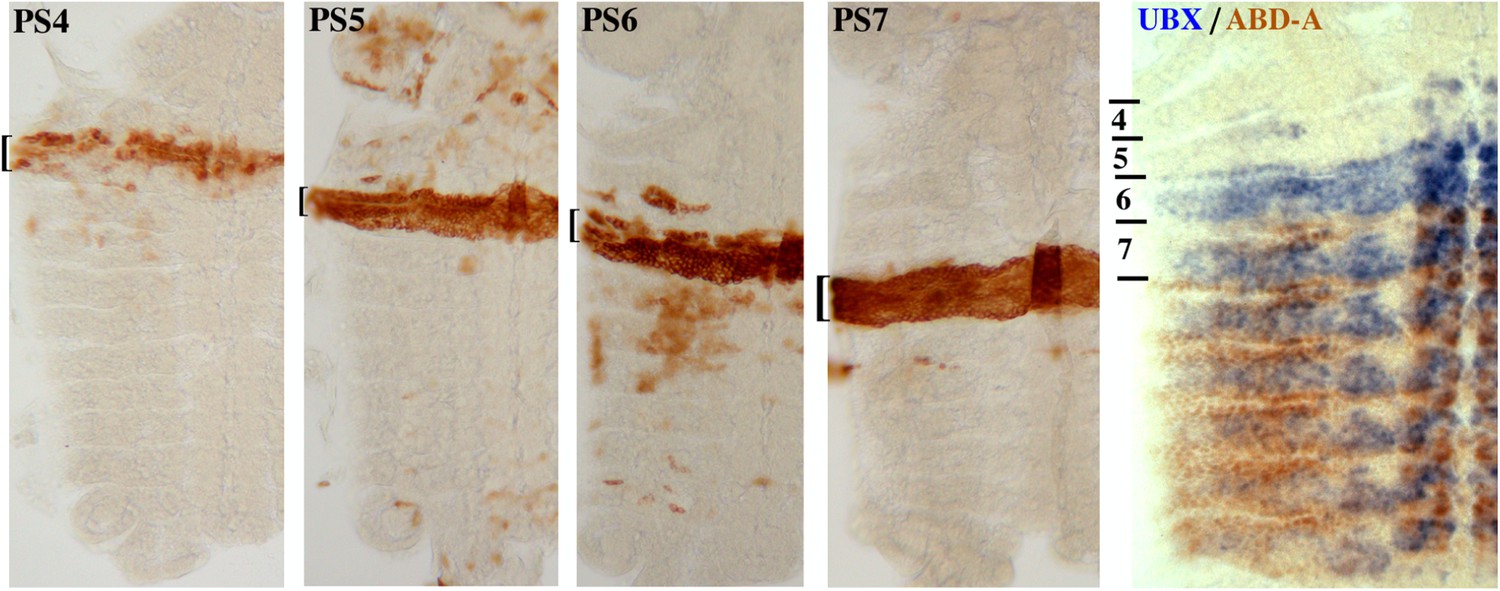
Close-up of parasegment-specific expression patterns.
Embryos expressing the INTACT marker in parasegments 4–7 were obtained as in Figure 1B. All are at ∼10 hr of development, prior to dorsal closure; they were dissected along the dorsal midline, and flattened to display the epidermis in one focal plane. The last panel shows an embryo stained for UBX (in blue) and ABD-A (in brown) (Karch et al., 1990), to illustrate the expression patterns of these two proteins in parasegments 4–7.
Figure 2 with 2 supplements

H3K27me3, CTCF, and CP190 profiles.
(A) ChIP-seq profiles across 27 Mb of chromosome 3R are virtually identical, except at the BX-C, in the middle of the chromosome arm. (B–F) H3K27me3 profiles across 380 kb encompassing the BX-C. (G–H) CTCF binding sites. (I and J) CP190 binding sites. Panels B, G, and I were prepared from unsorted nuclei; parasegment-specific nuclei were used for the other panels, as indicated. Transcription units of coding genes are shown below the profiles. The Drosophila reference sequence includes a 6.1 kb Diver retroposon insertion at the indicated position; it was not present in the strains used for this analysis. At the bottom are shown the three regulatory domains defined by this analysis.
Figure 2—figure supplement 1
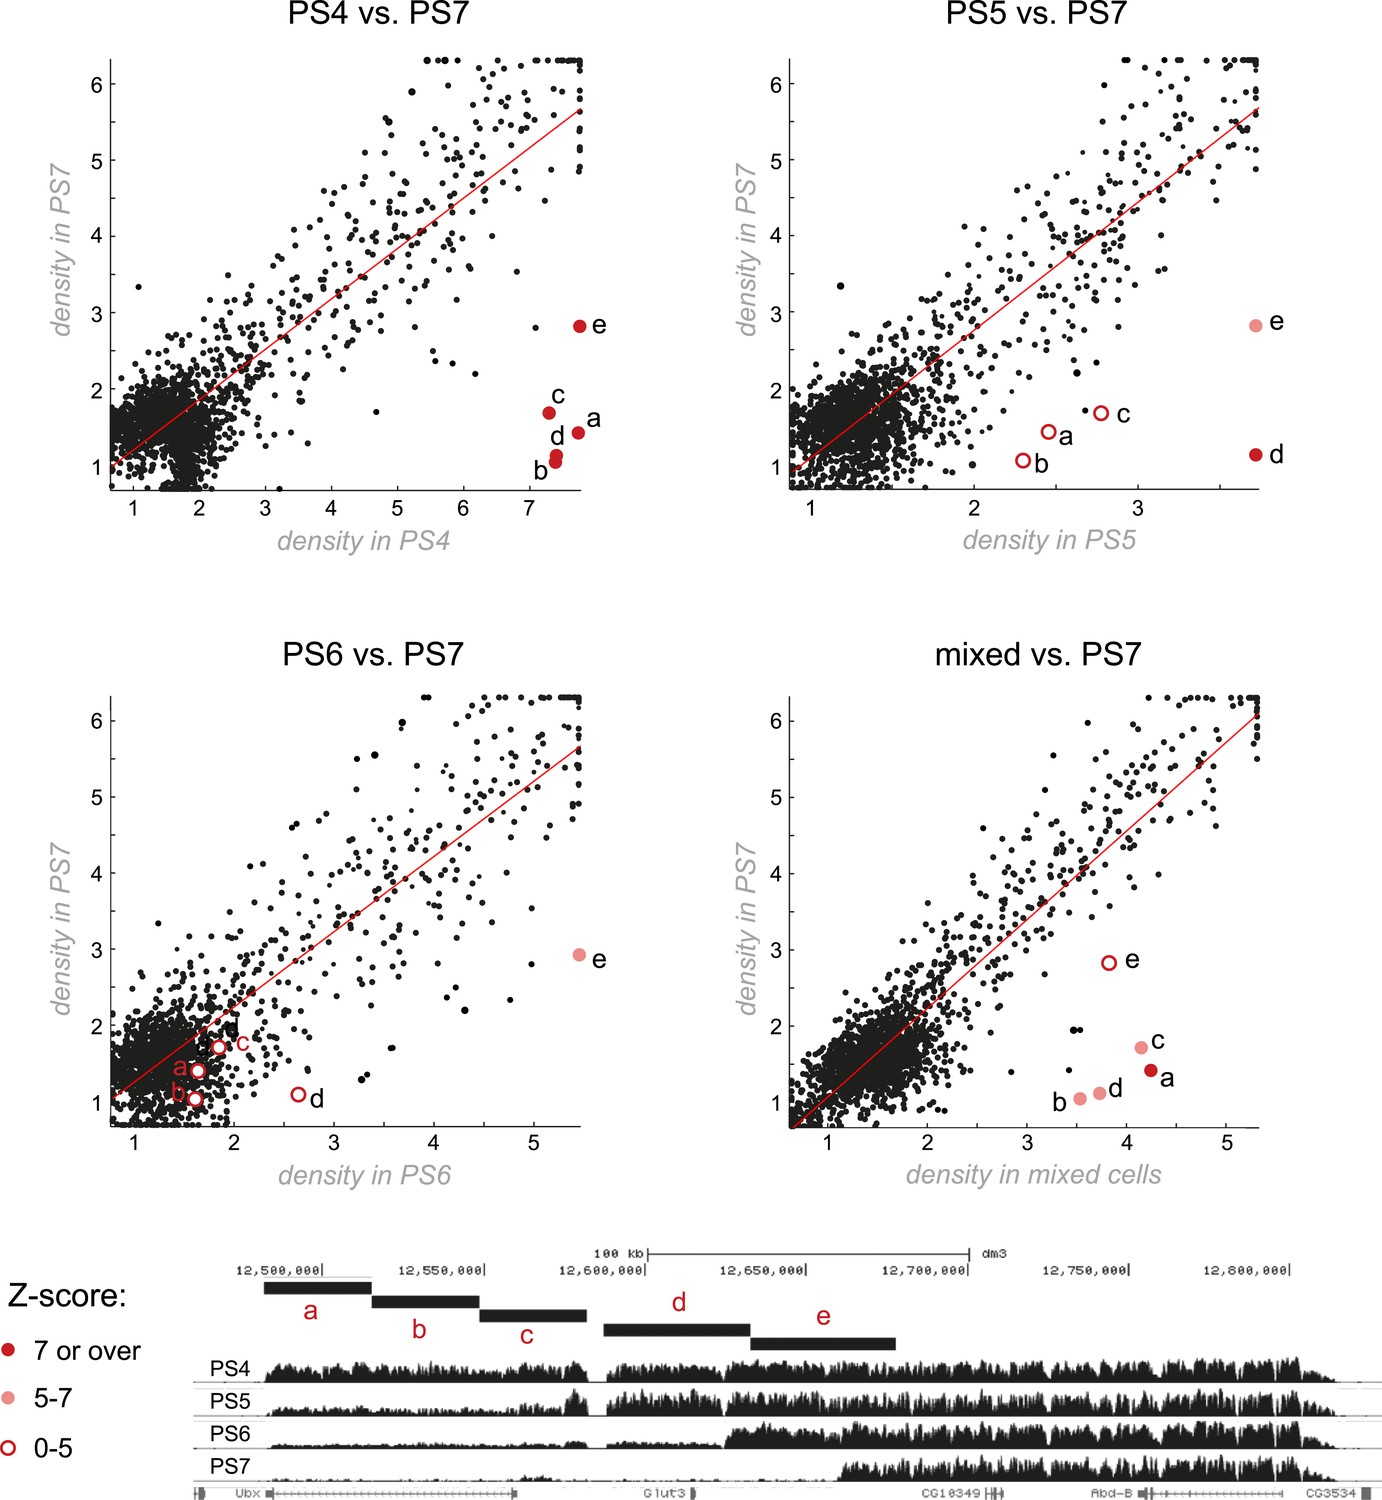
Genome-wide comparisons of H3K27me3 patterns.
The most striking differences in H3K27me3 enrichment across different parasegments occur at the BX-C. Each plot compares the density of H3K27me3 between two parasegments over all H3K27me3 peaks (see supplementary methods for additional details). A linear line of fit was drawn. H3K27me3 density across the entire genome was largely unchanging between parasegments, with the exception of a few points corresponding to the BX-C that are markedly far off from the line of fit. Within each plot, the comparison of five BX-C segments (labeled a–e) are indicated with pink or red circles, the color of which corresponds to the Z-score (number of observed standard deviations from the line of fit).
Figure 2—figure supplement 2
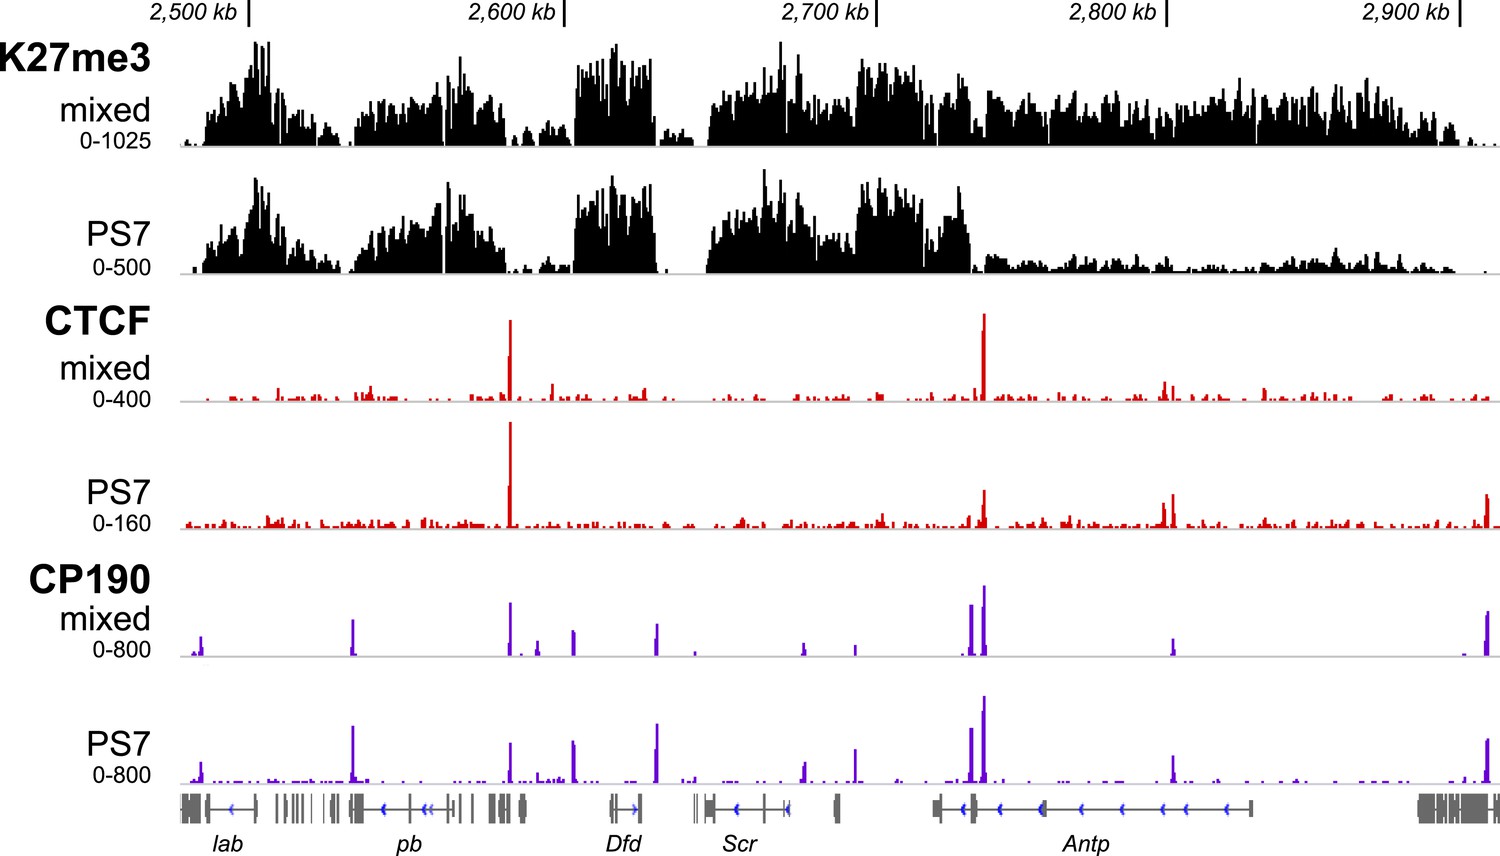
H3K27me3, CTCF, and CP190 profiles in PS7 for the Antennapedia complex, illustrated as in Figure 2.
The H3K27me3 profiles in parasegments 4 through 7 are very similar. ANTP is expressed at high levels in PS4 and PS5 in wild type embryos, and in the absence of the BX-C, parasegments 4–12 all show similar expression patterns (Carroll et al., 1986). By this criterion, Antp appears to be free of Pc-G repression in PS4–12, which is consistent with the lack of H3K27 methylation over its transcription unit in PS7, as shown. CTCF and CP190 profiles look identical between mixed and PS7 nuclei, as they are in the BX-C. CP190 marks several potential domain boundaries in the Antennapedia complex that lack apparent CTCF binding.
Figure 3
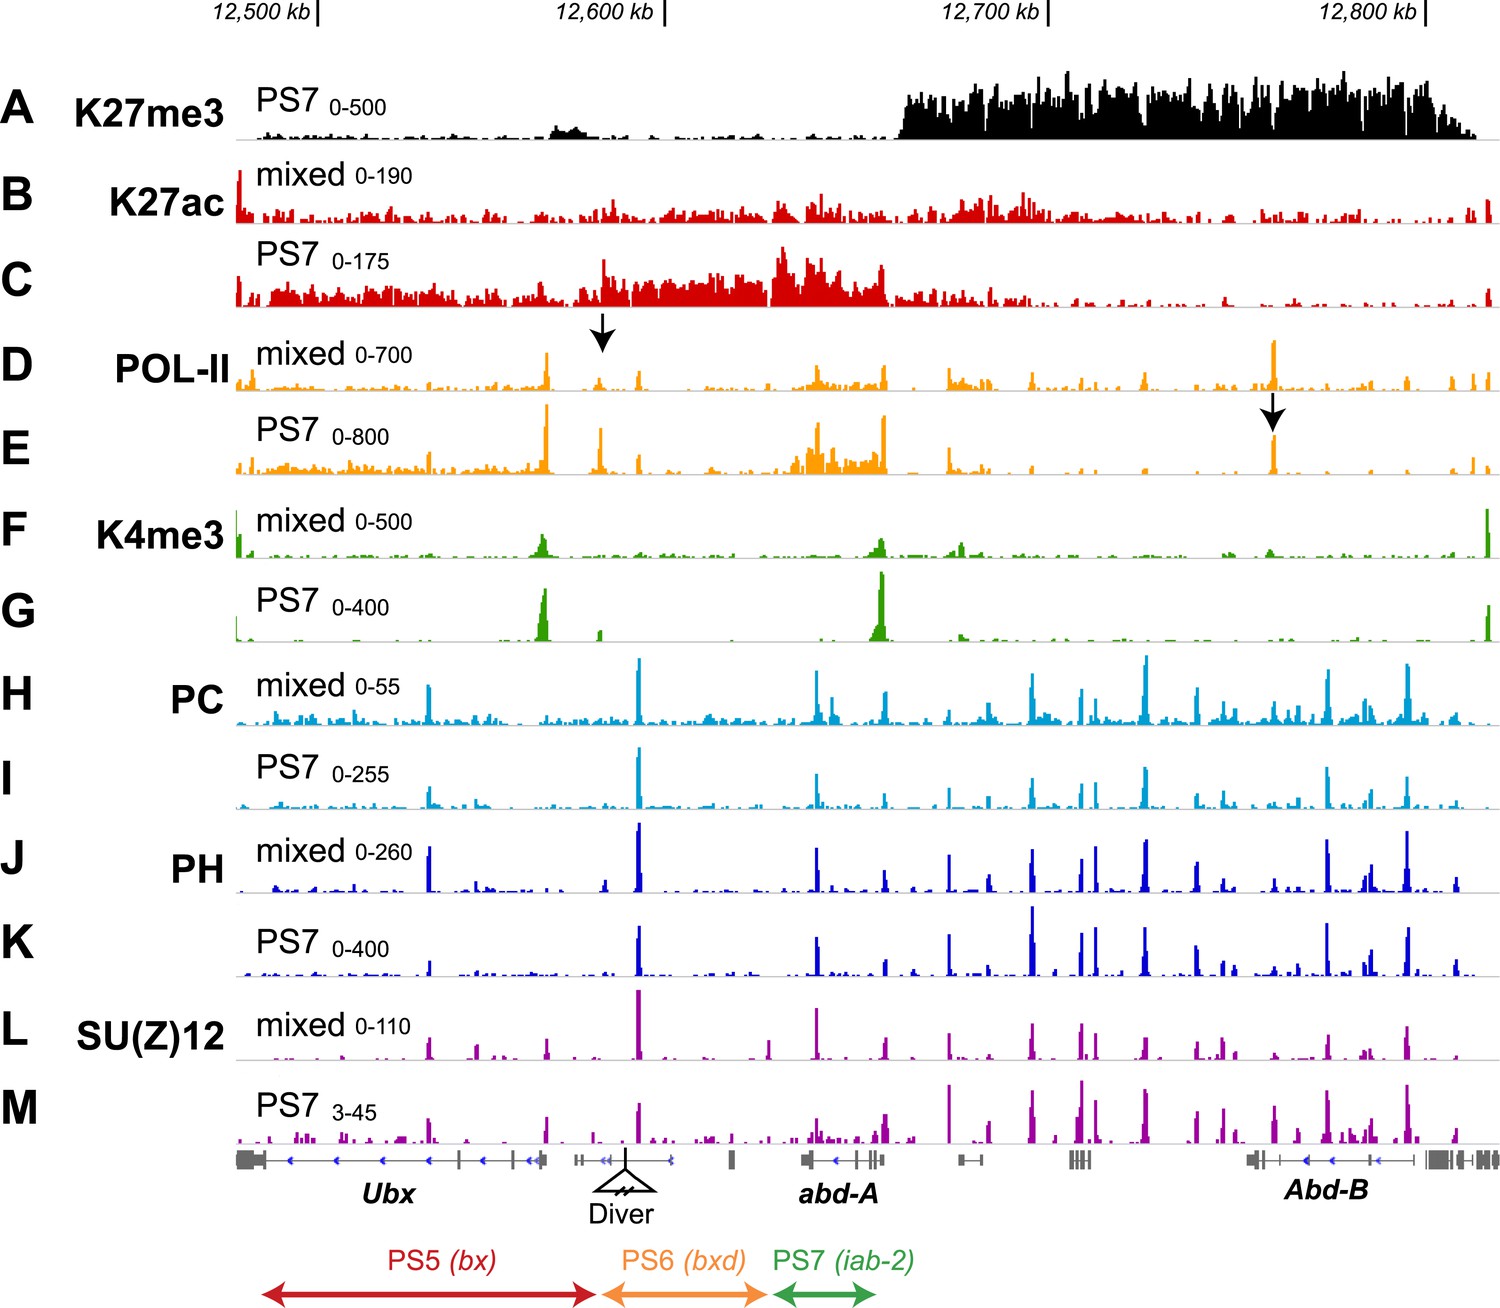
Additional features of the BX-C in PS7.
(A) The H3K27me3 distribution, repeated from Figure 2F, marks the border between active and repressed domains. (B and C) H3K27ac profiles are shown for mixed and PS7 nuclei; the acetylation mark in PS7 is largely restricted to the active domains. (D and E) Pol-II profiles show peaks at the promoters of Ubx, abd-A, and Abd-B both in whole embryo and in PS7 nuclei. In PS7, polymerase is distributed across the transcription units of Ubx and abd-A, but not Abd-B. The arrow in D marks the PS5/PS6 border; the arrow in E marks the major Abd-B promoter. (F and G) H3K4me3 profiles show prominent peaks over the Ubx and abd-A promoters, both of which drive strong transcription in PS7. (H and I) POLYCOMB profiles show sharp peaks over all known Polycomb Response Elements. In PS7, there is a reduction of the PC peak at the ‘bx PRE’ in the active PS5 domain. There is also a PC peak at the abd-A promoter, which is somewhat reduced in PS7, where Abd-A is transcribed. (J and K) POLYHOMEOTIC protein shows peaks at known PREs and the abd-A promoter in both the active and repressed domains. As with PC, the PH peak at the bx PRE is reduced in PS7. (L and M) SU(Z)12 profiles also mark PREs, but in PS7, the PRE peaks are reduced in all three active domains. The ranges for the vertical axes are indicated above the left edge of each trace.
Download links
A two-part list of links to download the article, or parts of the article, in various formats.
Downloads (link to download the article as PDF)
Open citations (links to open the citations from this article in various online reference manager services)
Cite this article (links to download the citations from this article in formats compatible with various reference manager tools)
H3K27 modifications define segmental regulatory domains in the Drosophila bithorax complex
eLife 3:e02833.
https://doi.org/10.7554/eLife.02833


