Allosteric inhibition of a stem cell RNA-binding protein by an intermediary metabolite
- University of Massachusetts Medical School, United States
Figures
Figure 1 with 2 supplements
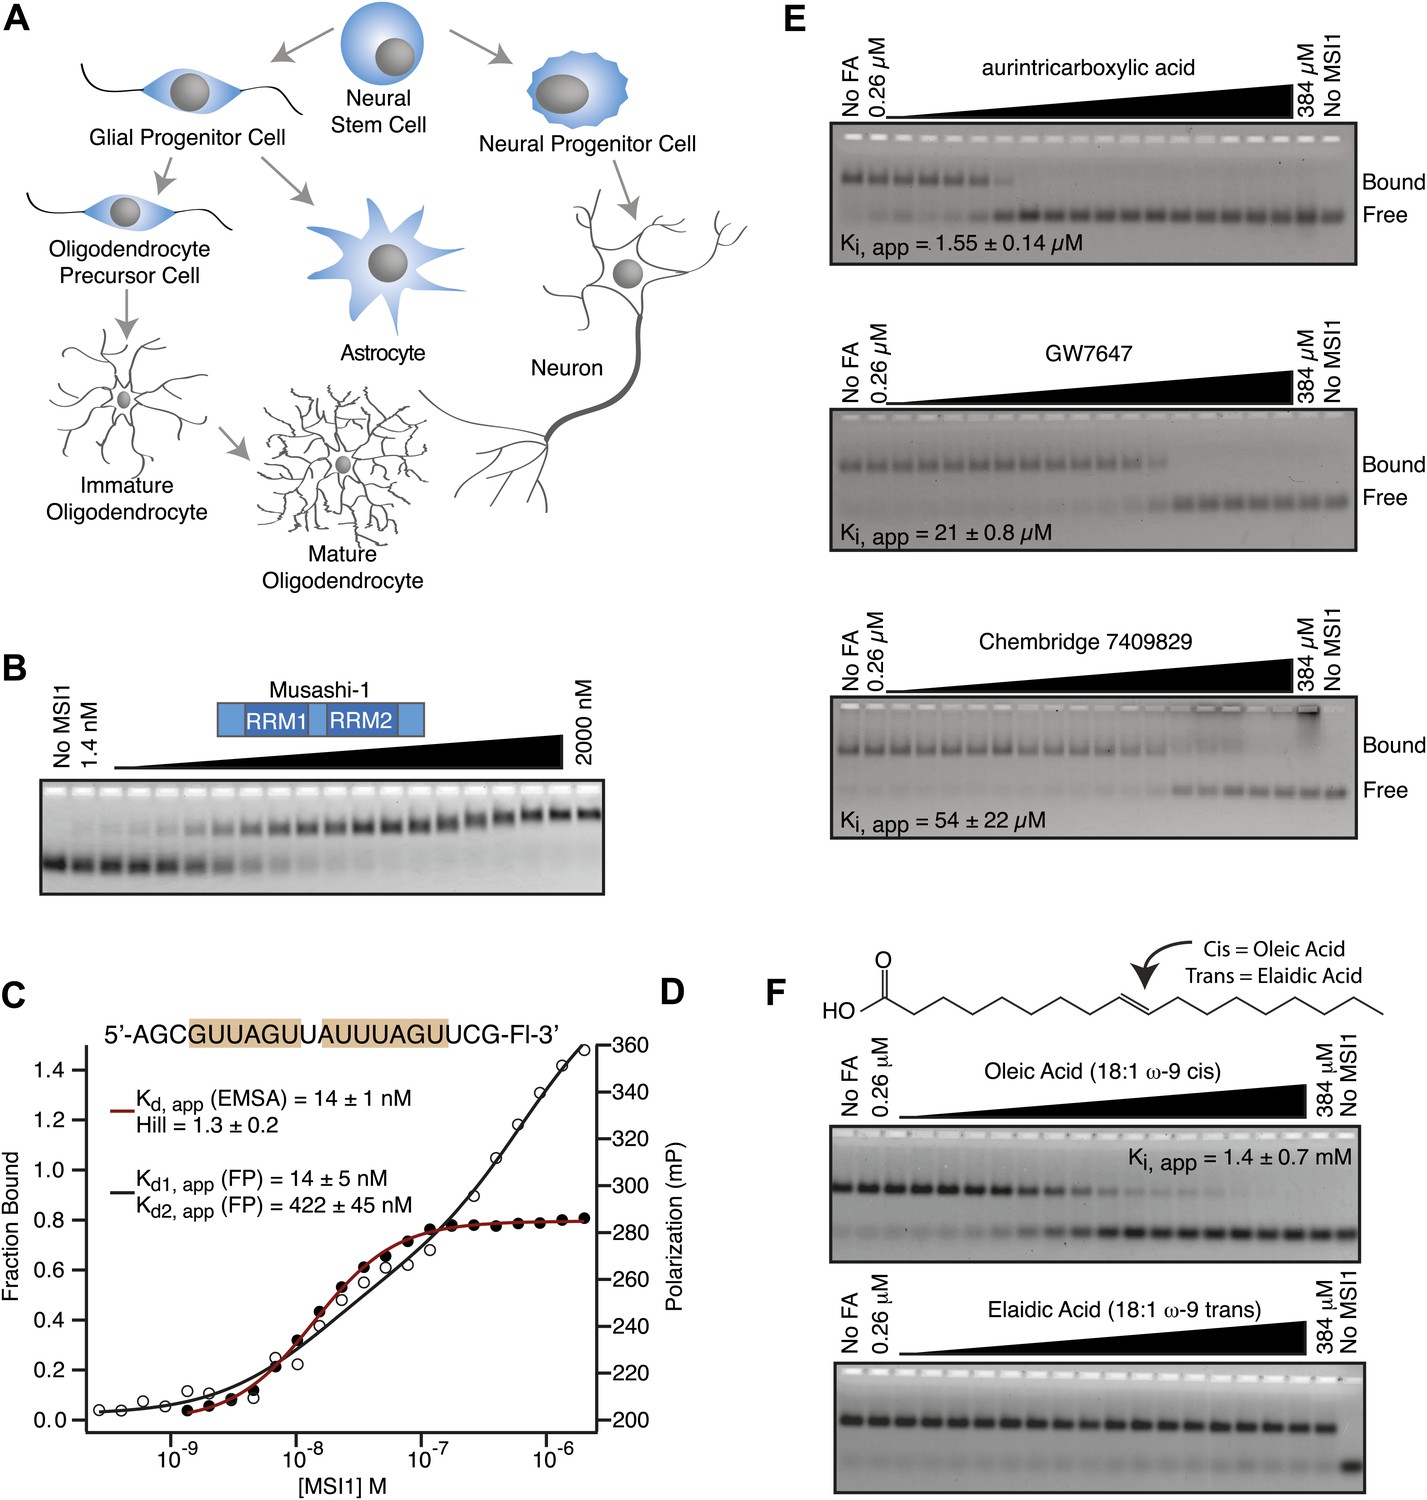
MSI1 is inhibited by monounsaturated fatty acids.
(A) Pattern of MSI1 (blue) in the CNS. (B–D) EMSA and FP of MSI1 binding to RNA aptamer CCCR005 (AGCGUUAGUUAUUUAGUUCG). EMSA data (red line) were fit to the Hill equation where all shifted species were fit as an aggregate. FP data (black line) were fit to a two-site binding model. (E and F) Assay scheme for the inhibitor screen (E) and F–EMSA dose responses with hits identified from the small molecule screens (E) and oleic and elaidic acid (F). Each gel is one representative experiment of at least three independent experiments. No compound and no protein lanes identify the position of bound and free RNA migration, respectively.
Figure 1—figure supplement 1
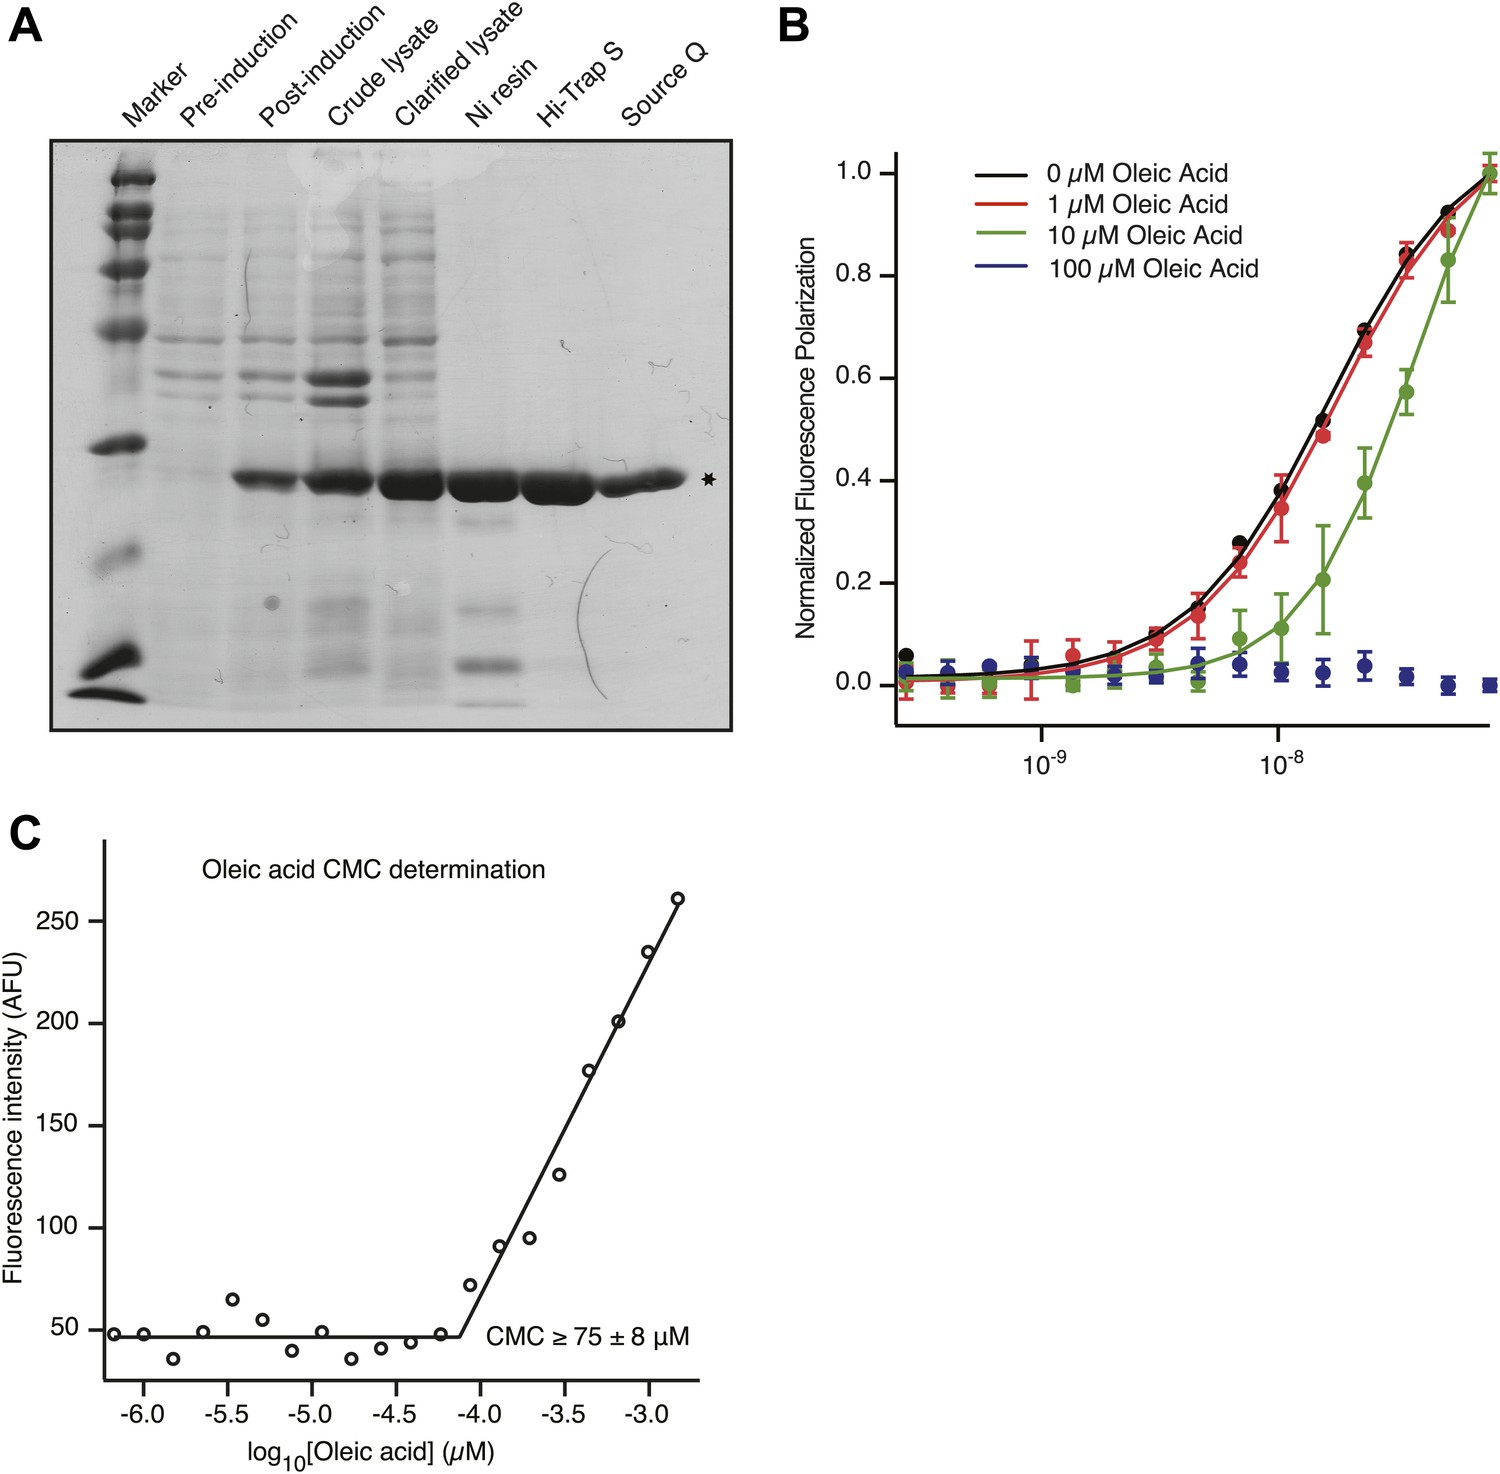
(A) Coomassie-stained SDS page gel shows that recombinant MSI1 is purified to greater than 95% over a 3-column purification protocol. (B) MSI1 displays decreased affinity for an RNA aptamer upon addition of oleic acid. Apparent dissociation constants were determined by plotting fluorescence polarization as a function of MSI1 protein concentration and fitting the data to the Hill equation. 0 µM oleic acid: Kd, app = 16.3 ± 1.2 nM; 1 µM oleic acid: Kd, app = 18.1 ± 2.6 nM; 10 µM oleic acid: Kd, app = 40.5 ± 3.5 nM; 0 µM oleic acid: Kd, app > 2000 nM. (C) CMC determination by N-phenyl-1-naphthylamine (NPN) fluorescence in equilibration buffer (pH 8.0). Segmented linear regression was used to determine the breakpoint between baseline and micelle-associated NPN fluorescence. The value of the CMC presented is the average and standard deviation from three experiments.
Figure 1—figure supplement 2
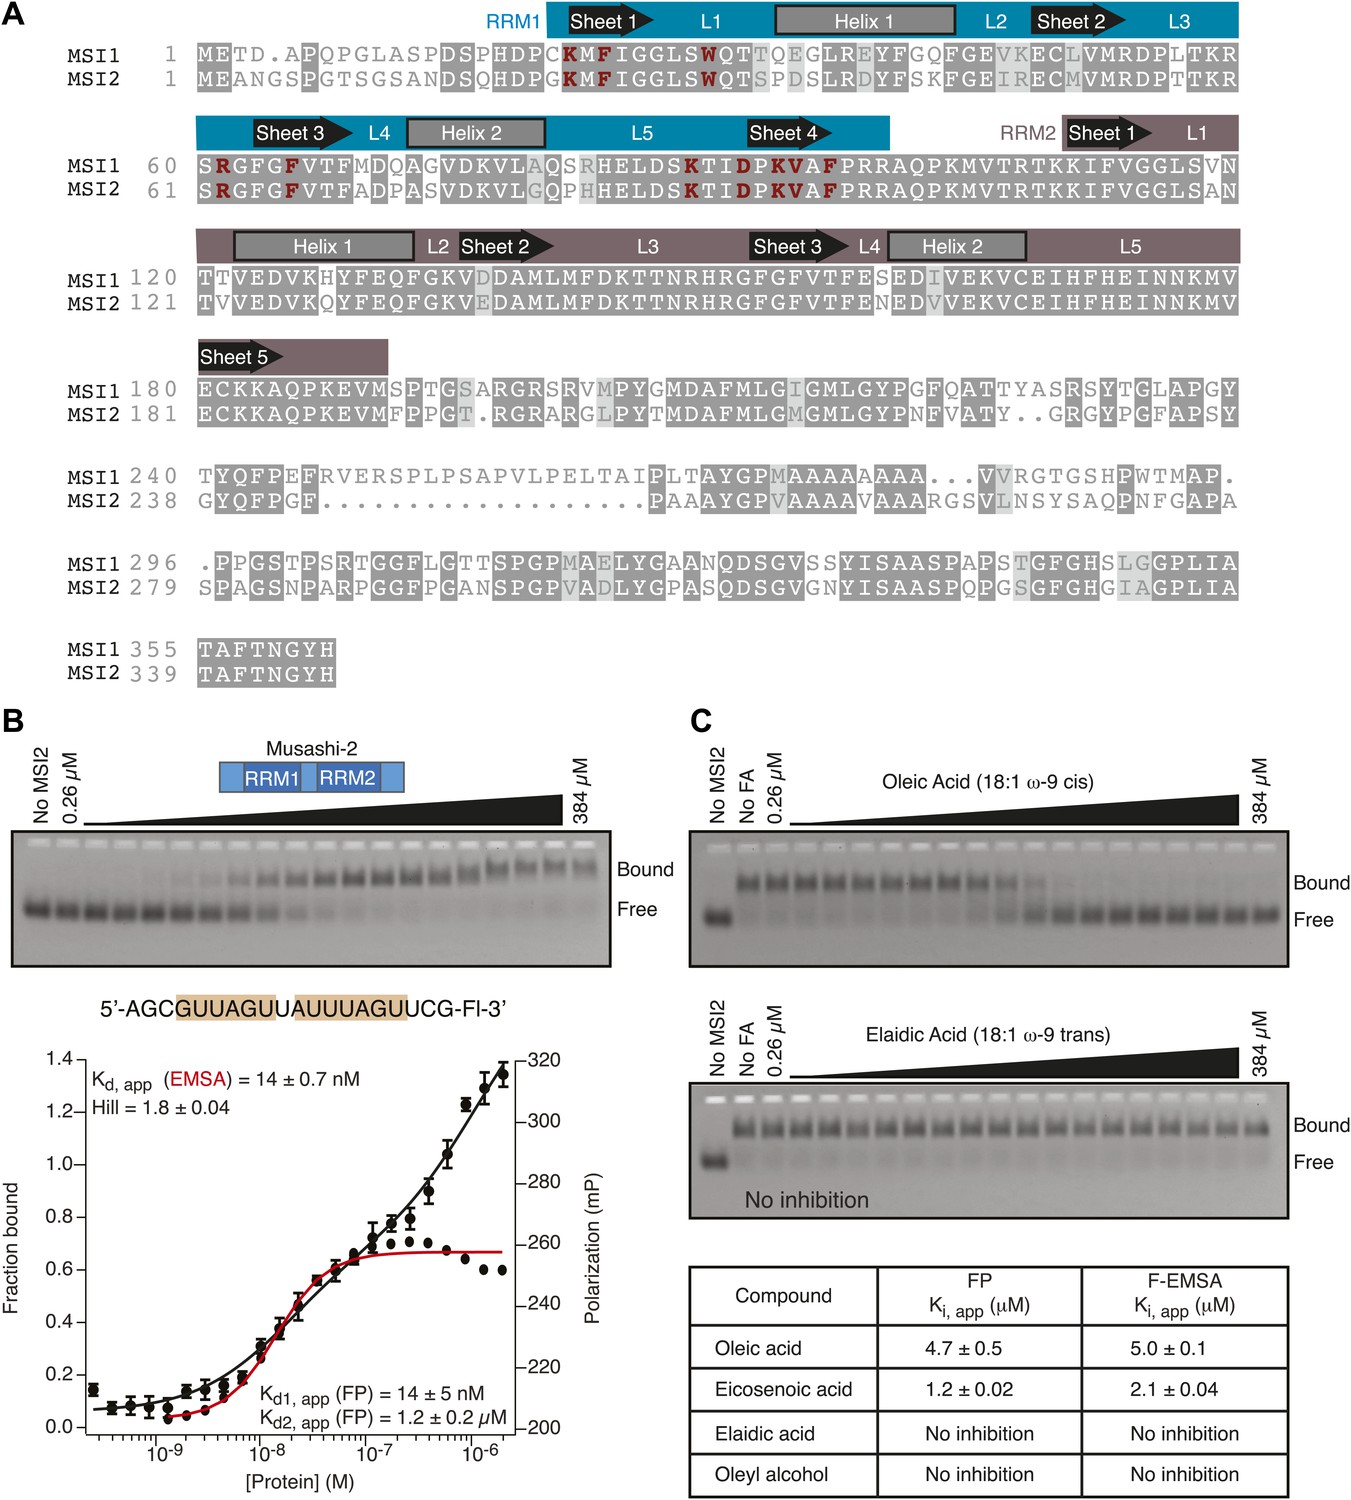
RNA binding specificity and inhibition by specific fatty acids is conserved in MSI2.
(A) Sequence alignment shows 83% conservation between MSI1 and MSI2 within the RRM domains. Regions that correspond to α-helices, β-sheets, and intervening loops as defined by NMR spectroscopy are diagramed above the alignment. (B) MSI2 binds the MSI1 RNA aptamer CCCR005 with similar affinity to that of MSI1 by both FP and F–EMSA. The no protein control lane defines the position of free RNA. Data are the average and standard deviation of three independent experiments. (C) MSI2 is specifically inhibited by oleic acid and eicosenoic acid in FP and F–EMSA dose response experiments. No compound and no protein controls define the position of bound and free RNA respectively. Data are the average and standard deviation of three independent experiments.
Figure 2 with 2 supplements
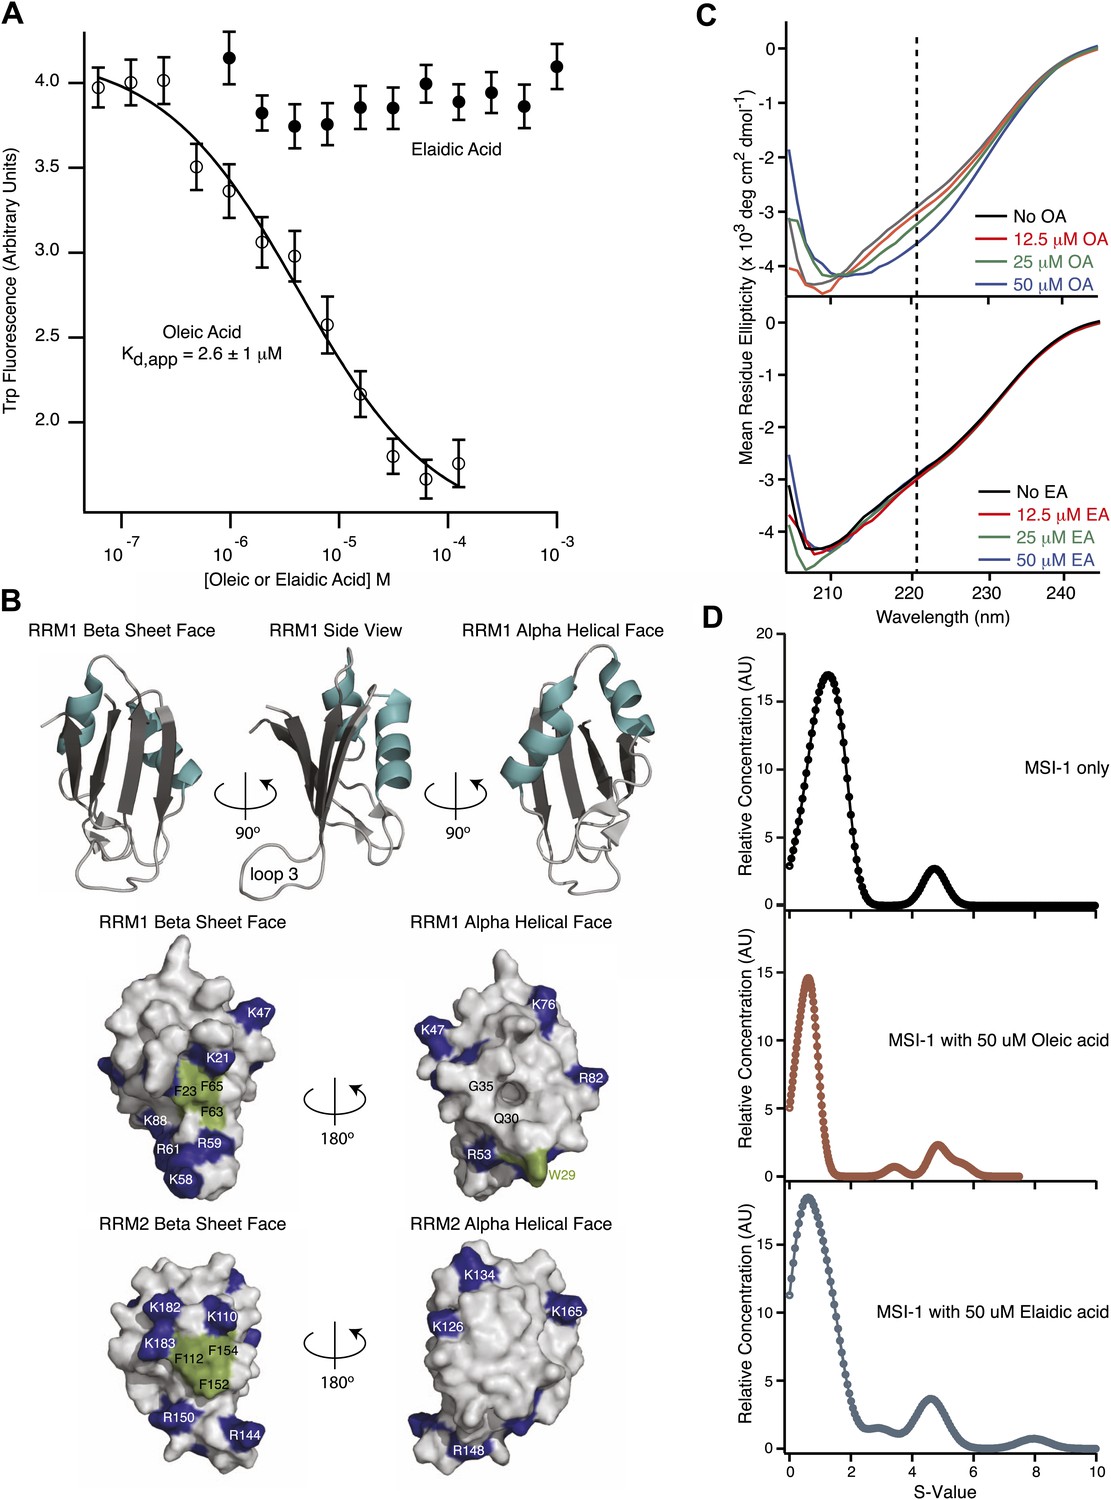
MSI1 inhibition is allosteric.
(A) MSI1 tryptophan fluorescence at 350 nm as a function of oleic and elaidic acid. The Kd, app, Ki, app, and Hill parameters are the average and standard deviation of three independent replicates. (B) Ribbon model of MSI1 RRM1 (top). Space-filling model of MSI1 RRM1 (middle) and RRM2 (bottom) (Nagata et al., 1999; Miyanoiri et al., 2003). Left, β-sheet surface, right, α-helical surface. Conserved phenylalanines and W29 are green. Lysine and arginine residues are blue. A hydrophobic pocket exists on the RRM1 α-helical surface. (C) CD spectra of MSI1 RRM1 in the presence of oleic (top) or elaidic acid (bottom). (D) Envelope traces of the van Holde-Weischet analysis for analytical ultracentrifugation experiments of MSI1 alone (top), with oleic acid (middle) and with elaidic acid (bottom). The predominant species sediments where monomeric MSI1 would be expected, and there is no significant change in the sedimentation profile after addition of oleic or elaidic acid. Data are representative traces from one of three independent experiments.
Figure 2—figure supplement 1
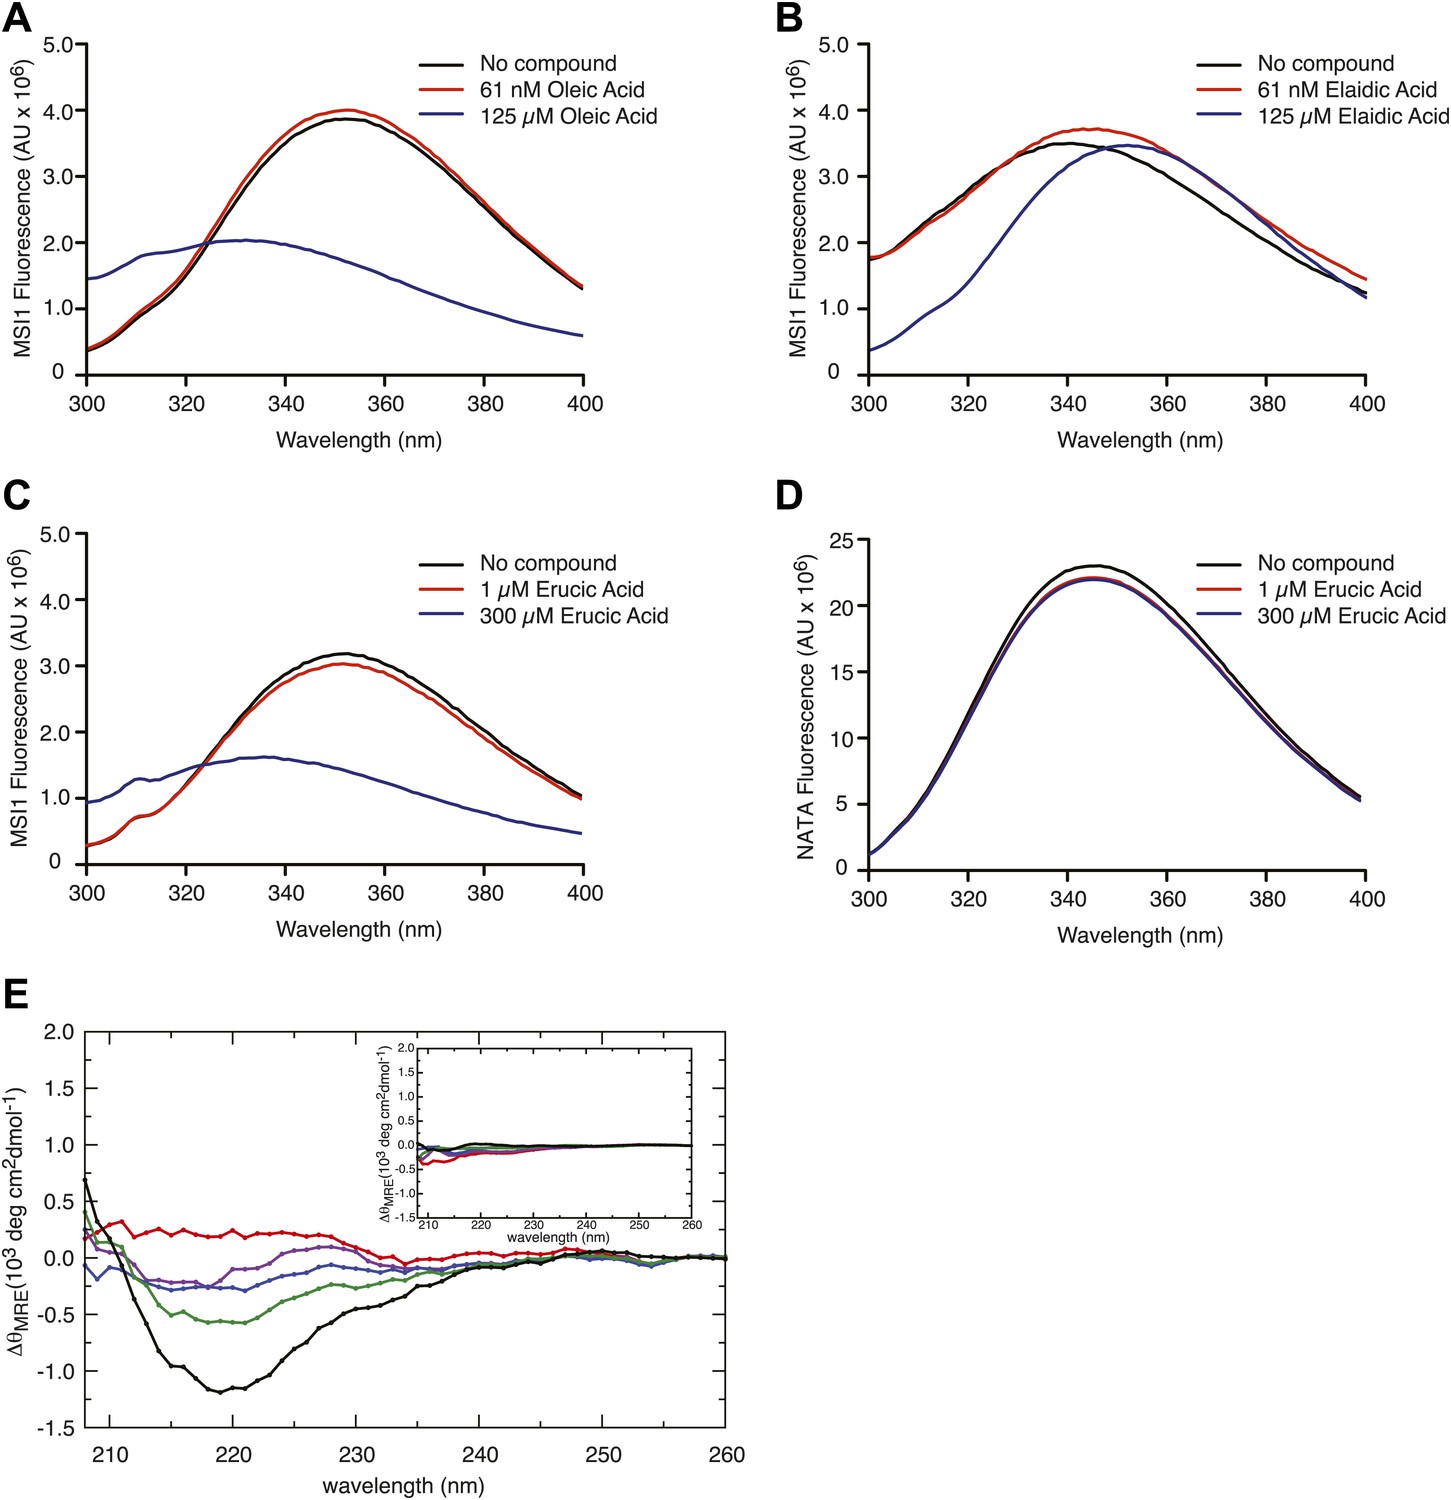
(A–D) The MSI1 tryptophan fluorescence spectrum changes as a function of inhibitor titration. The tryptophan fluorescence emission spectrum is strongly quenched upon oleic acid (A) and erucic acid (C) but not elaidic acid (B) addition. (D) A tryptophan-containing control N-acetyl-tryptophanamide (NATA) does not change upon compound addition. Data from one representative experiment for each compound concentration are shown. (E) Difference spectra calculated for the far-UV CD spectra of MSI-1 collected at increasing oleic acid concentrations relative to the spectrum in the absence of oleic acid. Different colors correspond to different concentration of oleic acid: red is 3 µM, purple is 6 µM, blue is 12.5 µM, green is 25 µM, and black is 50 µM. The inset shows the same difference spectra calculated for the CD spectra of MSI1 with increasing elaidic acid concentration relative to the spectrum collected in the absence of elaidic acid. The same color scheme applies to the different elaidic acid concentrations.
Figure 2—figure supplement 2
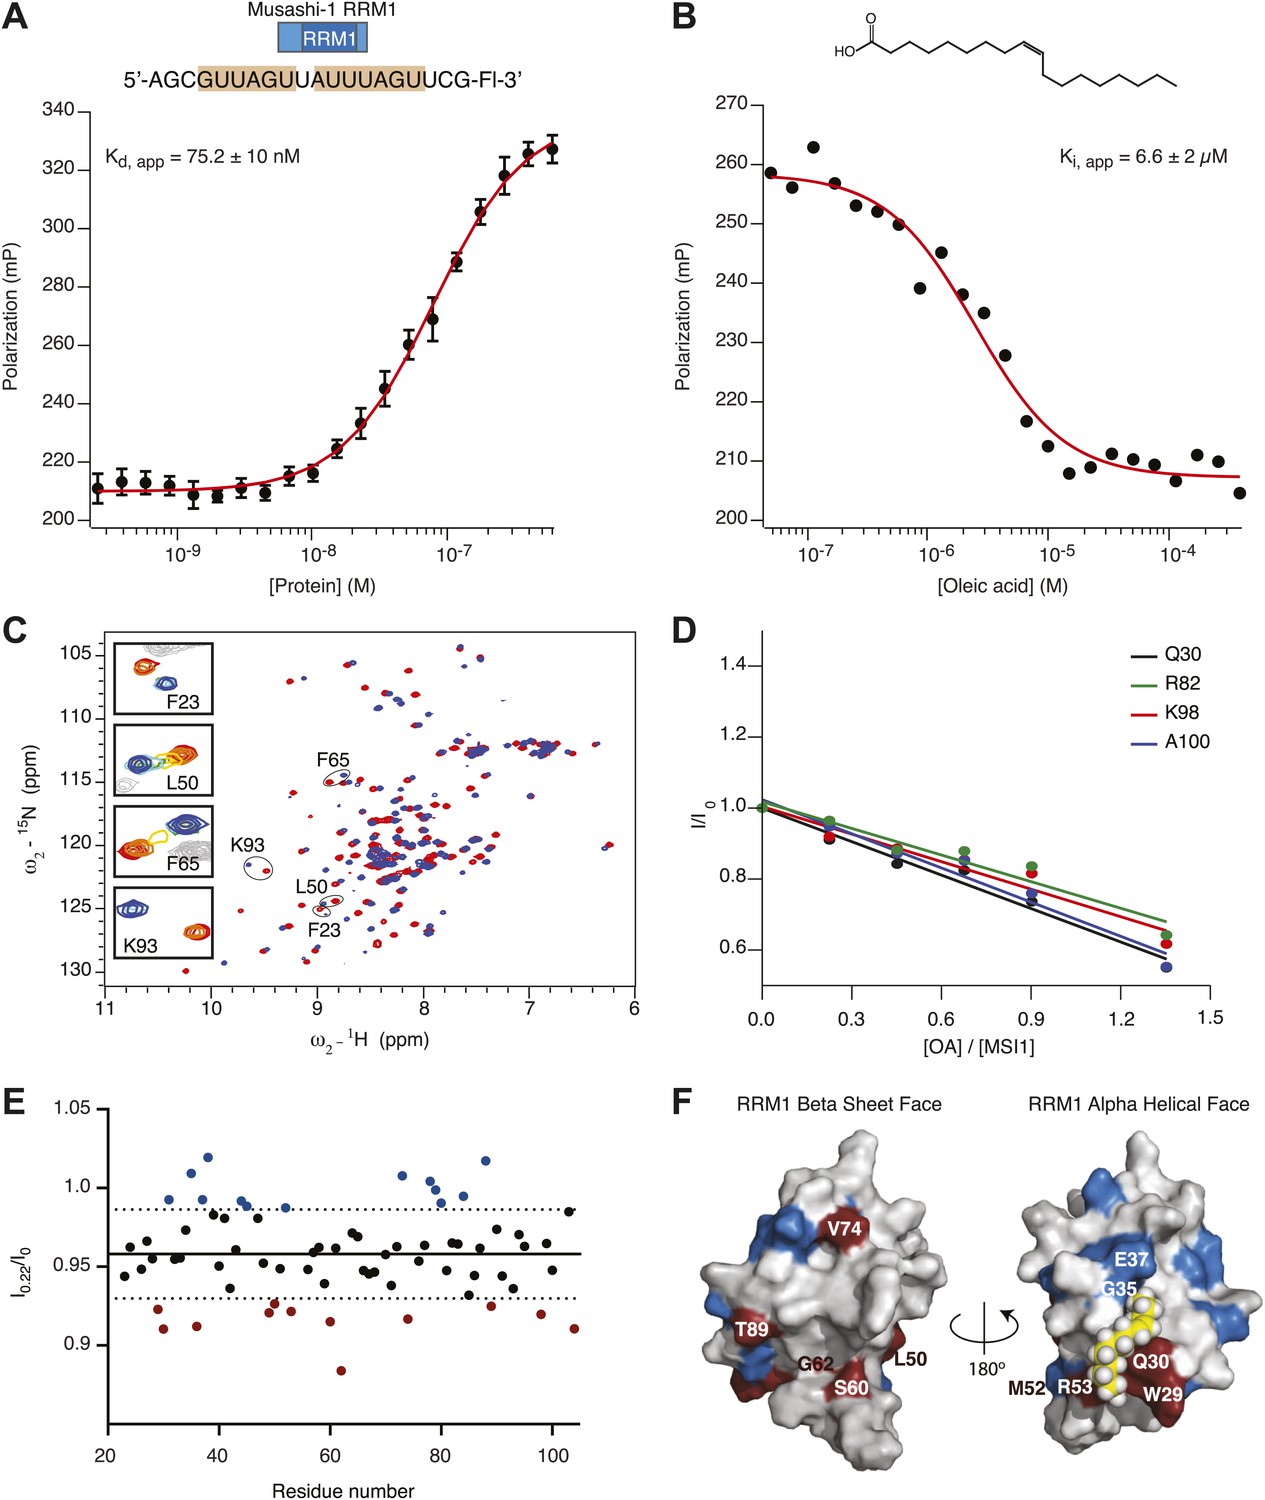
(A and B) Recombinant His6-tagged MSI1 RRM1 binds RNA aptamer CCCR005 (A) and is inhibited by oleic acid (B). FP data are reported as the average and standard deviation of three independent experiments. (C) 2D 1H-15N HSQC spectra of MSI1 free (red) and bound to RNA (blue) at pH 7 and 25°C. Selected resonances are labeled and enlarged in the insets. Crosspeaks are colored according to the increasing concentration of added RNA. (D–F) NMR titration of oleic acid (D) The cross peak intensities (I) from the 2D 1H-15N HSQC spectra of MSI1 are plotted for four representative residues (Q30 black, R82 green, K98 red, A100 blue) as a function of the concentration of oleic acid added to sample of 133 µM MSI1 at pH 7 and 25°C. The intensities are normalized relative to the measured intensity in the absence of oleic acid, I0. The intensity ratios were fitted to straight lines. (E) The cross peak intensities for all assigned residues of MSI1 in the 2D NMR spectrum after adding 0.22 molar equivalents of oleic acid. I0 is the intensity without oleic acid addition and I0.22 is the intensity after addition of 0.22 molar equivalents of oleic acid. Each point represents the I0.22/I0 for a single residue. The average of all intensities at I0.22 (solid line) and ±1 standard deviation (dashed lines) indicate that some residues lose more intensity than others. A number of residues display normalized intensity values that are higher (blue) or lower (red) than 1 standard deviation from average. (F) Space-filling model of MSI1 RRM1 (Nagata et al., 1999; Miyanoiri et al., 2003). Residues with intensities below 1 SD from the average are red. Residues with intensities higher than 1 SD from the average are blue.
Figure 3 with 1 supplement
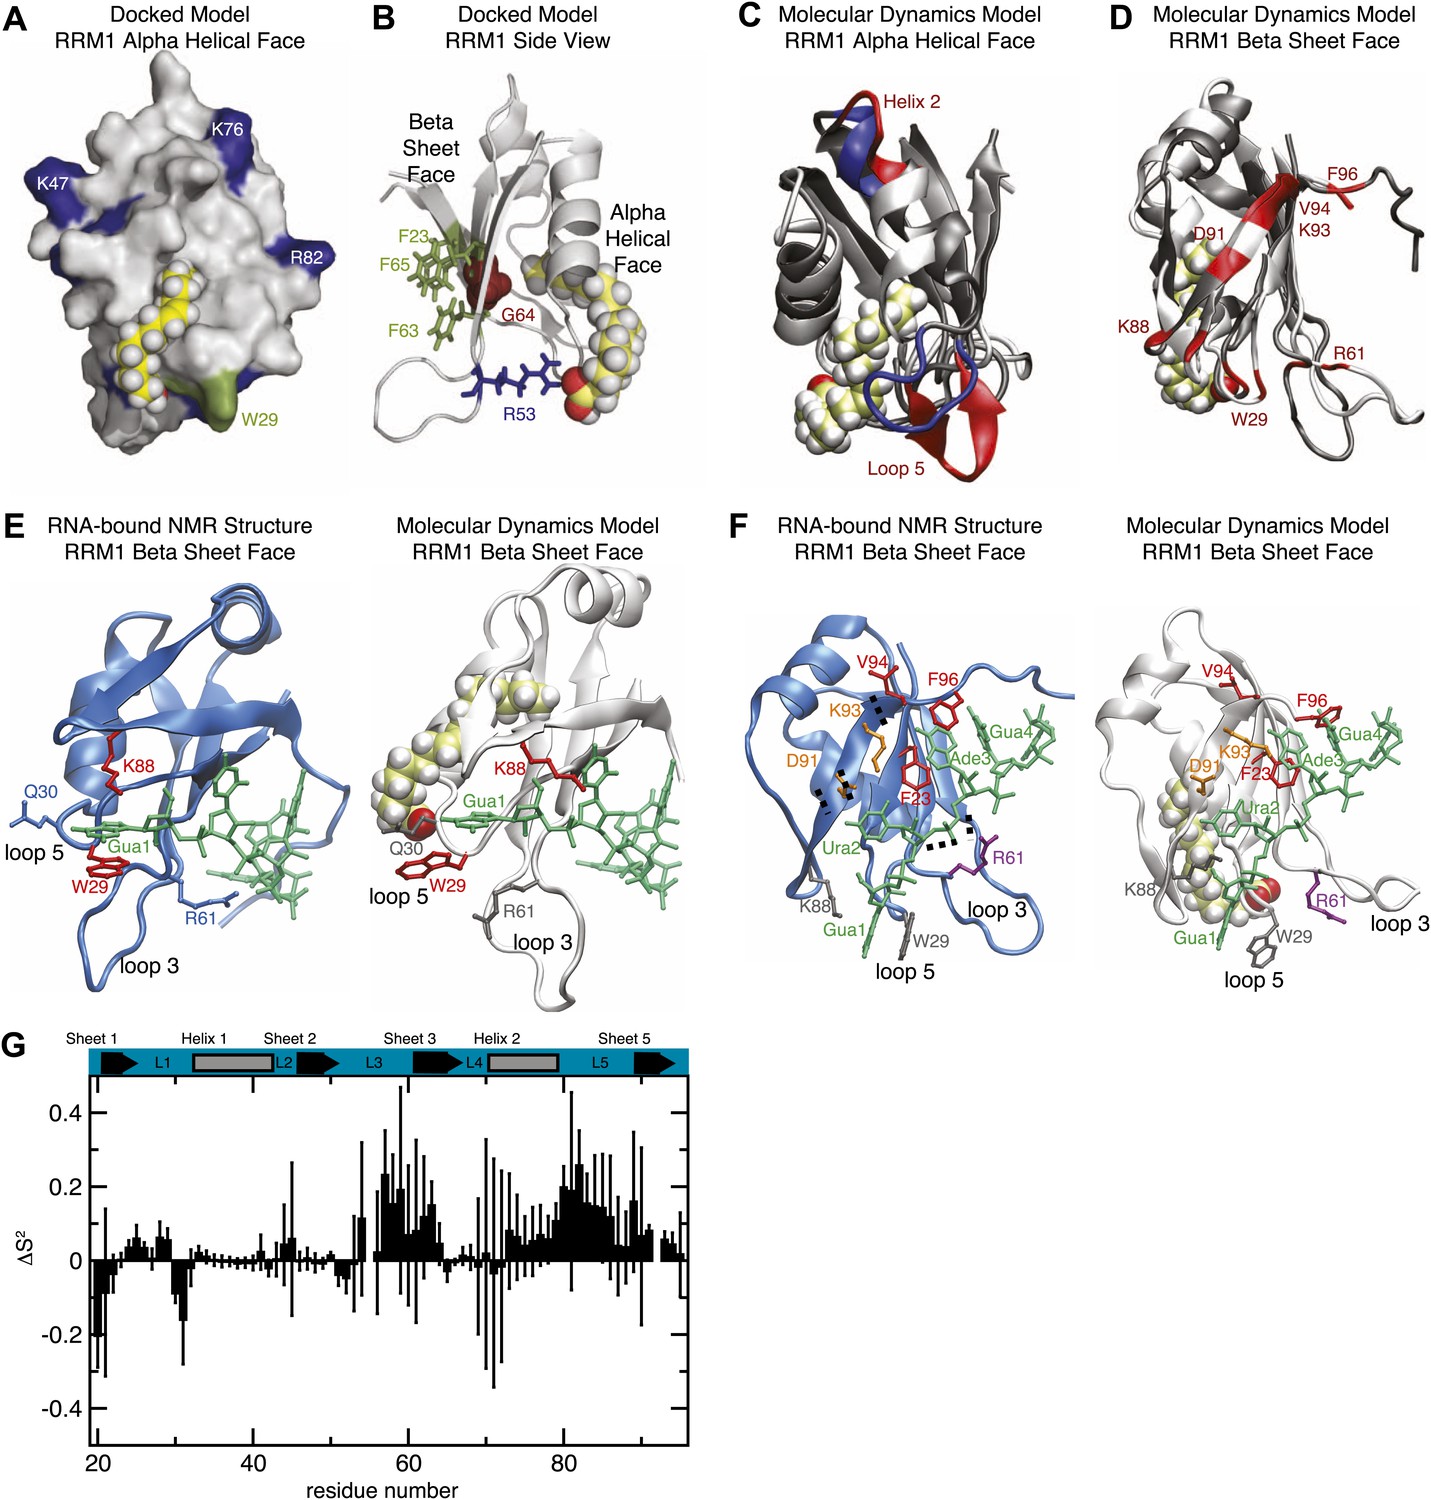
(A and B) Model of RRM1 bound to oleic acid (yellow) calculated by Schrödinger GLIDE (Friesner et al., 2004; Friesner et al., 2006). (C) Overlay of the oleic acid bound MD simulation (gray and red) with the apo-state NMR structure (gray and blue) (Ohyama et al., 2011). (D) RNA contact residues (red) in loop 5, helix 2, and strand 4 of the β-sheet are perturbed in oleic acid-bound molecular dynamics simulation (Ohyama et al., 2011). (E and F) A representative snapshot from the MD simulation of MSI1 bound to oleic acid (white) compared to the MSI1-RNA NMR structure (blue) (Ohyama et al., 2011). Panel (E) shows the Gua 1 binding pocket. In the oleic-bound state, the open conformation of loop 5 (L5) orients K88 such that K88 cannot contact Gua 1. W29 is stacked against Q30 and unavailable for stacking against Gua 1. Interaction with the side chain of R61 stabilizes the conformation of W29 in the oleic-bound state. Panel (F) highlights the different conformations of residues that interact with Gua 1, Ura 2, Ade 3, and Gua 4; represented in grey, orange, red, and purple, respectively. (G) Difference of the mean Lipari-Szabo order parameters by residue between the apo and oleic acid-bound states of MSI1. The Lipari-Szabo order parameters for the backbone NH bond vectors, S2, were calculated to quantify the backbone flexibility of the free and oleic acid-bound form of MSI1. The difference of the order parameters, ΔS2 = S2apo−S2MSI−OA, indicates that MSI1-oleic acid complex is more flexible than apo MSI1, with the few exceptions mostly observed at the N-terminus. The secondary structural elements are highlighted at the top. Error bars are calculated from the standard deviation among trajectories.
Figure 3—figure supplement 1
Mutational analysis supports molecular dynamics simulation and docked model predictions.
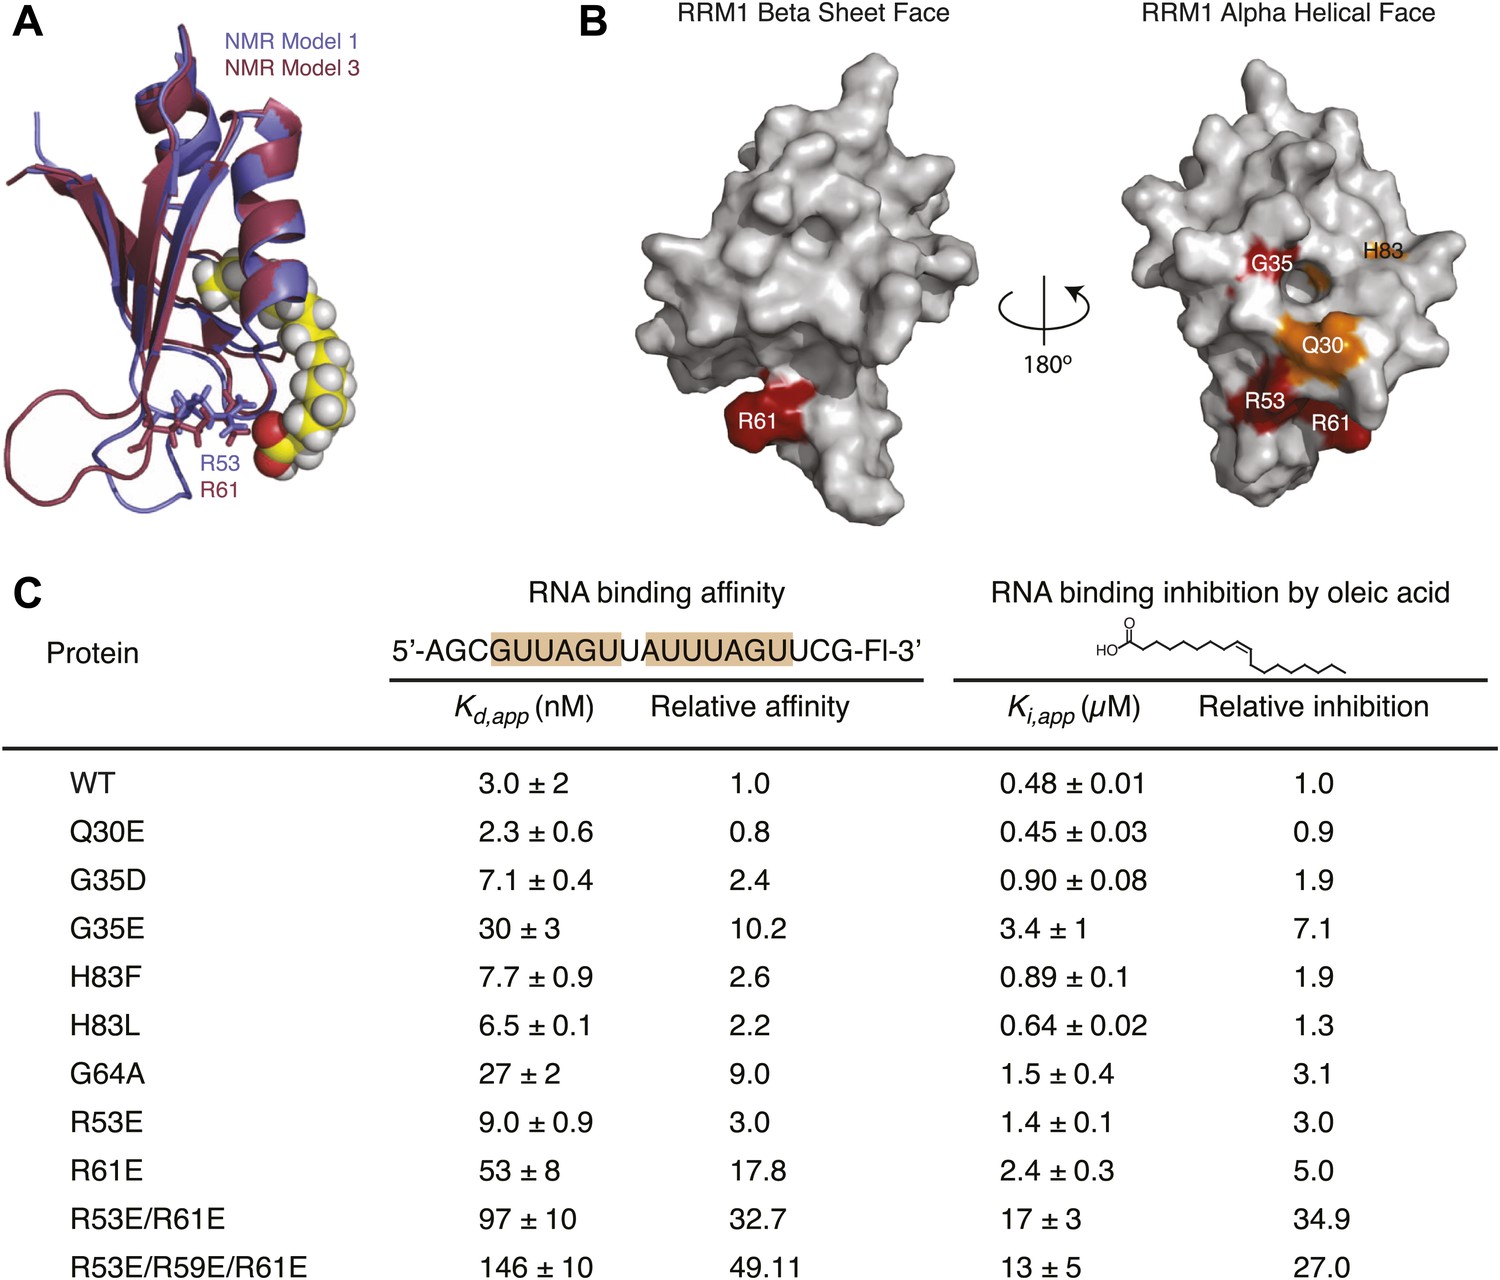
(A) MSI1 RRM1 overlays from two NMR models demonstrate the highly dynamic nature of loop 3. Arginine 53 (model 1) and arginine 61 (model 3) are predicted to interact with the caboxylate of oleic acid in the respective models. (B) Space-filling model of MSI1 RRM1 with mutated residues colored. Orange residues indicate mutations with modest (<twofold) or no reduction in inhibition by oleic acid. Red residues displayed a larger (>twofold) reduction in inhibition by oleic acid. (C) Table of mutant RNA-binding and inhibition data. Data are the average of three independent fluorescence polarization experiments. All proteins were purified and tested during the same time period and using the same reagents, enabling comparison of wild-type and mutant variants.
Figure 4
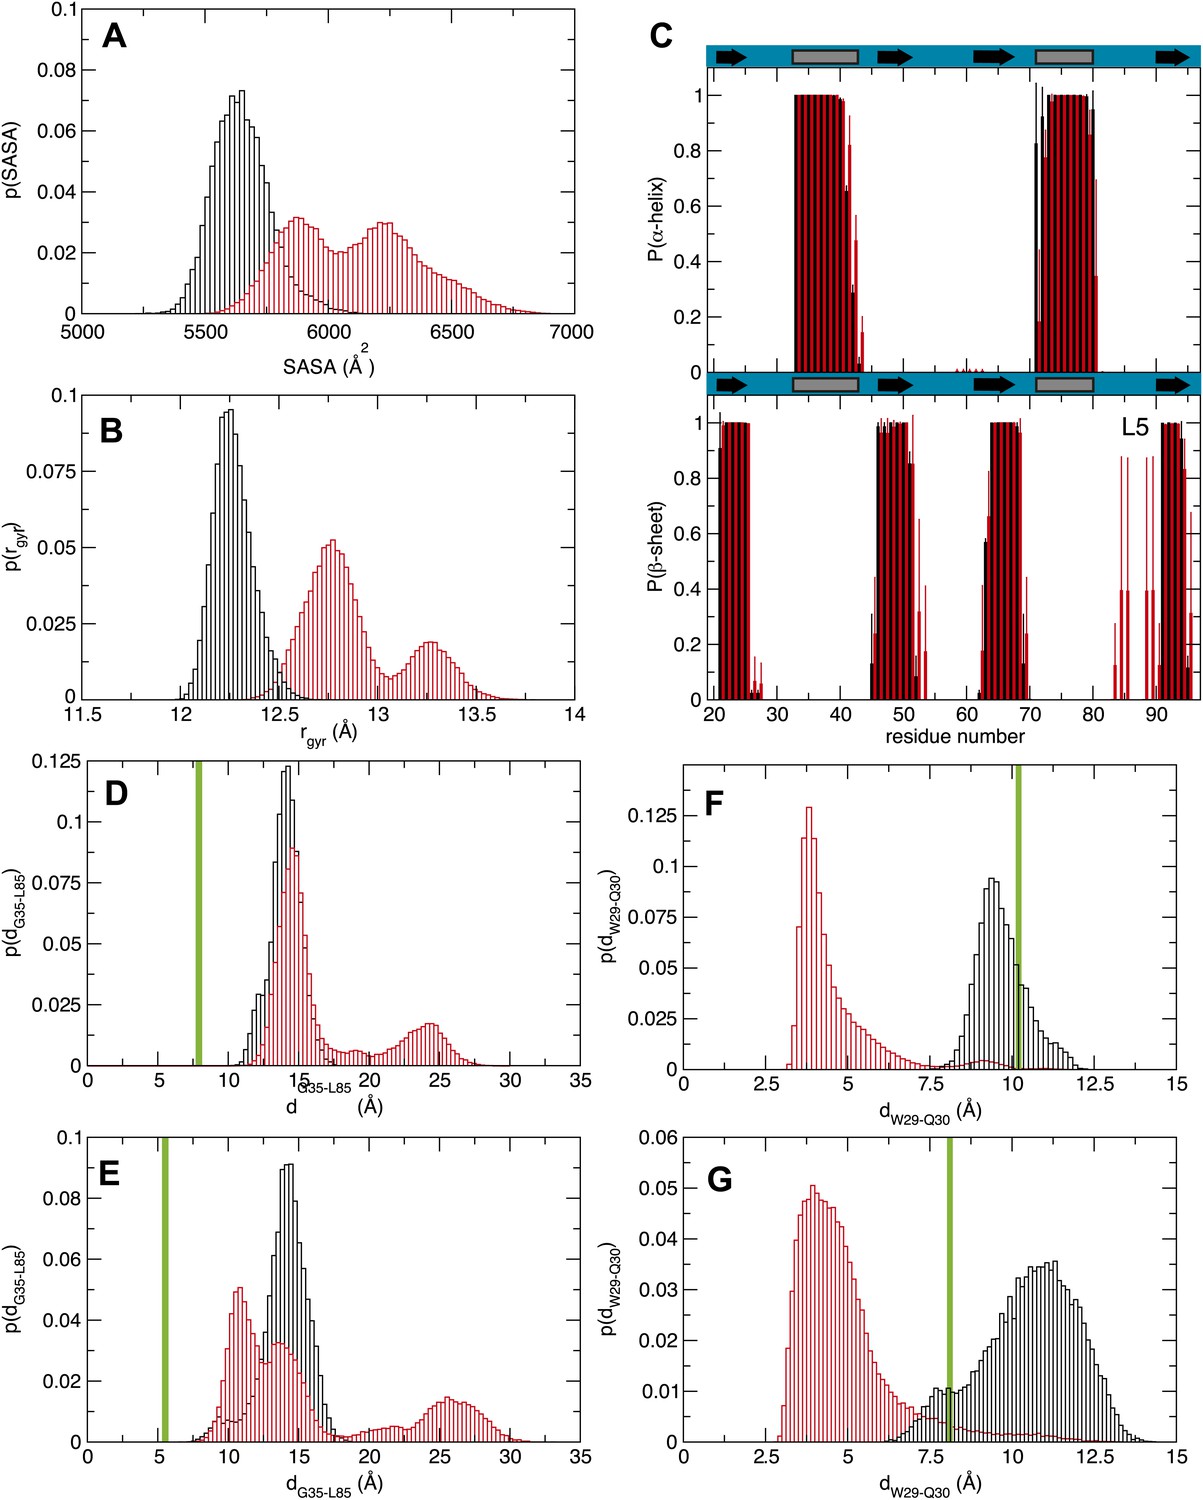
Molecular dynamics studies (A and B) represent the normalized histograms of the protein solvent accessible surface area (SASA) and radius of gyration (rgyr) illustrating the structural transition undergone by the MSI1 upon oleic acid binding. (A) SASA distributions calculated from the MD trajectories of MSI1 bound to oleic acid and of MSI1 in the apo state are represented in red and black, respectively. (B) Radius of gyration distributions calculated from the MD trajectories of MSI-1 bound to oleic acid and of MSI1 in the apo state are represented in red and black, respectively. (C) The probability of being in an α-helix or β-sheet is shown for each residue of MSI1. The probabilities calculated for each residue from the MD trajectories of MSI1 free and bound to oleic acid are shown in black and red, respectively. Oleic acid binding is associated with stabilization of the C-terminus of α-helix 1, fraying of α-helix 2, at both the N- and C-termini, extension of sheet 2, as well as the formation of an additional β-sheet at loop 5 (L5). (D and E) Normalized histograms of the distance between G35, located on α-helix 1, and L85, located on loop 5, calculated from the MD trajectories of oleic acid-bound MSI-1 and of apo MSI1 are shown in red and black, respectively. The distribution of distances between the Cα atoms of G35 and L85 is depicted in (D). The distribution of distances between the Cα of G35 and the Cδ2 of L85 is shown in (E). The green lines show the values of these distances observed in the NMR structure of MSI1 bound to RNA (PDB ID 2RS2). In the oleic-bound state, loop 5 is restricted in approaching α-helix 1 due to the steric hindrance of the oleic acid. (F and G) Normalized histograms of two representative side chain distances of W29 and Q30. Histograms calculated over the MD trajectories of oleic acid-bound MSI1 are shown in red, those of apo MSI1 in black. The distance between W29 Cε2 and Q30 Cγ is shown in (F). The distance between W29 Cζ2 and Q30 Nε2 is shown in (G). The green lines show these distances observed in the NMR structure of MSI1 bound to RNA (PDB ID 2RS2). In the oleic-bound state, the side chain of W29 is stacked against the side chain of Q30. This conformation of W29 is not observed in either the free or RNA-bound states of MSI1.
Figure 5 with 3 supplements
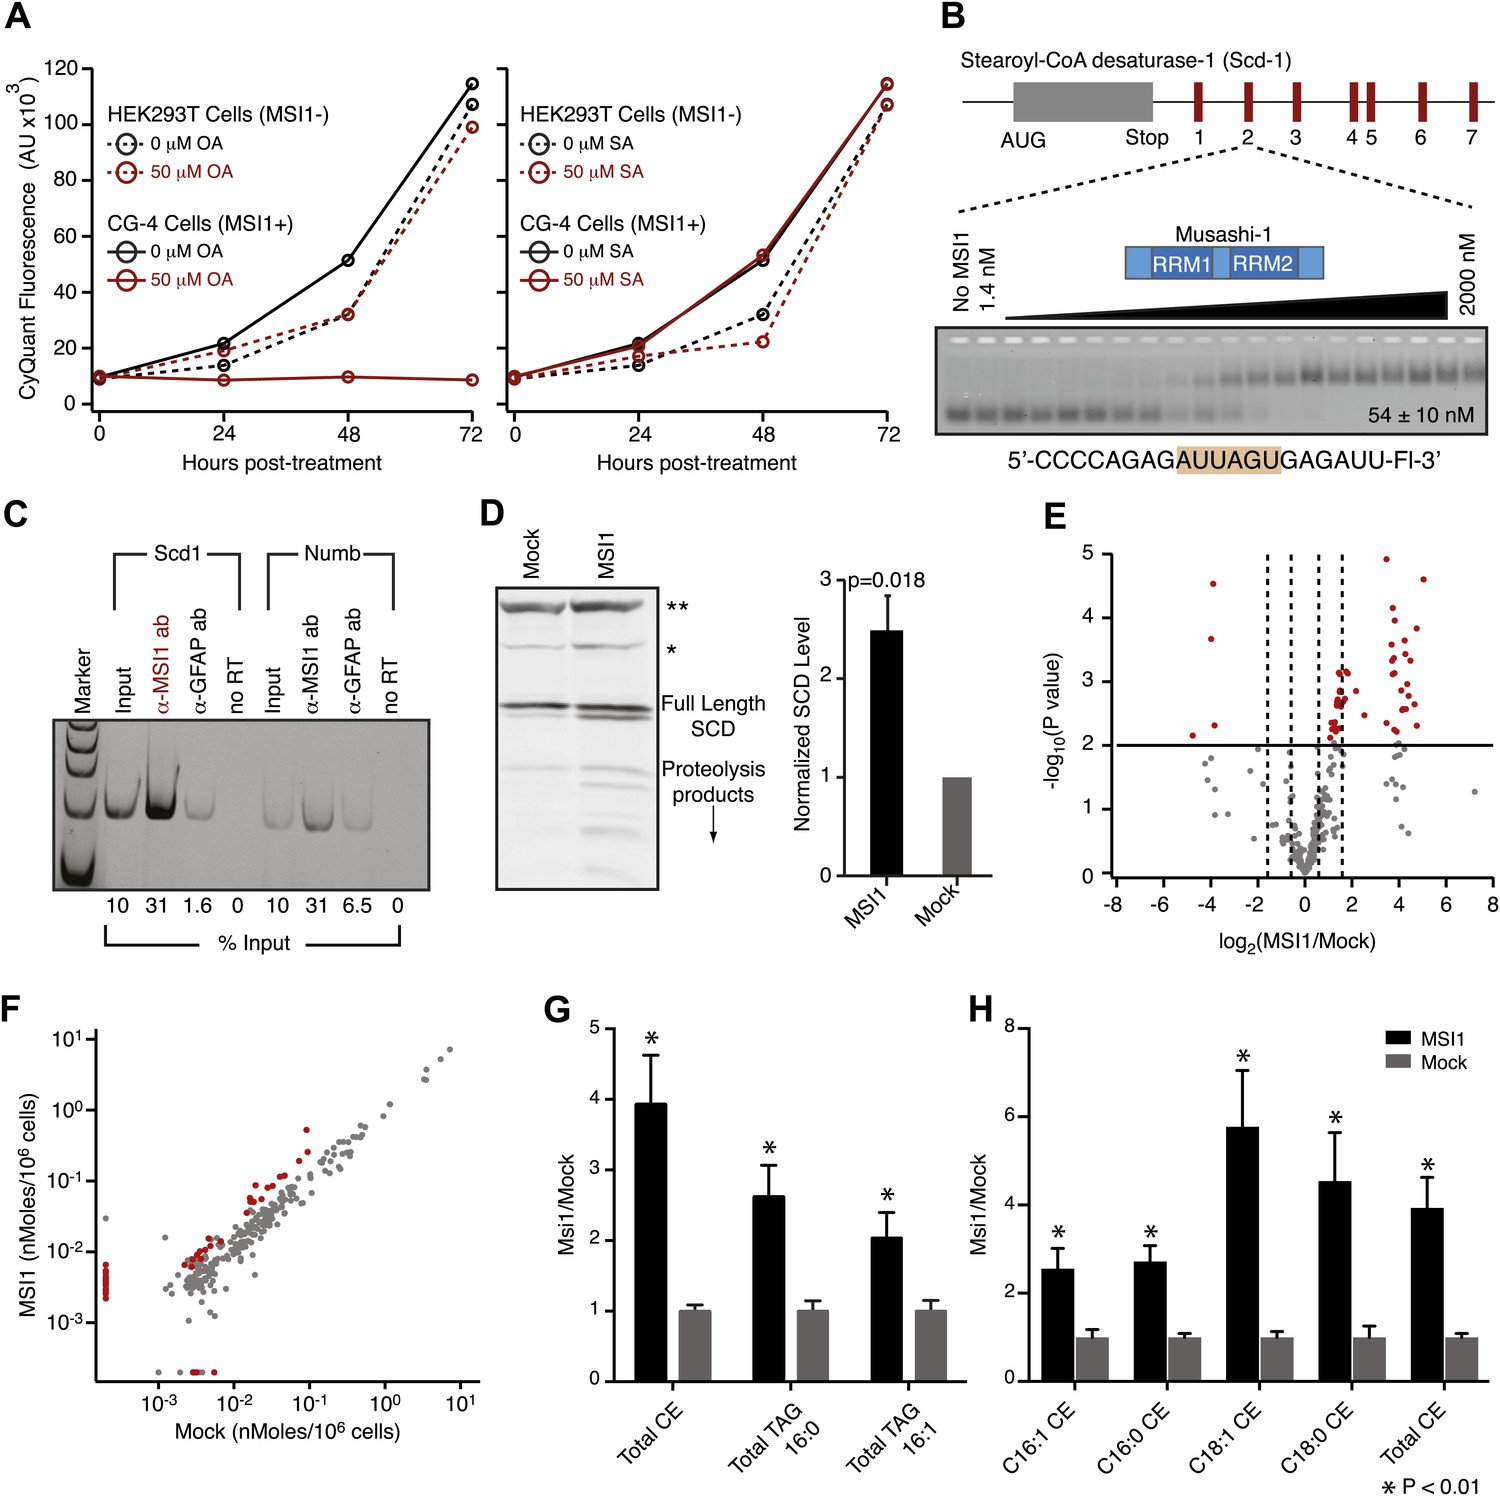
MSI-1 regulates stearoyl-CoA desaturase.
(A) HEK293T (dashed) and CG-4 (solid) cell proliferation as a function of oleic acid or stearic acid treatment (red = treated, black = untreated). The data are the average and standard deviation of at least three biological replicates. (B) There are seven MSI1 consensus sites in the 3′-UTR of Scd-1 mRNA. The Kd, app is the average and standard deviation of at least three experiments. (C) Scd-1 transcripts co-immunoprecipitate with anti-MSI1 antibodies. The data were quantified using a FUJI FLA-5000 imager. (D) Western analysis of SCD expression in HEK293T cells. The data were quantified using the LICOR Odyssey system relative to non specific bands (** and *, Figure 5—figure supplement 2B) to control for loading. The average and standard deviation of at least three independent experiments is shown. (E–H) Lipidomics analysis of HEK293T cells ± MSI1 expression. Source data are included in Figure 5—source data 1. (E) Volcano plot of lipidomics data. Dashed lines denote fold-changes of ±1.5 and ±3. Red data points indicate lipids that are significantly changed upon MSI1 expression. (F) Scatter plot of lipidomics data. Data are reported as nMoles per million cells. Red data points indicate lipids that are significantly changed upon MSI1 expression (FDR = 0.05). (G) Fold-changes of the total cholesterol esters and two TAG classes in which 38 of the 54 significantly changing lipids are categorized. Each class changes significantly with MSI1 overexpression (p<0.05). (H) Fold-changes for the four lipids that comprise the total cholesterol esters class. All display significant changes with MSI1 expression (FDR = 0.05).
-
Figure 5—source data 1
Lipidomics data files.
- https://doi.org/10.7554/eLife.02848.015
Figure 5—figure supplement 1

Dose response for oleic acid treatment in cell culture.
HEK293T (dashed) and CG-4 (solid) cell proliferation as a function of increasing oleic acid (red = 50 µM, grey = 5 µM, black = 0 µM). The data are the average and standard deviation of at least three biological replicates.
Figure 5—figure supplement 2
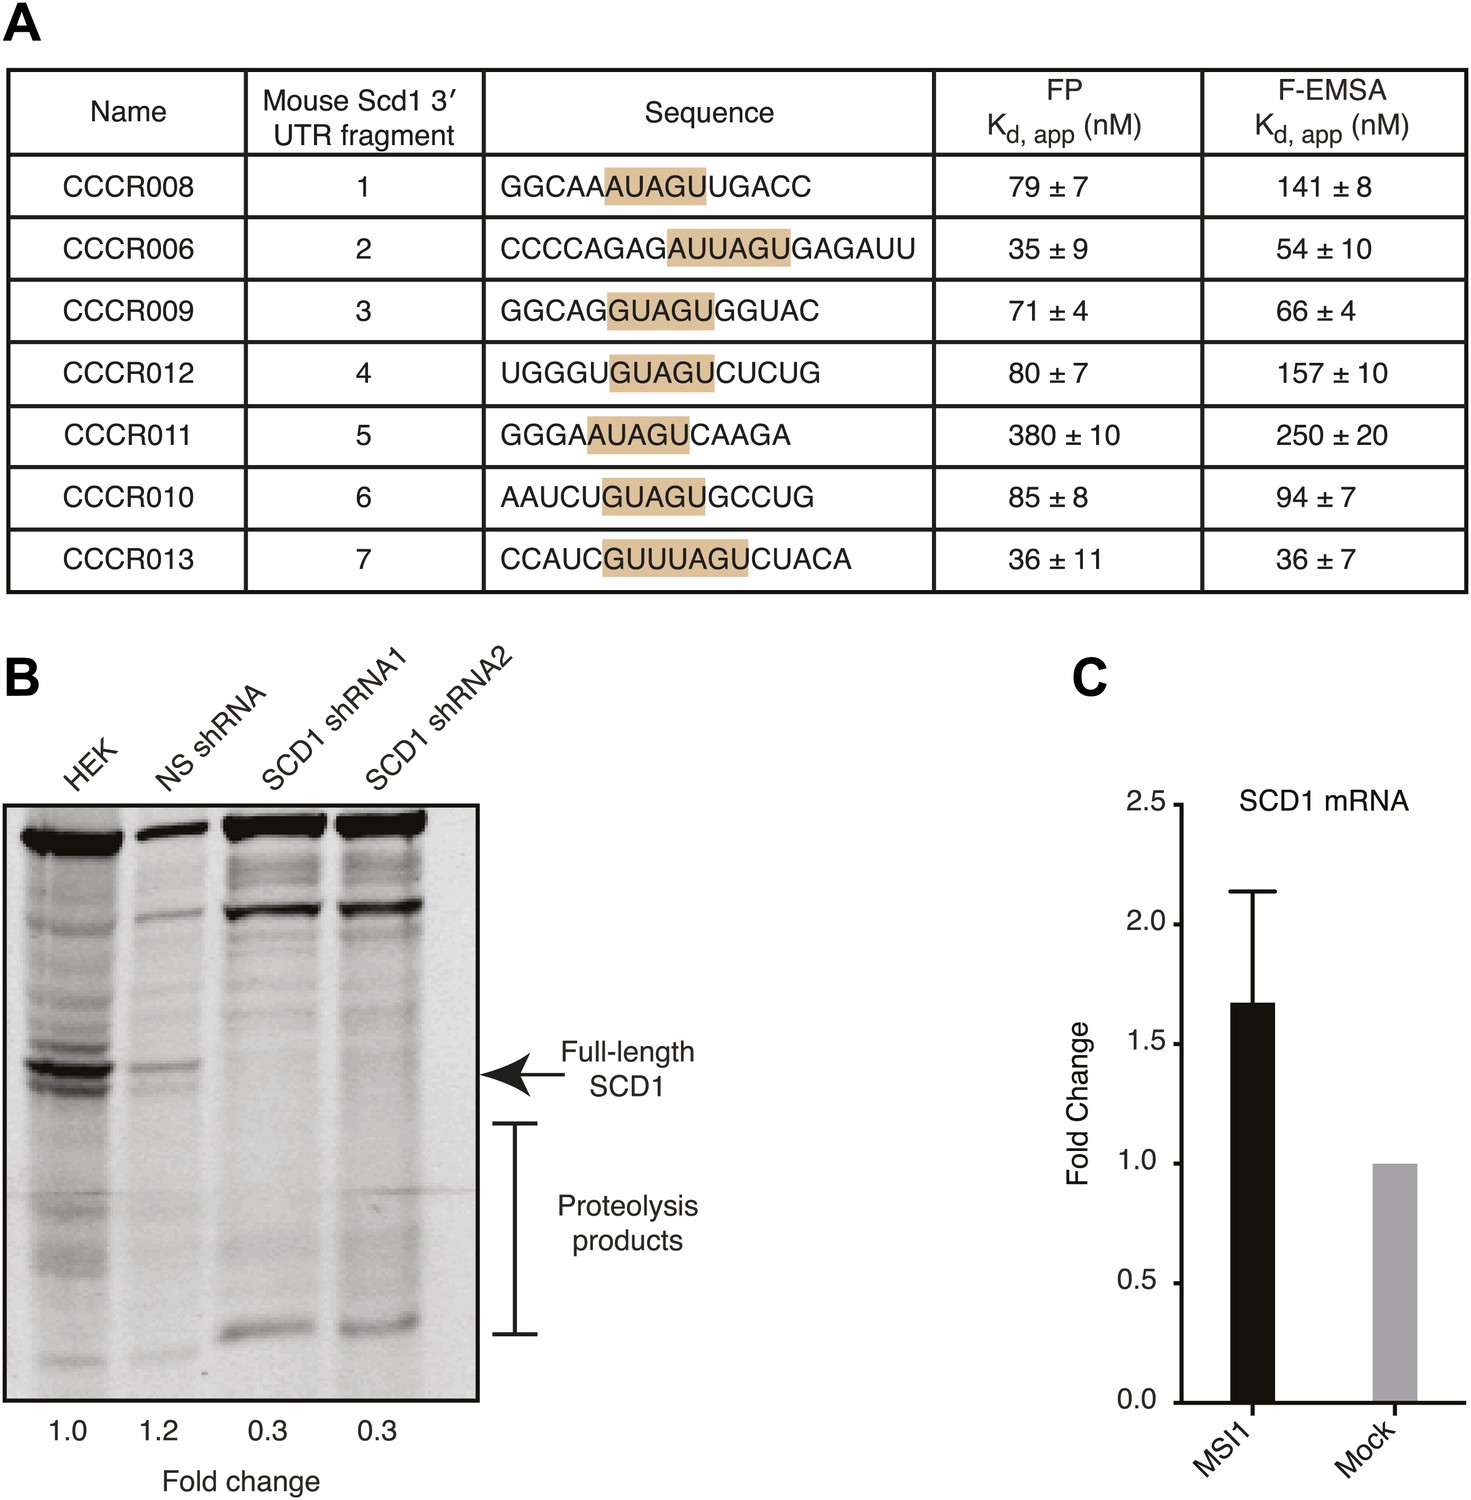
(A) MSI1 binds each of 7 SCD1 3′ UTR fragments containing the MSI1 consensus sequence (G/A)U1–3AGU with variable affinity. FP and F–EMSA binding experiments are reported as the average and standard deviation of three independent experiments. (B) The SCD1 antibody is specific for full-length SCD1 and the associated proteolysis products. Two independent shRNA constructs reduced full-length SCD1 and associated proteolysis products compared to non-transfected or control shRNA-transfected HEK293T cells. (C) qRT-PCR of SCD1 mRNA. The data are the mean and SD of the fold-change in SCD1 mRNA from five independent experiments. Each experiment comprised three technical replicates normalized to tubulin or GTF2i.
Figure 5—figure supplement 3
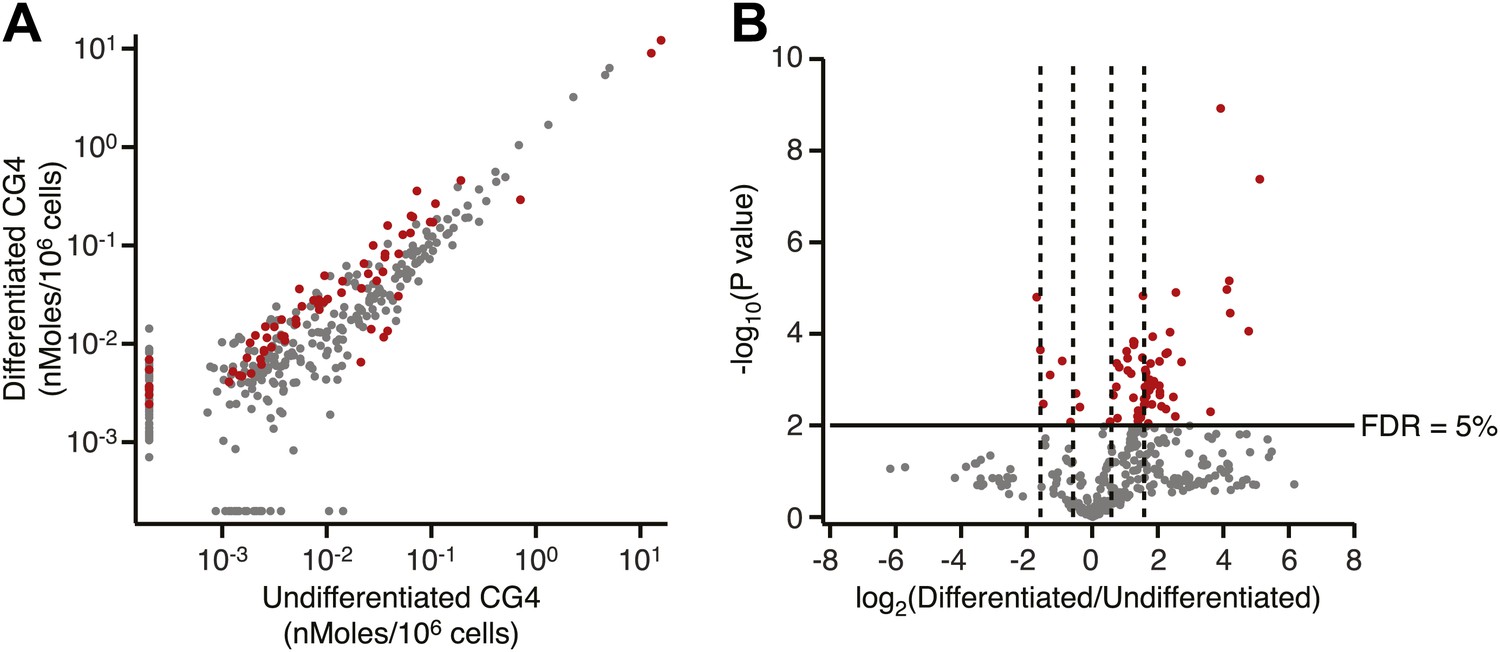
Lipidomics analysis of undifferentiated and differentiated CG4 oligodendrocyte progenitor cells.
(A) Scatter plot of lipidomics data for differentiated vs undifferentiated CG4 cells. Data are reported as nMoles per million cells. Red data points indicate lipids that are significantly different after differentiation (FDR = 5%). (B) Volcano plot of lipidomics data. Dashed lines denote fold-changes of ±1.5 and ±3.
Figure 6
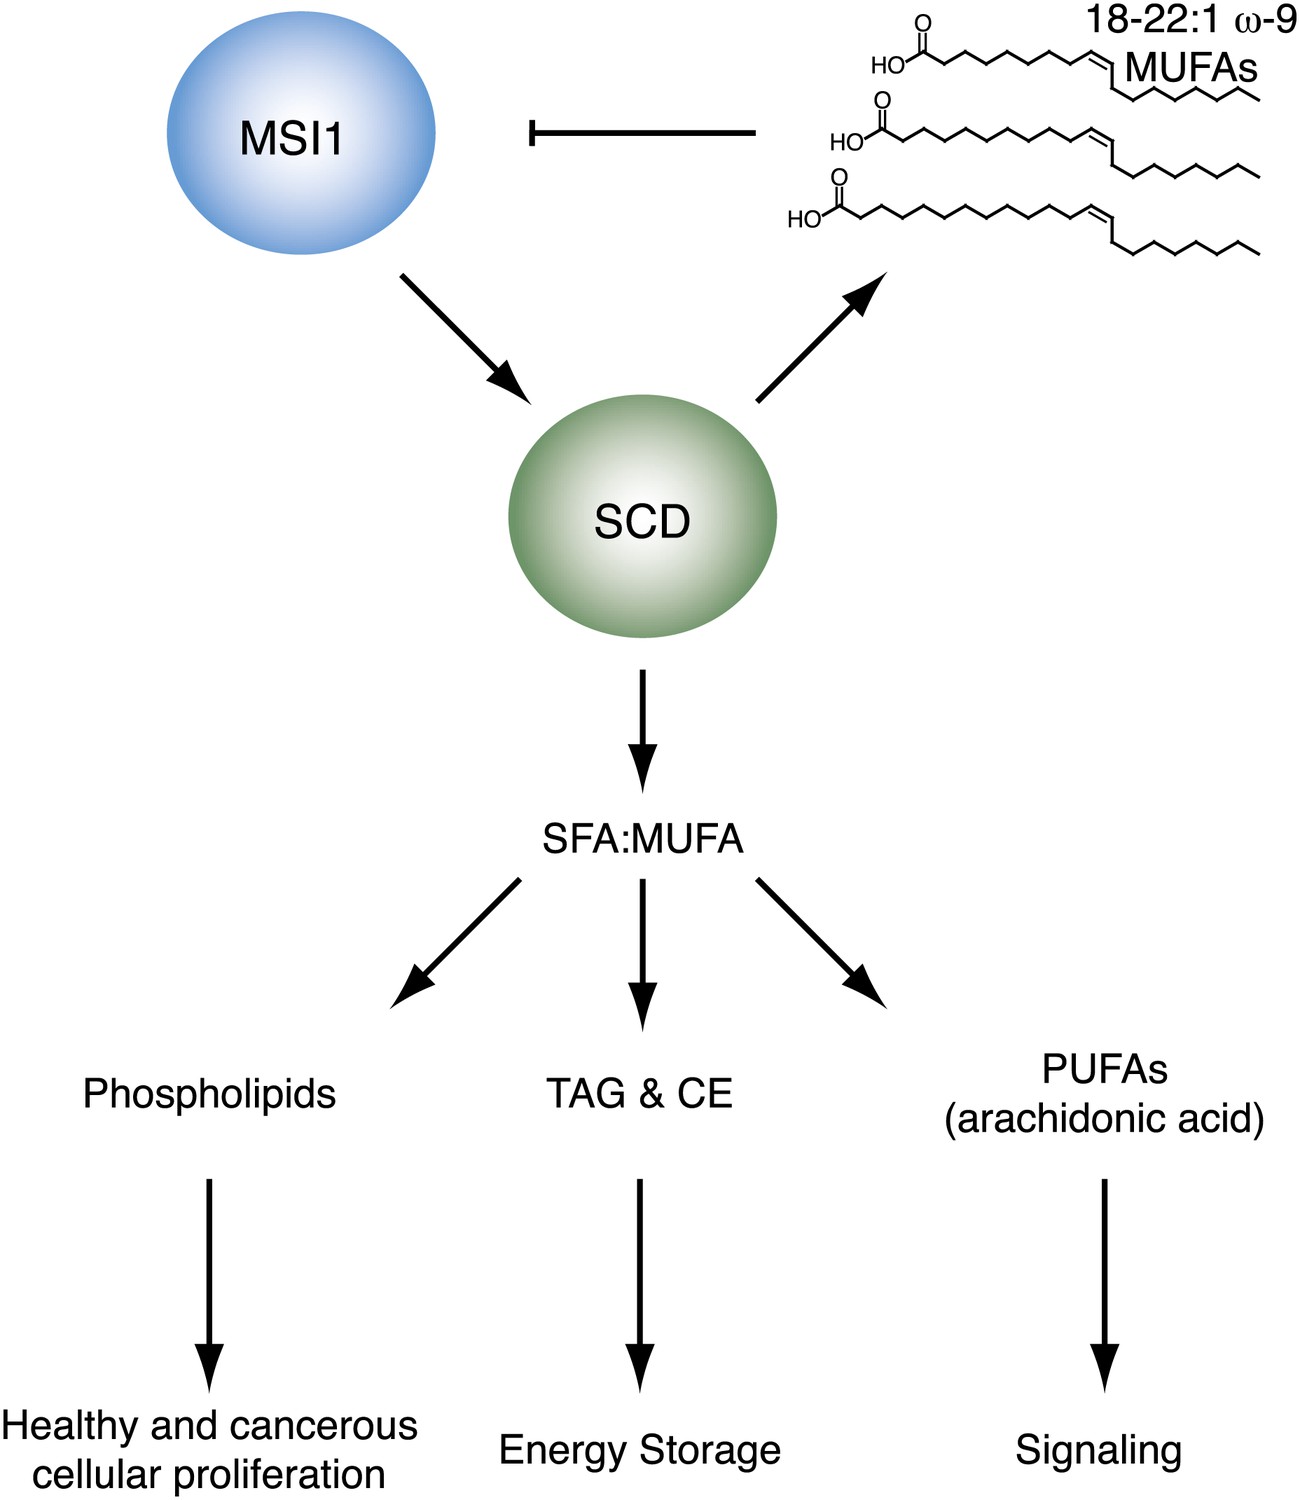
Model of SCD regulation by MSI1, and subsequent downstream consequences of SCD activity changes.
https://doi.org/10.7554/eLife.02848.019Videos
Video 1
This video is a representative segment of an MD trajectory of MSI1 bound to oleic acid.
https://doi.org/10.7554/eLife.02848.013Tables
Table 1
Structure-activity relationship analysis demonstrates specificity of inhibition
| A | ||||
|---|---|---|---|---|
| Compound name | CID | Screen score | FP Ki, app (µM) | F–EMSA Ki, app (µM) |
| Chembridge 7409829 | 28425 | 0.045 | 15 ± 2.8 | 54 ± 22 |
| Aurintricarboxylic Acid (ATA) | 2259 | 0.053 | 0.23 ± 0.03 | 1.5 ± 0.14 |
| GW7647 | 3397731 | −0.028 | 6.5 ± 0.4 | 21 ± 0.8 |
| Oleic Acid | 445639 | −0.005 | 1.2 ± 0.4 | 1.4 ± 0.7 |
| B | ||||
|---|---|---|---|---|
| Compound name | Structure | Code | FP Ki, app (µM) | F–EMSA Ki, app (µM) |
| Oleic acid | 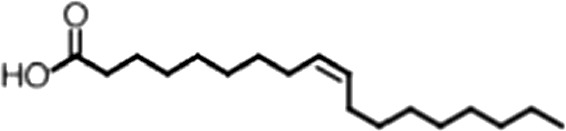 | 18:1 ω-9 | 1.2 ± 0.4 | 1.4 ± 0.7 |
| Eicosenoic acid | 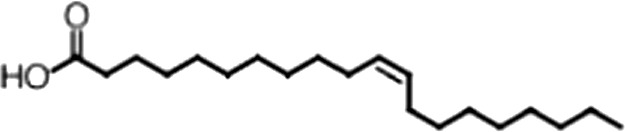 | 20:1 ω-9 | 1.2 ± 0.4 | 1.7 ± 0.6 |
| Erucic acid | 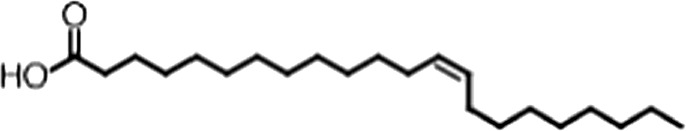 | 22:1 ω-9 | 0.64 ± 0.2 | 0.82 ± 0.03 |
| Nervonic acid | 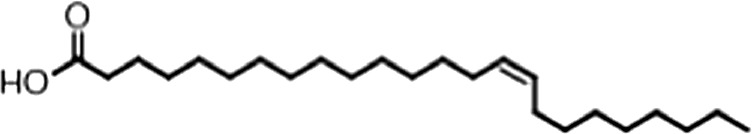 | 24:1 ω-9 | 47 ± 30 | 23 ± 8 |
| Palmitoleic acid | 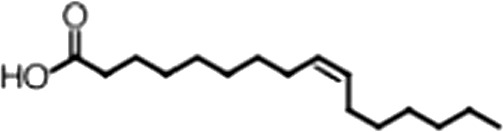 | 16:1 ω-7 | 5.3 ± 0.5 | 13 ± 0.9 |
| Linoleic acid | 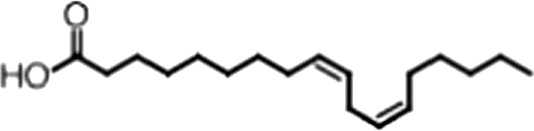 | 18:2 ω-6, 9 | 2.2 ± 0.2 | 1.2 ± 0.03 |
| Arachidonic acid | 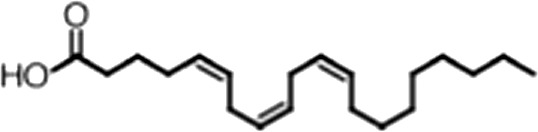 | 20:4 ω-6, 9, 12, 15 | 3.0 ± 0.2 | 1.1 ± 0.3 |
| Oleoyl-CoA | 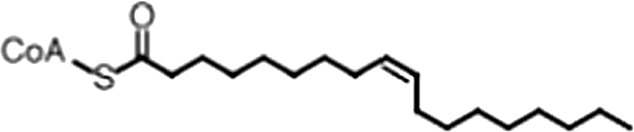 | (18:1 ω-9) | 8.1 ± 0.3 | 4.0 ± 0.2 |
| Erucyl-CoA | 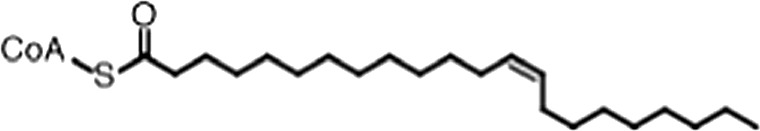 | (18:1 ω-9) | 4.1 ± 0.9 | 0.62 ± 0.2 |
| Ricinoleic acid | 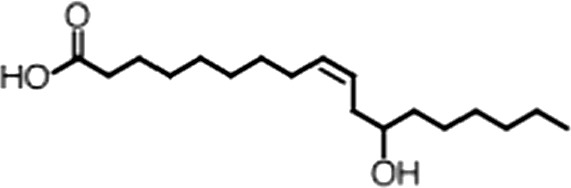 | (18:1 ω-9) | No inh. | 18 ± 9 |
| Oleamide | 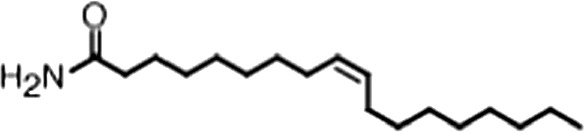 | (18:1 ω-9) | No inh. | No inh. |
| Ethyl oleate | 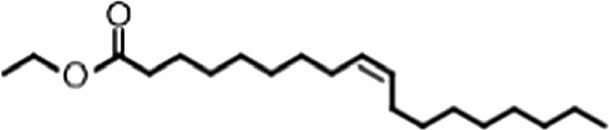 | (18:1 ω-9) | No inh. | No inh. |
| 4-Methylumbelliferyl Oleate | 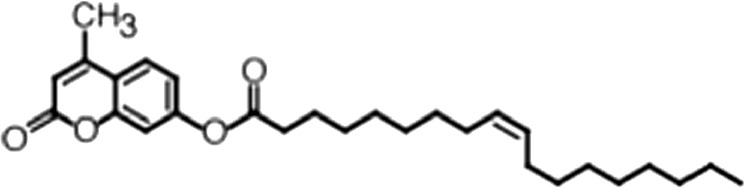 | (18:1 ω-9) | No inh. | No inh. |
| Elaidic acid | 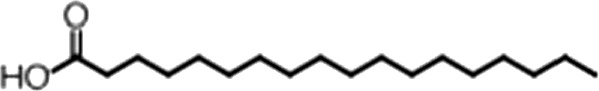 | 18:1(trans) | No inh. | No inh. |
| Stearic acid | 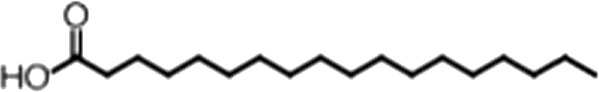 | 18:0 | No inh. | No inh. |
| Palmitic acid | 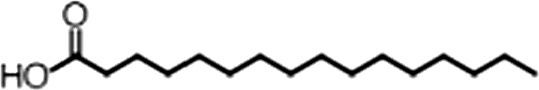 | 16:0 | No inh. | No inh. |
| Myristic acid | 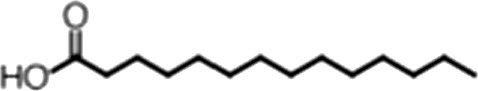 | 14:0 | No inh. | No inh. |
-
(A) Small molecule screen hits. Compound ID (CID) refers to each compound's LOPAC identification number. Screen scores were calculated by normalizing the polarization value of each compound to the no protein and no compound controls, as described in the supplemental methods. After the screen was complete, compounds that scored as hits were confirmed by FP and F–EMSA dose response experiments. Apparent inhibition constants (Ki, app) are the average and standard deviation of at least three independent experiments. (B) The code = carbon number:number of double bonds, followed by the position of the double bonds from the aliphatic end of the fatty acid. Where a fatty acid is modified, the parental fatty acid numerical code is given in parentheses for comparison purposes. FP and F-EMSA dose response results are reported as the average and standard deviation of at least three independent experiments.
Download links
A two-part list of links to download the article, or parts of the article, in various formats.
Downloads (link to download the article as PDF)
Open citations (links to open the citations from this article in various online reference manager services)
Cite this article (links to download the citations from this article in formats compatible with various reference manager tools)
Allosteric inhibition of a stem cell RNA-binding protein by an intermediary metabolite
eLife 3:e02848.
https://doi.org/10.7554/eLife.02848


