Three pools of plasma membrane cholesterol and their relation to cholesterol homeostasis
- University of Texas Southwestern Medical Center, United States
Figures
Figure 1
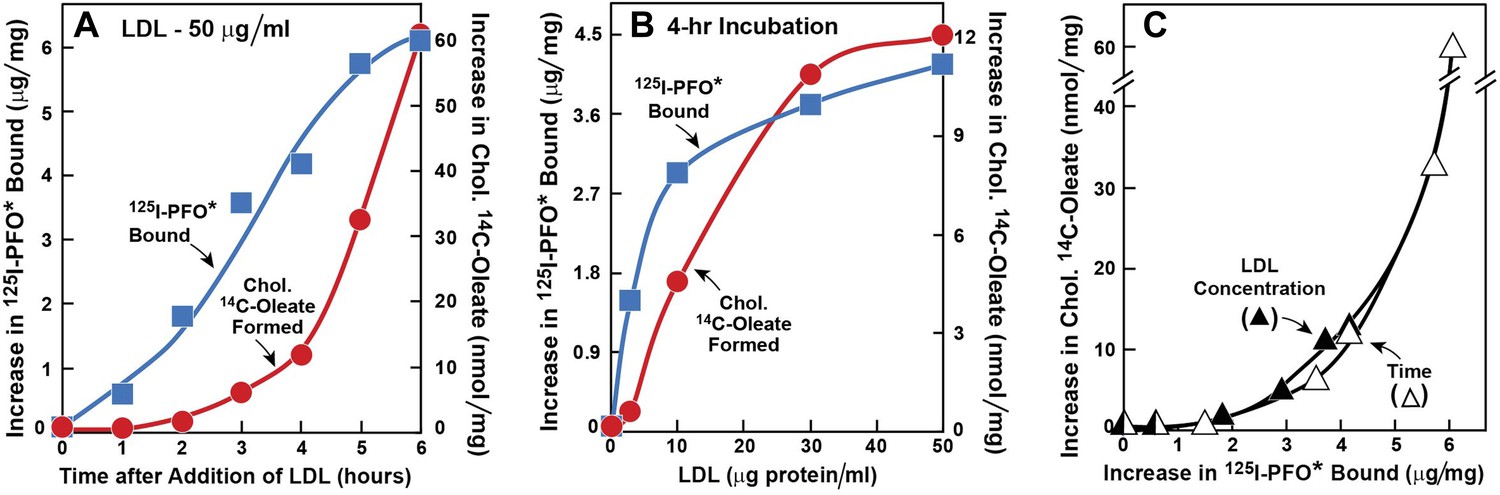
Movement of LDL-derived cholesterol from lysosomes to cell surface and to ER in human fibroblasts.
On day 0, SV-589 cells were set up in medium A at 1 × 10⁵ cells per 60-mm dish. On day 2, cells were switched to lipoprotein-deficient medium C. On day 3, cells were refed with medium C containing 50 μM compactin and 50 μM sodium mevalonate and incubated for 16 hr at 37°C. On day 4, cells received 2 ml of fresh medium D containing 50 μM compactin and 50 μM mevalonate together with either 50 μg protein/ml LDL (A) or the indicated concentration of LDL (B). The cells were incubated for either the indicated time (A) or 4 hr (B) in the presence of either 0.2 mM unlabeled sodium oleate-albumin ( ) or 0.2 mM sodium [14C]oleate-albumin (7780 dpm/nmol) (
 ). For 125I-PFO* binding (), after the indicated incubation, the cells were washed five times as described in ‘Materials and methods’ and then incubated with 2 ml ice-cold buffer A containing 25 μg/ml 125I-PFO* (11 × 103 cpm/μg). After 2 hr at 4°C, the total cell surface binding of 125I-PFO* was determined, and the amount bound after subtraction of the zero-time value (1.6 μg/mg protein) is plotted as ‘Increase in 125I-PFO* Bound’. For measurement of cholesteryl [14C]oleate formation (), after the indicated incubation, the cells were harvested and the increase in content of cholesteryl [14C]oleate was determined after subtraction of the zero-time value (0.09 nmol/mg protein). All values shown are the average of duplicate incubations. (C) Graph showing relation between the increase in 125I-PFO* binding and the increase in cholesteryl [14C]oleate formation. Data taken from (A) and (B).
Figure 2
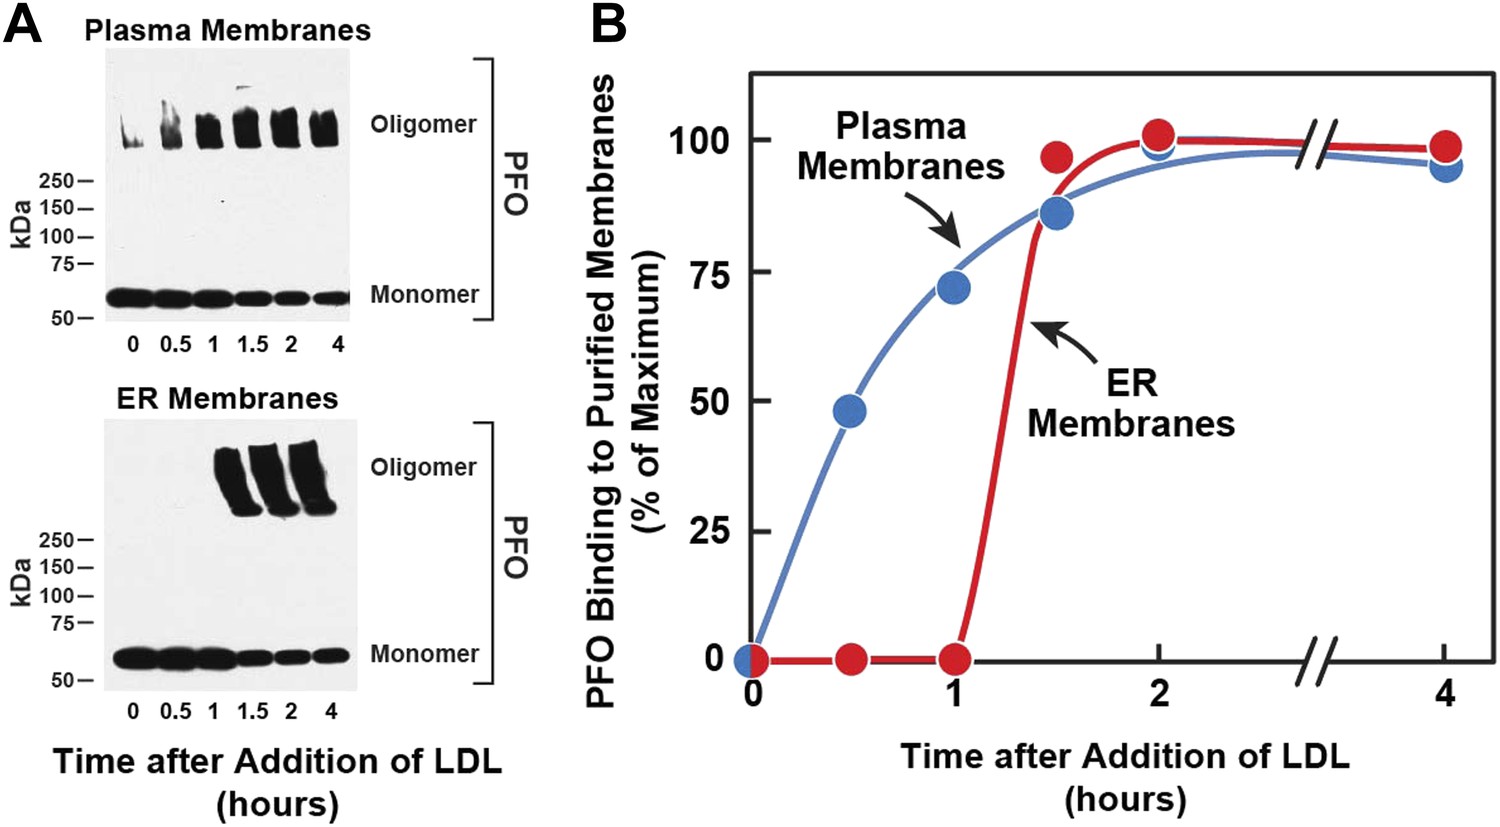
Kinetics of transport of LDL-derived cholesterol from lysosomes to PMs and ER.
On day 0, SV-589 cells were set up in medium A at 1 × 10⁵ cells per 60-mm. On day 2, cells were switched to lipoprotein-deficient medium C. On day 3, cells were treated with fresh medium B containing 50 μM compactin and 50 μM sodium mevalonate and then incubated for 16 hr at 37°C. On day 4, each monolayer received 2 ml of fresh medium E containing 50 μM compactin, 50 μM mevalonate, and 50 μg protein/ml of LDL. Groups of 18 dishes were incubated at 37°C for the indicated times, after which each monolayer was washed with PBS at room temperature and then treated with 2 ml of fresh medium E containing 50 μM compactin and 50 μM mevalonate for 15 min at 37°C. Six dishes from each group were pooled for purification of PMs, and the remaining 12 dishes were pooled for purification of ER membranes, as described in ‘Materials and methods’. Purified membranes were incubated with PFO for 1 hr at 37°C as described in ‘Materials and methods’. (A) Oligomer formation of PFO was assessed by SDS-PAGE and immunoblotting with an antibody against the His tag. Exposure time for the films was 10 s. (B) Densitometric analysis of the scanned gel was performed to quantify the percentage of PFO in its oligomeric form relative to the total (oligomer + monomer) for each time point. The percentage of oligomer formed at the 2-hr time point (50% for PM; 80% for ER) was designated as 100%.
Figure 3 with 1 supplement
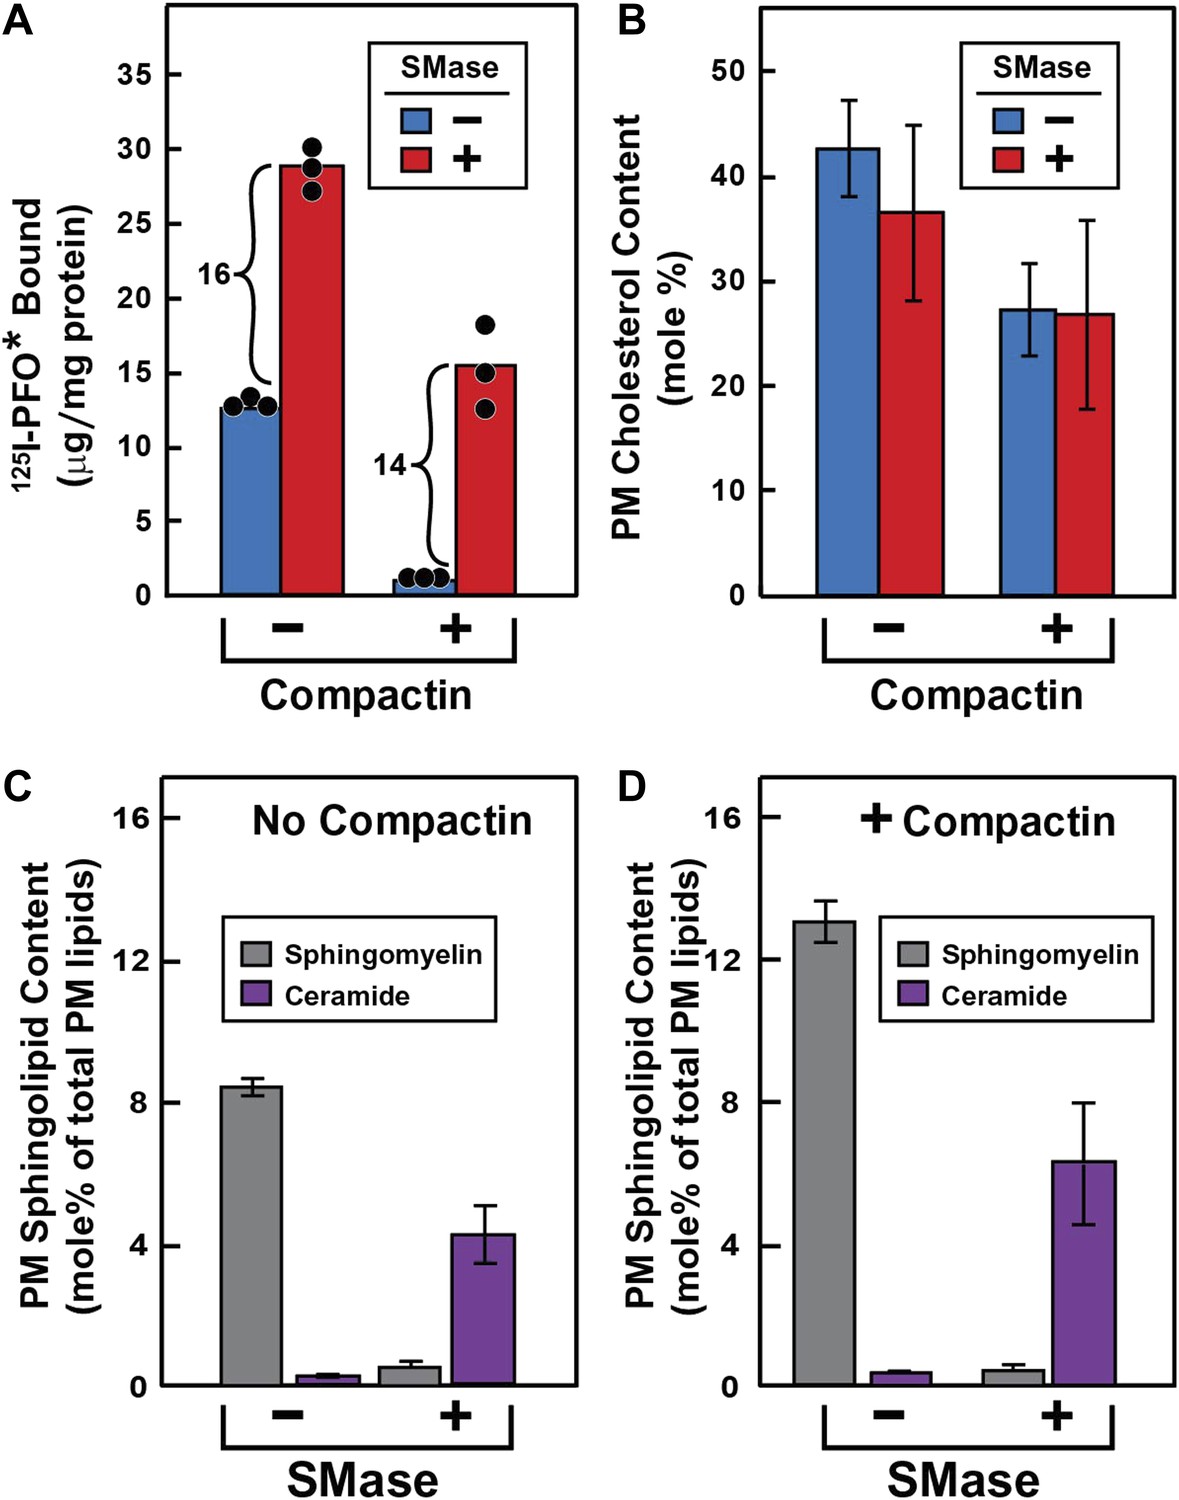
Effect of SMase treatment of human fibroblasts on amount of cell surface binding of 125I-PFO* (A) and PM content of SM and ceramide (B–D).
On day 0, SV-589 cells were set up in medium A at 1 × 10⁵ cells per 60-mm dish (A–D). On day 2, cells were switched to lipoprotein-deficient medium C. On day 3, cells were treated with fresh medium B containing 50 μM sodium mevalonate in the presence or absence of 50 μM compactin as indicated. On day 4, each monolayer received fresh medium B containing 50 μM mevalonate in the absence or presence of 50 μM compactin and 100 milliunits/ml of SMase as indicated. (A) 125I-PFO* binding. After incubation for 15 min at 37°C, the cells were washed five times as described in ‘Materials and methods’ and then incubated with 2 ml of ice-cold buffer A containing 25 μg/ml 125I-PFO* (11 × 103 cpm/μg). After 2 hr at 4°C, the total amount of cell surface binding of 125I-PFO* was determined. Each bar represents the mean of triplicate incubations with individual values shown. (B–D) Lipid measurements. Cells were cultured under identical condition as described above. For each treatment, six 60-mm dishes were pooled together for purification of PMs by surface biotinylation as described in ‘Materials and methods’. Lipids were extracted from the membranes, and the content of cholesterol (B), SM (C and D), and ceramide (C and D) were measured as described in ‘Materials and methods’. The data represent the mean ± SEM obtained from three independent experiments. Each individual data point denotes the average of duplicate measurements of each pooled sample. Bracketed numbers denote the increase in 125I-PFO* binding resulting from SMase treatment.
Figure 3—figure supplement 1
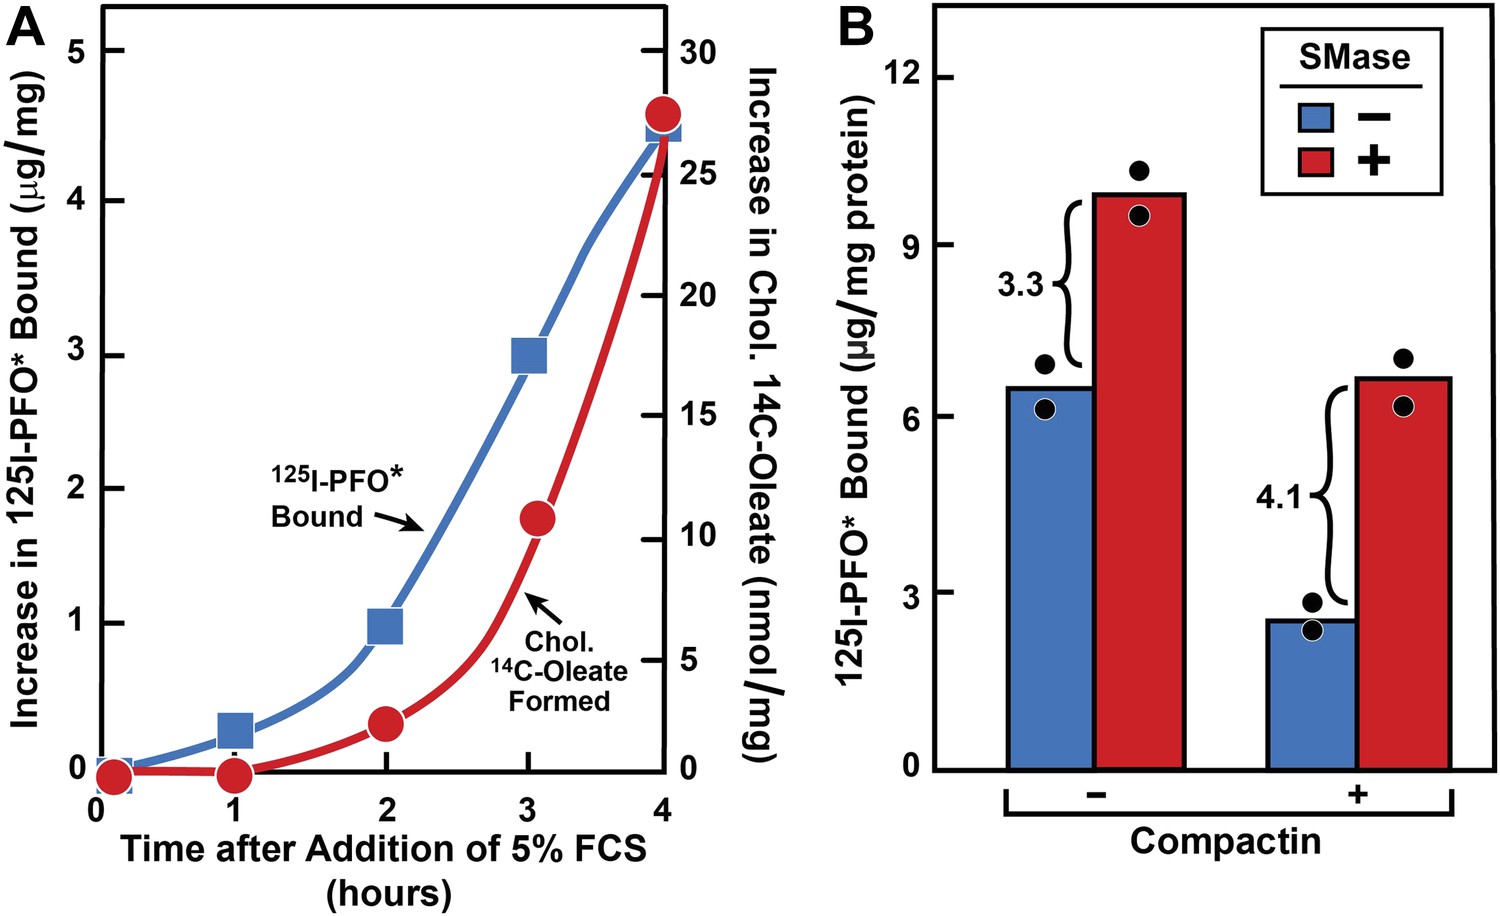
Movement of FCS-derived cholesterol and effect of SMase treatment in hamster cells.
(A) Movement of FCS-derived cholesterol from lysosomes to cell surface and to ER in hamster cells. On day 0, CHO-7 cells were set up in lipoprotein-deficient medium G at 3 × 10⁵ cells per 60-mm dish. On day 2, cells were switched to medium G containing 50 μM compactin and 50 μM sodium mevalonate and incubated for 16 hr at 37°C. On day 3, cells received 2 ml of fresh medium H containing 50 μM compactin and 50 μM mevalonate. After incubation for the indicated time with 5% FCS (containing lipoprotein-cholesterol) in the presence of either 0.2 mM unlabeled sodium oleate-albumin () or 0.2 mM sodium [14C]oleate-albumin (4466 dpm/nmol) (), the cells were harvested for assays. For 125IPFO* binding (), after the indicated time the cells were washed five times as described in ‘Materials and methods’ and then incubated with 2 ml ice-cold buffer A containing 25 μg/ml 125IPFO* (45 × 103 cpm/μg). After 2 hr at 4°C, the total cell surface binding of 125I-PFO* was determined, and the amount bound after subtraction of the zero-time value (0.4 μg/mg protein) is plotted as ‘Increase in 125I-PFO* Bound’. For measurement of cholesteryl [14C]oleate formation (), after the indicated time the cells were harvested, and the increase in content of cholesteryl [14C]oleate was determined after subtraction of the zero-time value (0.0 nmol/mg protein). All values shown are the average of duplicate incubations. (B) Effect of SMase treatment of hamster cells on amount of cell surface binding of 125I-PFO*. On day 0, CHO-K1 cells were set up in medium F at 4 × 10⁵ cells per 60-mm dish. On day 1, cells were switched to lipoprotein-deficient medium G. On day 2, cells were treated with fresh medium G containing 50 μM sodium mevalonate in the presence or absence of 10 μM compactin as indicated. On day 3, each monolayer received fresh medium G containing 50 μM mevalonate in the absence or presence of 10 μM compactin and 100 milliunits/ml of SMase as indicated. After incubation for 30 min at 37°C, the cells were washed five times as described in ‘Materials and methods’ and then incubated with 2 ml of ice-cold buffer A containing 25 μg/ml 125I-PFO* (10.5 × 10³ cpm/μg). After 2 hr at 4°C, the total amount of cell surface binding of 125I-PFO* was determined. Each bar represents the average of duplicate incubations with individual values shown. Bracketed numbers denote the increase in 125I-PFO* binding resulting from SMase treatment.
Figure 4
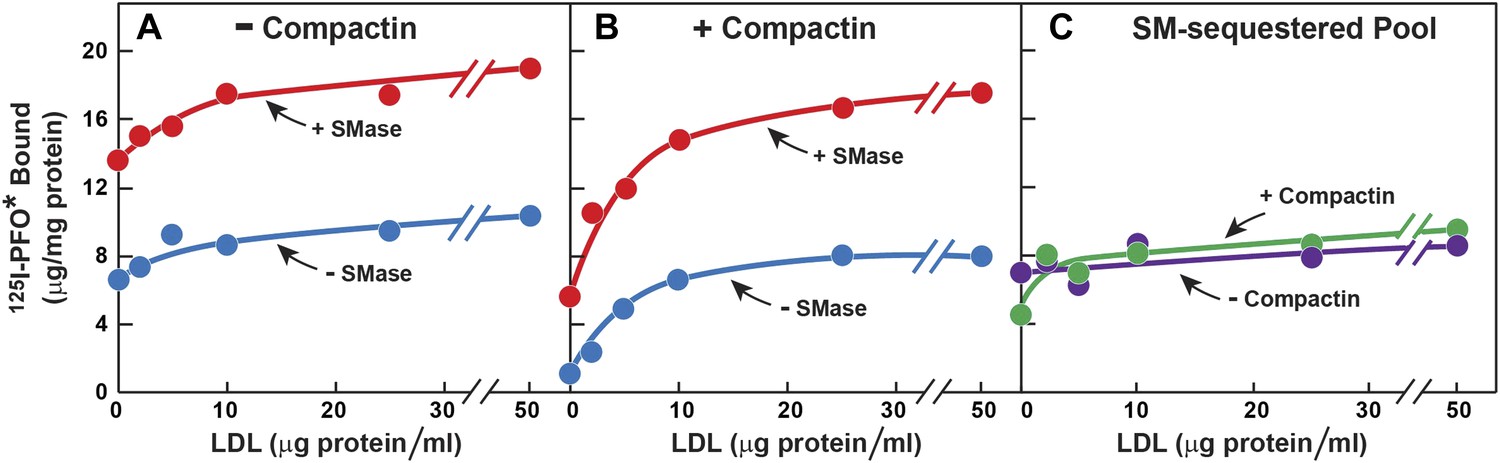
Effect of LDL on SM-sequestered pool of PM cholesterol.
(A and B) On day 0, SV-589 cells were setup in medium A at 1 × 10⁵ cells per 60-mm dish. On day 2, cells were switched to lipoprotein-deficient medium C. On day 3, cells were treated with fresh medium C containing 50 μM mevalonate in the absence (A) or presence (B) of 50 μM compactin. On day 4, each monolayer received fresh medium D containing 50 μM mevalonate in the absence (A) or presence (B) of 50 μM compactin and the indicated concentration of LDL. After incubation for 5 hr at 37°C, the cells were washed twice with PBS at room temperature and treated with fresh medium D containing 50 μM mevalonate in the absence (A) or presence (B) 50 μM compactin and with or without 180 milliunits/ml SMase as indicated. After incubation for 1 hr at 37°C, the cells were washed five times as described in ‘Materials and methods’ and then incubated with 2 ml of ice-cold buffer A containing 25 μg/ml 125I-PFO* (8 × 10³ cpm/μg). After 2 hr at 4°C, the total amount of cell surface binding of 125I-PFO* was determined. Each value represents the mean of duplicate incubations. (C) Graph showing the SM-sequestered pool of cholesterol in the absence and presence of compactin plotted as a function of the concentration of LDL. The SM-sequestered pool was calculated by subtracting the amount of 125I-PFO* bound in the absence of SMase from that bound after SMase treatment.
Figure 5
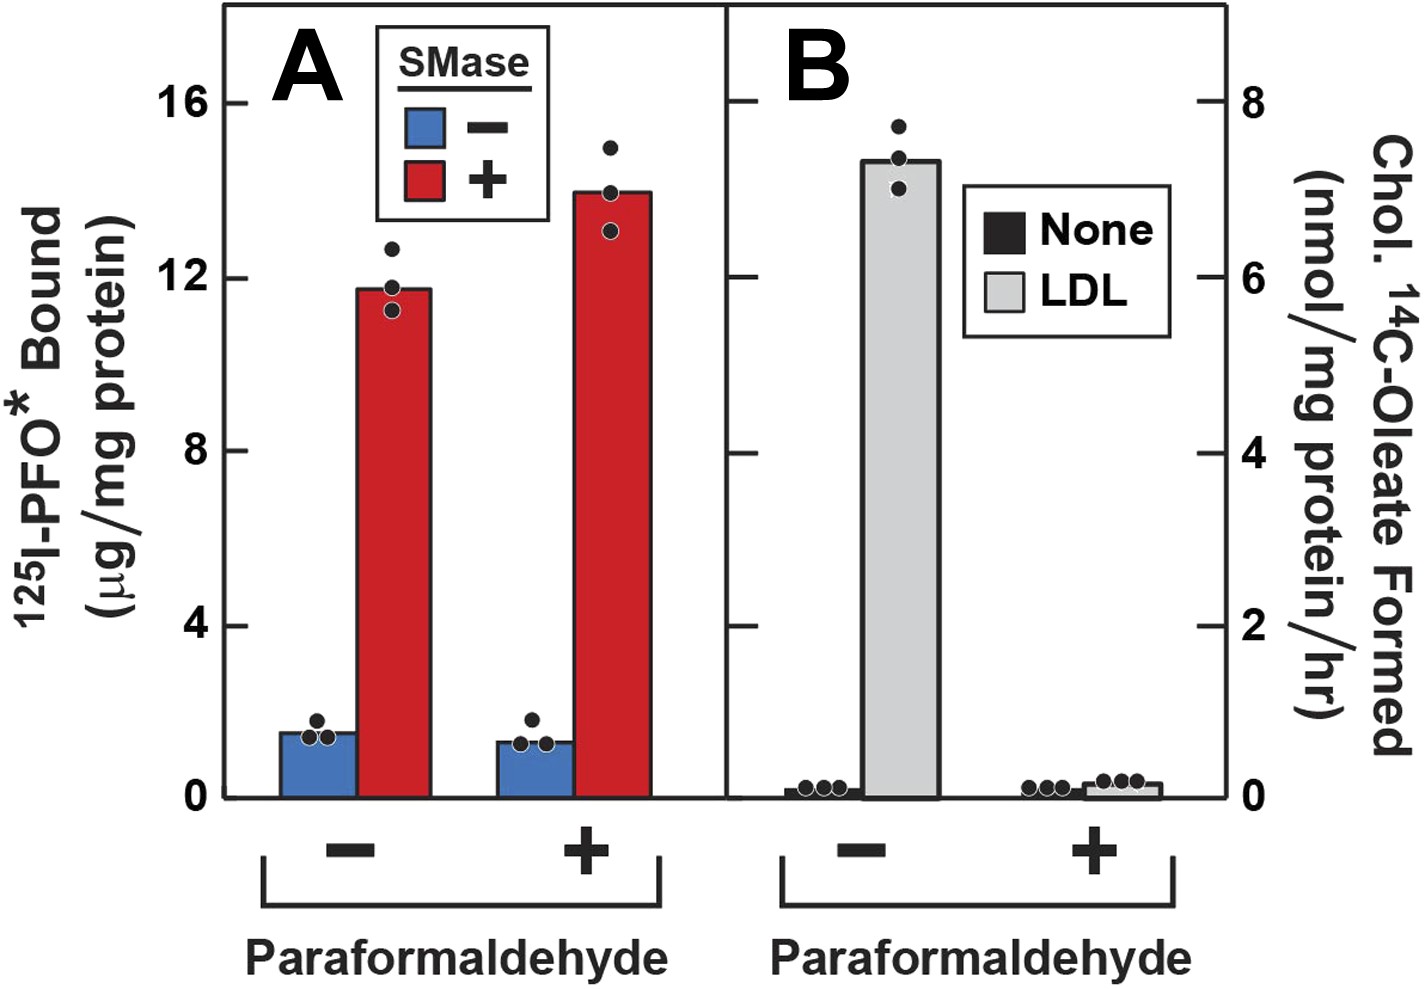
Effect of paraformaldehyde on 125I-PFO* binding to human fibroblasts after treatment with SMase.
On day 0, SV-589 cells were setup in medium A at 1 × 10⁵ cells per 60-mm dish. On day 2, cells were switched to lipoprotein-deficient medium C. On day 3, cells were treated with fresh medium C containing 50 μM compactin and 50 μM mevalonate and incubated for 16 hr at 37°C. On day 4, each monolayer was washed with ice-cold PBS at 4°C and treated with 2 ml ice-cold PBS in the presence or absence of 1% (vol/vol) paraformaldehyde as indicated. After incubation at 4°C for 45 min, the paraformaldehyde-containing medium was removed, and each monolayer was washed four times with buffer A at room temperature. (A) 125I-PFO* binding. After treatment with paraformaldehyde and washing, cells were incubated with 2 ml of fresh medium D containing 50 μM mevalonate and 50 μM compactin in the presence or absence of 100 milliunits/ml SMase as indicated. After incubation for 30 min at 37°C, the cells were washed five times as described in ‘Materials and methods’ and then incubated with 2 ml of ice-cold buffer A containing 25 μg/ml 125I-PFO* (64 × 103 cpm/μg). After 2 hr at 4°C, the total amount of cell surface binding of 125I-PFO* was determined. (B) Cholesterol esterification. After treatment with paraformaldehyde and washing, each monolayer received 2 ml of fresh medium D containing 50 μM mevalonate and 50 μM compactin in the presence or absence of 50 μg protein/ml LDL. After incubation for 4 hr, 0.2 mM sodium [14C]oleate-albumin (7733 dpm/nmol) was added to the cell and incubated for additional 2 hr. After the desired incubation, the cells were harvested and the content of cholesteryl [14C]oleate was determined. (A and B) Each bar represents the mean of triplicate incubations with the individual values shown. Paraformaldehyde treatment did not significantly affect the cellular uptake of [14C]oleate as indicated by parallel measurements of the incorporation of [14C]oleate into [14C]triglycerides. In the absence of paraformaldehyde, the amount of [14C]triglycerides formed (nmol/mg protein per hr) was 51 (no addition) and 43 (+LDL); in the presence of paraformaldehyde, the values were 57 (no addition), and 32 (+LDL). These triglyceride values represent the mean of triplicate incubations. In a separate experiment, the aforementioned mean triglyceride values were 74, 46, 57, and 66 nmol/mg per hr, respectively.
Figure 6
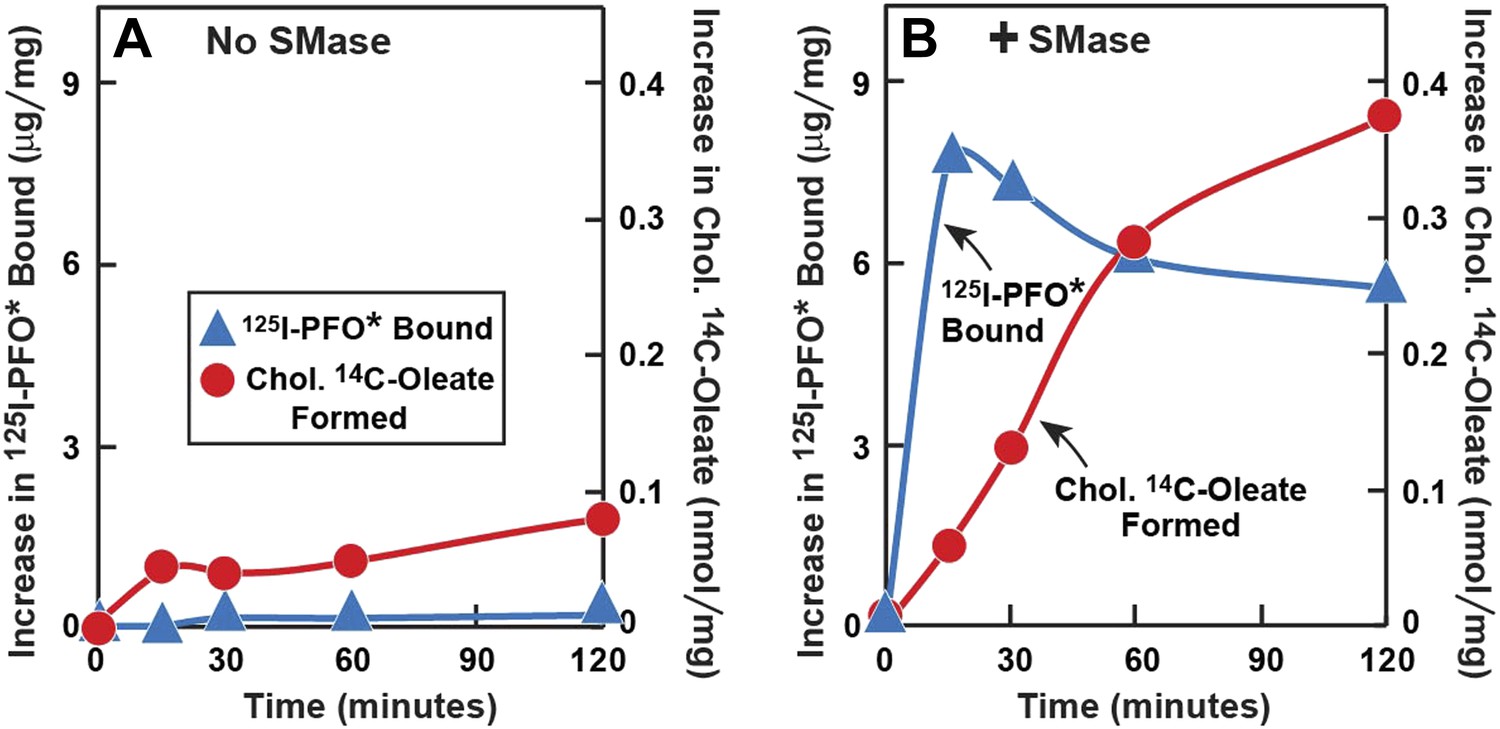
Time course of 125I-PFO* binding and cholesterol esterification in human fibroblasts after treatment with SMase.
On day 0, SV-589 cells were setup in medium A at 1 × 10⁵ cells per 60-mm dish. On day 2, cells were switched to lipoprotein-deficient medium C. On day 3, cells were treated with fresh medium C containing 50 μM compactin and 50 μM mevalonate and incubated for 16 hr at 37°C. On day 4, each dish received fresh medium D containing 50 μM compactin and 50 μM mevalonate. Half of the dishes received 143 milliunits/ml of SMase in the absence ( ) or presence () of 0.2 mM sodium [14C]oleate-albumin (7931 dpm/nmol) for the indicated time. For 125I-PFO* binding () , after the indicated incubation the cells were washed five times as described in ‘Materials and methods’ and then incubated with 2 ml ice-cold buffer A containing 25 μg/ml 125I-PFO* (10 × 103 cpm/μg). After 2 hr at 4°C, the total cell surface binding of 125I-PFO* was determined, and the amount bound after subtraction of the zero-time value (1 µg/mg protein) is plotted as ‘Increase in 125I-PFO* Bound’. For measurement of cholesteryl [14C]oleate formation (), the cells were harvested and the content of cholesteryl [14C]oleate was determined. Each value represents the average of duplicate incubations.
Figure 7
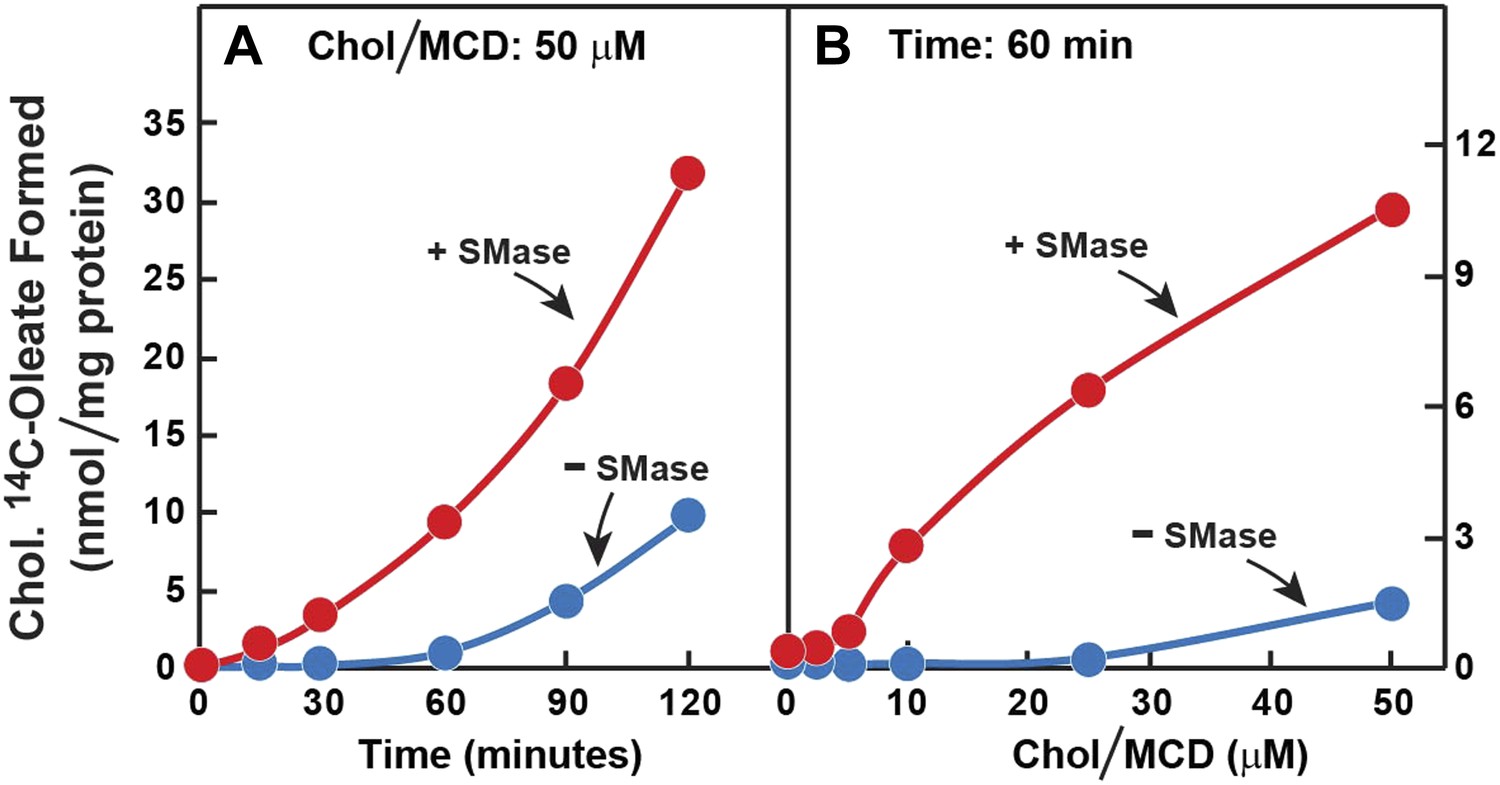
Prior incubation of human fibroblasts with SMase stimulates transport of cholesterol from PM to ER.
On day 0, SV-589 cells were set up in medium A at 1 × 10⁵ cells per 60-mm dish. On day 2, cells were switched to lipoprotein-deficient medium C. On day 3, cells were treated with fresh medium C containing 50 μM compactin and 50 μM mevalonate and then incubated for 16 hr at 37°C. On day 4, each monolayer received 2 ml of fresh medium C containing 50 μM mevalonate and 50 μM compactin in the absence or presence of 100 milliunits/ml of SMase as indicated. After incubation with SMase for 15 min at 37°C, the cells in (A) received a direct addition of 50 cholesterol/MCD together with 0.2 mM sodium [14C]oleate-albumin (8572 dpm/nmol) and were then incubated for the indicated time, and the cells in (B) received a direct addition of the indicated concentrations of cholesterol/MCD together with 0.2 mM sodium [14C]oleate-albumin (6948dpm/nmol) and were then incubated for 1 hr. After the indicated incubations, the cells were harvested and the content of cholesteryl [14C]oleate was determined. Each value represents the average of duplicate incubations.
Figure 8
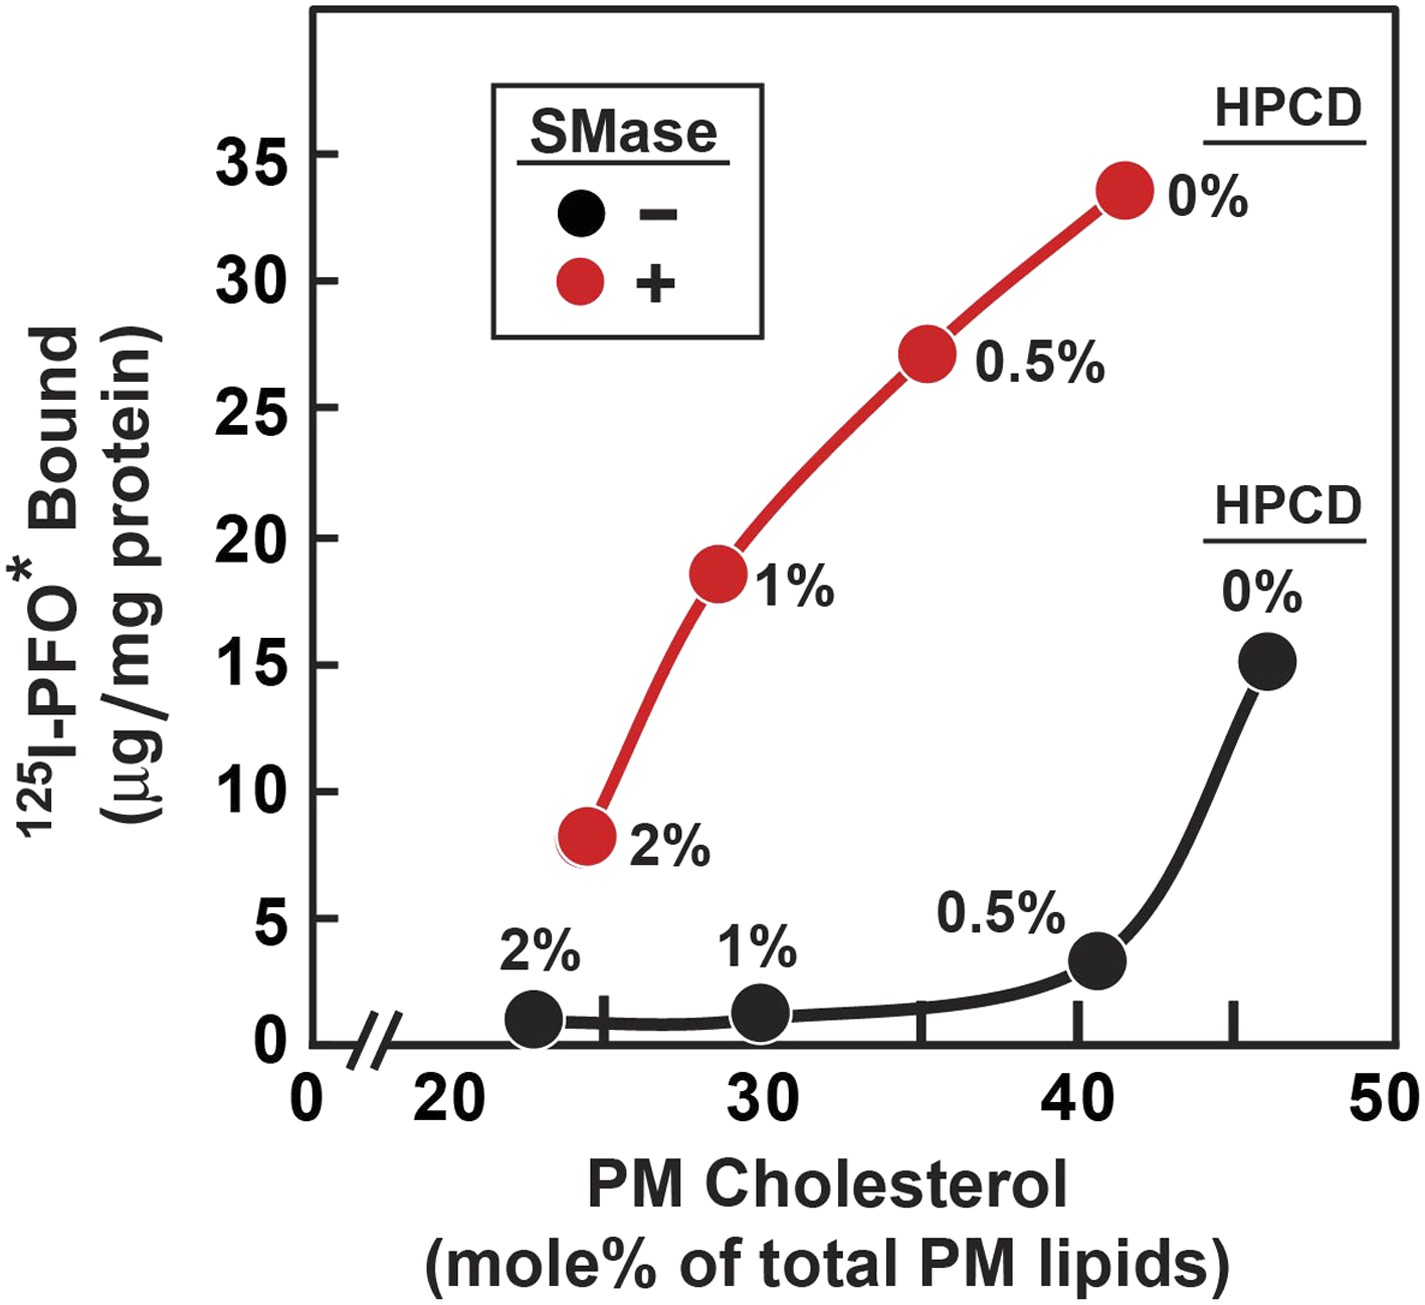
Reduced threshold for 125I-PFO* binding after treatment of human fibroblasts with SMase.
On day 0, SV-589 cells were set up in medium A at 1 × 10⁵ cells per 60-mm dish. On day 3, cells were refed with medium B. On day 4, cells were treated for 1 hr at 37°C in medium B containing 50 µM mevalonate, 50 µM compactin, and 0–2% of HPCD as indicated for each point. The cells were then washed twice with PBS at room temperature, after which each monolayer received fresh medium B containing 50 µM compactin and 50 µM mevalonate in the absence or presence of 100 miliunits/ml of SMase. After incubation for 30 min at 37°C, one set of dishes was used for 125I-PFO* binding and a parallel set was used for PMs purification. For 125I-PFO* binding, cells were washed five times as described in ‘Materials and methods’ and then incubated with 2 ml ice-cold buffer A containing 25 µg/ml 125I-PFO* (10 × 103 cpm/µg) for 2 hr at 4°C. The total amount of cell surface 125I-PFO* binding was determined. Each value represents the average of duplicate incubations. For PM purification, six 60-mm dishes for each HPCD treatment were pooled together, and the PMs were purified as described in ‘Materials and methods’. Lipids were extracted from the PM samples, and the content of unesterified cholesterol, phospholipids, and ceramide was measured. Each value represents the average of duplicate measurements of each pooled sample. The graph shows the amount of cell surface 125I-PFO* binding plotted as a function of the cholesterol content of the PM.
Figure 9
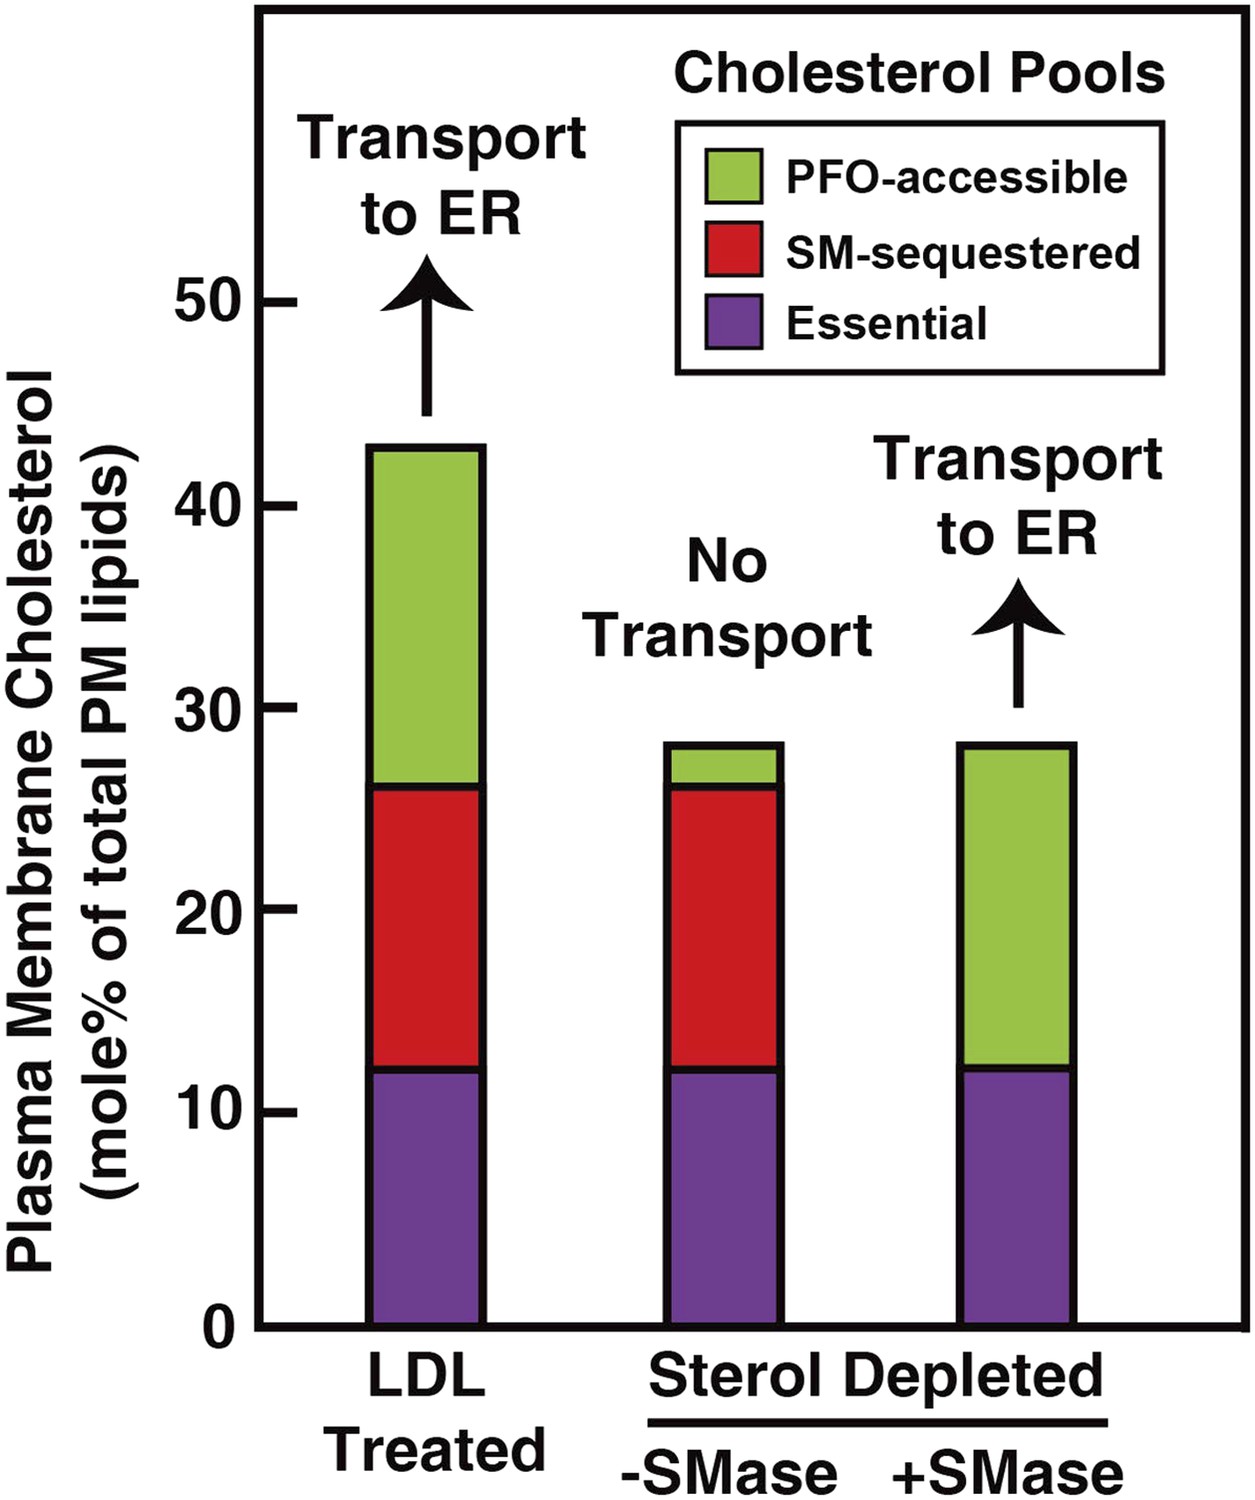
Schematic diagram illustrating the three pools of cholesterol in the PM of human fibroblasts under different conditions.
https://doi.org/10.7554/eLife.02882.013Tables
Table 1
Major subspecies of sphingomyelin and ceramide in sterol-repleted (−compactin) and sterol-depleted (+compactin) PMs from SV-589 cells treated without and with SMase
| Lipid | − Compactin | + Compactin | ||
|---|---|---|---|---|
| Species | − SMase | + SMase | − SMase | + SMase |
| mole % of total PM lipids | ||||
| Sphingomyelin | ||||
| C16:0 | 5.38 ± 0.19 | 0.32 ± 0.02 | 8.04 ± 0.48 | 0.58 ± 0.12 |
| C18:0 | 0.11 ± 0.00 | 0.01 ± 0.00 | 0.16 ± 0.01 | 0.01 ± 0.00 |
| C24:0 | 0.35 ± 0.01 | 0.01 ± 0.00 | 0.55 ± 0.03 | 0.02 ± 0.00 |
| C24:1 | 2.59 ± 0.22 | 0.14 ± 0.01 | 4.41 ± 0.23 | 0.27 ± 0.05 |
| Ceramide | ||||
| C16:0 | 0.04 ± 0.00 | 2.95 ± 0.50 | 0.07 ± 0.01 | 3.93 ± 1.22 |
| C18:0 | 0.00 ± 0.00 | 0.11 ± 0.01 | 0.01 ± 0.00 | 0.15 ± 0.04 |
| C24:0 | 0.01 ± 0.00 | 0.25 ± 0.04 | 0.01 ± 0.00 | 0.36 ± 0.11 |
| C24:1 | 0.02 ± 0.00 | 1.39 ± 0.16 | 0.04 ± 0.00 | 2.14 ± 0.60 |
-
Lipids from the purified PMs isolated from the cells used in Figure 3 were extracted with 85:15 (vol/vol) ethyl acetate: isopropanol, and the contents of the four indicated acyl chain subspecies of SM and ceramide were quantified as described in ‘Materials and methods’. The data are expressed as mole % of total PM lipids and represent the mean ± SEM obtained from three independent experiments with duplicate measurements of each sample. Levels of SM and ceramide with oleoyl (18:1), arachidoyl (20:0), and behenoyl (22:0) acyl chains are not included in this table as their levels were less than 0.1% of total PM lipids.
Download links
A two-part list of links to download the article, or parts of the article, in various formats.
Downloads (link to download the article as PDF)
Open citations (links to open the citations from this article in various online reference manager services)
Cite this article (links to download the citations from this article in formats compatible with various reference manager tools)
Three pools of plasma membrane cholesterol and their relation to cholesterol homeostasis
eLife 3:e02882.
https://doi.org/10.7554/eLife.02882


