Two-signal requirement for growth-promoting function of Yap in hepatocytes
- Howard Hughes Medical Institute, Yale University School of Medicine, United States
- College of Life Sciences, Peking University, China
Figures
Figure 1 with 4 supplements
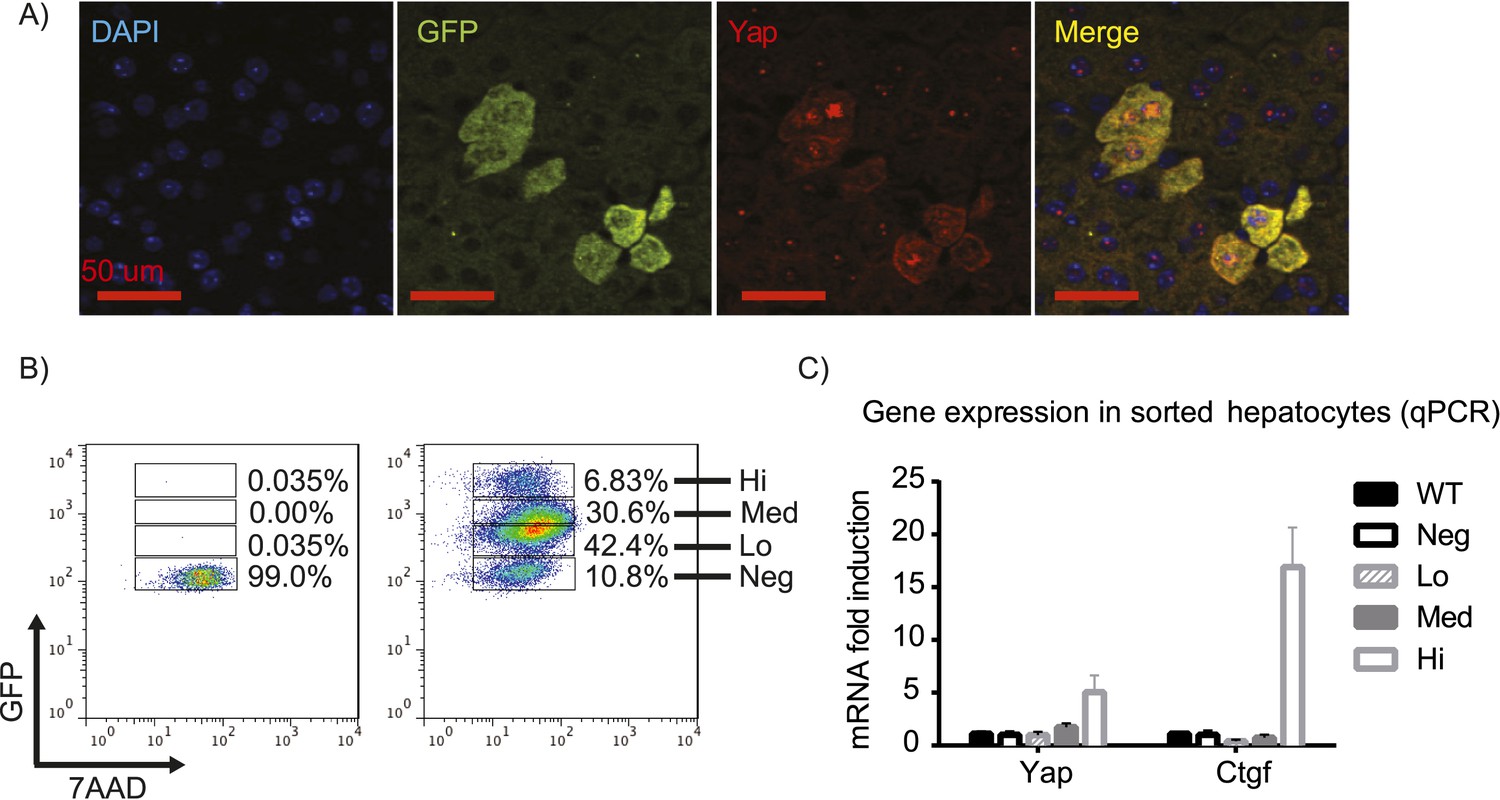
YapKIAlb-Cre strain is a hepatocyte-specific mosaic mouse model of Yap activation.
(A) Detection of exogenous Yap and GFP by immunofluorescent staining of YapKIAlb-Cre liver sections. (B) Flow cytometric analysis of GFP fluorescence in primary hepatocytes. The plots are gated on hepatocytes by forward and side scatter and on live cells by excluding 7-AAD positive events. (C) Expression of Yap and CTGF was determined by qPCR in primary hepatocyte populations sorted based on GFP levels as shown in B.
Figure 1—figure supplement 1
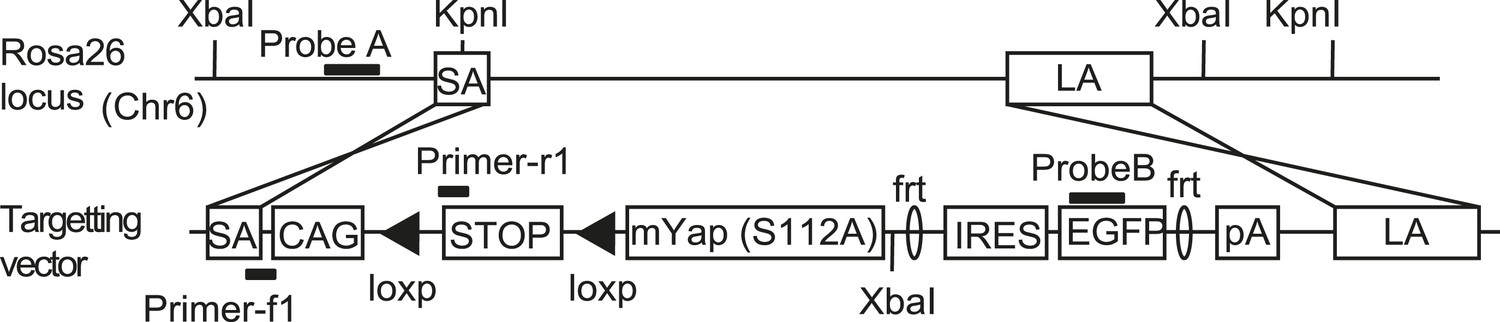
The design of the YapKI mice.
The targeting construct carrying mouse S112A mutant Yap1 followed by IRES-GFP was integrated into Gt(ROSA)26Sor (Rosa26) locus. STOP denotes a strong transcriptional termination signal, removable by loxP recombination.
Figure 1—figure supplement 2
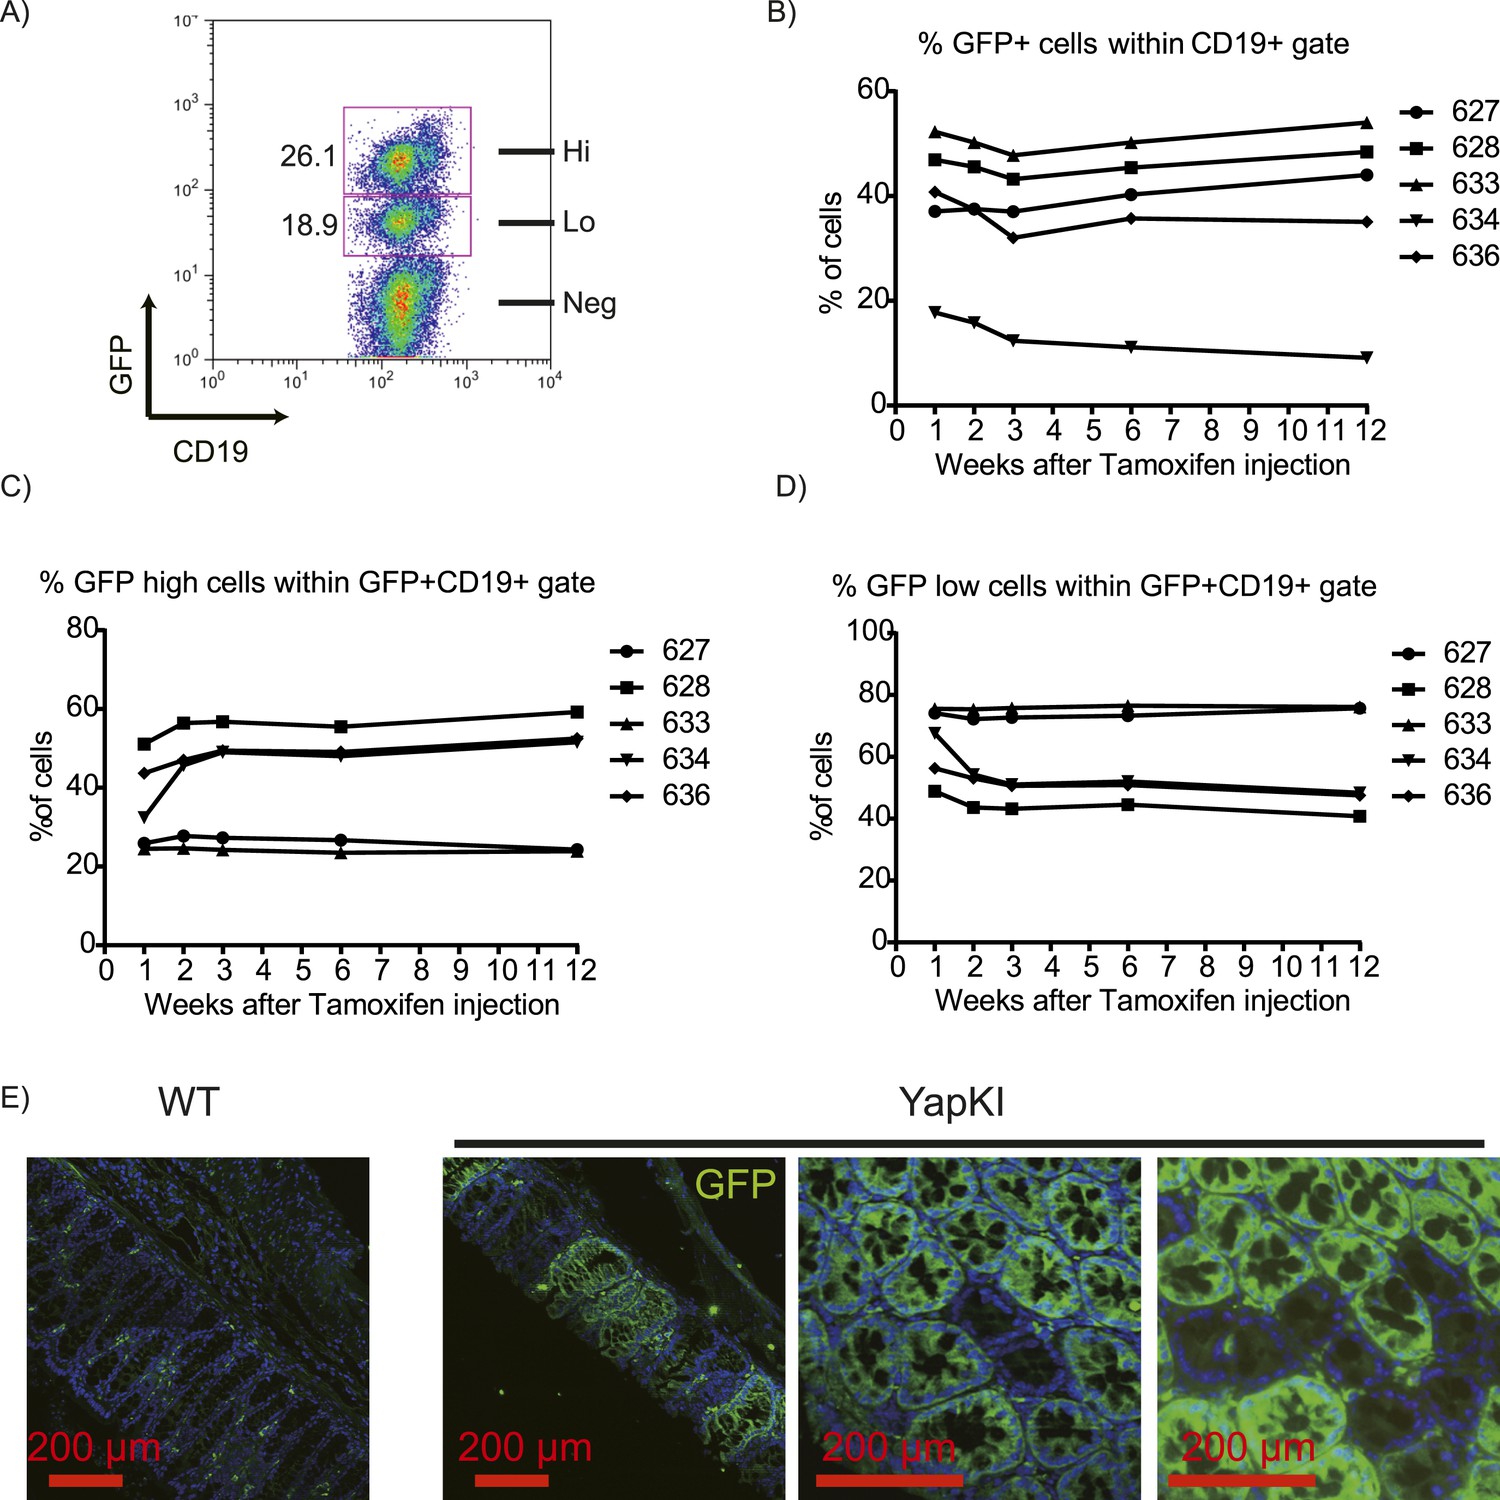
Stable mosaic expression of Rosa26 allele in multiple tissues of YapKI mice.
(A) Flow cytometry analysis of GFP populations in the peripheral blood of YapKICreER mice 4 weeks after tamoxifen induction. CD19 is a marker of B lymphocytes. (B) The proportion of GFP+ B cells (within CD19+ gate); (C) the proportion of GFPhigh cells within GFP+CD19+ gate; (D) the proportion of GFPlow cells within GFP+CD19+ gate in the peripheral blood of YapKICreER after a single tamoxifen injection was determined by flow cytometry weekly for 1 year. Numbers on the right correspond to mouse eartags. (E) Colons of YapKIVillin-Cre mice and WT littermates were stained with GFP antibody (green) and DAPI (blue). Green cells in the lamina propria are autofluorescent macrophages.
Figure 1—figure supplement 3
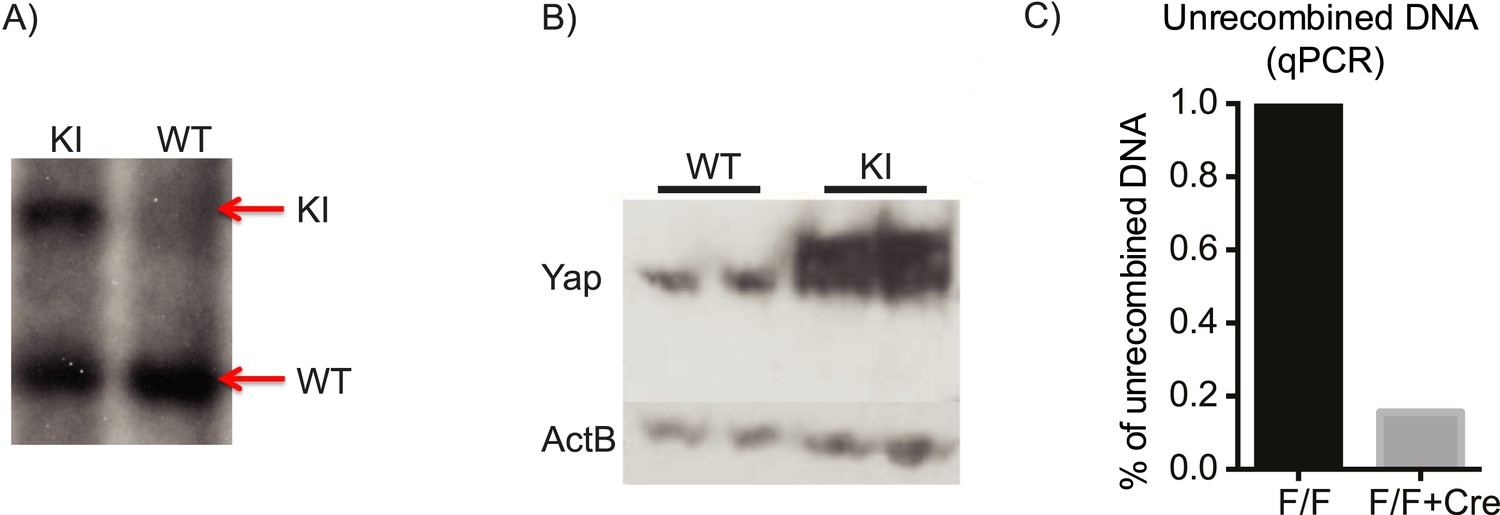
Verification of the correct targeting, expression, and recombination of the YapKI allele.
(A) Southern blot verifying correct integration of the YapKI targeting construct into the Gt(ROSA)26Sor locus. (B) The level of Yap overexpression in YapKIAlb-Cre mice as determined by Western blot. Higher migrating band corresponds to the exogenous Yap (due to the triple flag tag). (C) qPCR on genomic DNA isolated from YapKI (lox-STOP-lox) and YapKIAlb-Cre (lox-STOP-lox + Cre) hepatocytes with primers that amplify only unrecombined (STOP-cassette-containing) region.
Figure 1—figure supplement 4
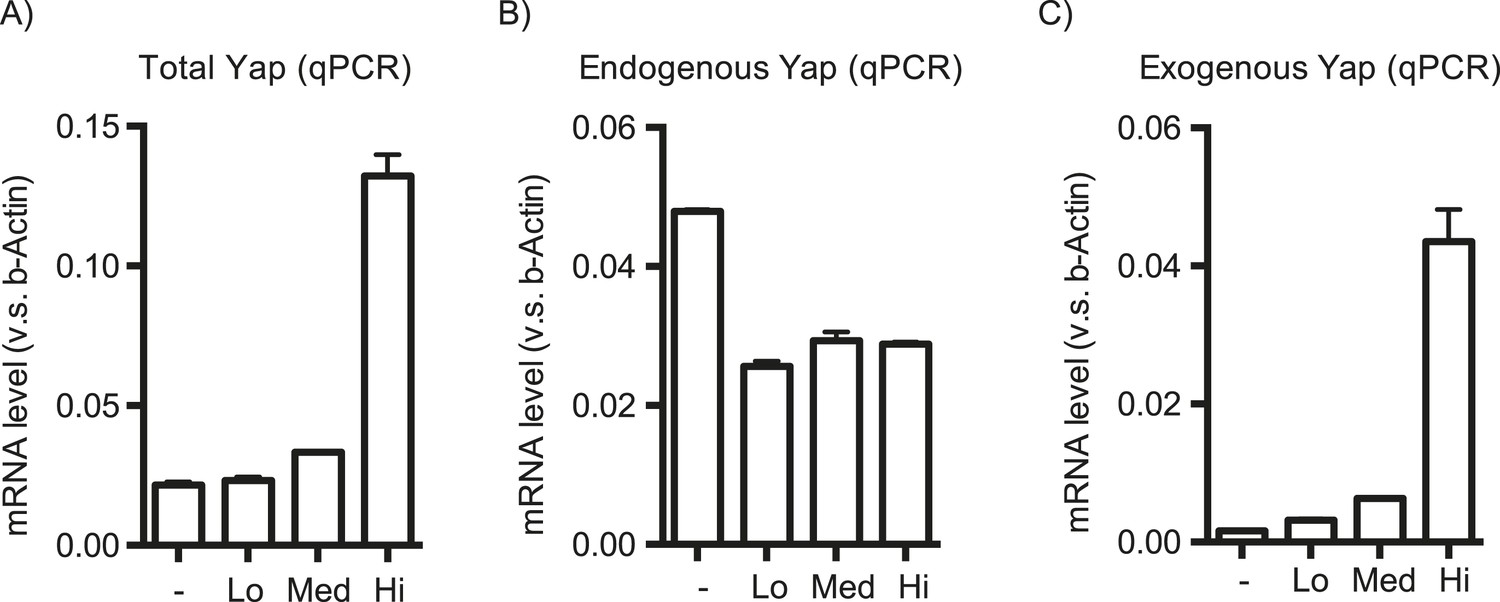
Effect of the YapKI allele on Yap mRNA level.
Yap levels were measured by qPCR in YapKIAlb-Cre hepatocytes sorted based on the GFP levels as described in Figure 1B with primers amplifying the total (A), endogenous (B) or exogenous (C) Yap mRNA.
Figure 2 with 4 supplements
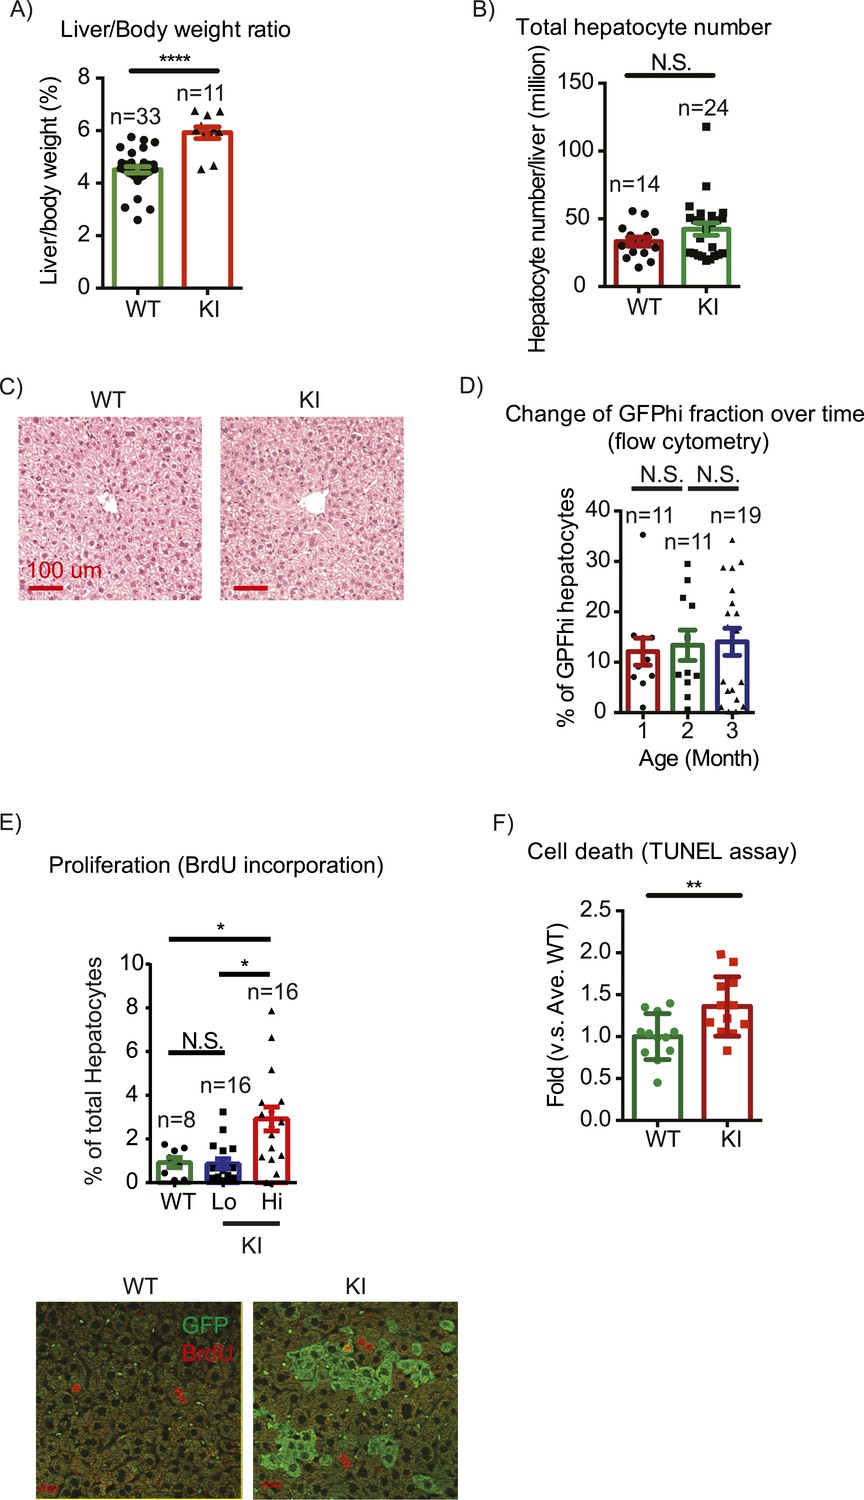
Yap overexpression in hepatocytes does not induce hepatomegaly or clonal expansion at steady state.
(A) Liver/body weight ratios of 1- to 3-month-old YapKIAlb-Cre mice (KI) and littermate controls (WT), n ≥ 11. ****p ≤ 0.0001. (B) Total hepatocyte numbers were determined by quantitative flow cytometry of primary hepatocytes isolated from 1- to 3-month-old mice of the indicated genotypes, n ≥ 14. (C) A representative image of H&E staining performed on liver sections of 6-week-old control (WT) and YapKIAlb-Cre mice (KI). (D) Primary hepatocytes were isolated by collagenase perfusion from YapKIAlb-Cre mice of indicated age groups, and percentage of GFPhigh hepatocytes was determined by flow cytometry; n ≥ 11. (E) Mice were injected with BrdU for 3 consecutive days and liver sections were stained with BrdU and GFP antibodies. Percent of BrdU+ hepatocytes was quantified in liver sections of the controls (WT) and within Yaplow (GFP−) and Yaphigh (GFP+) populations of the YapKIAlb-Cre livers. n ≥ 8. (F) TUNEL-positive nuclei were quantified on liver sections of control (WT) and YapKIAlb-Cre (KI) mice. 3 mice were used for each group and 4 images were taken for each mouse. Each dot represents cell count from each image. **p ≤ 0.01.
Figure 2—figure supplement 1
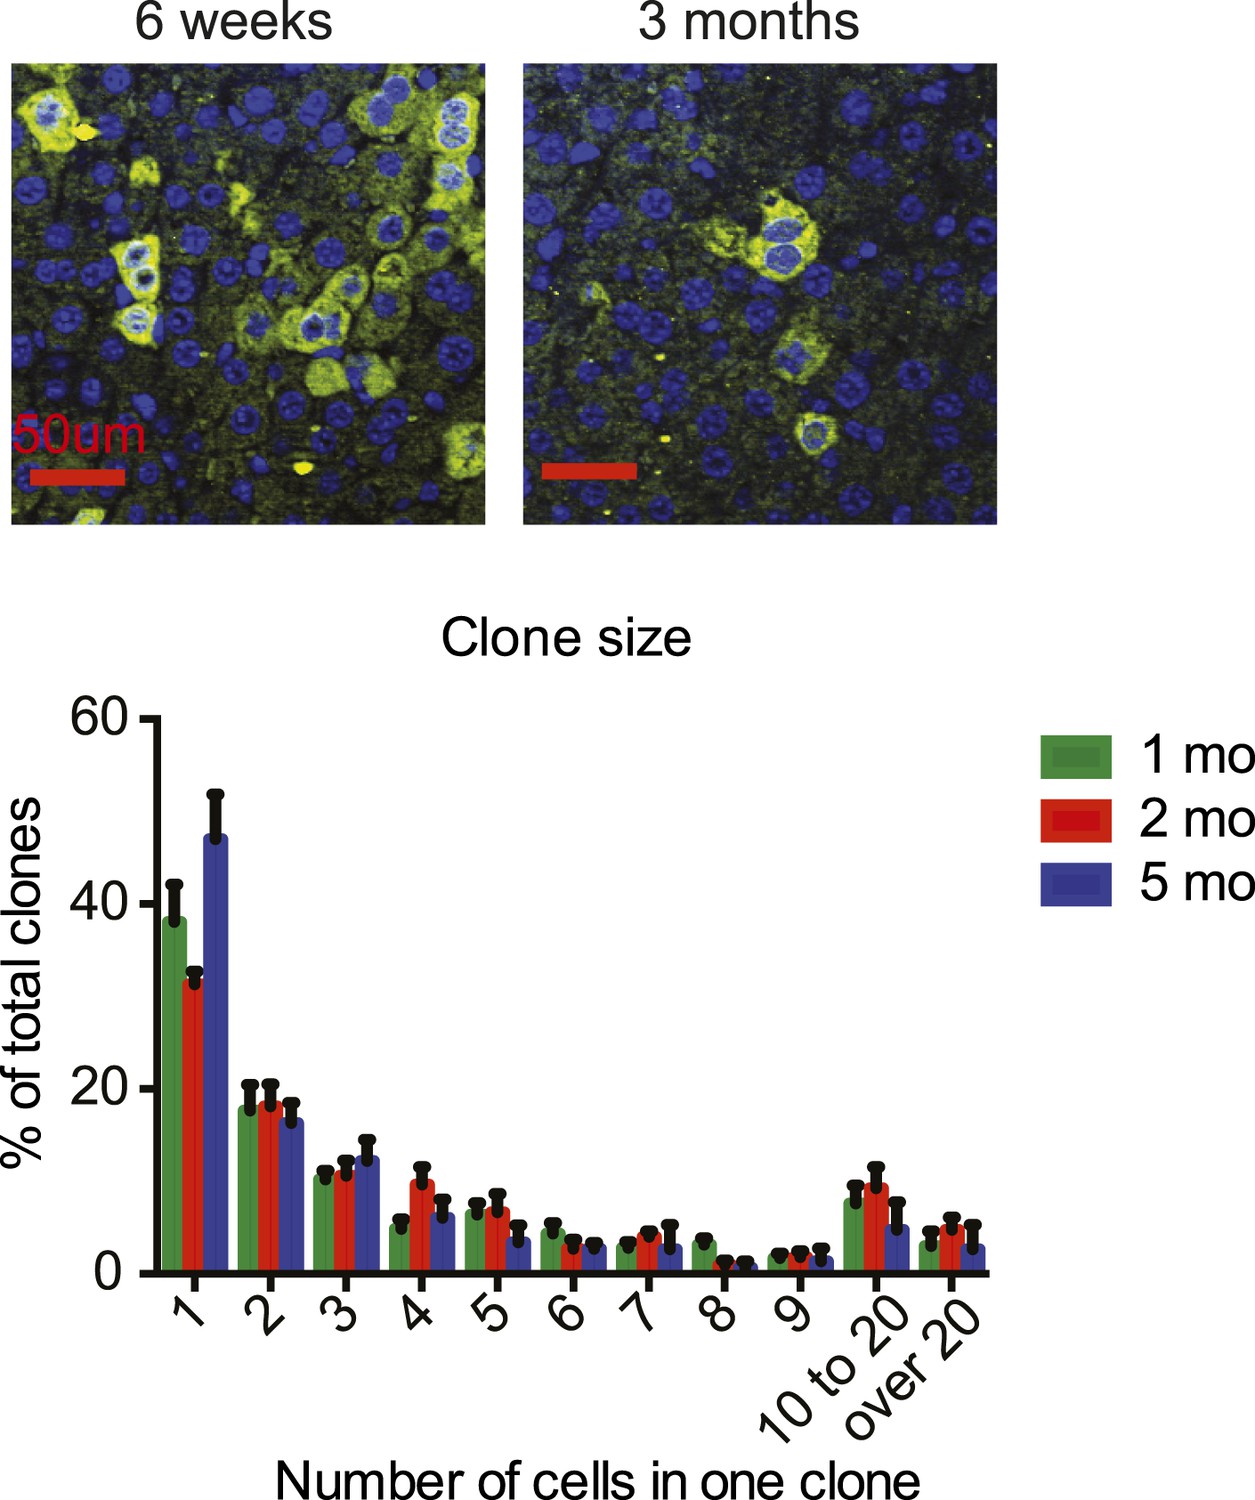
Yaphigh hepatocyte cluster size does not change over time.
Representative images and quantification of GFP cluster size distribution in 1- to 5-month-old YapKIAlb-Cre mouse livers. Similar clone size distribution at different ages illustrates lack of clonal expansion of Yaphigh cells.
Figure 2—figure supplement 2
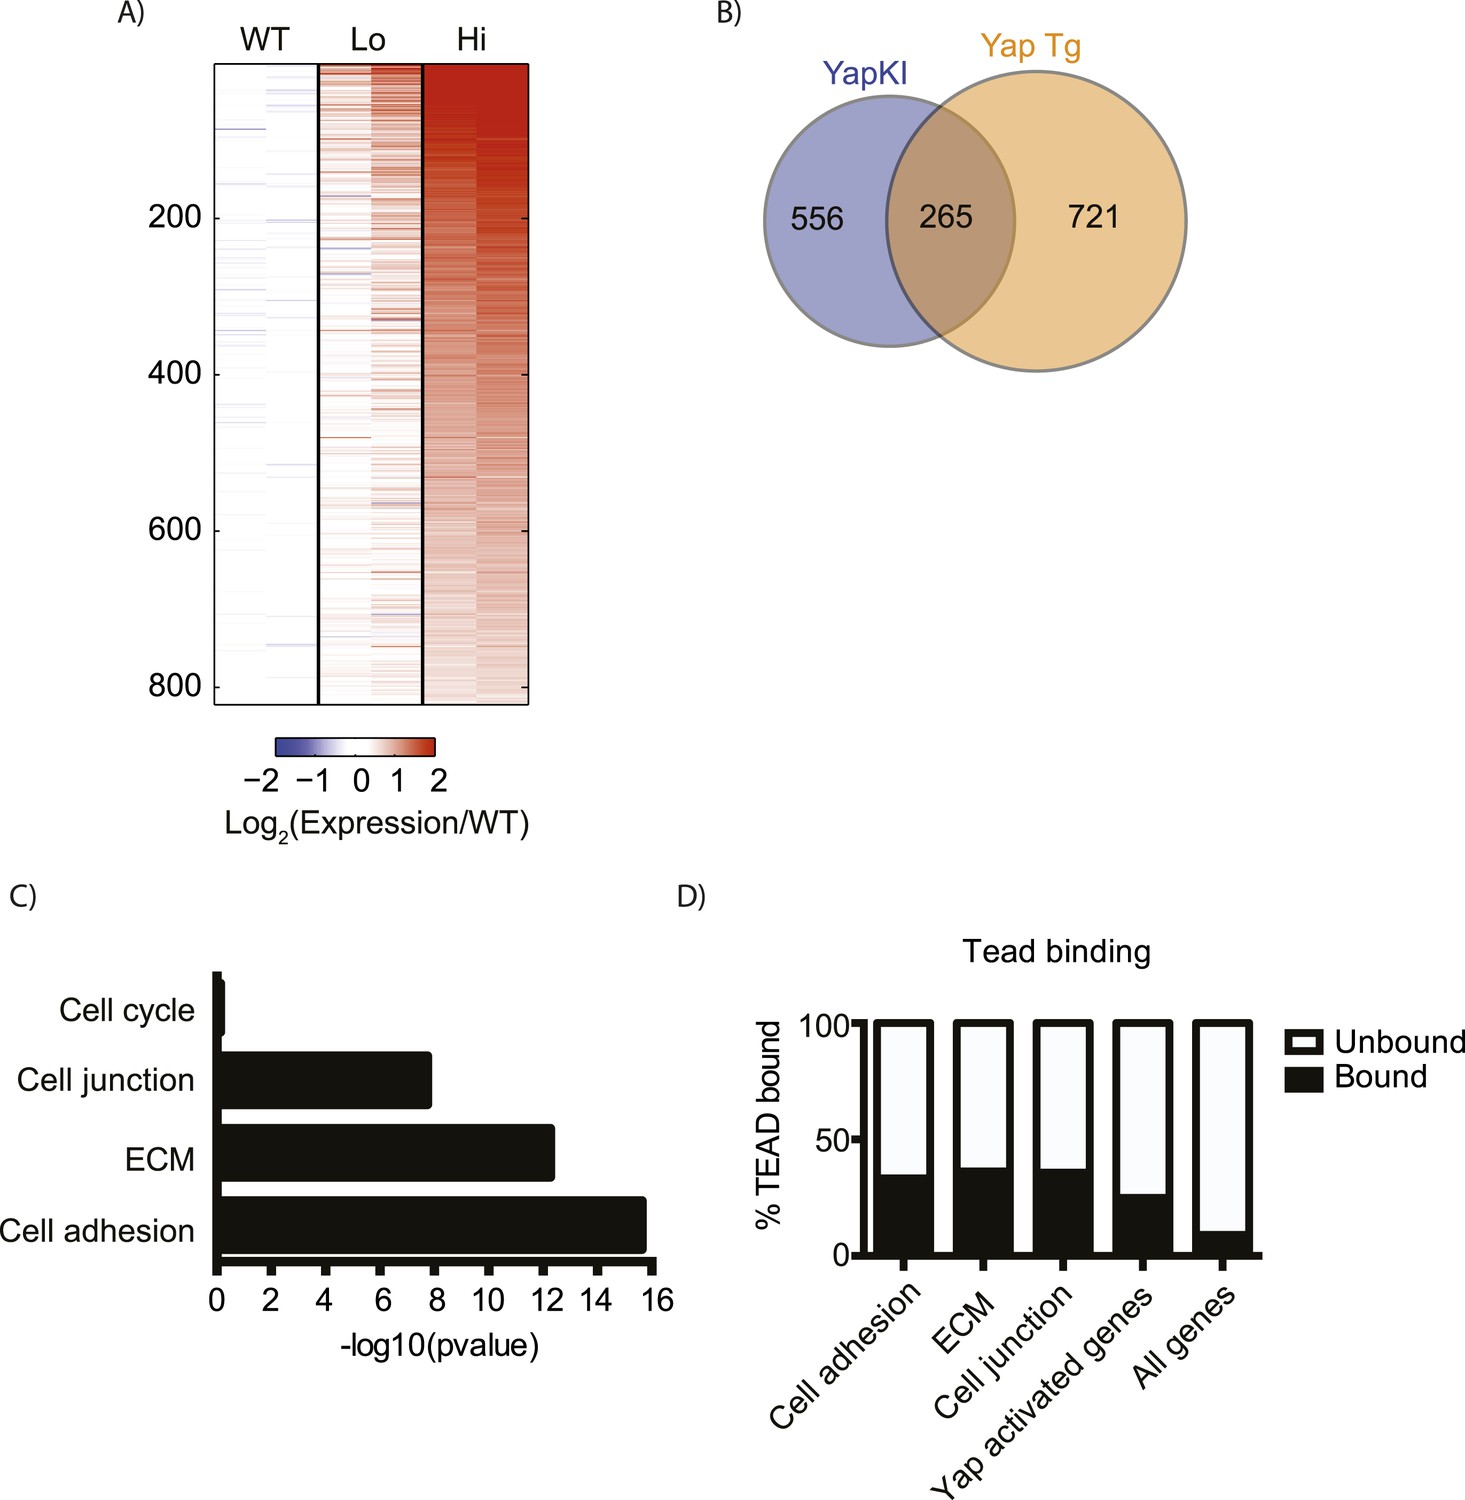
Overexpressed Yap induces robust transcription in hepatocytes at steady state.
(A) Heatmap showing RNA-sequencing data of genes induced in flow cytometry-sorted Yaphigh hepatocytes compared to the WT (p ≤ 0.005 and ≥twofold). Two biological replicates were analyzed for WT, Yaplow and Yaphigh hepatocytes. The expression fold change was calculated relative to the mean of the WT. (B) Diagram presenting the comparison between Yap-induced genes in RNA-sequencing data on sorted hepatocytes generated in this study and the genes previously reported to be induced in the whole liver of Yap transgenic mice (Dong et al., 2007). (C) p-value of gene function analysis for Yap-induced genes shown in A. (D) Charts showing the percentages of TEAD binding in different functional categories of genes. Gene function groups were identified from Yap induced genes shown in A. p < 0.0001 for all categories.
Figure 2—figure supplement 3
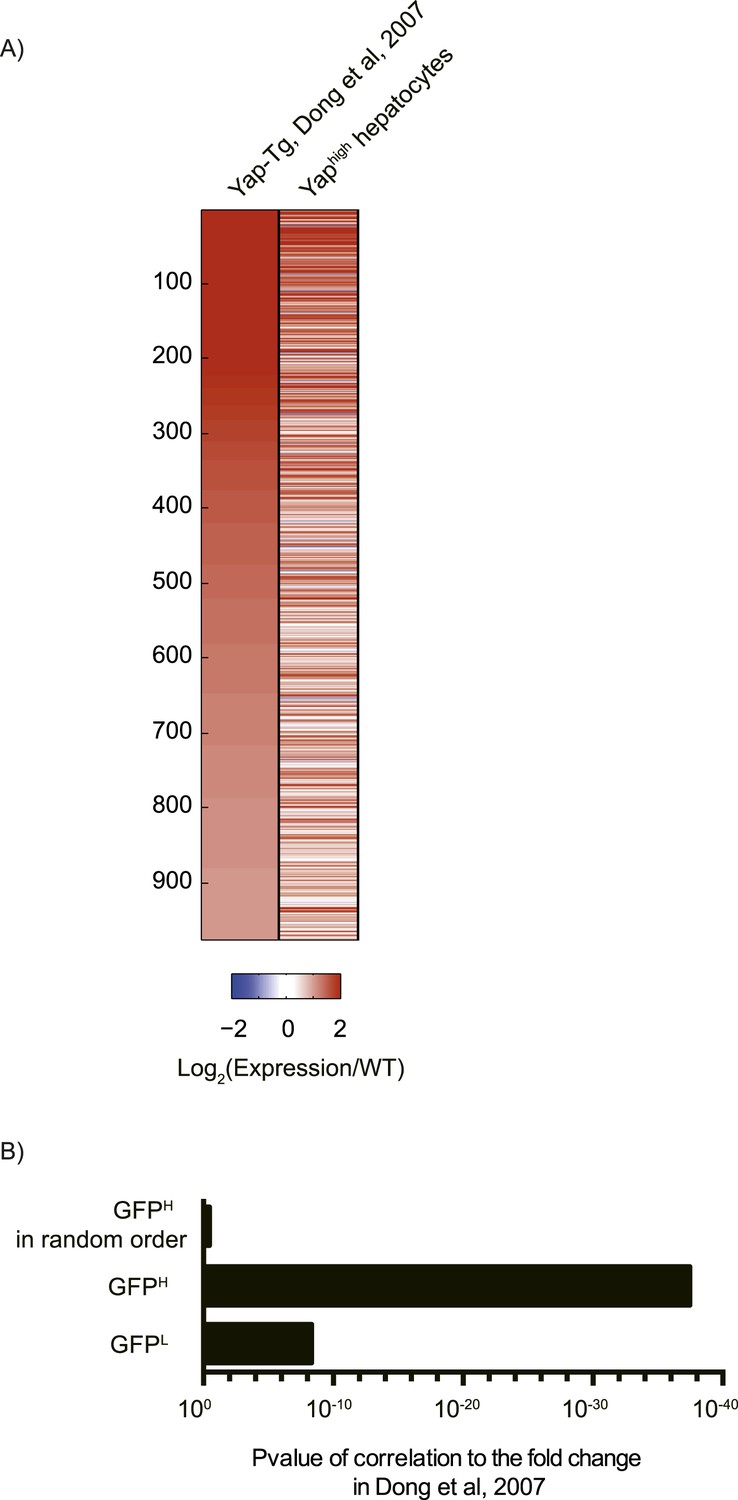
Comparison of Yap-induced genes identified by the RNA sequencing of Yaphigh hepatocytes (this study) and a microarray of Yap-transgenic liver (Dong et al., 2007).
(A) Heatmap showing the expression fold change of genes induced by Yap in this study as compared to the data reported by Dong et al. (2007). Genes are sorted based on their fold change in Dong et al. (2007). (B) p-value of Pearson correlation between the reported fold change in Dong et al. (2007) and the fold change calculated with the RNA-sequencing data. Mean of the indicated samples and the mean of wild type between duplicates were used.
Figure 2—figure supplement 4
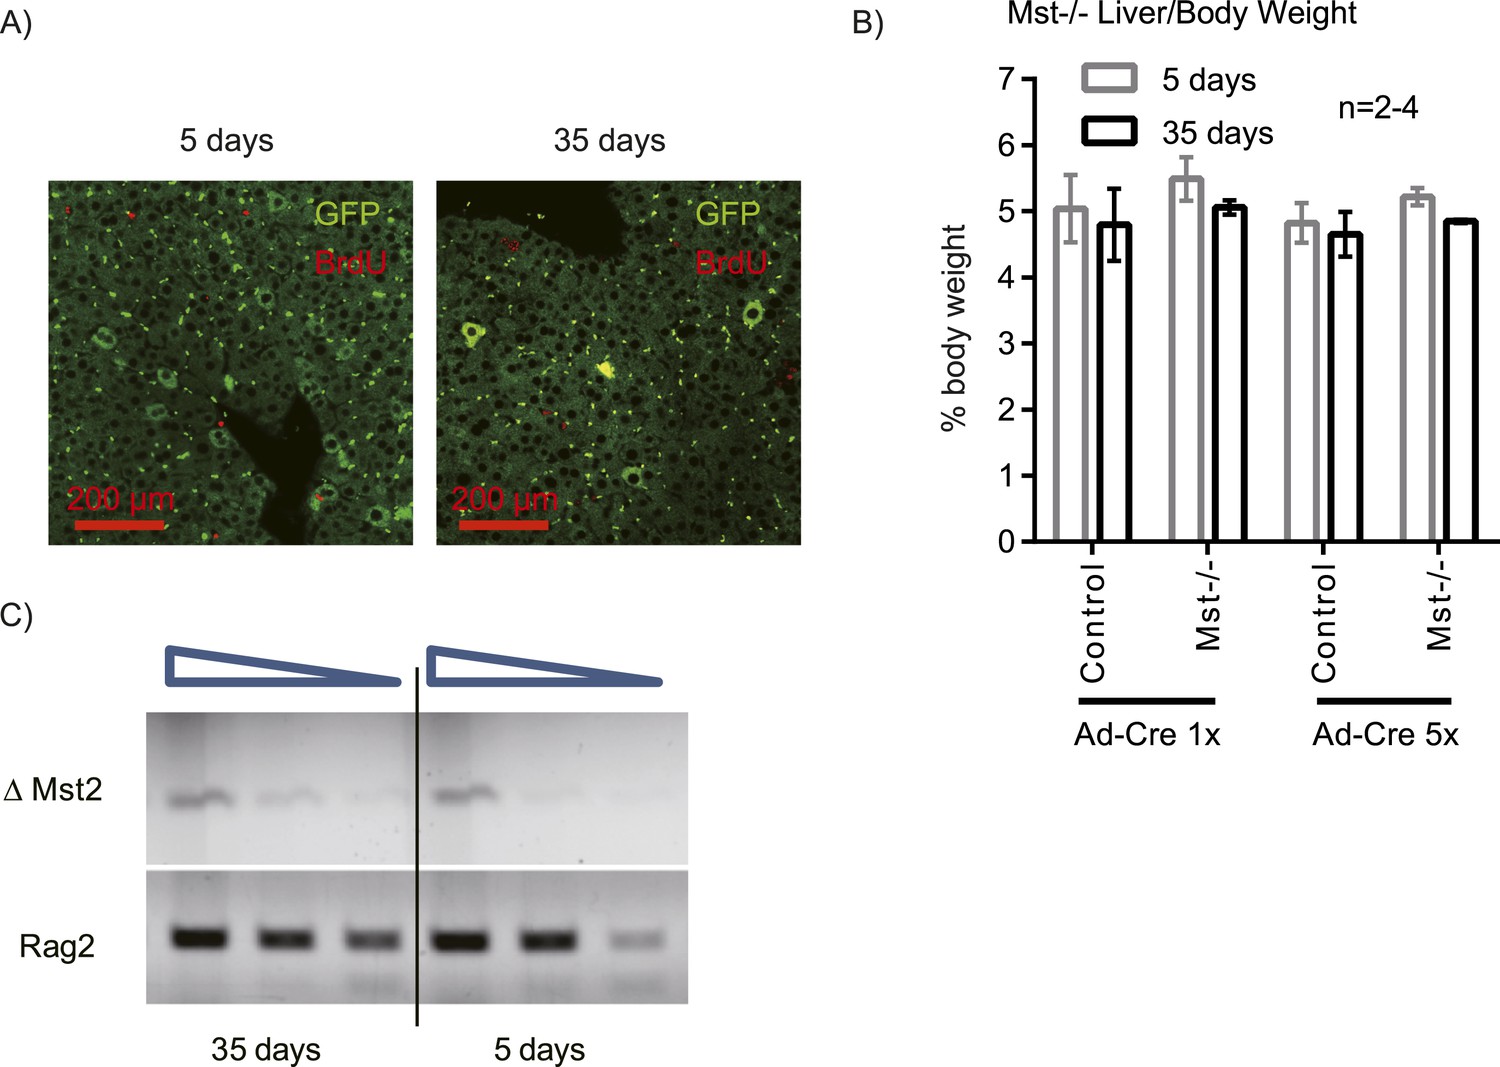
Mosaic Mst1/2 loss does not induce hepatocyte expansion or liver size increase.
Stk4−/−;Stk3flox/flox (Mst1/2) mice were injected with a low dose adenovirus expressing Cre and GFP. (A) Livers were harvested 5 and 35 days after Ad-Cre-GFP injection; BrdU was injected 1 day before harvesting. Liver sections were stained with antibodies to GFP and BrdU. (B) Liver/body weight ratio of Mst1/2 mice injected with Ad-Cre-GFP at the dose shown in A (5×) or fivefold lower dose (1×). (C) Semi-quantitative analysis of the deleted Stk3 (∆Mst2) allele in liver genomic DNA of Mst1/2 mice harvested 5 or 35 days after low dose Ad-Cre-GFP infection. Rag2 genomic PCR was used as a loading control. The triangle denotes serial dilutions of the template DNA (fourfold). Representative images are shown (repeated twice; n > 3/group in each).
Figure 3 with 5 supplements
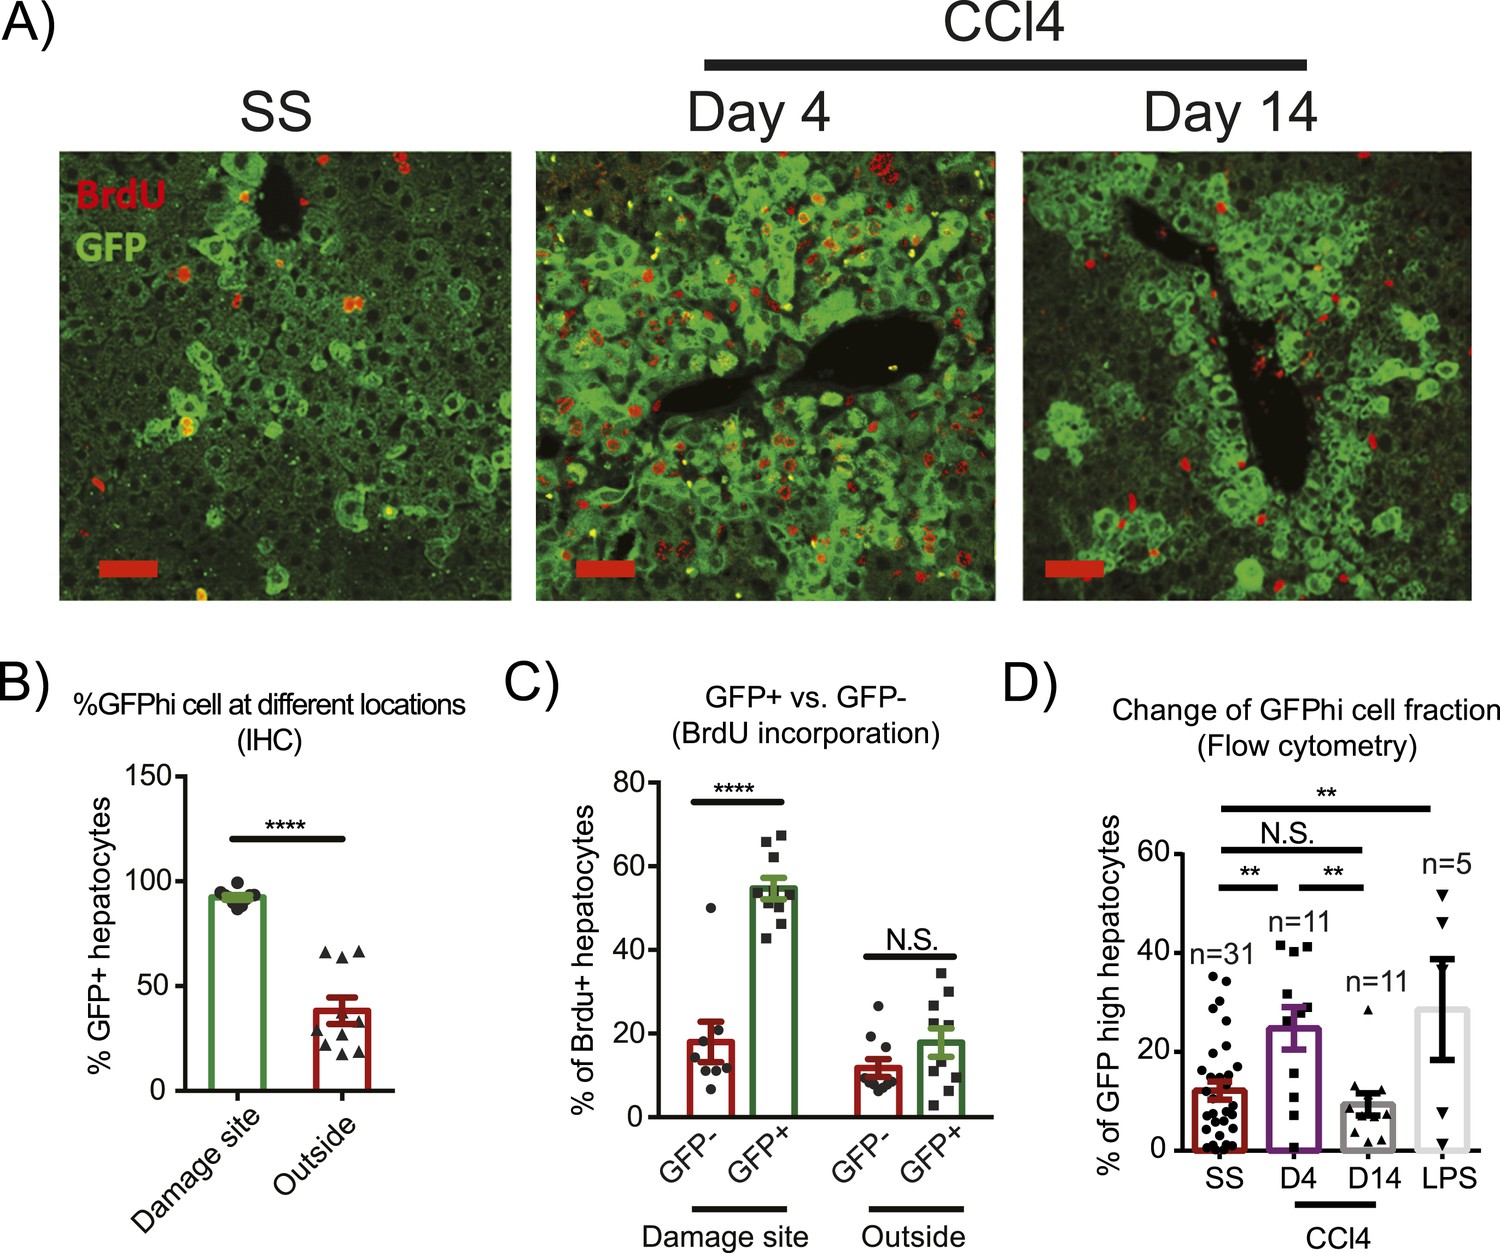
Injury induces proliferation and clonal expansion of Yap-overexpressing hepatocytes.
(A) Liver sections of control (WT) and YapKIAlb-Cre (KI) mice isolated at steady state (SS) or on days 4 and 14 after CCl4 treatment were stained with antibodies to GFP and BrdU. BrdU was injected in all groups for 3 consecutive days before harvesting the livers. (B) The percentage of Yaphigh (GFP+) cells among all hepatocytes was quantified within the pericentral zone (‘damage site’) and outside the pericentral zone (‘outside’) and in the liver sections of YapKIAlb-Cre mice on day 4 after CCl4 treatment. 3–4 mice were used for each group and 3–4 images were taken for each mouse. Each dot represents cell count from each image. ****p ≤ 0.0001. (C) The percentages of BrdU+ hepatocytes among GFP− and GFP+ hepatocytes were quantified outside the CV zone (‘outside’) and around CV (‘damage site’) in liver sections of YapKIAlb-Cre mice on day 4 after CCl4 treatment. 3–4 mice were used for each group and 3–4 images were taken for each mouse. Each dot represents a cell count from each image. ****p ≤ 0.0001. (D) Hepatocytes were isolated by collagenase perfusion from 1- to 2-month-old YapKIAlb-Cre mice at steady state (SS), at day 4 (D4) and day 14 (D14) after CCl4 treatment, or after a 6-day LPS treatment (LPS), and percentage of GFPhigh cells determined by flow cytometry.
Figure 3—figure supplement 1
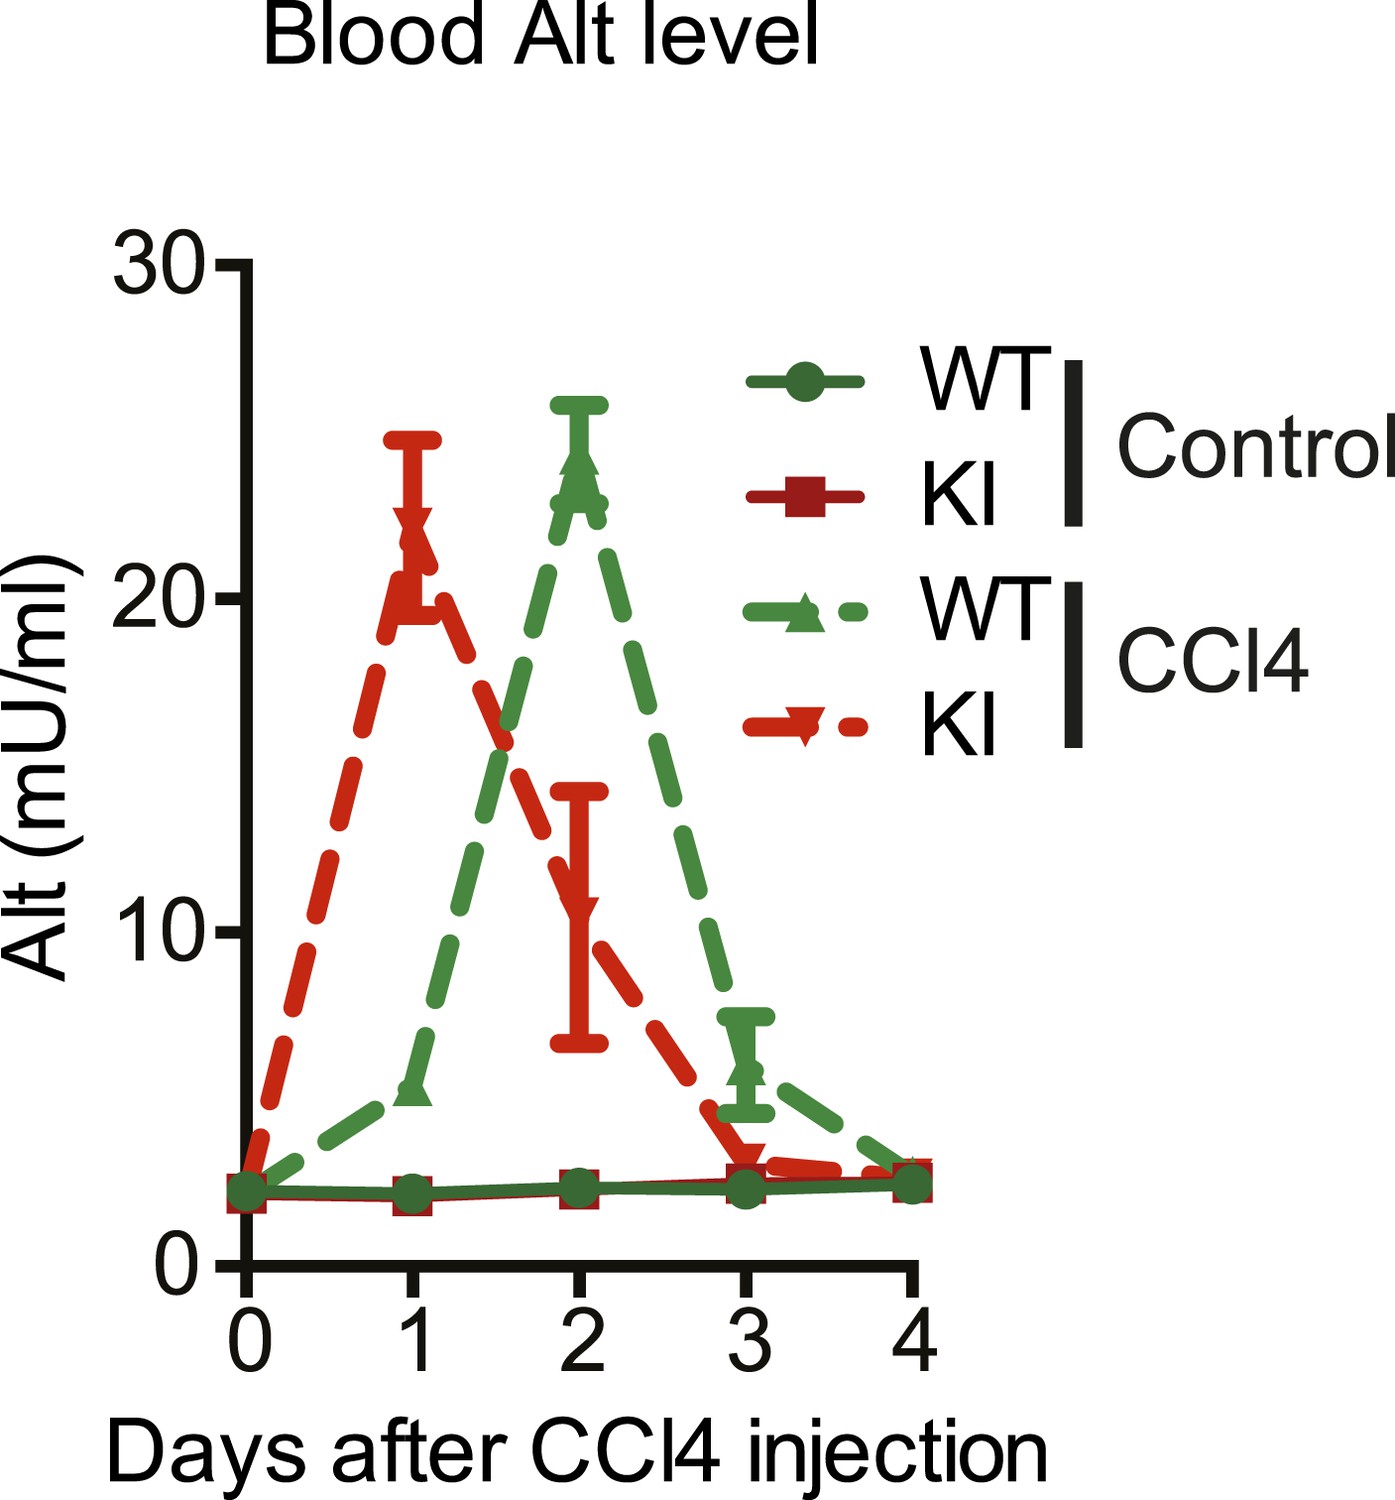
Kinetics of CCl4-induced liver damage in the YapKIAlb-Cre mice.
ALT blood level of control (WT) and YapKIAlb-Cre (KI) mice measured at the indicated days after CCl4 treatment. One representative experiment is shown of the two independent repeats, n = 3 per group in each.
Figure 3—figure supplement 2
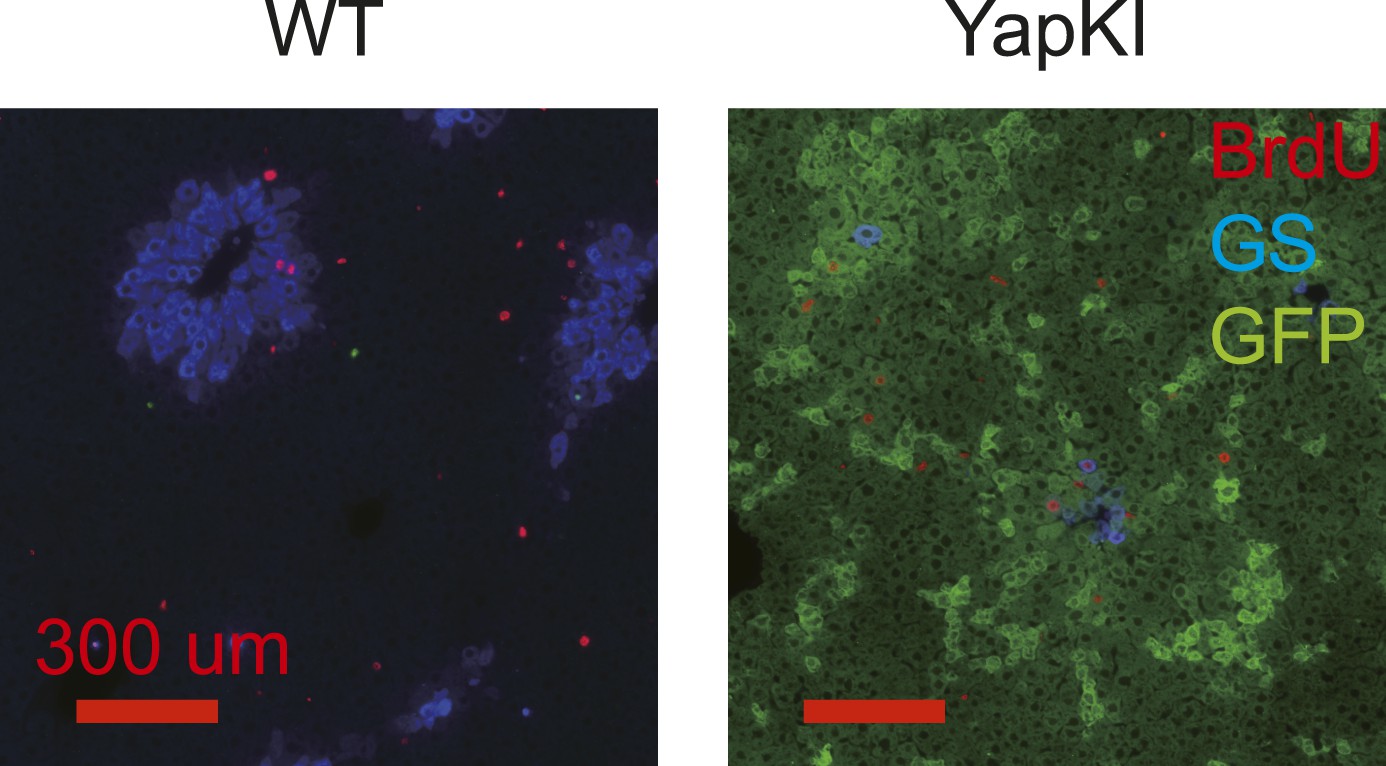
Proliferation rates of WT and YapKIAlb-Cre hepatocytes are similar on day 4 after CCl4 treatment.
Mice were injected with BrdU 1 hr before livers were harvested on day 4 after CCl4 treatment. Liver sections were stained with antibodies to GFP (green), glutamine synthase (blue), and BrdU (red).
Figure 3—figure supplement 3
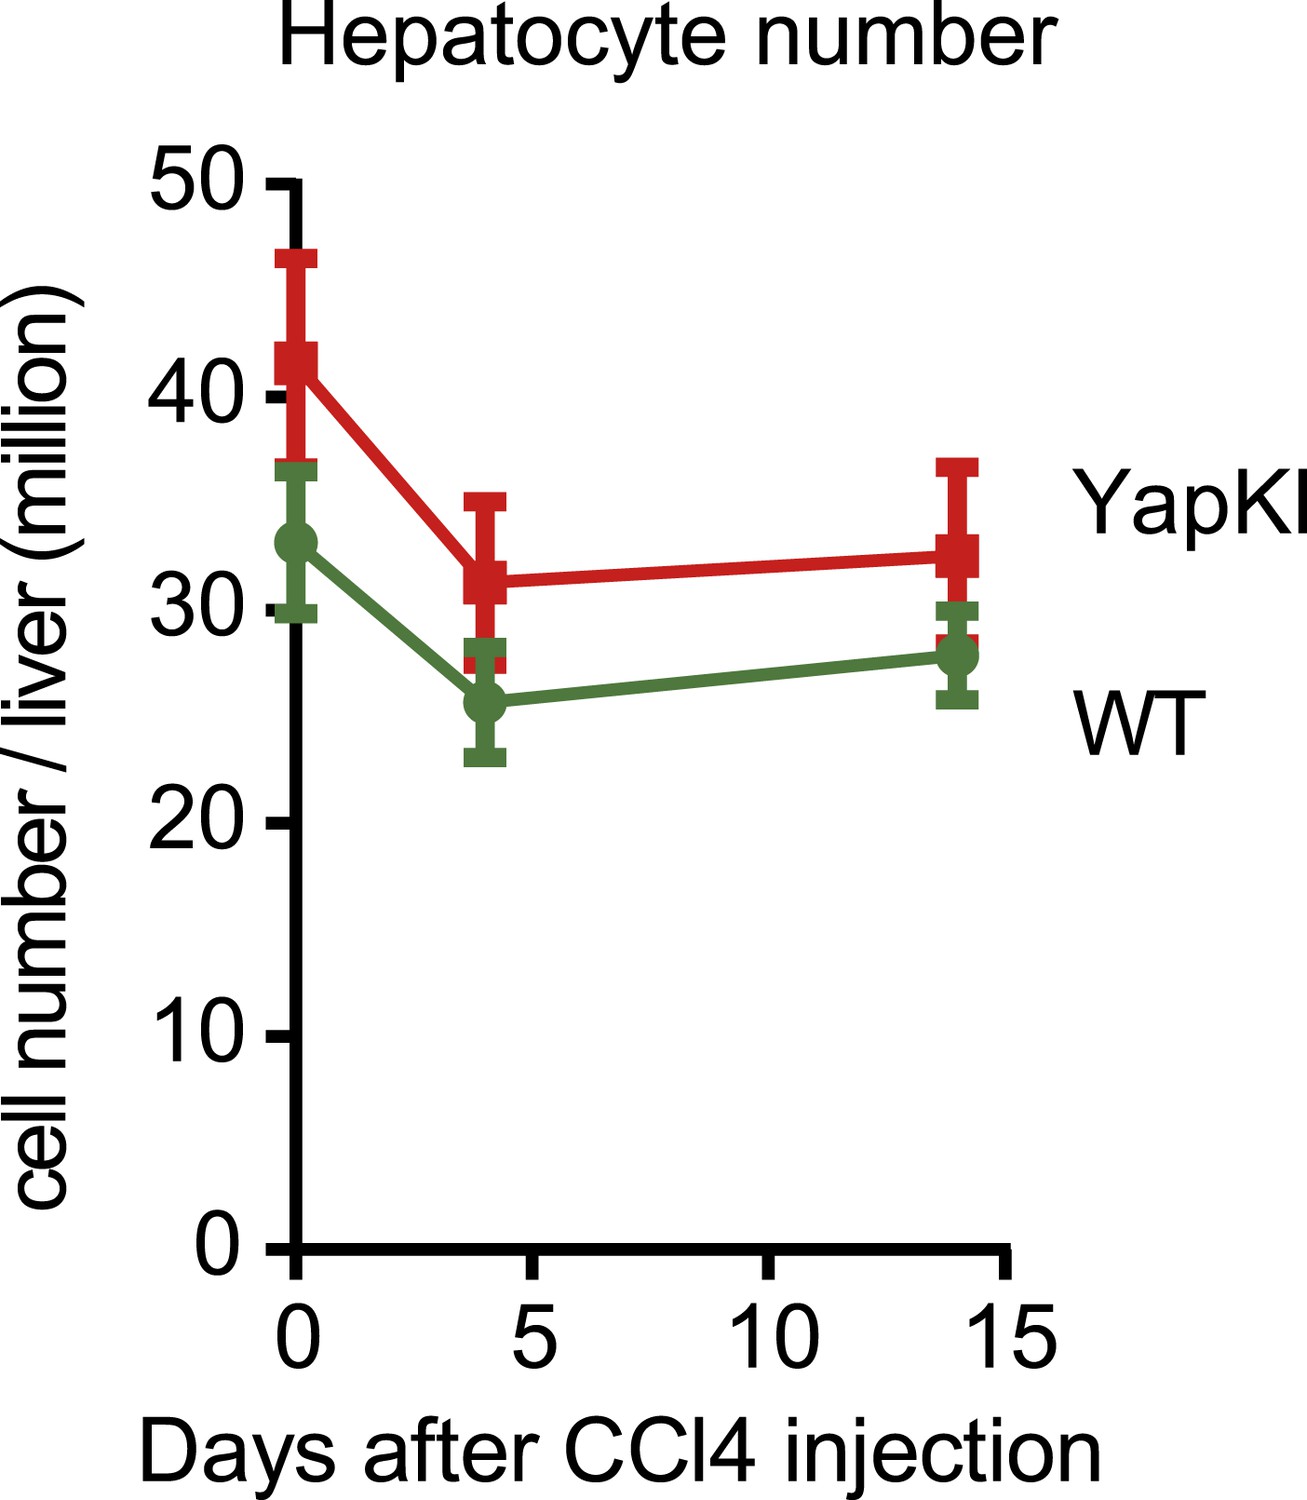
Hepatocyte numbers undergo similar changes in response to CCl4 in the WT and YapKIAlb-Cre mice.
Hepatocyte numbers were measured by quantitative flow cytometry in the pellet fractions of cells isolated from collagenase-perfused livers at indicated times after CCl4 treatment.
Figure 3—figure supplement 4
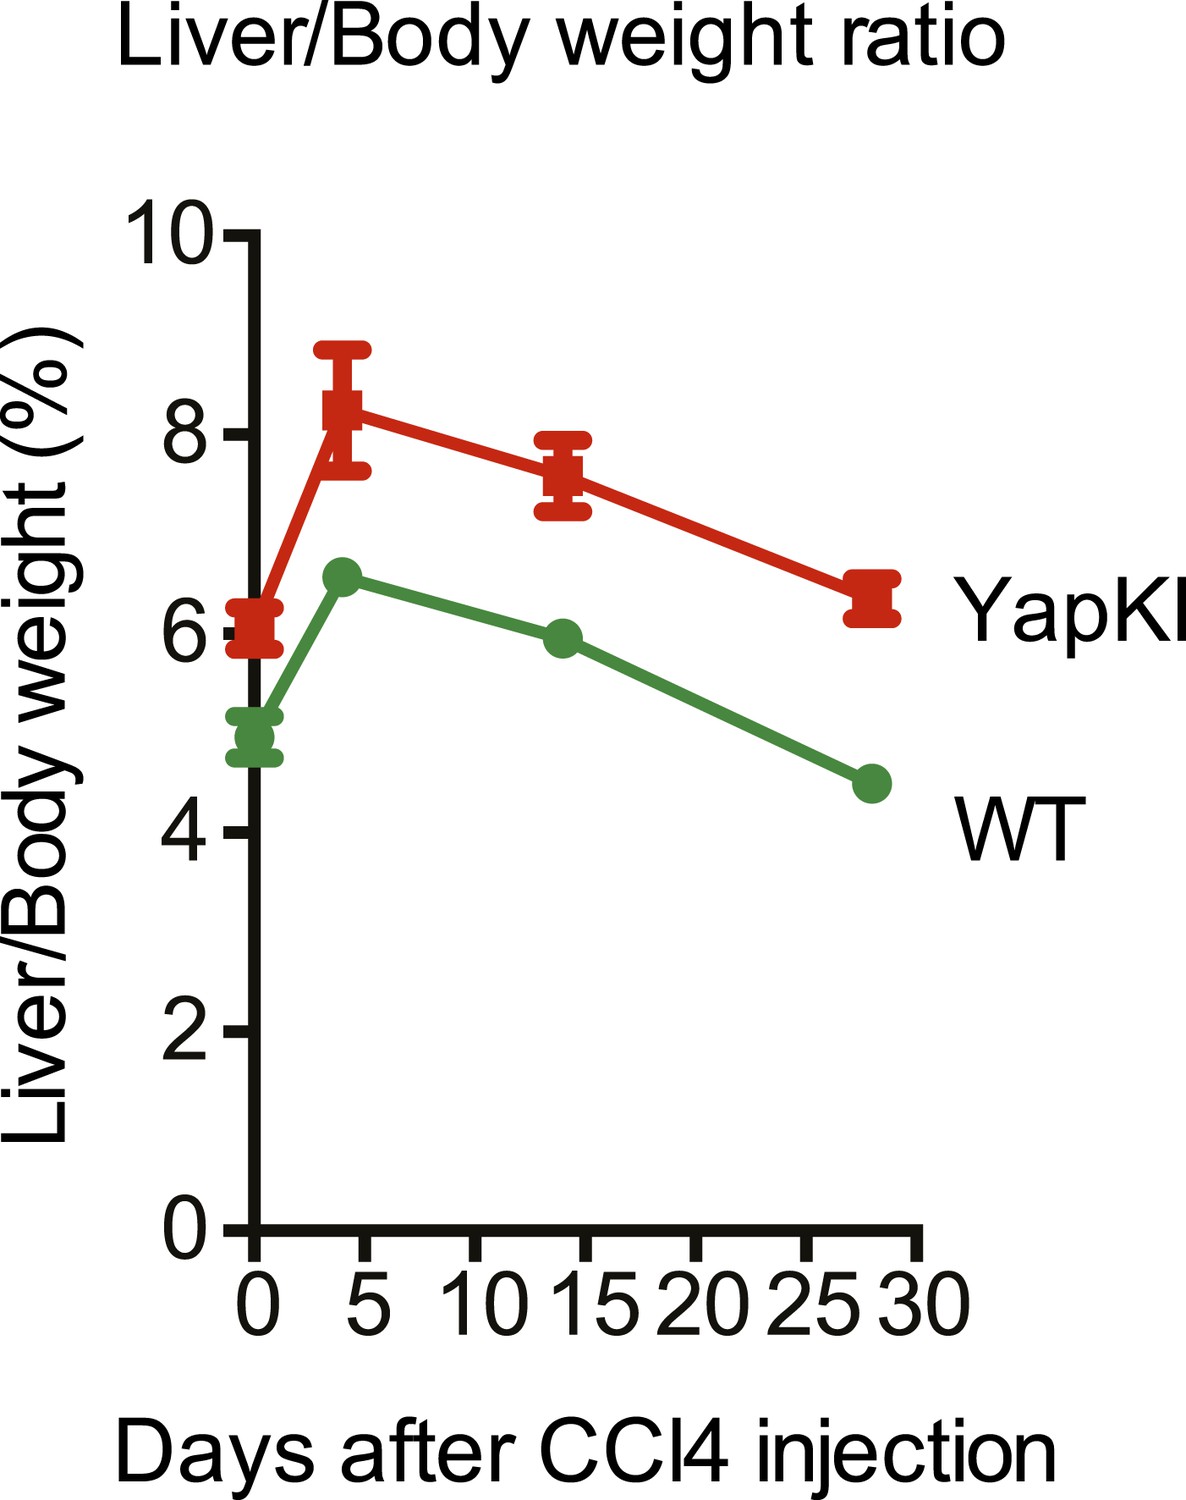
Liver/body weight ratios undergo similar changes in response to CCl4 in the WT and YapKIAlb-Cre mice.
Liver/body weight ratio of YapKIAlb-Cre and littermate control mice was determined at the indicated days after CCl4 injection.
Figure 3—figure supplement 5
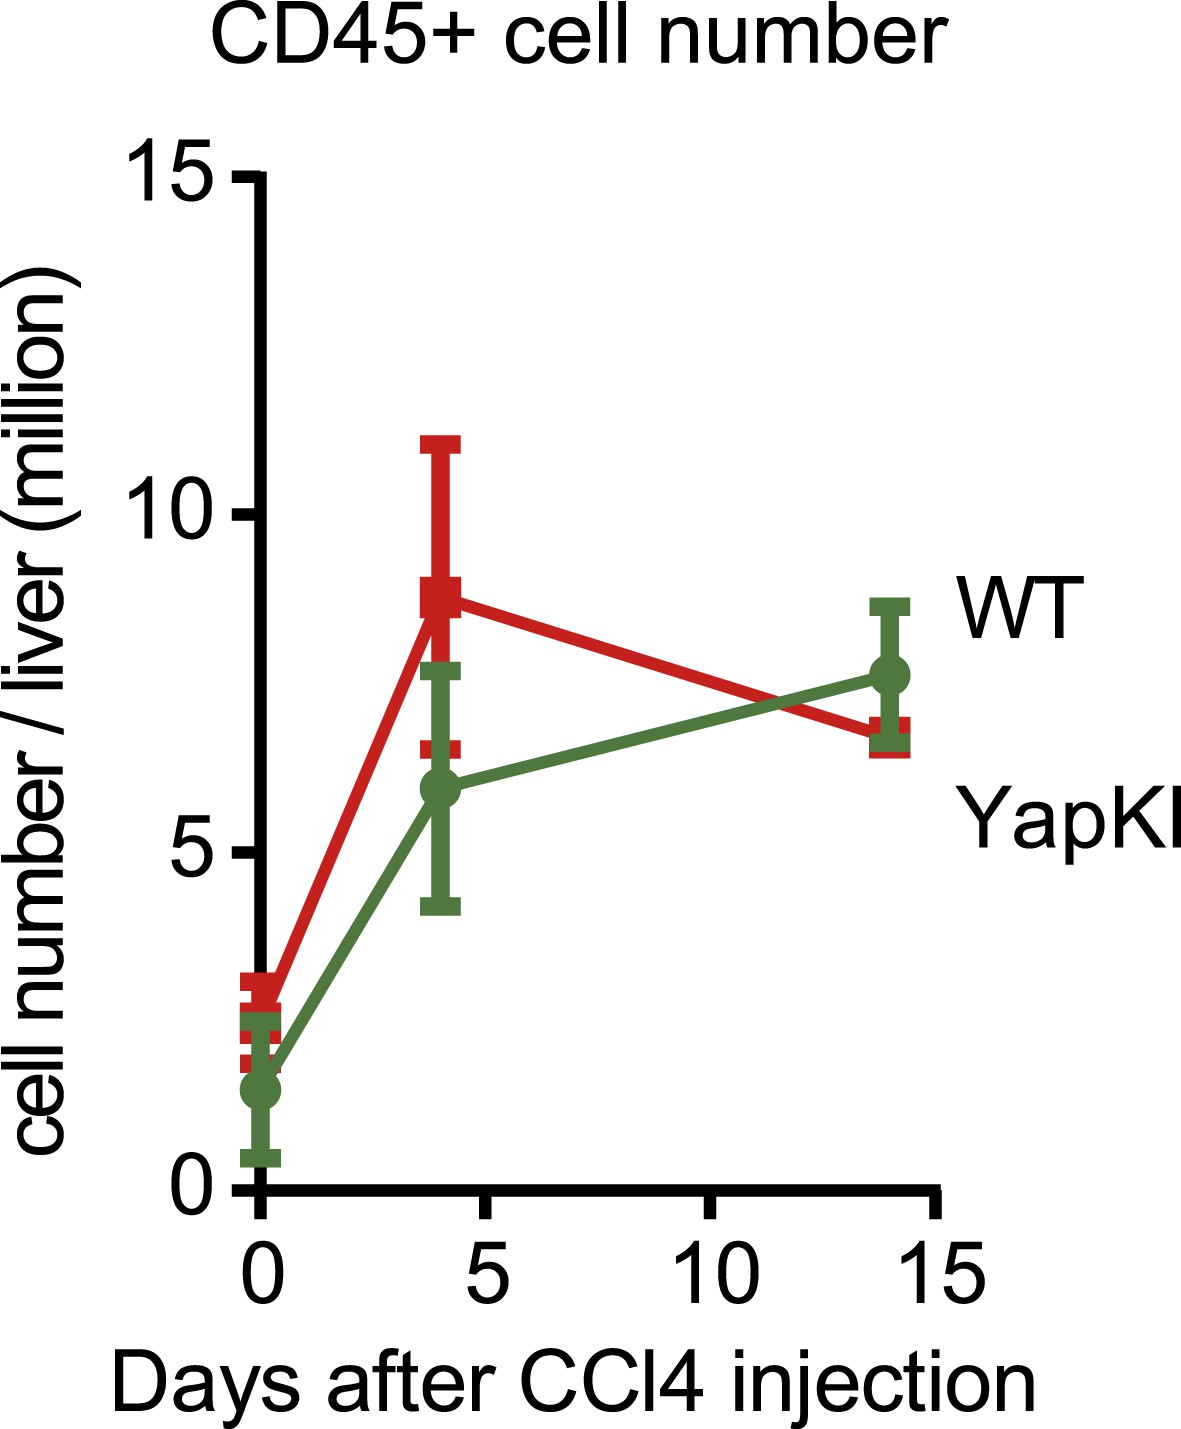
Hematopoietic cell numbers undergo similar changes in response to CCl4 in the WT and YapKIAlb-Cre mice.
CD45+ cell numbers were measured by quantitative flow cytometry in the supernatant fractions of cells isolated from collagenase-perfused livers at indicated times after CCl4 treatment.
Figure 4 with 5 supplements
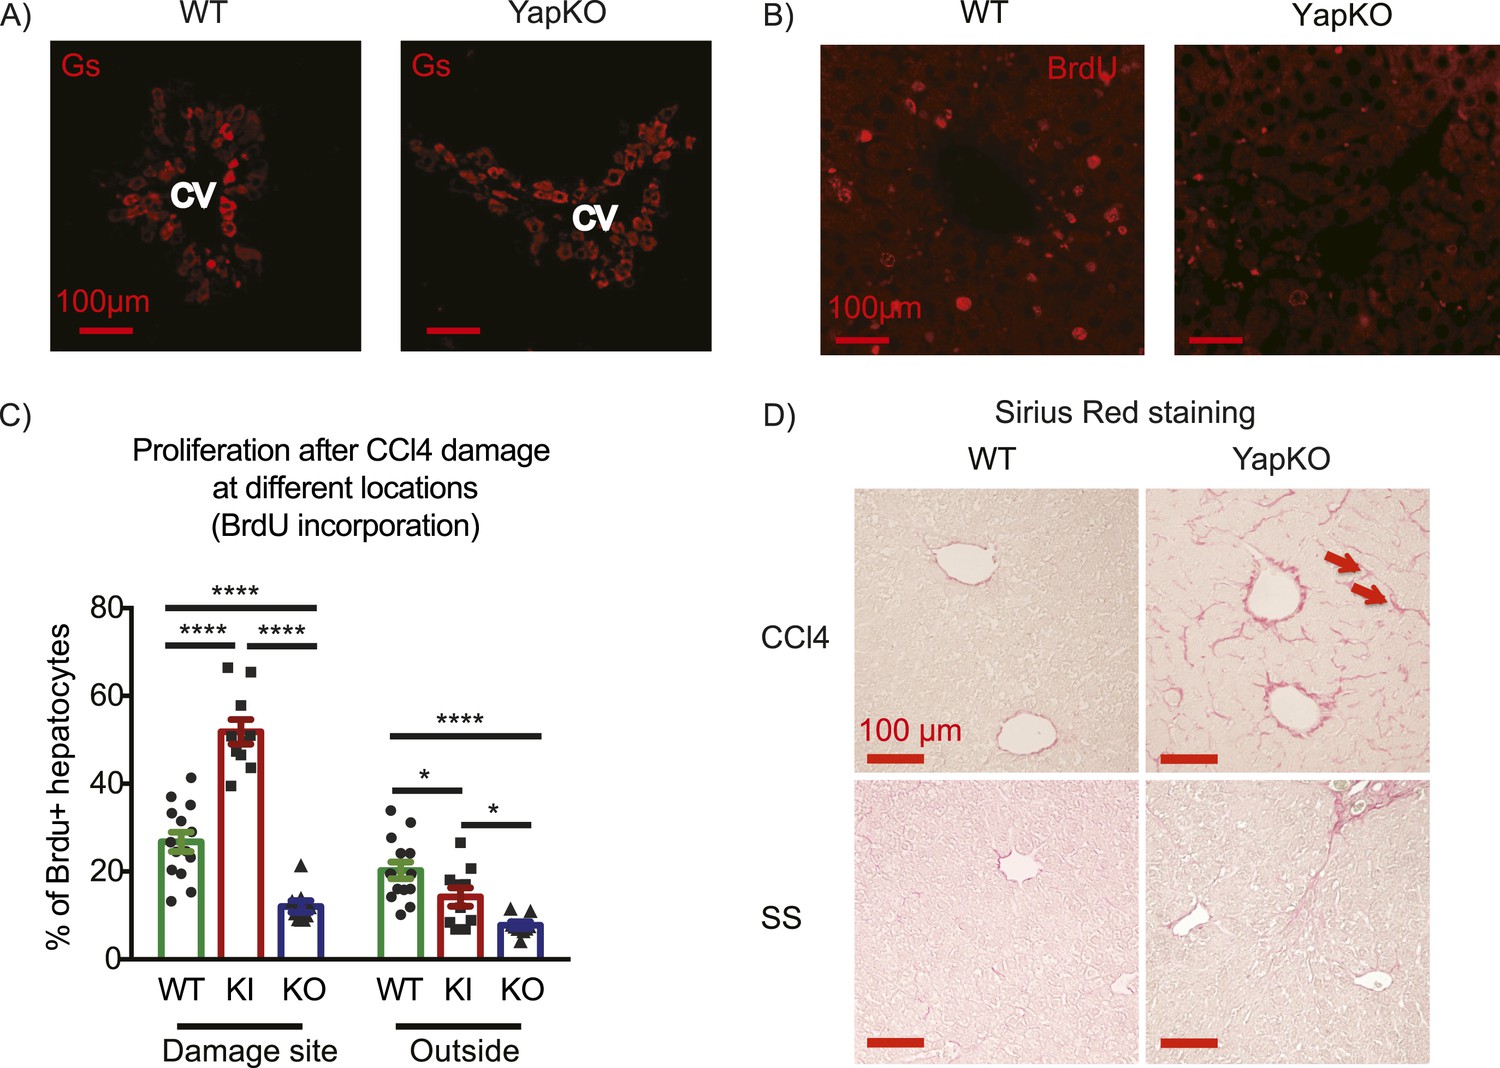
Yap function in hepatocytes is required for tissue repair.
(A) Expression of glutamine synthase detected by immunofluorescent staining of littermate controls (WT) and YapCKOAlb-Cre YapCKO livers on day 4 after CCl4 treatment. CV, central vein. (B) BrdU staining illustrating lack of hepatocyte proliferation in Yap-deficient hepatocytes in response to CCl4-induced injury. The results are quantified in Figure 4C. (C) Total BrdU+ hepatocytes in WT, YapKIAlb-Cre (KI) and YapCKOAlb-Cre (CKO) mice were quantified outside the CV zone (‘outside’) and around CV (‘damage site’) in liver sections on day 4 after CCl4 treatment. 3–4 mice were used for each group and 3–4 images were taken from each mouse. Each dot represents a cell count from each image. (D) Excessive collagen deposition in YapCKOAlb-Cre mice on day 4 after CCl4 treatment revealed by Sirius Red staining.
Figure 4—figure supplement 1
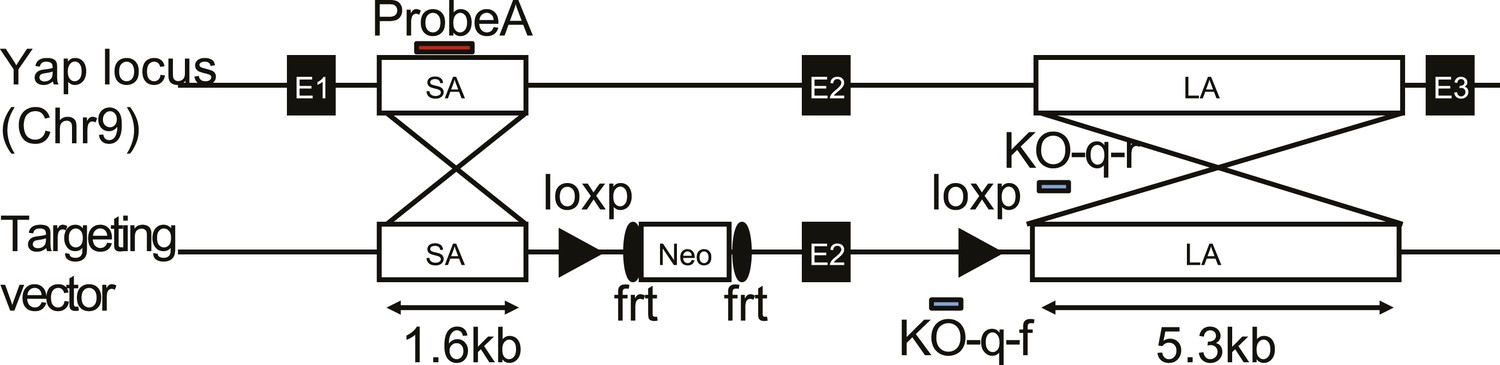
The design of the Yap1 conditional knockout targeting construct.
Exon 2 is floxed and the neo cassette is removable by frt recombination.
Figure 4—figure supplement 2
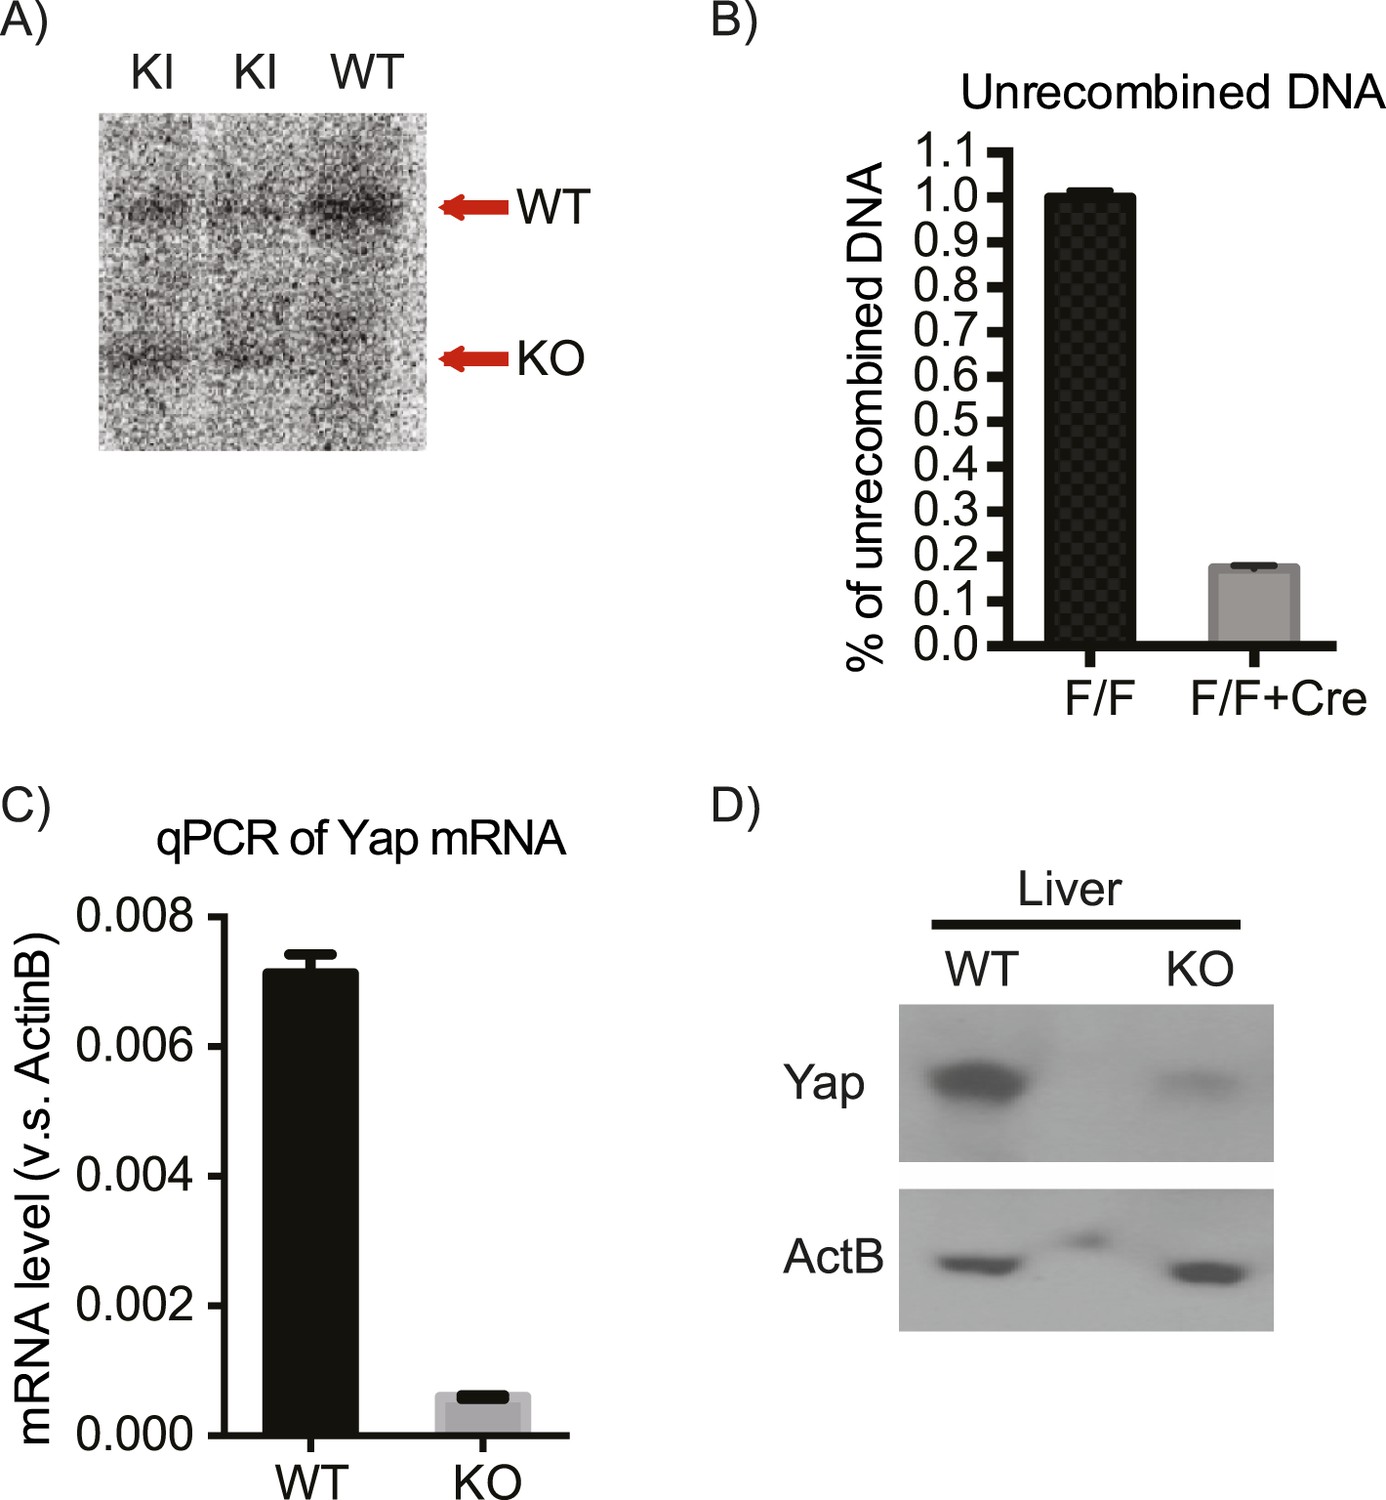
Verification of the correct targeting, expression, and recombination of the Yap1 conditional knockout allele.
(A) Southern blot verifying correct integration of the targeting construct. (B) qPCR on genomic DNA isolated from Yap1flox/flox (F/F) and Yap1flox/flox;AlbCre (F/F + Cre) hepatocytes with primers that amplify only the unrecombined region. (C) Decreased Yap mRNA levels in YapCKOAlb-Cre mouse liver as measured by qPCR. (D) Decreased Yap protein levels in YapCKOAlb-Cre mouse liver as measured by Western blot.
Figure 4—figure supplement 3
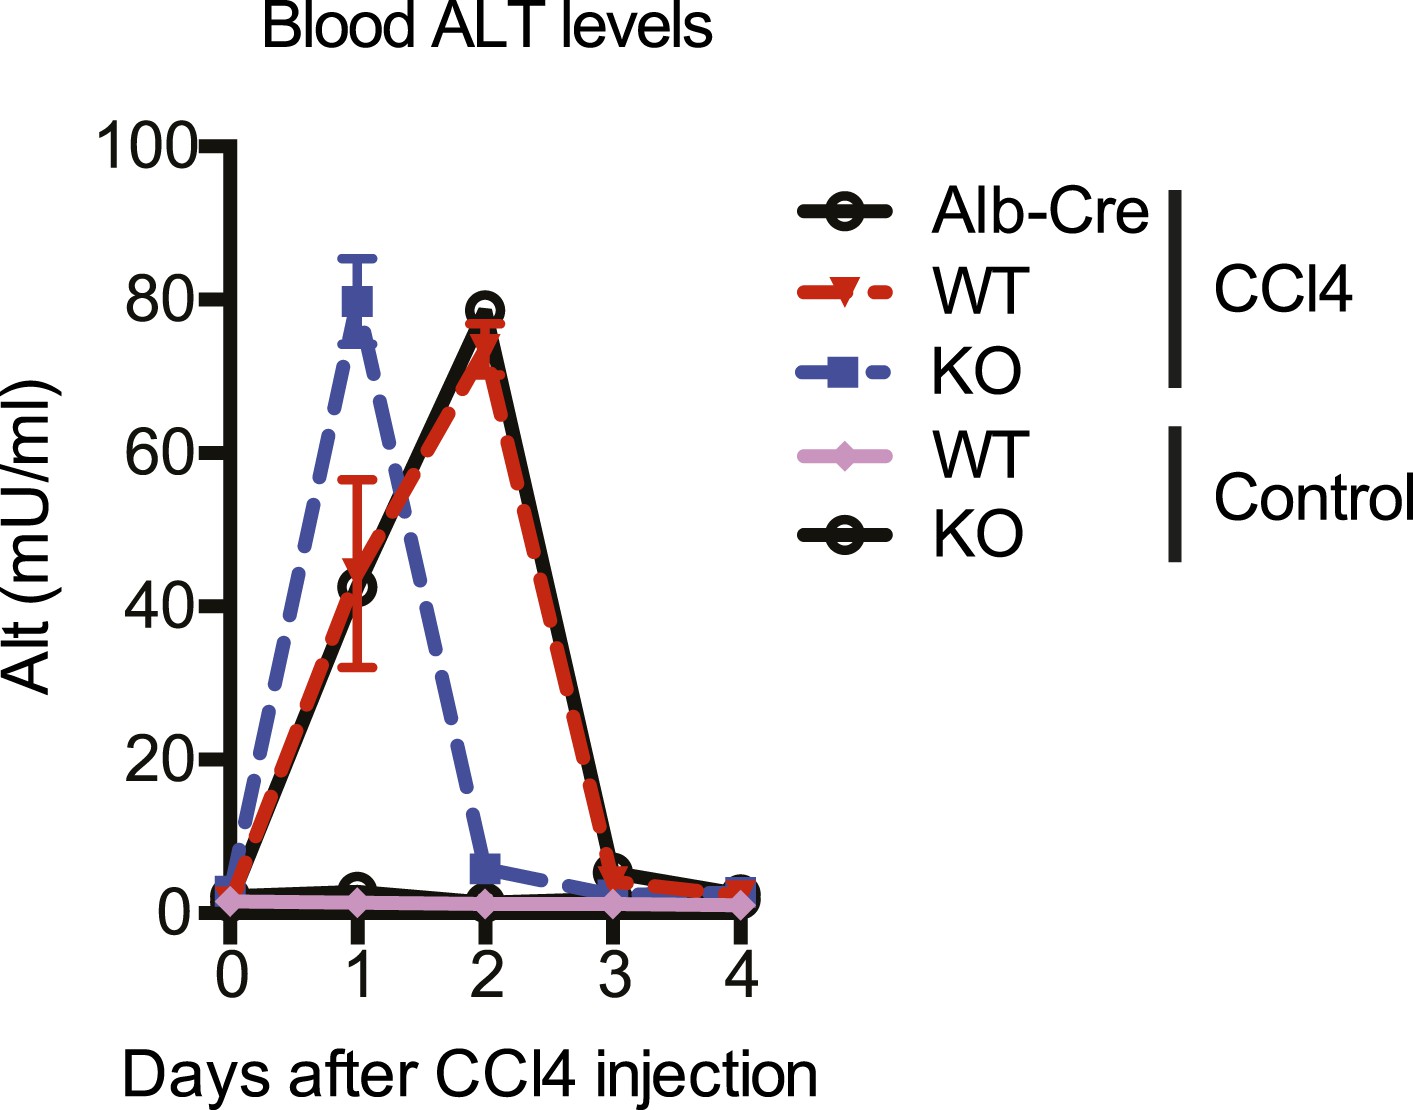
Kinetics of CCl4-induced liver damage in the YapCKOAlb-Cre mice.
ALT blood level of control (WT) and YapCKOAlb-Cre (KO) mice measured at indicated days after CCl4 treatment. The control group was injected with peanut oil (the carrier used for CCl4).
Figure 4—figure supplement 4
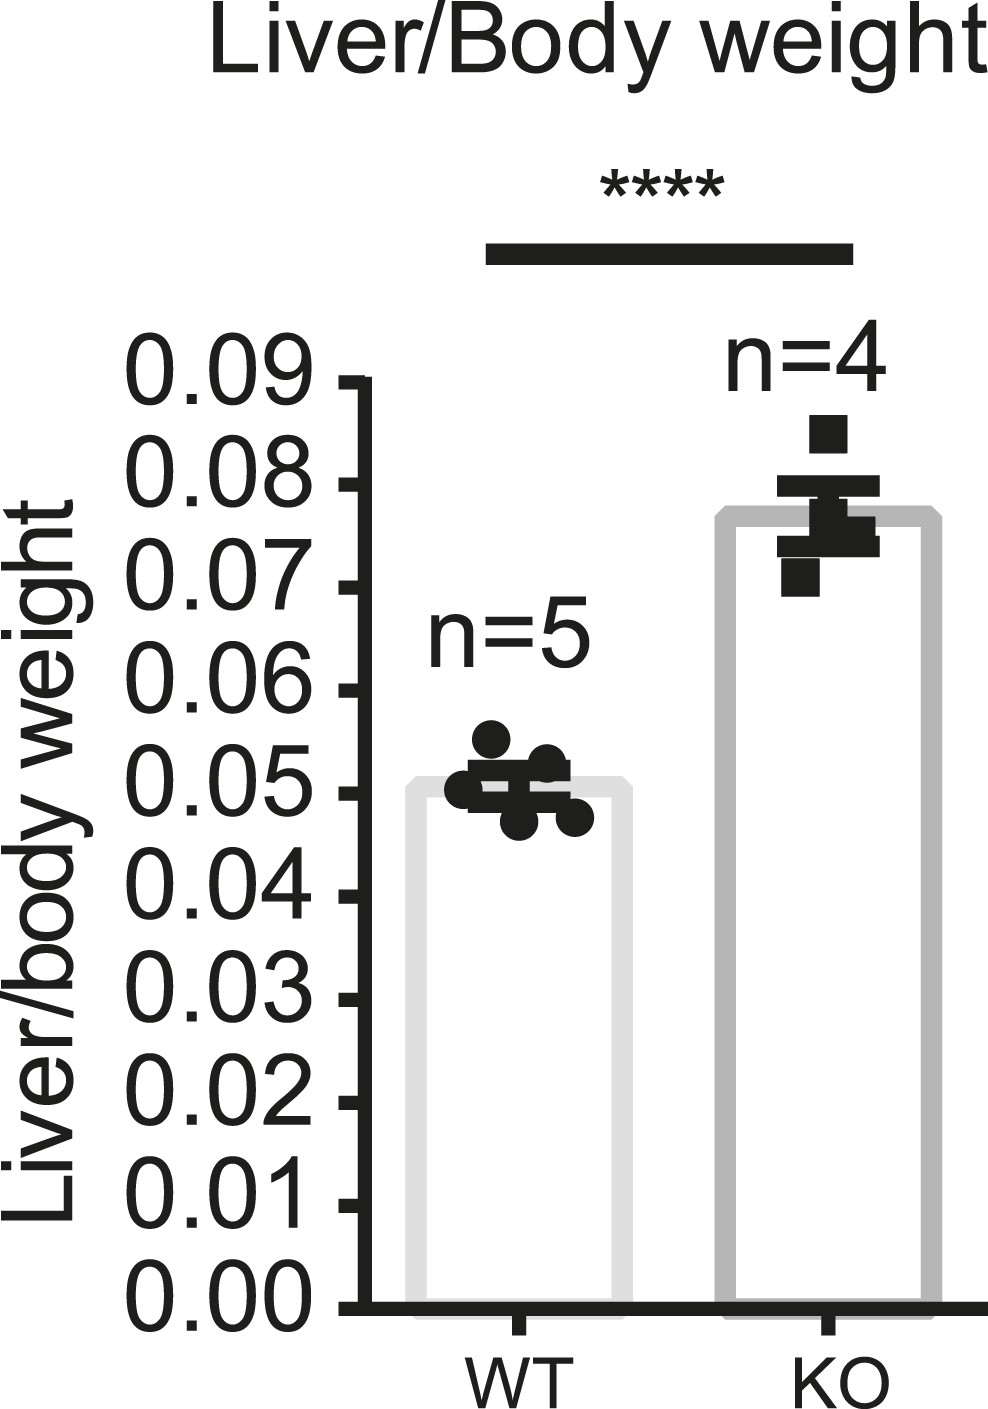
Increased liver weight of the YapCKOAlb-Cre mice.
Liver/body weight ratio of YapCKOAlb-Cre and littermate control mice was determined in the untreated 6- to 8-week-old mice. ****p ≤ 0.0001.
Figure 4—figure supplement 5
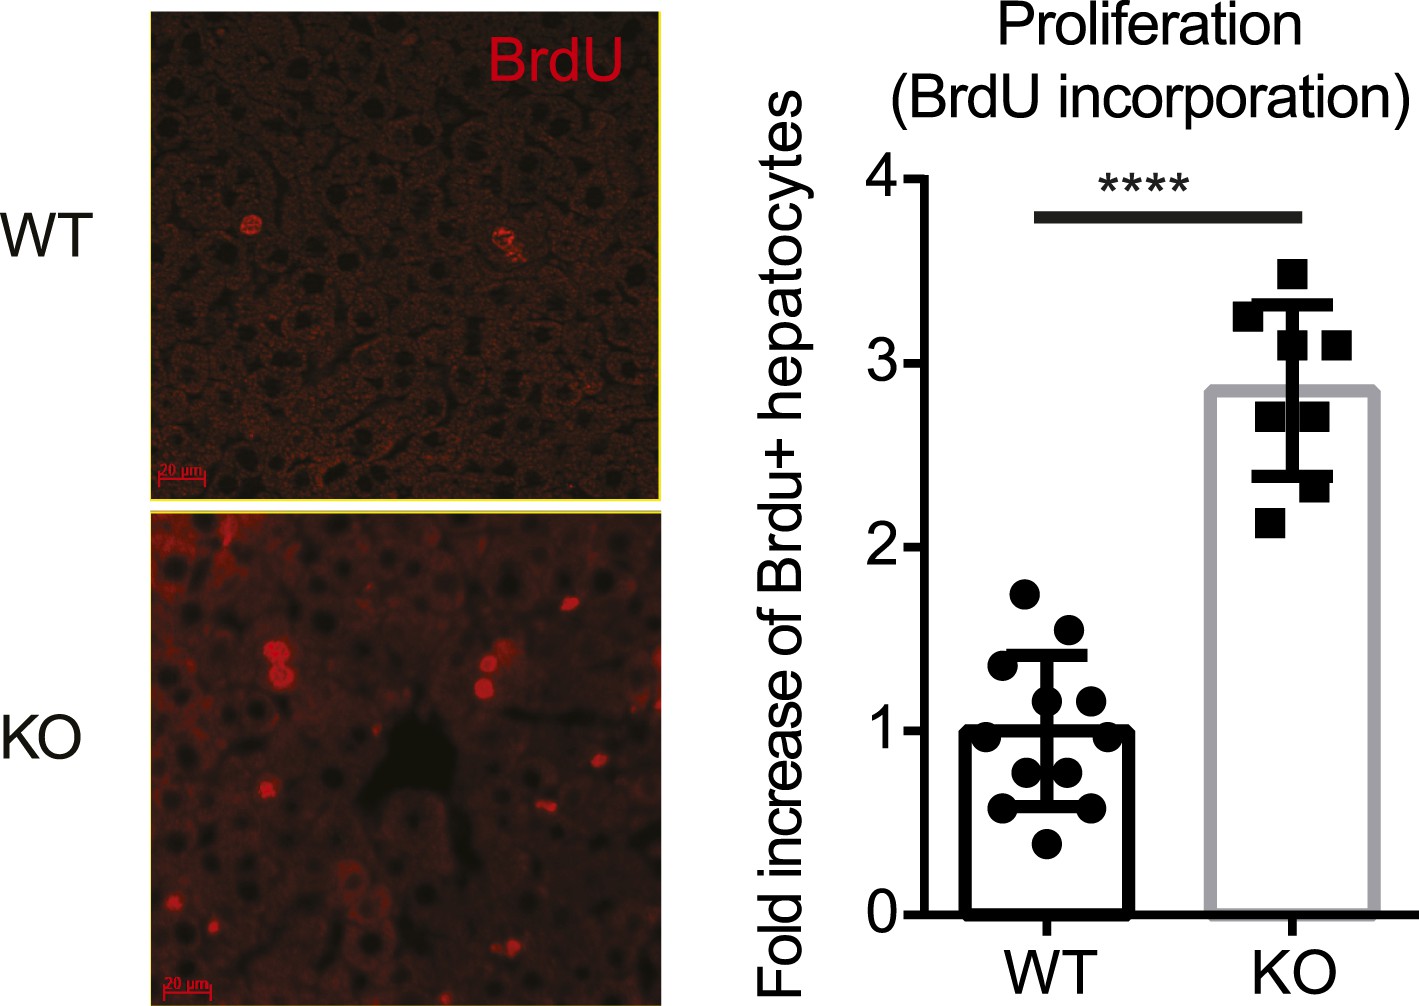
No defect in proliferation of the Yap-deficient hepatocytes at steady state.
Representative images and quantification of the BrdU+ hepatocytes of the 1.5-month-old YapCKOAlb-Cre and littermate control mice at steady state. Mice were injected with BrdU for 3 consecutive days and liver sections were stained with BrdU antibody. The number of BrdU+ hepatocytes per a 20× field was quantified and normalized to the average values of the WT. 2–3 mice were used for each group and at least 20 images were taken for each mouse. Each dot represents cell count from each image. ****p ≤ 0.0001.
Figure 5 with 2 supplements
Inflammation induces proliferation of Yap-overexpressing hepatocytes.
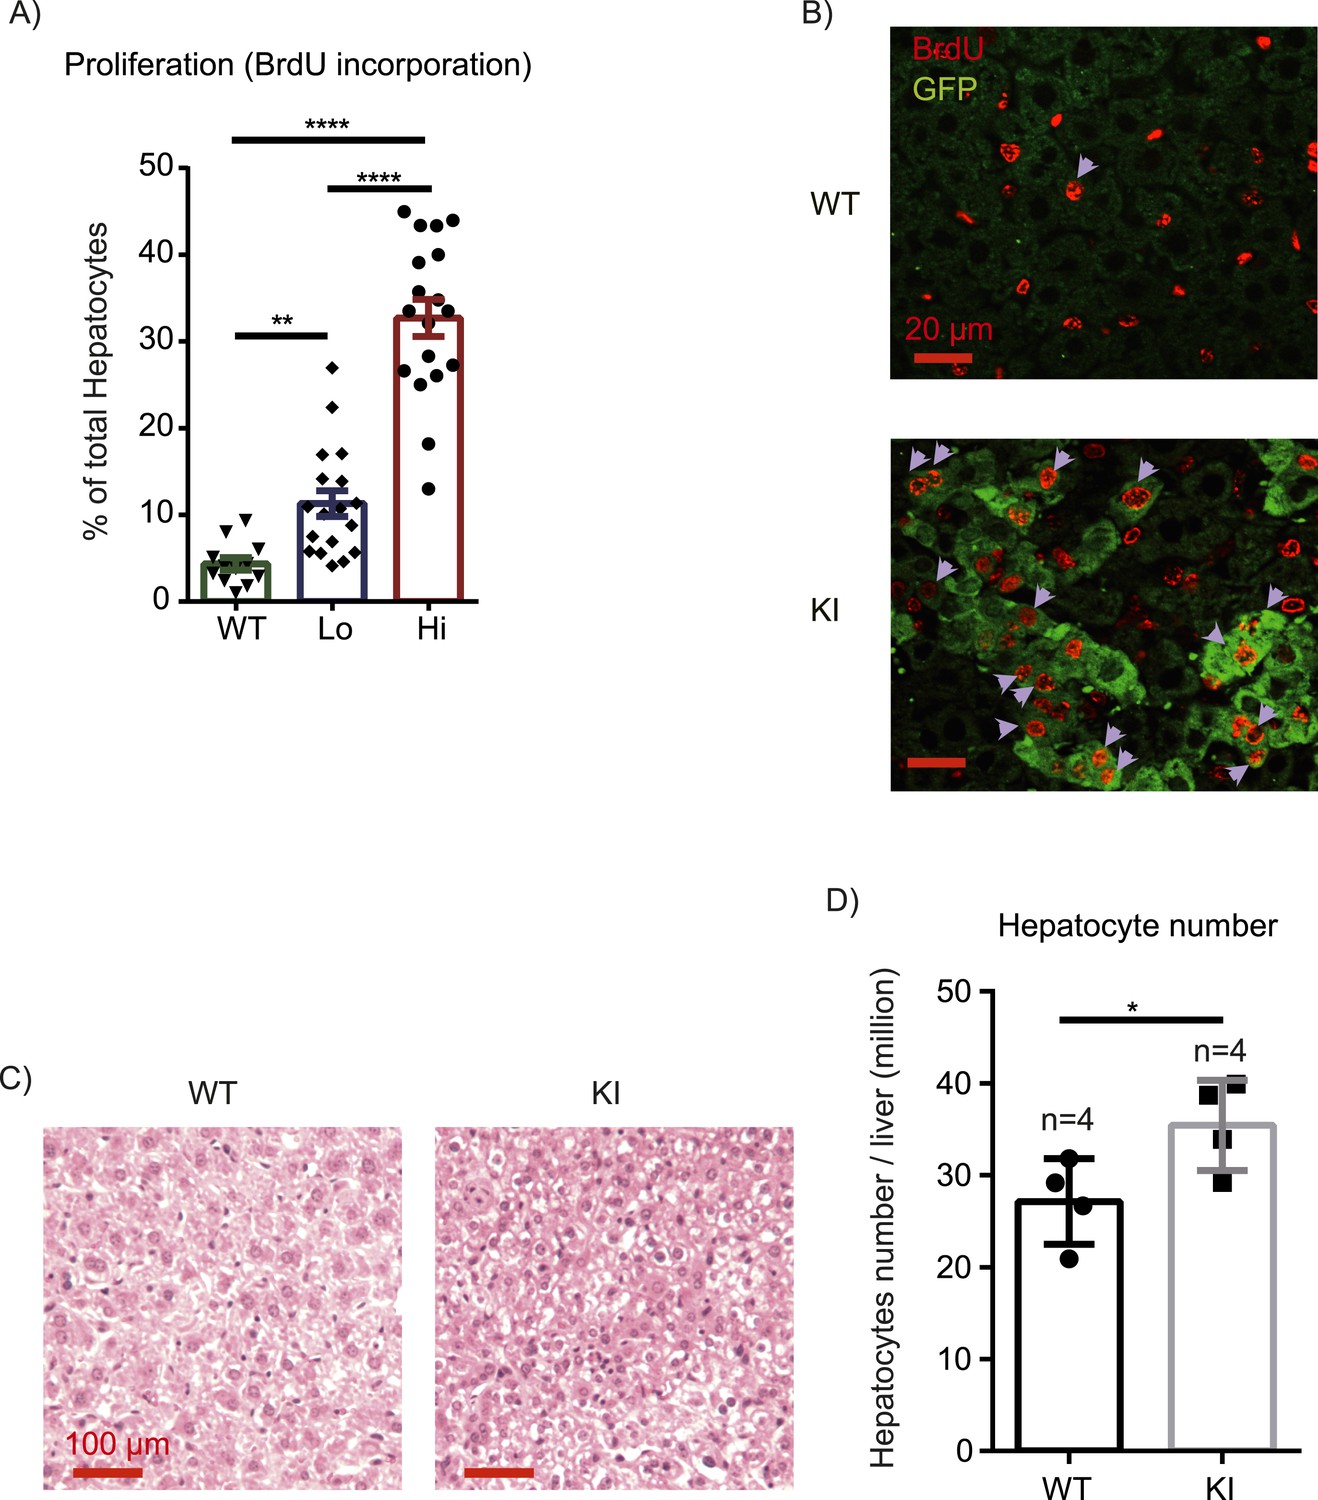
(A) Control (WT) or YapKIAlb-Cre mice were coinjected with BrdU and LPS for 6 days. Percentage of BrdU+ hepatocytes was quantified. 4–6 mice were used for each group and 3–4 images were taken for each mouse. Each dot represents cell count from each image. (B) A representative image of chronic (6xLPS) LPS injected livers used for the quantification in A. Arrows indicate BrdU+ hepatocyte nuclei. (C) H&E representative images of the chronic LPS-treated livers. (D) Hepatocyte numbers of the chronic LPS-treated livers was measured by quantitative flow cytometry.
Figure 5—figure supplement 1
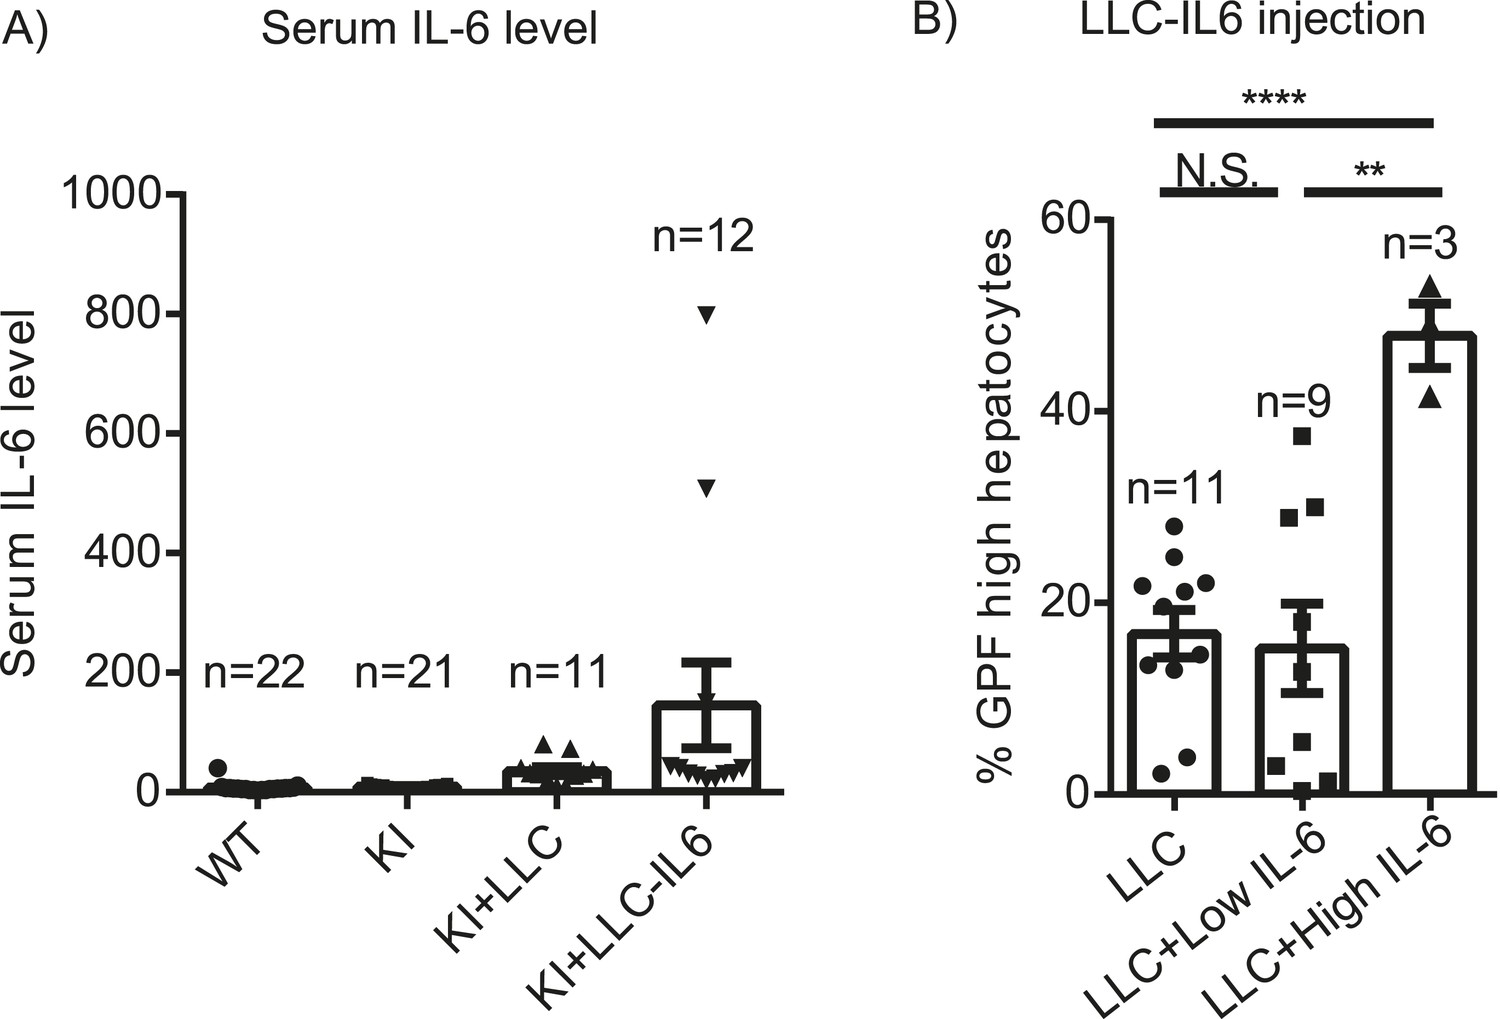
Role of IL-6 in expansion of Yap-overexpressing hepatocytes.
(A) 1- to 2-month-old YapKIAlb-Cre were injected s.c. with LLC cells stably expressing IL-6 (KI+LLC-IL-6), or empty vector (KI+LLC), and IL-6 levels in the serum were measured 14–20 days later. Untreated YapKI and WT mice were bled as controls. (B) Percentage of GFPhigh cells determined by flow cytometry in hepatocytes from 1- to 2-month-old YapKIAlb-Cre mice from (A) (grouped based on serum IL-6 levels).
Figure 5—figure supplement 2
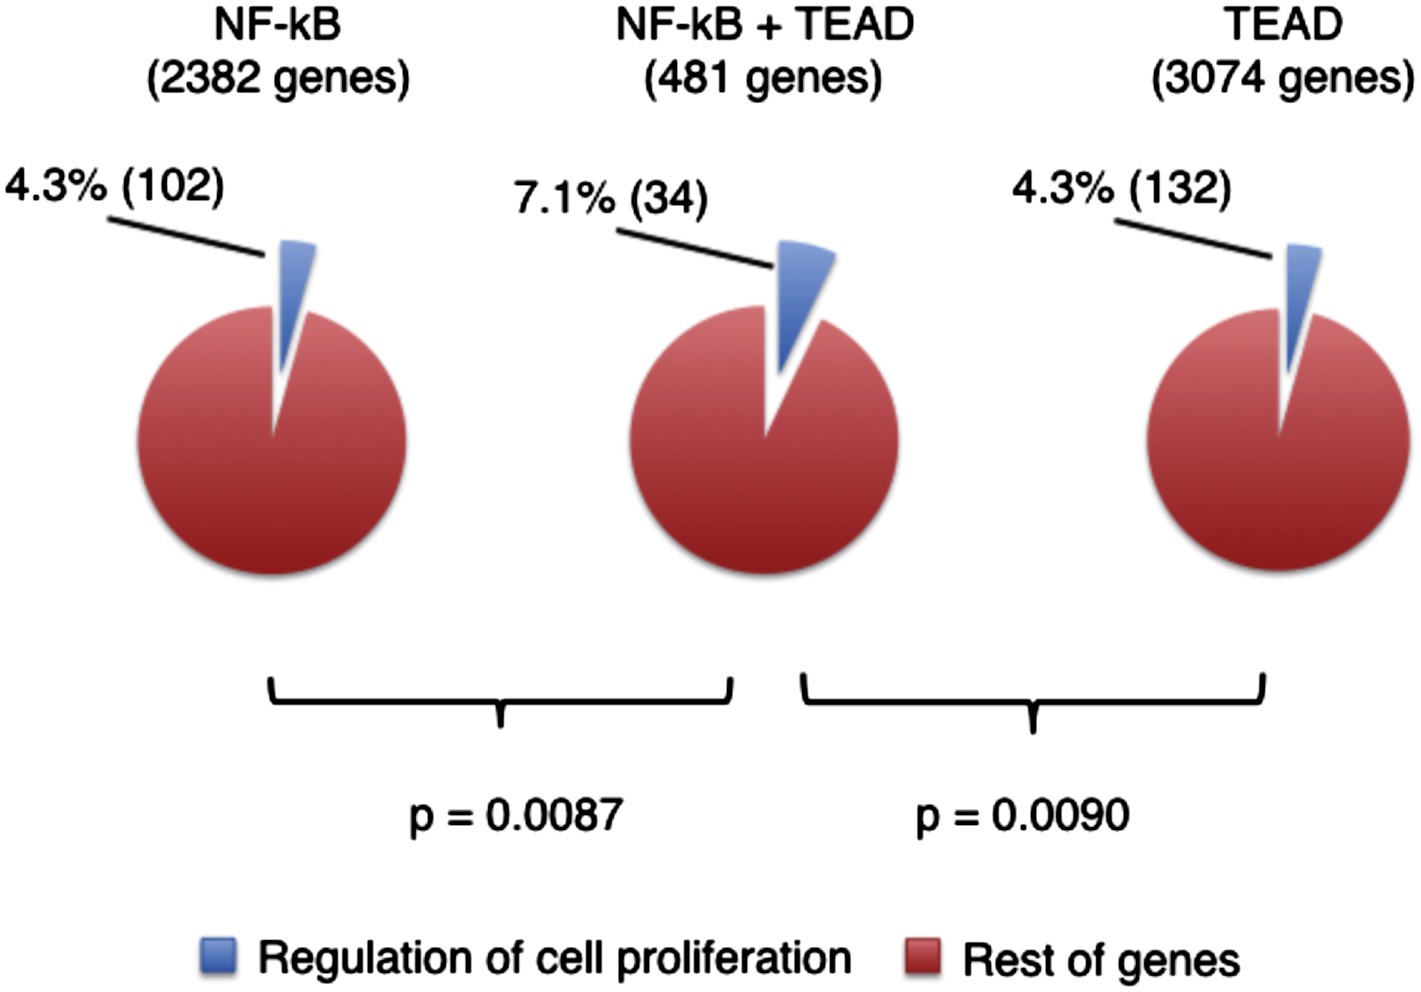
Correlation of TEAD and NFkB binding sites in the promoters of genes regulating proliferation.
Genes with DNA sequence motifs of NF-kB (p65) and/or TEADs were identified with Motifmap (NF-kB M00208, TEADs M01305), using mouse genome MM9 multiz30way. NF-kB motifs were found within 1 kb of gene transcription start sites (TSSs) and TEAD motifs were found within 10 kb of TSSs. Genes related to cell proliferation were identified with David gene ontology GO:0042127 for regulation of cell proliferation. Statistical significance was calculated with Chi-square test.
Figure 6 with 1 supplement
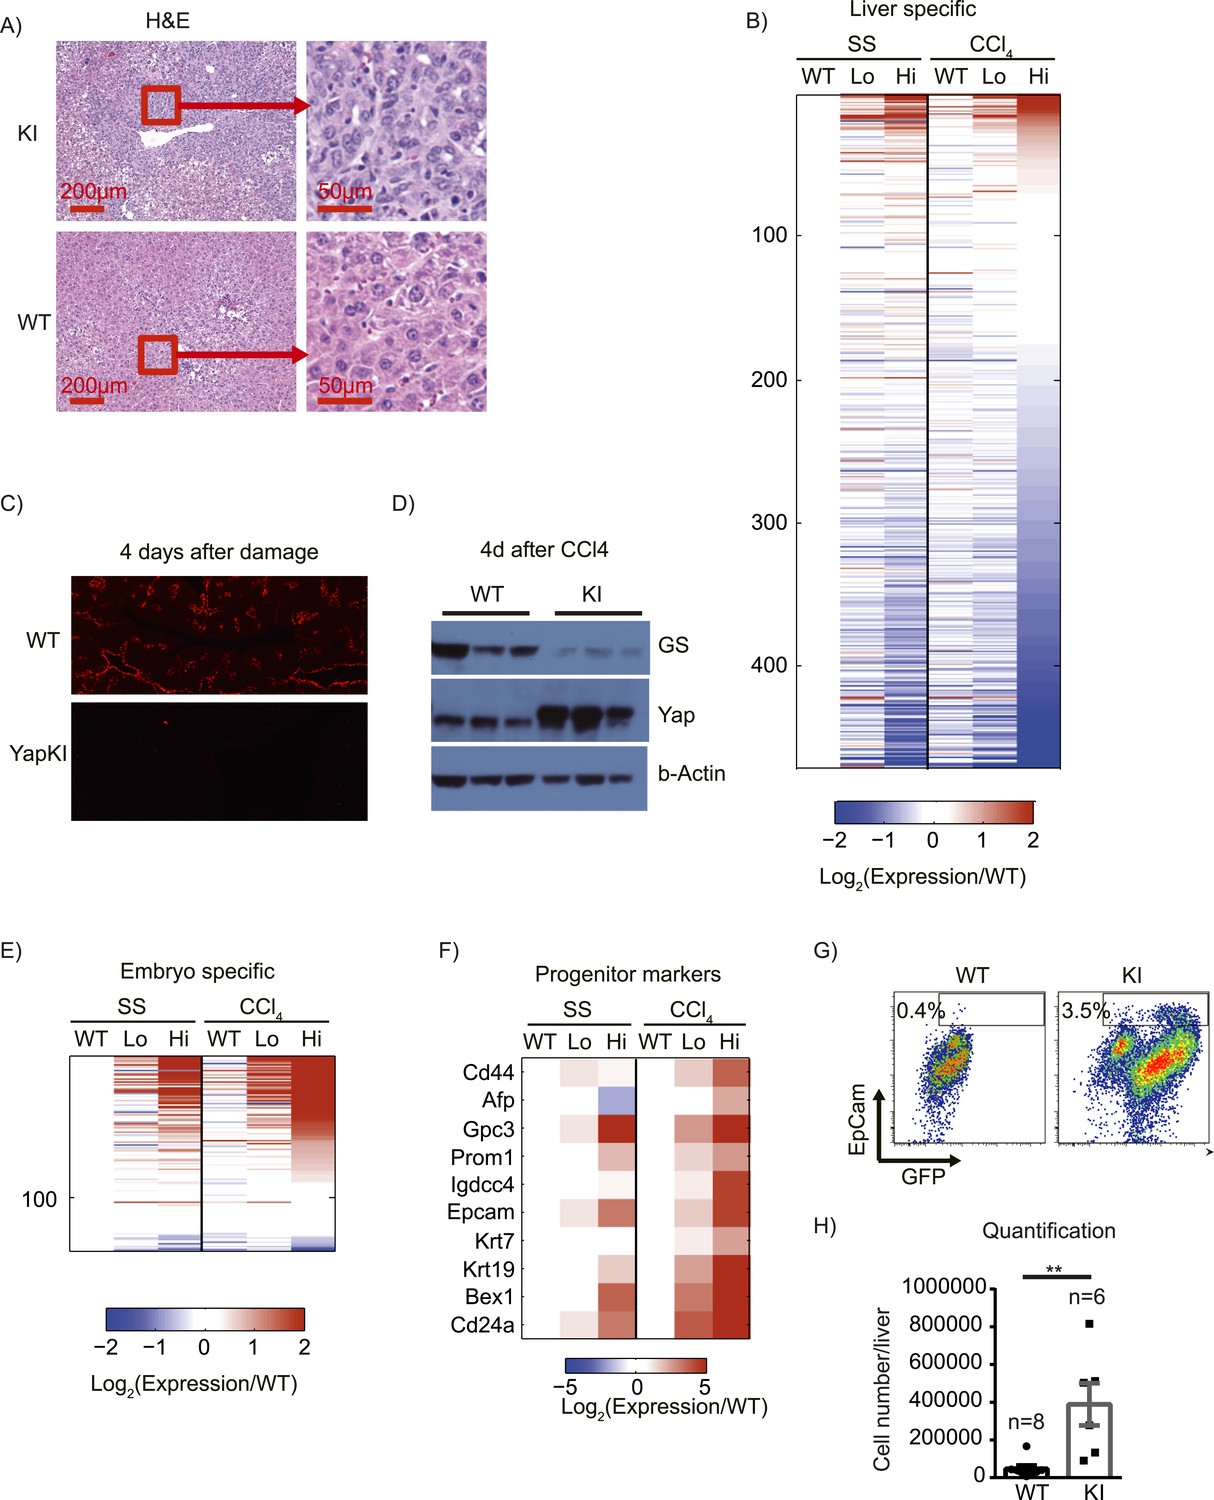
Yap activation cooperates with tissue injury to repress hepatocyte differentiation and promote progenitor phenotype.
(A) H&E staining of liver sections of control (WT) and YapKIAlb-Cre (KI) mice isolated on day 4 after CCL4 treatment. (B) Heatmap of RNA-sequencing data comparing expression of liver specific genes (see ‘Materials and methods’). Hepatocytes were sorted from wild-type livers (WT) or from YapKIAlb-Cre livers based on GFP levels (Lo and Hi), at steady state (SS) or on day 4 after CCl4 treatment (CCl4). The fold change is calculated between the indicated samples and WT in steady state. Data represent the mean of the duplicates. (C) Liver sections of control (WT) and YapKIAlb-Cre (KI) mice isolated on days 4 CCL4 treatment were stained with antibodies to glutamine synthase. (D) Glutamine synthase (GS), Yap and beta-actin protein levels in whole-liver protein lysates prepared on day 4 after CCl4 treatment were determined by Western blotting. Higher migrating band in the middle panel corresponds to the exogenous Yap (due to the in-frame triple flag tag). (E and F) Heatmaps showing the RNA-sequencing data for genes enriched in embryonic tissues (E) or progenitor markers (F). Hepatocytes were sorted from wild type livers (WT) or from YapKIAlb-Cre livers based on GFP levels (Lo and Hi), at steady state (SS) or on day 4 after CCl4 treatment (CCl4). The fold change is calculated between the indicated samples and wild type in steady state. (G and H) Flow cytometric analysis of primary hepatocytes isolated by collagenase perfusion from CCl4-treated control (WT) or YapKIAlb-Cre (KI) mice. (G) Representative flow cytometry plots gated of CD45− CD31− population. The numbers on the plots indicate the percentages of the gated population (EpCam+ progenitors). (H) The results from (G) were combined with the total hepatocyte numbers to calculate the number of hepatic EpCam+ progenitors per liver.
Figure 6—figure supplement 1
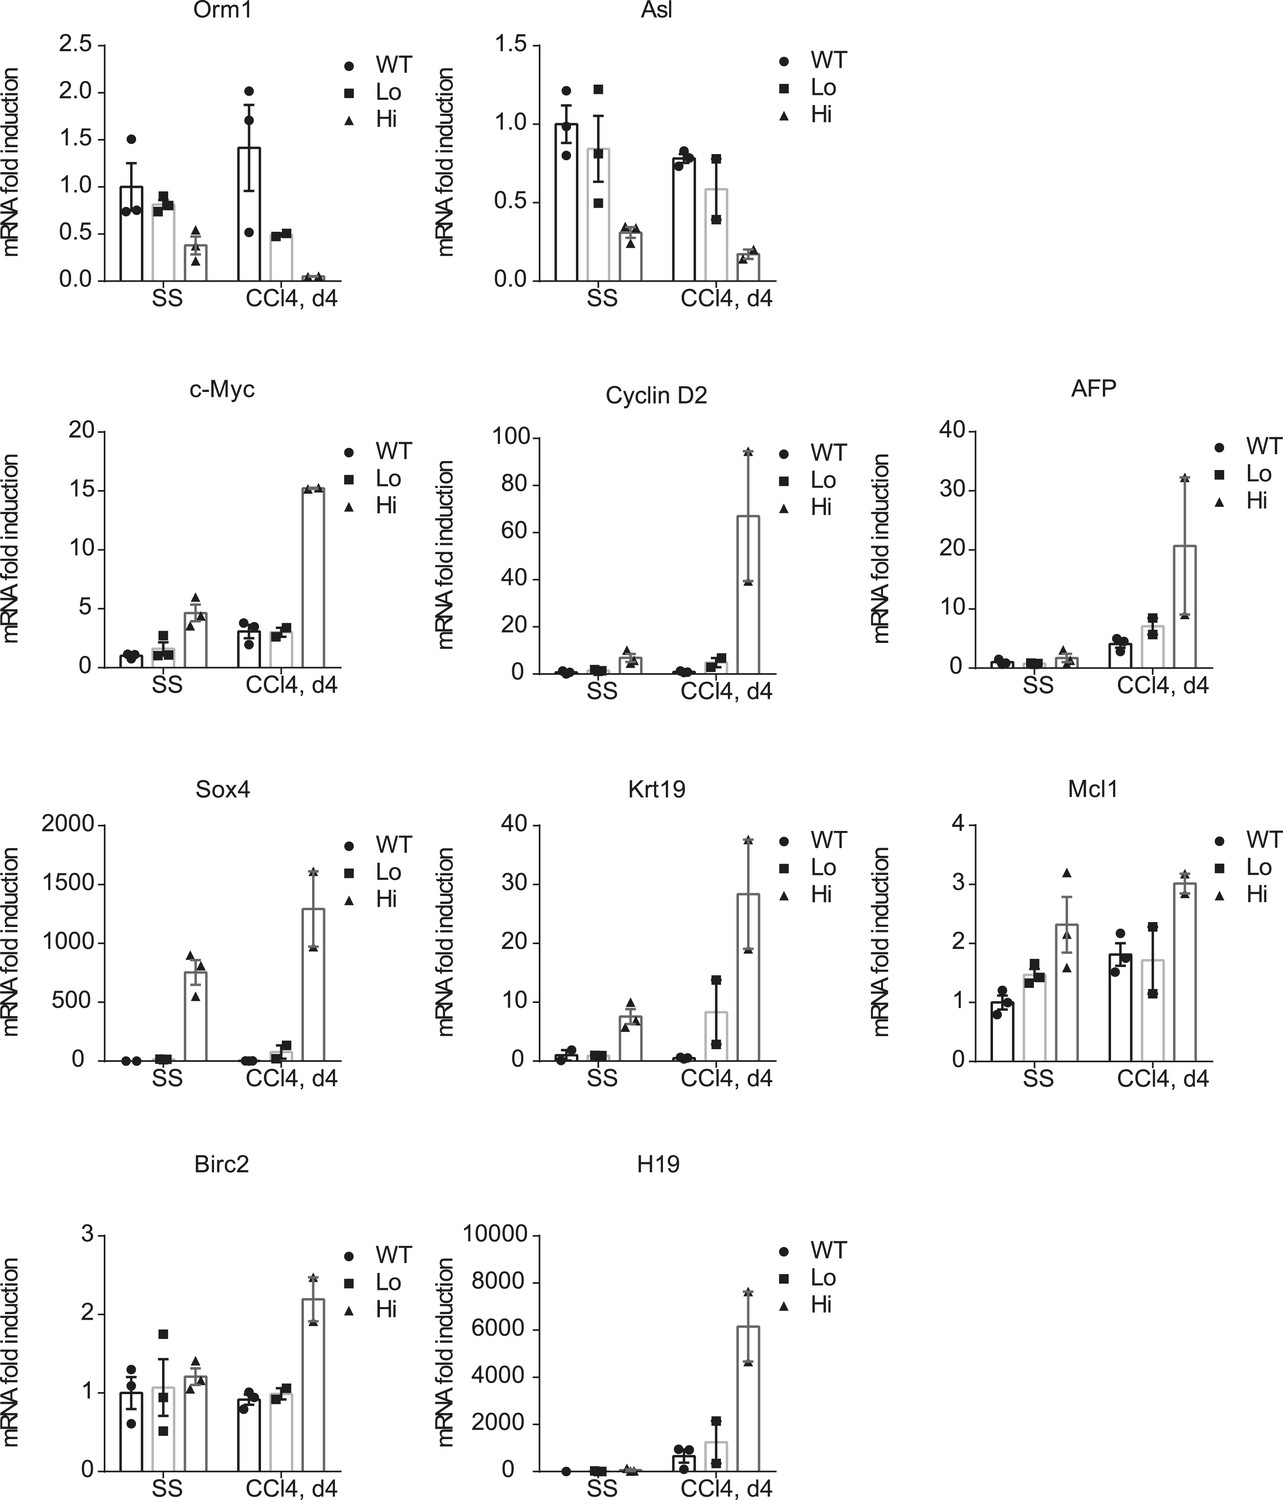
Verification of the RNA-sequencing results.
Primary hepatocytes of WT and YapKIAlb-Cre (KI) mice were sorted by flow cytometry based on GFP levels from steady-state livers (SS) or on day 4 after CCl4 treatment (CCL4) and gene expression determined by qPCR. Dots represent individual mice.
Figure 7
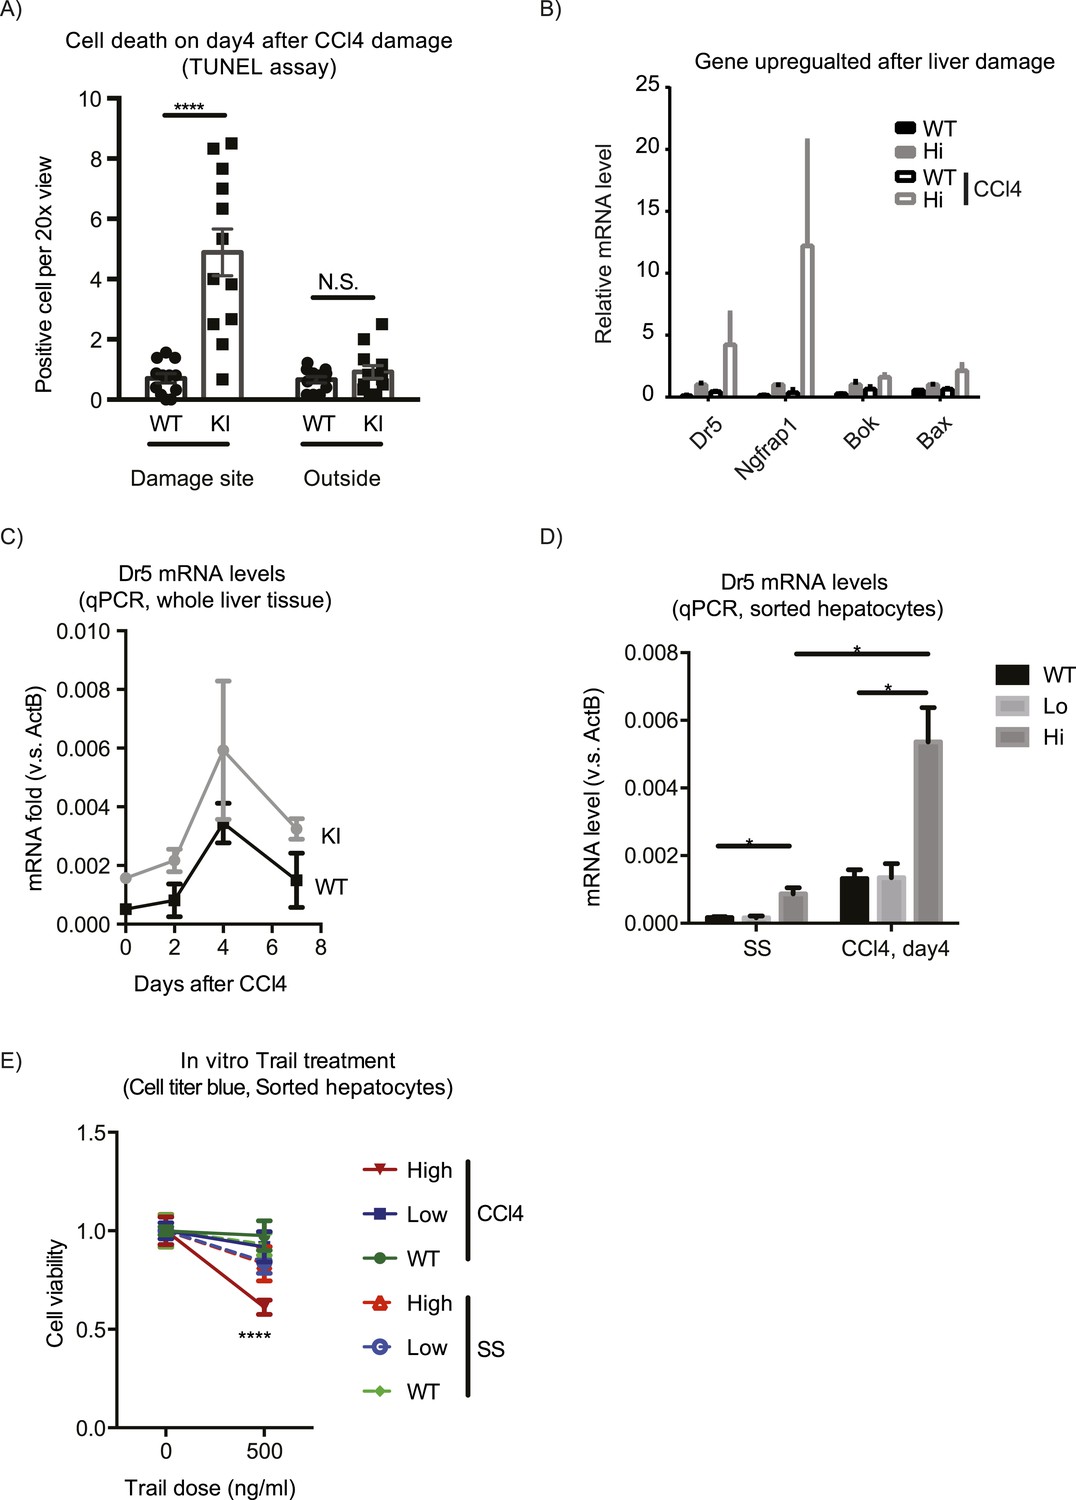
Yap sensitizes hepatocytes to TRAIL-mediated apoptosis.
(A) Cell death as reflected by TUNEL-positive cell numbers quantified outside the CV zone (‘outside’) and around CV (‘damage site’) in liver sections of YapKIAlb-Cre mice on day 4 after CCl4 treatment. 3–4 mice were used for each group and 3–4 images were taken from each mouse. Each dot represents cell count from each image. (B) RPKM data from RNA-sequencing illustrating expression of apoptosis-related genes in WT or Yaphigh (Hi) hepatocytes sorted from untreated (SS) livers or on day 4 after CCl4 treatment (CCl4). (C and D) Dr5 mRNA levels in WT and YapKIAlb-Cre livers (KI) at indicated time points after CCl4 treatment were determined by qPCR in whole liver extracts (C), or in primary hepatocytes sorted by flow cytometry based on GFP levels from steady-state livers (SS) or on day 4 after CCl4 treatment (CCL4) (D). 2–3 mice were used for each group. *p ≤ 0.05. (E) Primary hepatocytes sorted as in (D) were cultured on collagen-coated plates with or without TRAIL, and cell viability measured by CellTiter-Blue the next day. 3–4 mice were used for each group and 3–4 wells were seeded with hepatocytes from each mouse. Each dot represents reading from each well.
Author response image 1
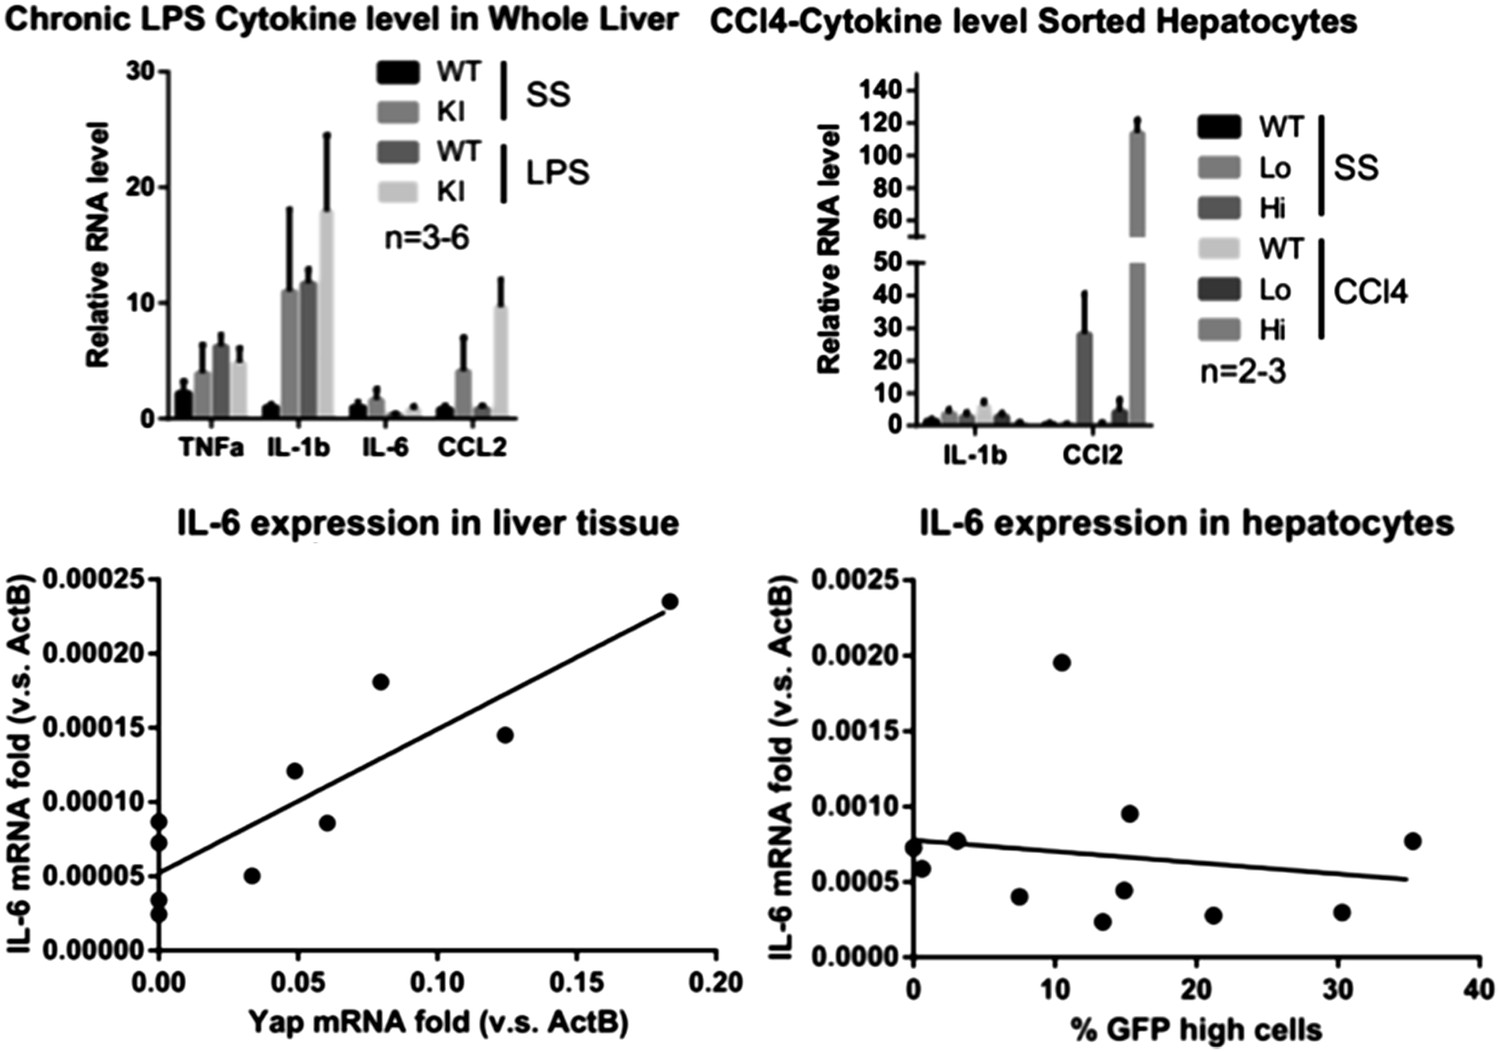
Expression of pro-inflammatory genes in YapKI livers.
Author response image 2
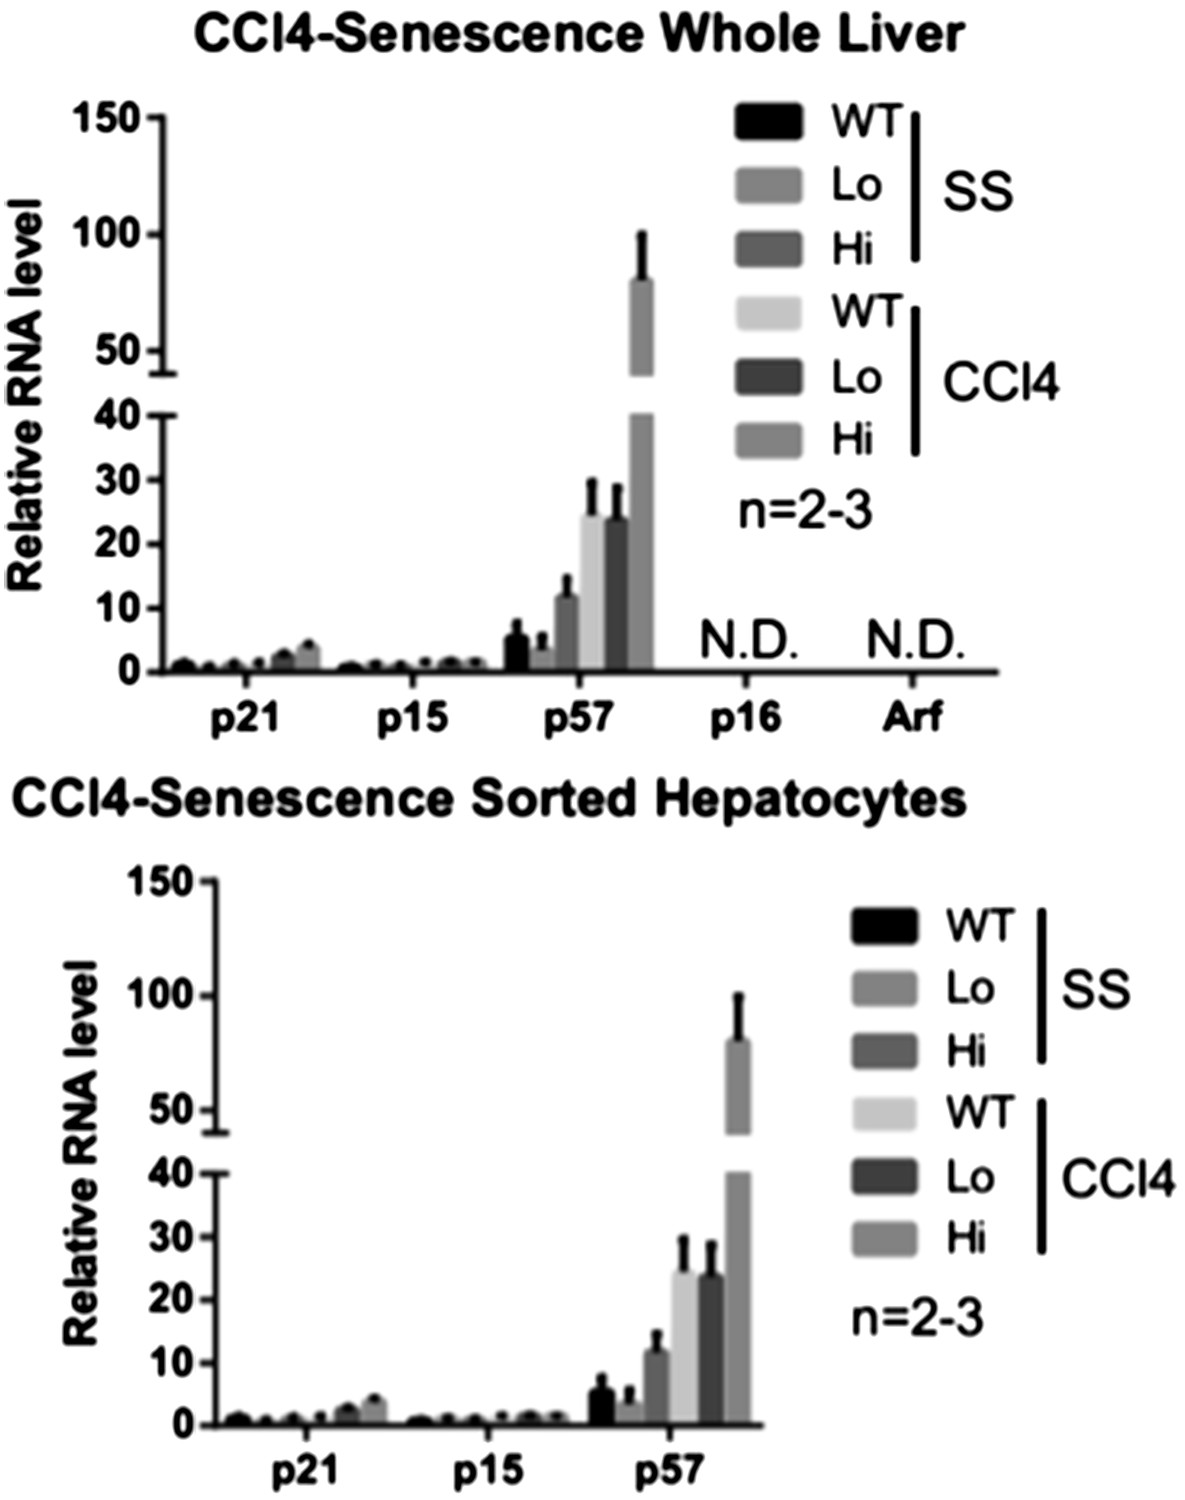
Expression of senescence-related genes in YapKI livers. ND, not detectable.
Author response image 3
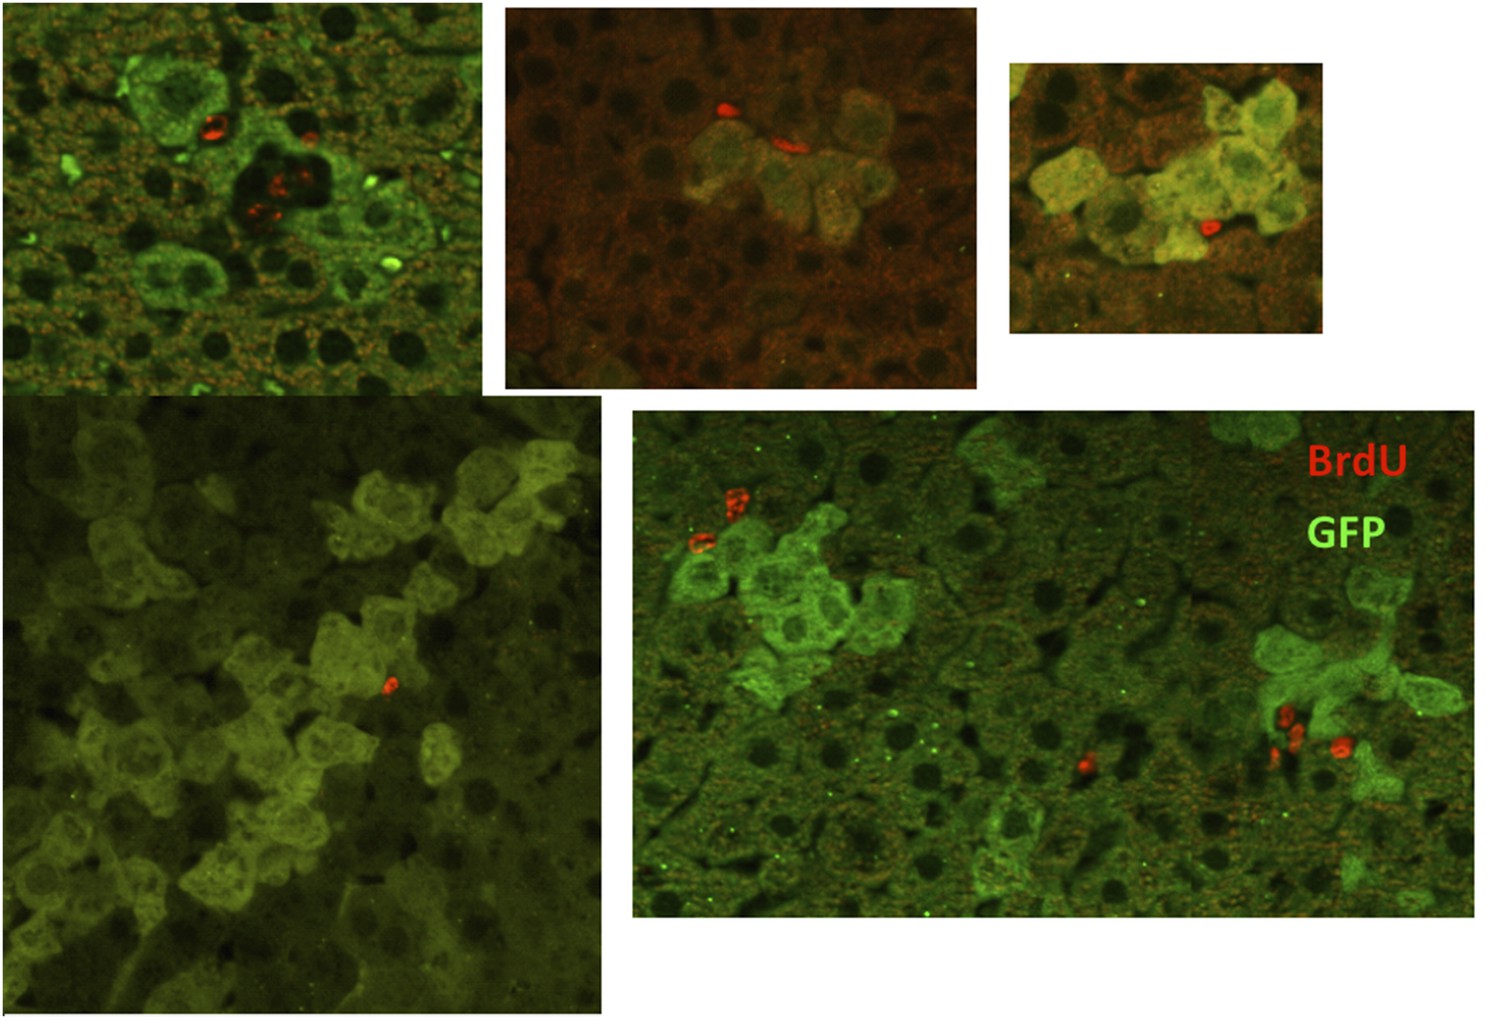
Stromal cells proliferate near Yaphigh hepatocytes
Author response image 4
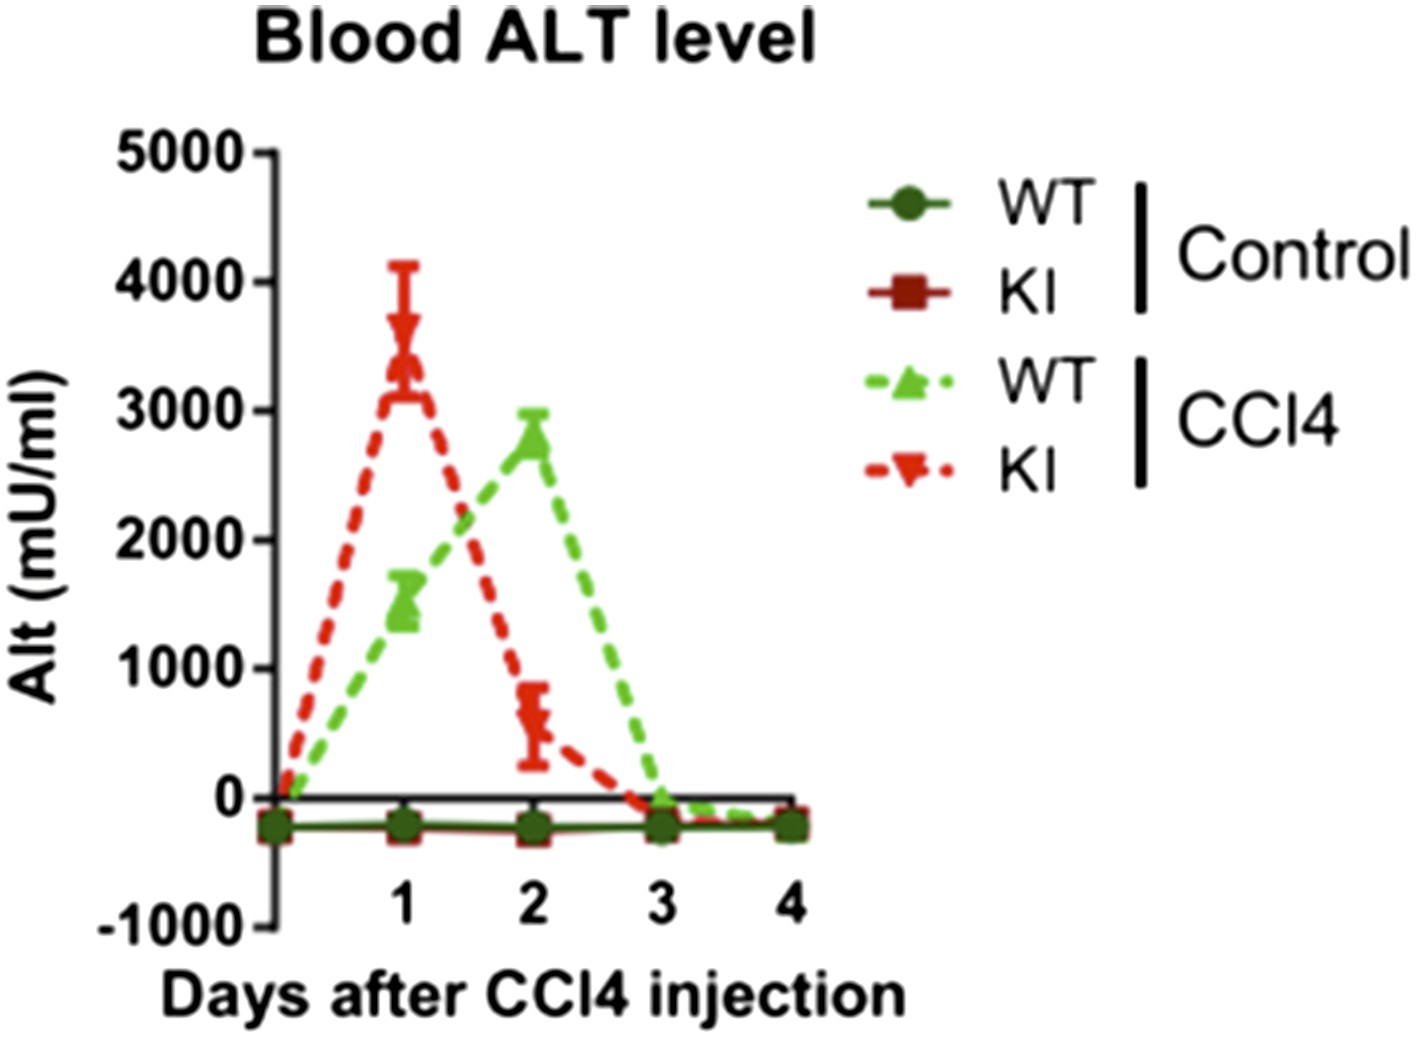
An independent repeat of the ALT levels in the blood of WT and YapKI littermates after CCl4 injection.
Additional files
-
Supplementary file 1
List of primer sequences.
- https://doi.org/10.7554/eLife.02948.031
Download links
A two-part list of links to download the article, or parts of the article, in various formats.
Downloads (link to download the article as PDF)
Open citations (links to open the citations from this article in various online reference manager services)
Cite this article (links to download the citations from this article in formats compatible with various reference manager tools)
Two-signal requirement for growth-promoting function of Yap in hepatocytes
eLife 4:e02948.
https://doi.org/10.7554/eLife.02948


