A role of OCRL in clathrin-coated pit dynamics and uncoating revealed by studies of Lowe syndrome cells
- Howard Hughes Medical Institute, Yale University School of Medicine, United States
- Yale University School of Medicine, United States
- Max Planck Institute of Biochemistry, Germany
Figures
Figure 1 with 1 supplement

The OCRL interactome strongly links this protein to clathrin-dependent membrane traffic.
(A and B) GFP fluorescence in HeLa M cells stably expressing GFP alone (A) or GFP-OCRL (B). Scale bar: 10 µm. (C) Endogenous OCRL immunoreactivity in HeLa M cells. Scale bar: 10 µm. (D) Anti-OCRL western blot of HeLa M cells stably expressing GFP-OCRL at near endogenous (End.) levels (left) and at five times (5X) the endogenous levels (right). (E) Coomasie Blue stained SDS-PAGE of proteins immunoprecipitated from control and GFP-OCRL stably expressing HeLa M cells using magnetic beads coupled to anti-GFP antibody. (F) Immunoblot analysis of the material shown in (E) with antibodies directed against OCRL (red) and clathrin (green), revealing the strong recovery of clathrin along with OCRL in the anti-GFP immunoprecipitates (IP). (G) Western blot analysis for OCRL interactors identified by mass spectrometry in anti-GFP immunoprecipitates from cells expressing GFP alone or GFP-OCRL. (H) Domain structure of OCRL indicating binding motifs for clathrin and AP-2. In the OCRLX3 mutant all three binding motifs are abolished (Mao et al., 2009). (I) Comparative immunoprecipitation from HeLa M cells expressing GFP-OCRLWT or GFP-OCRLX3, followed by immunoblot analysis for the indicated proteins.
Figure 1—figure supplement 1
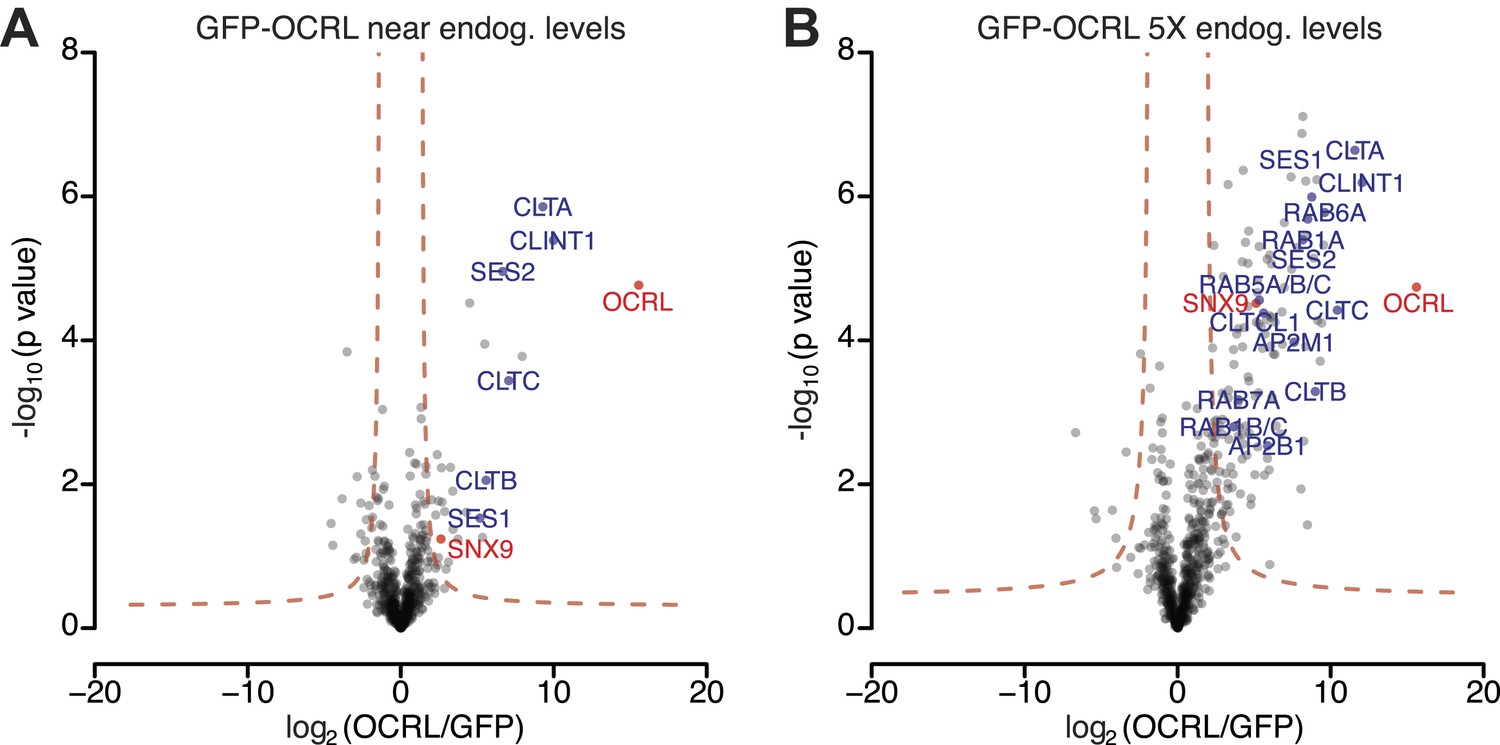
OCRL interactors identified by label-free quantitative proteomics in immunoprecipitates generated from cell lines expressing GFP-OCRL approximately at endogenous levels (1X) and 5-times (5X) higher levels.
(A and B) Volcano plots illustrating results of the label-free pull-downs of OCRL from HeLa cells stably expressing GFP-OCRL at 1X (A) or 5X levels (B). The logarithmic ratio of protein intensities in the GFP-OCRL/GFP-alone pulldowns was plotted against negative logarithmic p-values of the t test performed from triplicates. A hyperbolic curve (red dotted line) separates specific OCRL-interacting proteins from background. Known OCRL interactors such as clathrin subunits, AP-2 subunits, Rabs and Ses1/2, as well as novel interactors such as SNX9, show a significant ratio in combination with high reproducibility (positive log2 ratios).
Figure 2 with 1 supplement
SNX9 is a novel direct interactor of OCRL at clathrin-coated pits.
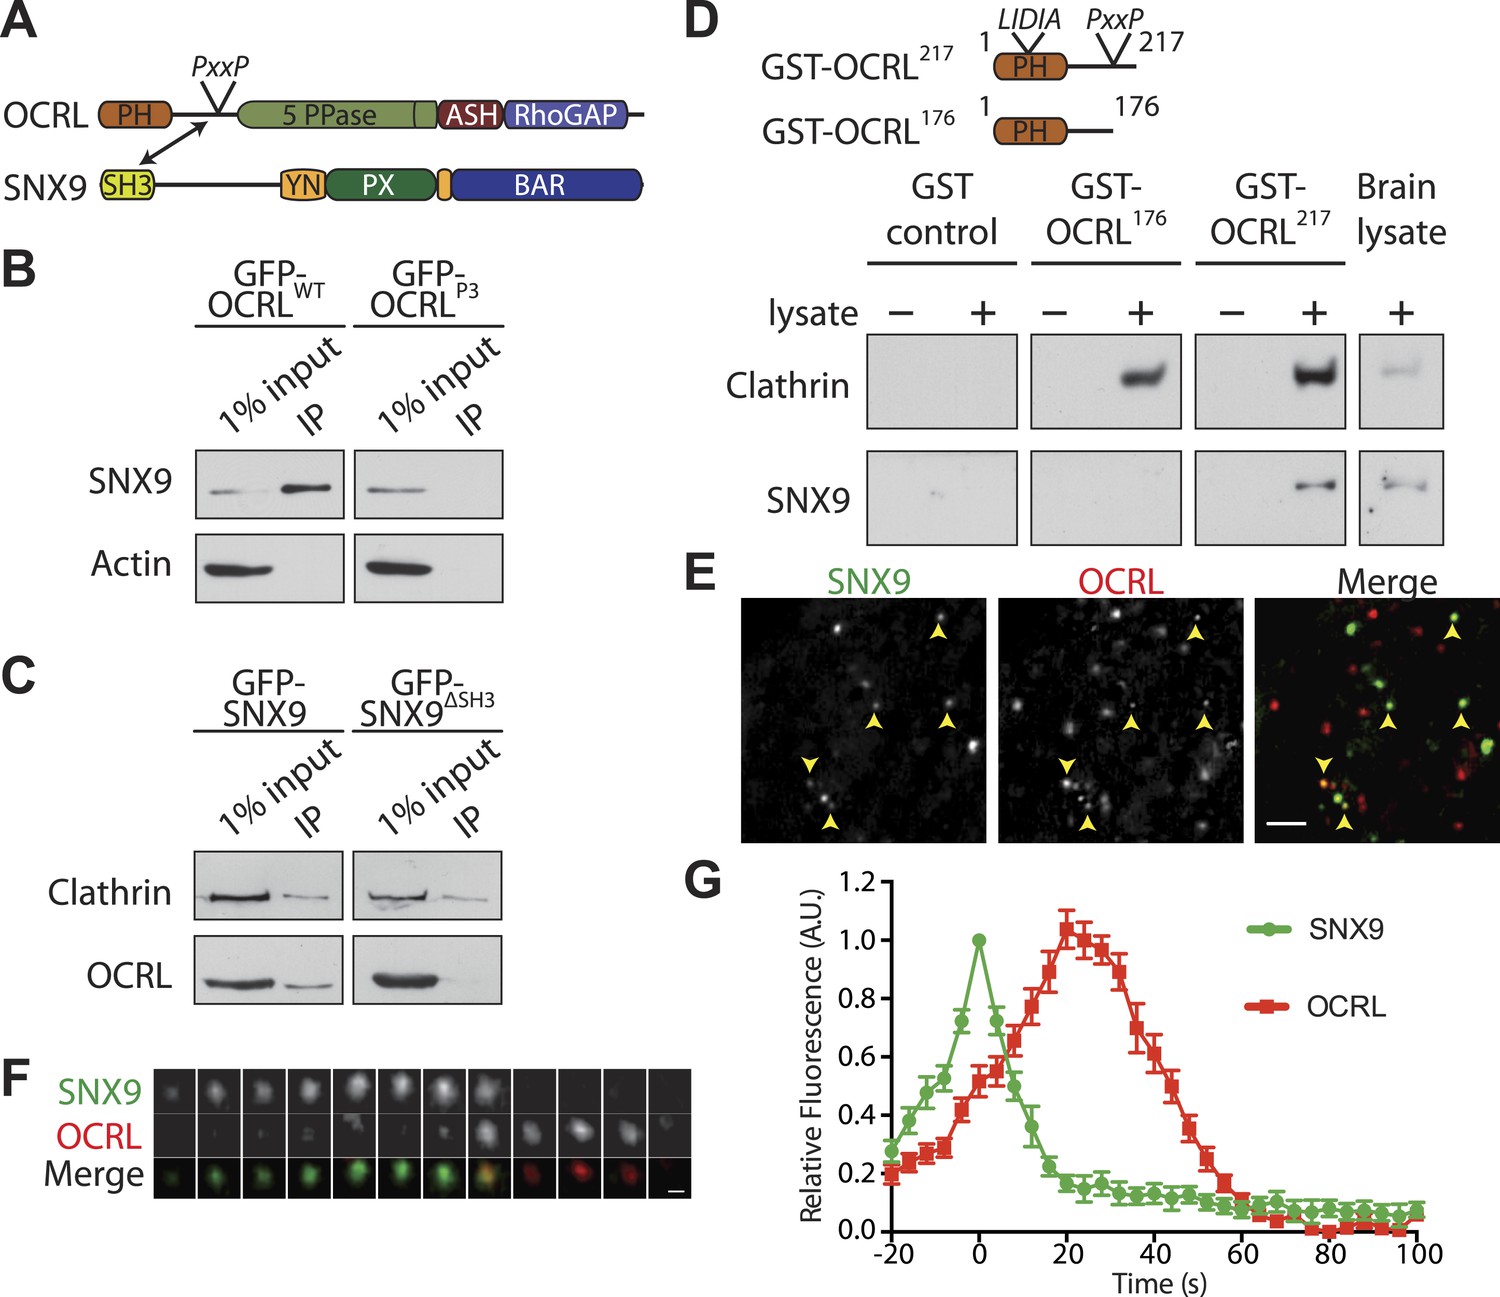
(A) Domain structure of OCRL and SNX9. The location of the PxxP site in OCRL is indicated. (B) Western blot showing the recovery of SNX9 in immunoprecipitates generated from HEK293T cells expressing full length GFP-OCRLWT or a GFP-OCRL mutant in which the PxxP site was mutated (GFP-OCRLP3). Endogenous SNX9 was recovered only in the immunoprecipitates of GFP-OCRLWT. Actin is shown as a control. (C) Western blot showing the recovery of endogenous OCRL in immunoprecipitates from cells expressing GFP-SNX9WT but not from cells expressing GFP-SNX9 mutant missing the SH3 domain (GFP-SNX9ΔSH3). Note that binding of SNX9 to clathrin, which binds SNX9 outside the SH3 domain, is not lost. (D) (Top) Schematic representation of GST-OCRL constructs comprising the PH domain and portions of the predicted unstructured flanking region including (GST-OCRL217) or excluding (GST-OCRL176) the PxxP motif. Both constructs include the clathrin-box found inside the PH domain. (Bottom) GST pulldowns from a mouse brain extract using GST alone or GST fusions of OCRL as baits. Subsequent western blot analysis of the bound material shows that both constructs recover clathrin, but only GST-OCRL217 recovers SNX9. (E) Confocal microscopy of wild type human fibroblasts expressing GFP-SNX9 and mCherry-OCRL. Most SNX9 spots colocalize with OCRL (yellow arrowheads) and nearly all SNX9 spots acquire OCRL during the acquisition. Scale bar: 2 µm. (F) Sequential confocal images (8 s apart) of an SNX9 spot that acquires OCRL. Scale bar: 0.3 µm. (G) Average time course of fluorescence intensity for SNX9 and OCRL at individual pits. The peak of SNX9 fluorescence was defined as time zero (mean ± SEM, n = 150 events, 10 different cells).
Figure 2—figure supplement 1
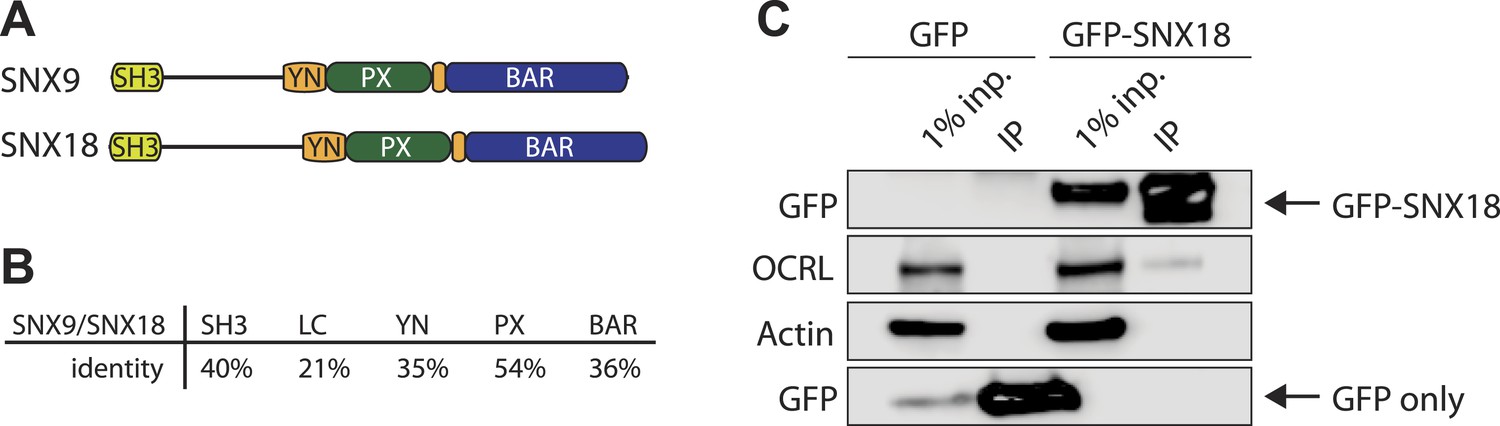
SNX18 interacts with OCRL.
(A) Domain structure of SNX9 and SNX18. (B) Percent identity of the different domains in SNX9 and SNX18 following alignment with ClustalW. (C) Western blot for the proteins indicated on the left, showing the recovery of endogenous OCRL in anti-GFP immunoprecipitates from cells expressing GFP-SNX18 compared to cells expressing GFP alone. Actin is shown as a loading control. Inp = input cell extract used for the immunoprecipitation.
Figure 3
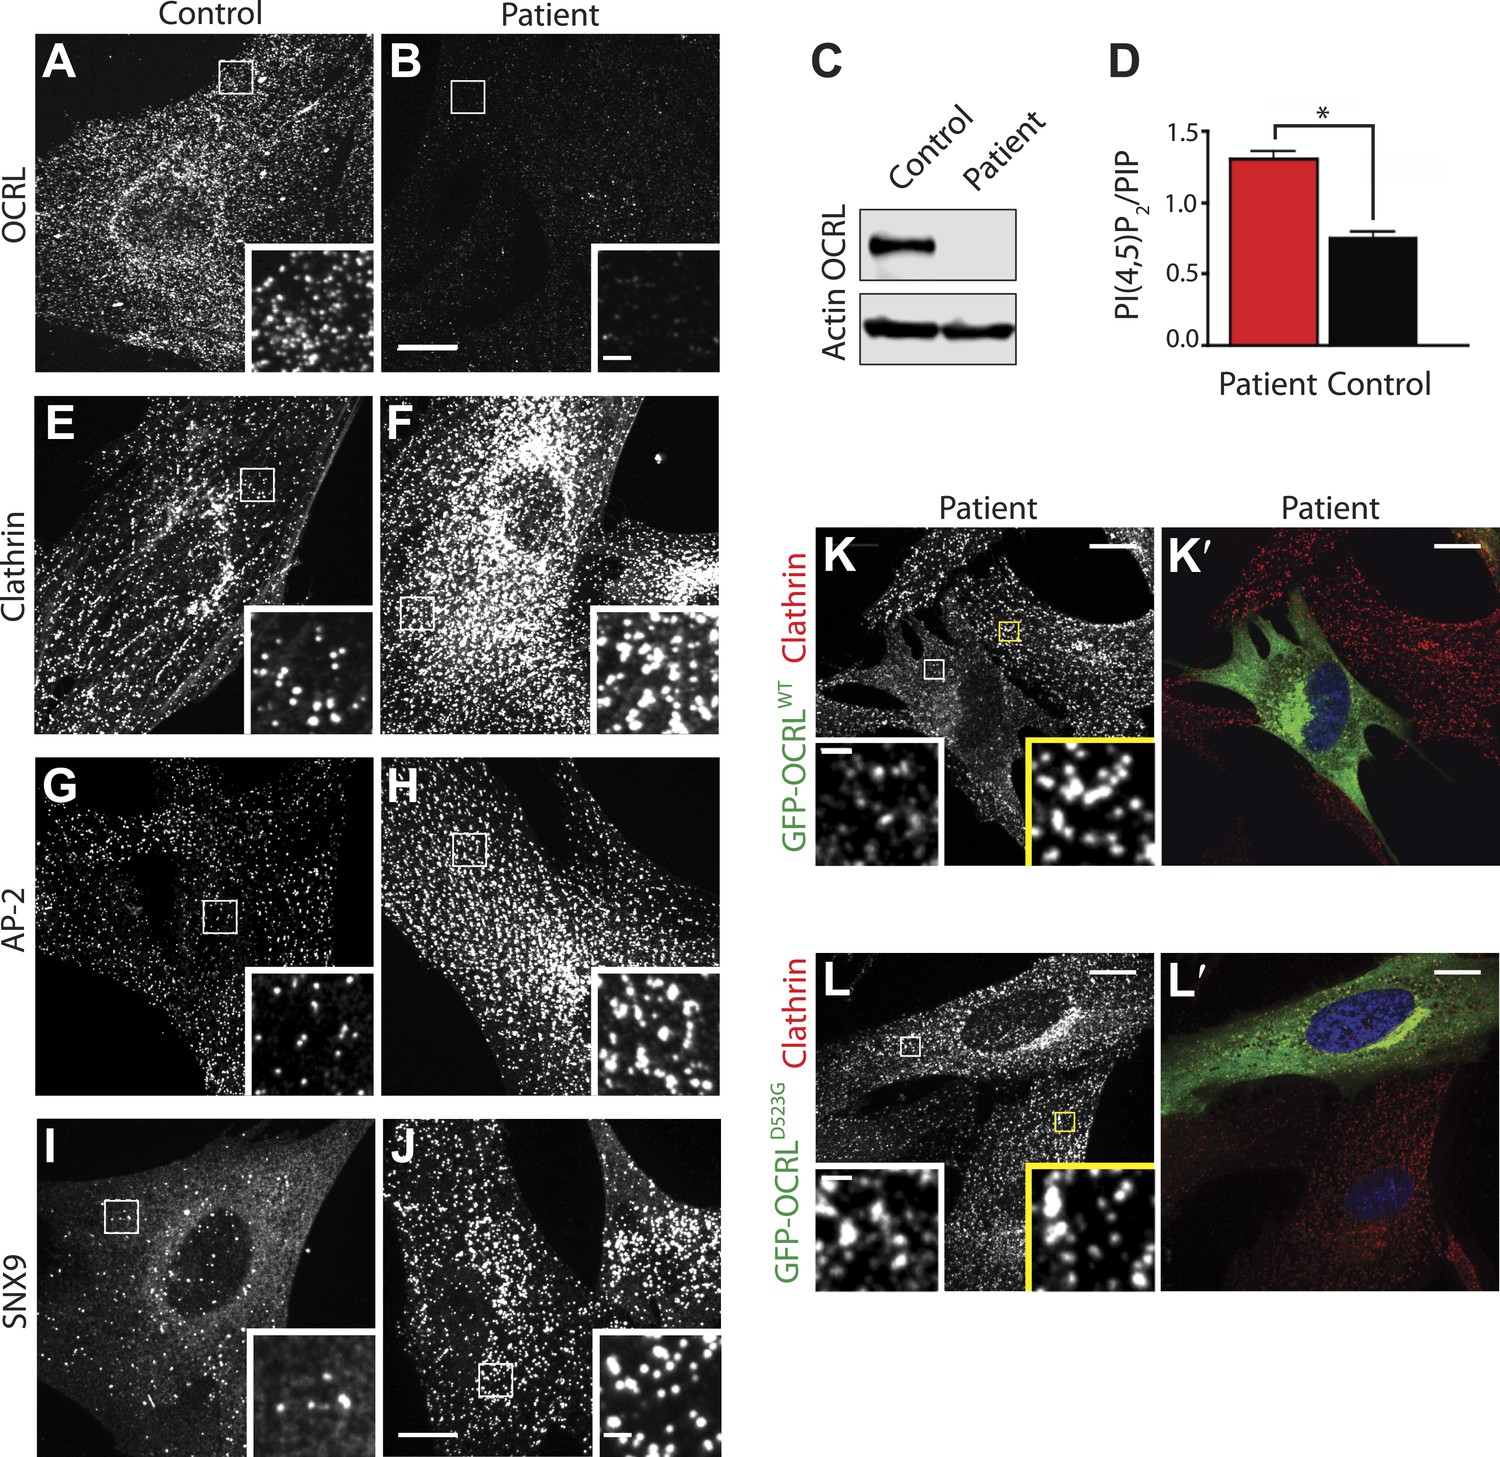
Abnormal distribution of endocytic factors in Lowe syndrome fibroblasts.
(A and B) Immunofluorescence staining for OCRL in control (A) and Lowe syndrome fibroblasts (B), revealing the lack of OCRL in patient cells. Insets show higher magnifications of the boxed regions. Scale bar full size: 10 µm; inset: 1 µm. (C) Immunoblot analysis using a monoclonal antibody directed against the C-terminal region of human OCRL demonstrates the absence of the protein in patient cells. Actin is shown as a loading control. (D) High pressure liquid chromatography (HPLC) analysis of cell extracts showing an increase in PI(4,5)P2 levels in patient cells (Student's t test, *p = 0.01). (E–J) Immunofluorescence staining of control (left) and Lowe syndrome fibroblasts (right) for clathrin (E–F), AP-2 (G–H) and SNX9 (I–J) revealing the enhanced punctate immunoreactivity for endocytic factors in patient cells. Insets show higher magnifications of the boxed regions. Scale bar full size: 10 µm; inset: 1 µm. (K–L′) Rescue of the clathrin phenotype (K) and (L) in patient cells following expression of GFP-OCRLWT (K′) but not in cells expressing the catalytically inactive GFP-OCRLD523G (L′). Insets show higher magnifications of the boxed regions. Region and inset framed in white depict cells expressing the transfected construct (either GFP-OCRLWT (K–K′) or OCRLD523G (L–L′)). Region and inset framed in yellow show cells that did not express the GFP-tagged constructs. Scale bar full size: 10 µm; inset: 1 µm.
Figure 4
Defects in clathrin-mediated endocytosis in Lowe syndrome fibroblasts.
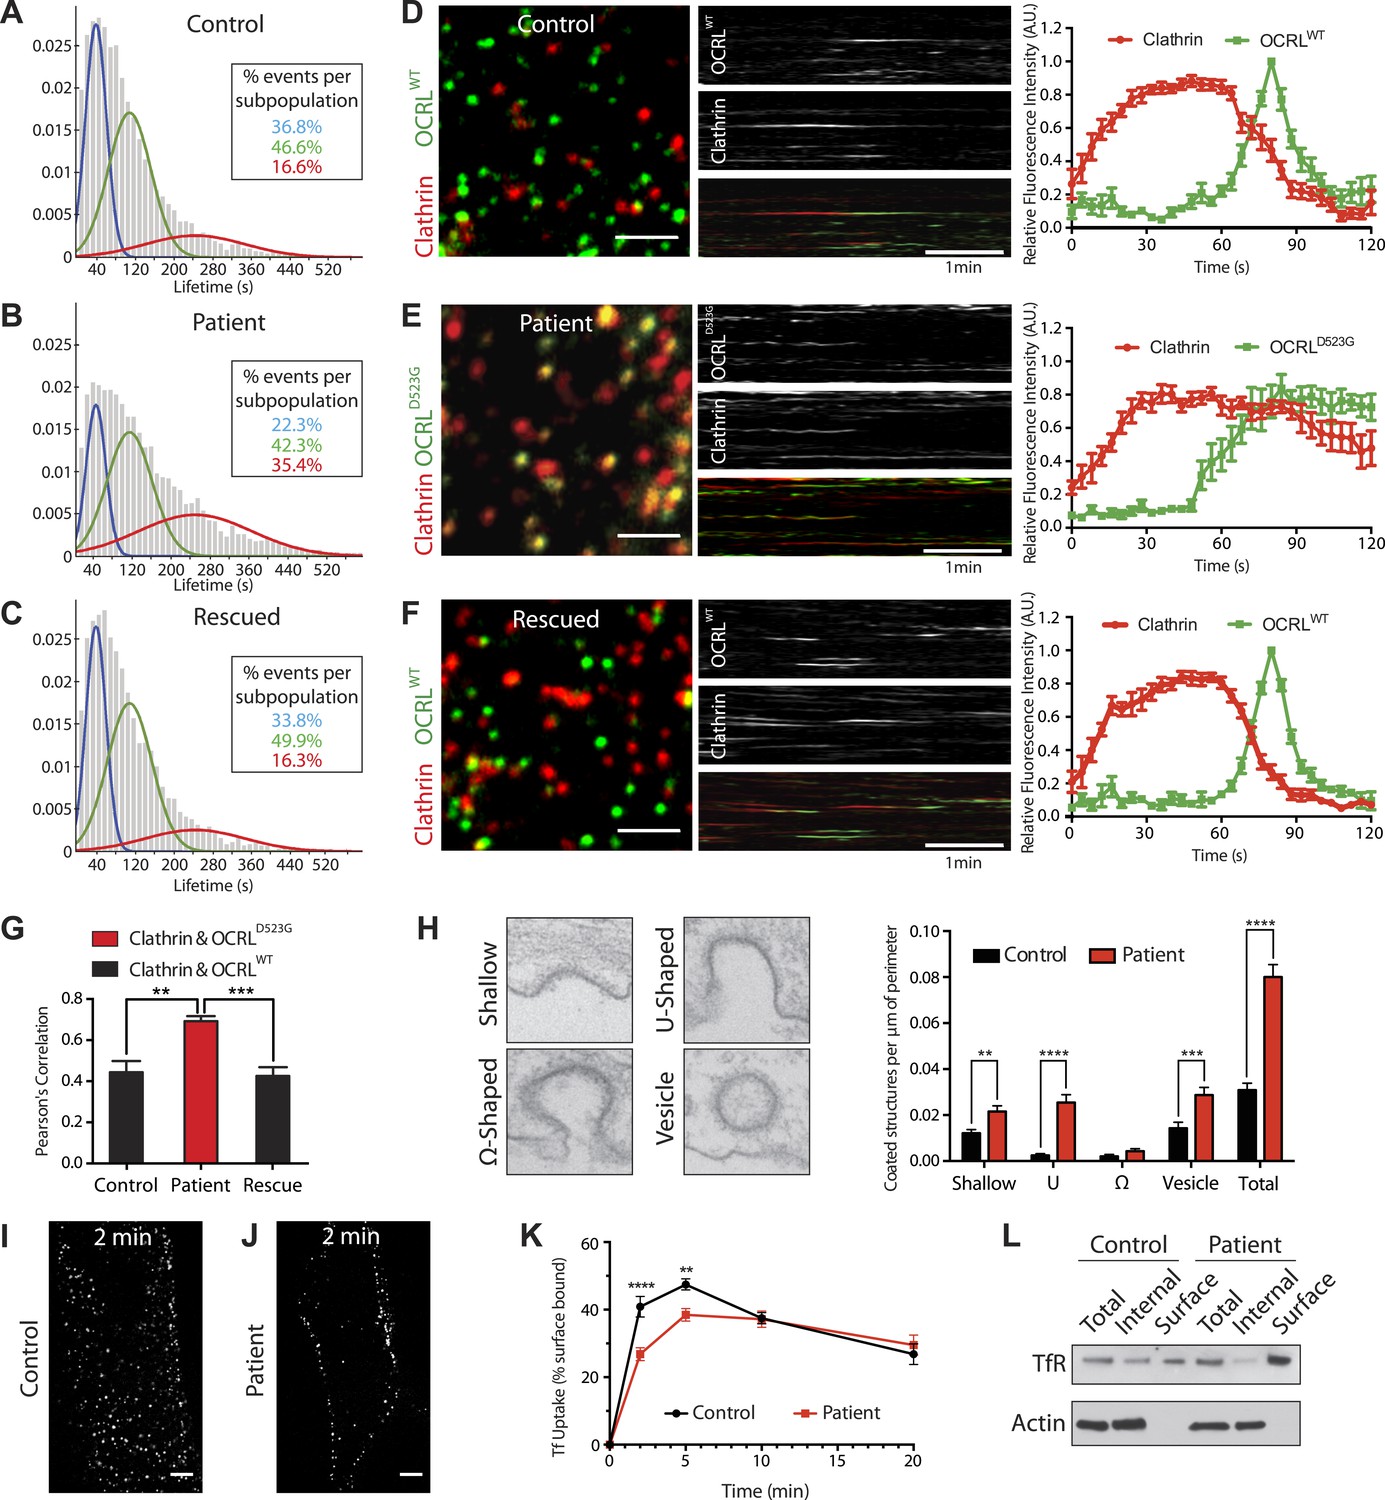
(A–C) Global lifetime distribution of AP-2 subunit µ2-GFP spots (reflecting endocytic clathrin-coated pits), as assessed by TIRF microscopy in control (A), patient cells (B) and patient cells rescued with mCherry-OCRLWT (C) (Ordinate represents the relative frequency spots at each time point). Histograms were fitted with a Gaussian mixture model identifying three subpopulations of endocytic clathrin-coated pits: short- (mean 40 s, blue), medium- (mean 108 s, green) and long-lived (mean 244 s, red). Note the increase in size of the long-lived subpopulation (red) in patient cells (B), which is rescued by the re-expression of mCherry-OCRLWT (C), (n of events = 8657, 9605, and 6930 respectively; n of cells examined = 12, 12 or 7, respectively). (D–F) Spinning disk analysis of endocytic clathrin-coated pits in control and patient fibroblasts expressing RFP-CLC and GFP-OCRLWT or GFP-catalytically dead OCRL (GFP-OCRLD523G). Representative images are shown in the left panels, kymographs in the middle panels and tracings of the average time courses of fluorescence in the right panels (mean ± SEM, n = 45 events per condition, 3 separate experiments). In control cells (D), there is little overlap between red (clathrin) and predominantly green (OCRL) spots, indicating OCRL recruitment when clathrin fluorescence has started to dim. The signal for OCRL then rapidly disappears as the free vesicle moves away from the imaging plane. The same pattern can be observed in patients cells rescued with OCRLWT (F), while in patient cells expressing OCRLD523G, clathrin lingers for longer times even after the recruitment of OCRL, leading to a substantial overlap of red and green spots (E). Scale bar full size: 2 µm; kymograph: 1 min (red: clathrin; green: OCRL). (G) Colocalization of clathrin and OCRL fluorescence on individual spots from images such as those shown in the left fields of (D–F) as determined by a colocalization plugin on ImageJ (‘Materials and methods’) and reported as Pearson's correlation coefficient (mean ± SEM, n = 7 different cells, 4 separate experiments; two tailed student's t test, ** denotes p = 0.0014 and *** denotes p = 0.0001). (H) Representative images (left) and quantification (right) of different stages of clathrin-mediated endocytosis showing a striking increase in the number of U-shaped pits and coated vesicles per μm of cell perimeter (n = 60 cells; two tailed student's t test, ** denotes p = 0.001, *** denotes p = 0.0001 and **** denotes p = 0.00001). (I and J) A mid-plane confocal image of control (I) and patient (J) cells showing the internalization of Alexa594-labeled transferrin (Tf) that occurs in 2 min. Note that in patient cells transferrin remains mostly at the cell surface. Scale bar: 10 µm. (K) Time course of biotinylated-transferrin internalization in control and patient cells measured by an ELISA-based assay. Uptake is represented as percent of total surface bound biotin-transferrin at 4°C. (n = 3 experiments; two tailed student's t test, ** denotes p = 0.001, and **** denotes p = 0.00001). (L) Internal and surface exposed Tf receptor in control and patient cells as revealed by a biotinylation assay, demonstrating the increase of the surface pool of receptor in patient cells.
Figure 5 with 2 supplements
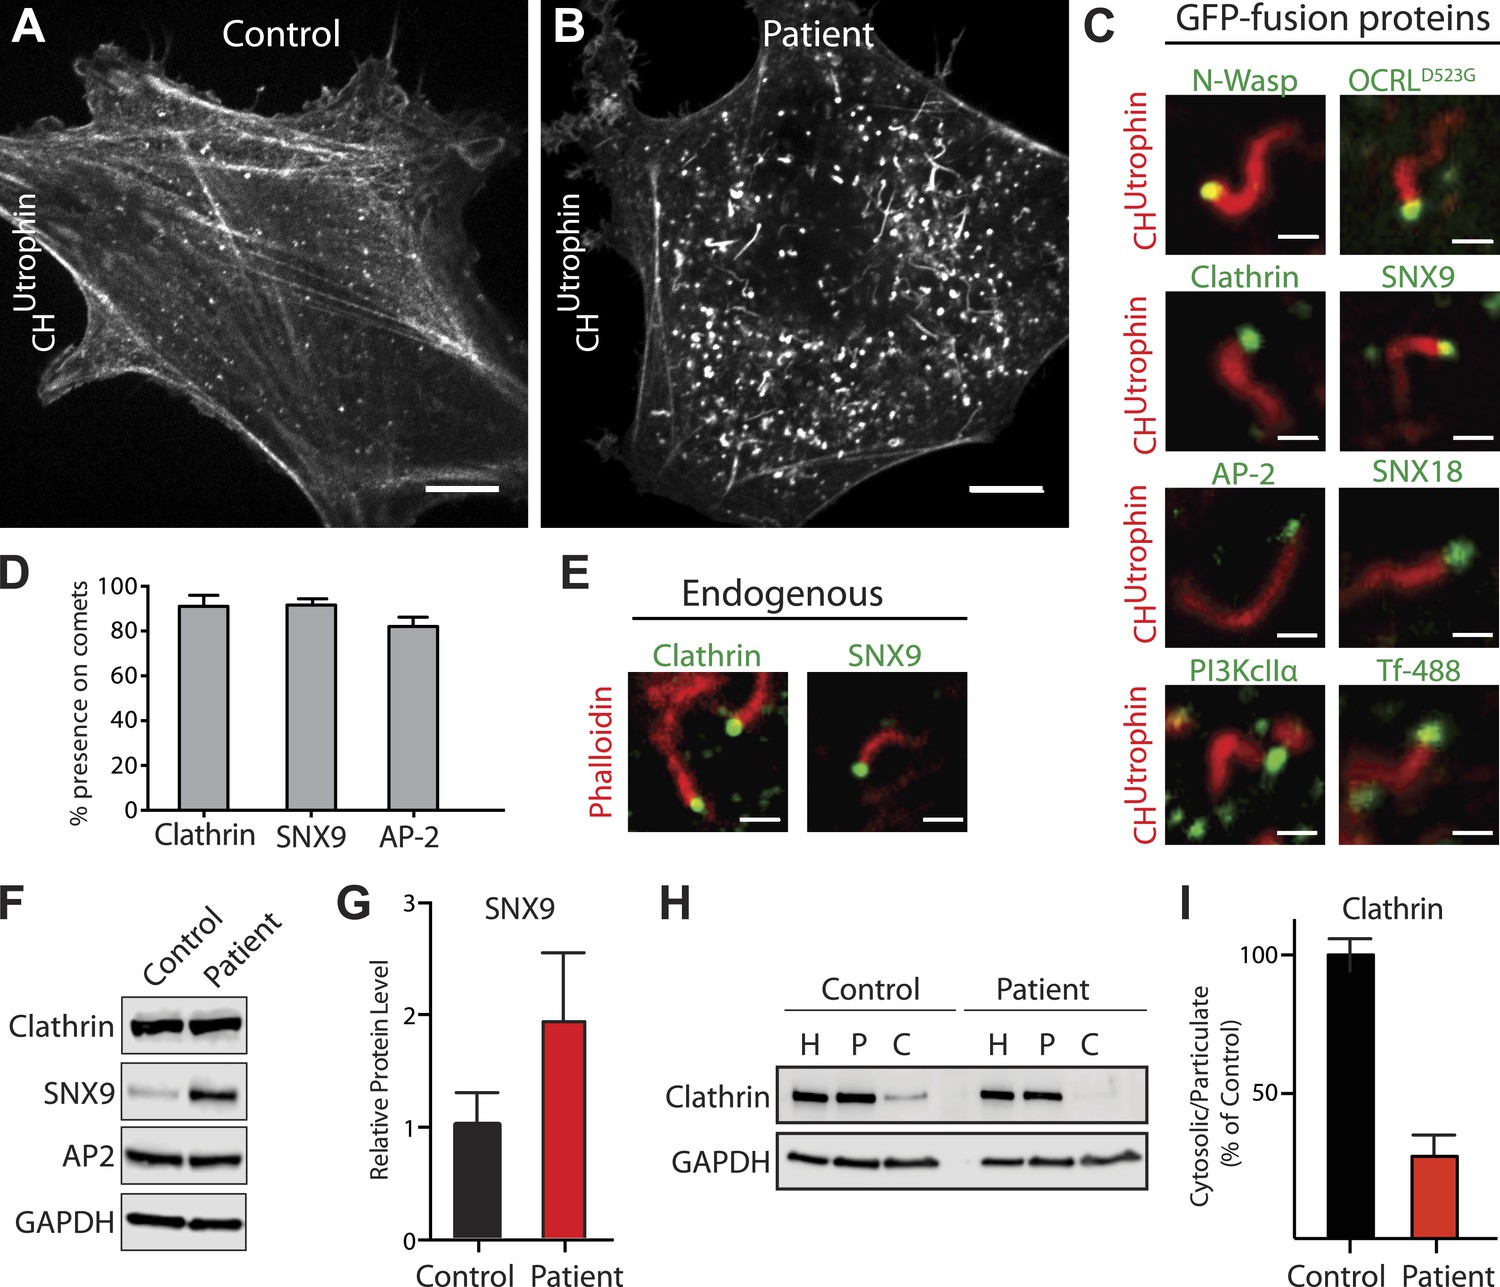
Accumulation of endocytic clathrin coat components on intracellular vesicles pushed by actin comets.
(A and B) Fluorescence of mCherry-CHUtrophin (calponin homology domain of Utrophin, an F-actin probe) in control (A) and patient (B) cells revealing the loss of stress fibers and accumulation of actin tails in Lowe syndrome fibroblasts. Scale bar: 10 µm. (C) Spinning disk confocal images of Lowe syndrome fibroblast co-expressing mCherry-CHUtrophin and the proteins indicated, which are all at the tips of the comets. Scale bar: 1 µm. (D) Quantification of the percentage of comets positive for the indicated proteins at their tip (n = 500 comets, 5 different cells). (E) Immunofluorescence staining of patient cells for phalloidin (an F-actin marker) and clathrin or SNX9, showing the endogenous presence of these proteins the tips of the comets. Scale bar: 1 µm. (F and G) Western blot analysis of control and patient cells for the indicated proteins showing increased levels of SNX9 in patient cells. Quantification of SNX9 is shown in (G) (mean ± SEM, n = 4 experiments). (H and I) Total particulate [P] and cytosolic [C] fractions derived from control or patient cell homogenates [H] followed by immunoblot analysis (H) show a virtual disappearance of the cytosolic pool of unassembled clathrin in patient cells (I). ([H]: homogenate; [P]: particulate; [C]: cytosolic).
Figure 5—figure supplement 1
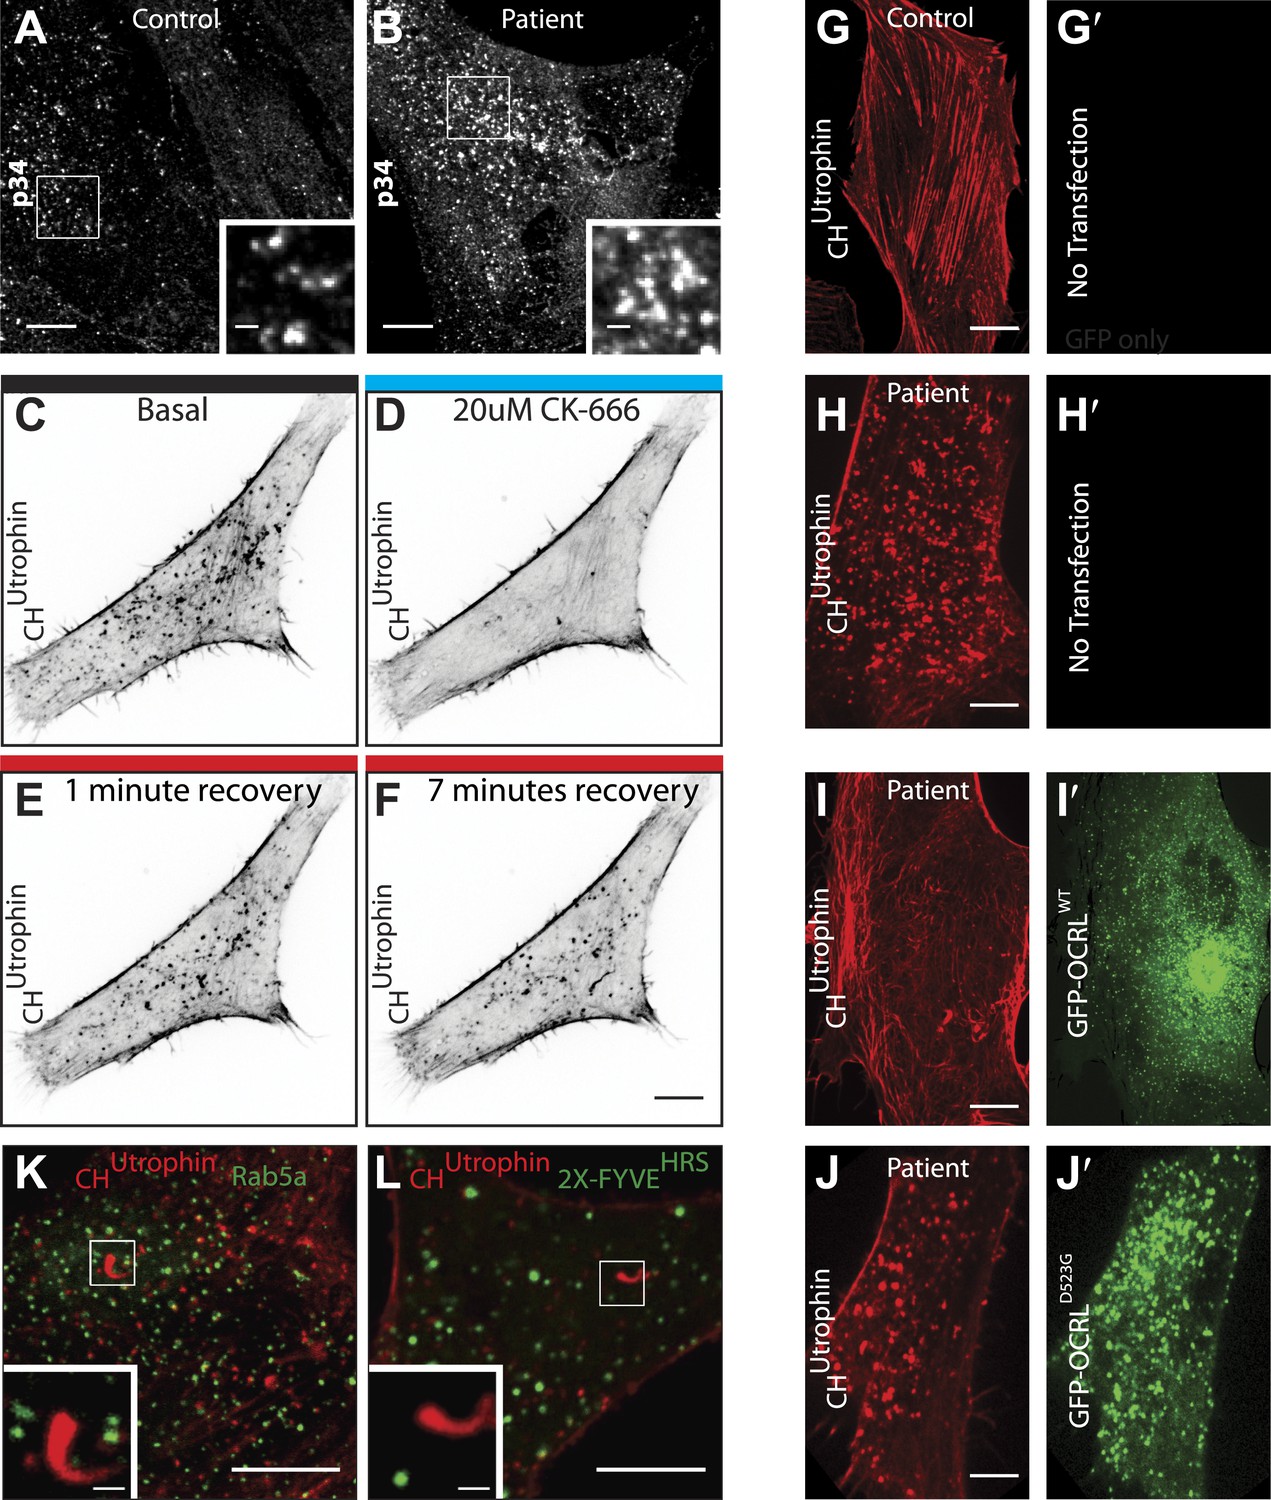
Perturbation of the actin cytoskeleton in patient cells.
(A and B) Immunofluorescence of the endogenous p34 subunit of the Arp2/3 complex in control (A) or patient fibroblasts (B). Scale bar full size: 10 µm; inset: 5 µm. (C–F) Time-lapse confocal microscopy of a patient fibroblast transfected with mCherry-CHUtrophin before (E) and after (F) the application the Arp2/3 inhibitor CK-666, as well as 1 min (G) and 7 min (H) after washing out the inhibitor. (G–H′) Confocal microscopy images of a control (G) and a patient (H) fibroblast (B) transfected with mCherry-CHUtrophin but no GFP construct. (I–J′) Patient fibroblasts co-transfected with mCherry-CHUtrophin and GFP-OCRLWT (I and I′) or catalytic dead GFP-OCRLD523G (J and J′) showing that OCRLWT, but not GFP-OCRLD523G can rescue the comets observed in patient cells. (K and L) Patient cells co-transfected with mCherry-CHUtrophin and either Rab5 or 2X-FYVEHRS showing that neither Rab5 nor FYVEHRS (a PI3P reporter) are present at comet heads.
Figure 5—figure supplement 2

SNX9 knockdown in Lowe syndrome fibroblasts.
(A) Western blot analysis of patient and control cells that were treated with either siRNA targeting SNX9 and SNX18 or a negative control siRNA. Duplicates of each set of siRNA treated cells were immunobloted. Tubulin is included as a loading control. Note the efficient knockdown of SNX9, which is present at higher levels in patient cells under basal conditions. (B and C) Immunofluorescence staining for SNX9 and phalloidin (F-actin) in patient cells treated with negative control siRNA (B) or with siRNAs targeting SNX9 and SNX18, revealing the loss of comets in cells depleted of SNX9 (cells 1 and 2, yellow numbers) but not in a cell still expressing significant levels of SNX9 (cell 3). Examples of comets are shown with yellow arrowheads. Inset shows an actin comet capped by SNX9 that remains after SNX9knockdown. In these cells, most of the SNX9 left was found at the tips of comets. (D) Confocal microscopy images of patient fibroblasts expressing mRFP-CLC and GFP-OCRLP3, showing the localization of this SNX9-binding mutant OCRL construct to clathrin-coated pits (blue arrowheads). Scale bar: 2 µm.
Figure 6 with 1 supplement
Vesicles propelled by actin tails originate from the plasma membrane.
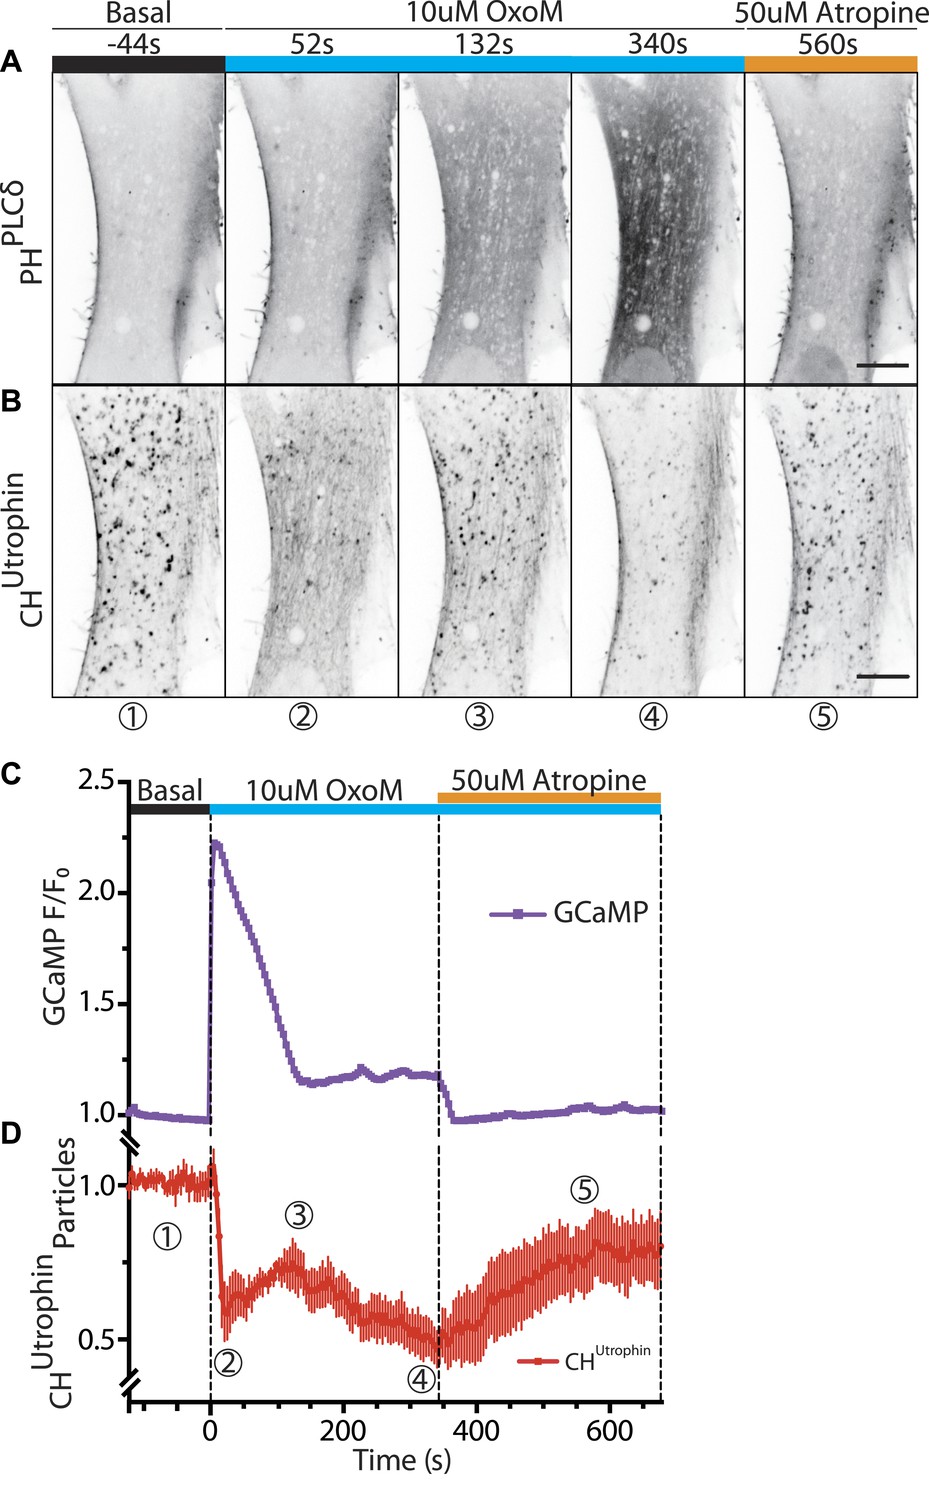
Patient fibroblasts co-expressing the PI(4,5)P2 probe GFP-PHPLCδ, mCherry-CHUtrophin and untagged muscarinic (M1R) receptor. (A and B) Sequential confocal images of GFP-PHPLCδ and mCherry-CHUtrophin fluorescence (fluorescence signal is reversed to appear dark). 10 µM OxoM was added at time zero and 50 µM atropine (an M1R antagonist) 344 s later. The PI(4,5)P2 reporter (GFP-PHPLCδ) shifts reversibly from the cell periphery to the cytosol in response to OxoM. mCherry-CHUtrophin foci represent actin comets that transiently disassemble during the Ca2+ peak, reassemble, and then gradually disappear as PI(4,5)P2 is depleted leading to impaired endocytosis. Scale bar: 10 µm. (C) Fluorescence of GCaMP3, a Ca2+ sensor, showing a transient spike in cytosolic Ca2+ upon plasma membrane PI(4,5)P2 hydrolysis in response to the M1R agonist OxoM, which triggers PLC activity. (D) Quantification of the number of comets from thresholded mCherry-CHUtrophin fluorescence during the application of OxoM and atropine to patient cells (mean ± SEM, n = 5 experiments). Encircled numbers correspond to the different five stages represented in (B).
Figure 6—figure supplement 1
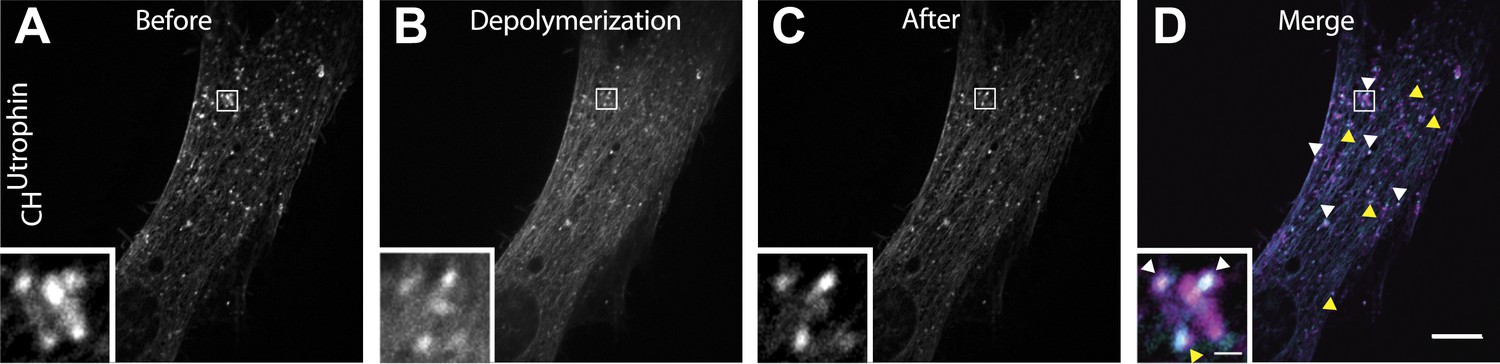
Comets reemerge from the same sites following transient actin depolymerization.
(A–C) Frames from a patient cell co-expressing mCherry-CHUtrophin and untagged M1R and exposed to OxoM at time zero. Frames were taken 12 s before the peak of actin depolymerization induced by the application of OxoM (A), at the peak (B) and 12 s after (C) the peak. (D) Merge of the frames shown in (A) and (C) revealing that actin foci reemerge in the same place (white arrowhead) or in extremely close proximity (yellow arrowhead) to where comets were located before actin depolymerization. This indicates that the nucleating vesicles are still present and do not move significant distances during the Ca2+-induced actin depolymerization, and are capable of re-nucleating actin comets once Ca2+ levels in the cytosol return to baseline.
Figure 7 with 1 supplement
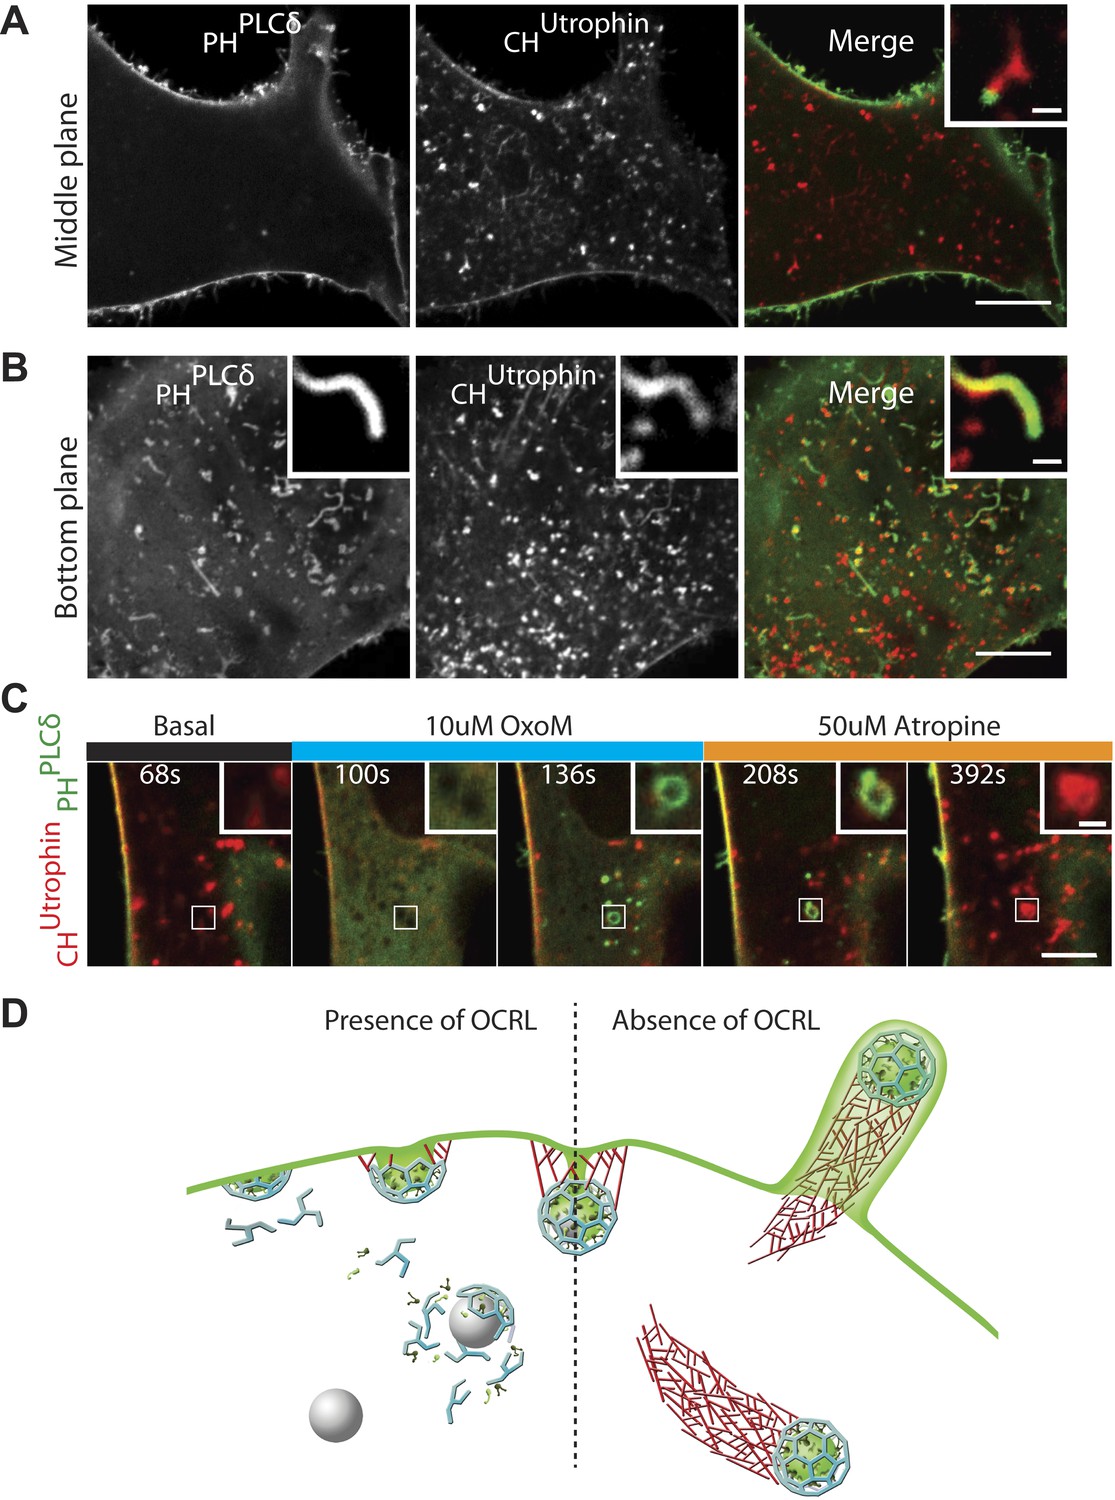
PI(4,5)P2 detection on intracellular vesicles.
(A–B) Confocal images of patient fibroblasts co-expressing GFP-PHPLCδ and mCherry-CHUtrophin at two different focal planes, midsection and bottom surface, are shown in (A) and (B) respectively. The midsection image (A) shows robust presence of the PI(4,5)P2 probe at the plasma membrane but only occasional presence at the tip of the comets. One example is shown in the inset. The bottom surface (B) image shows numerous PI(4,5)P2 positive cell evaginations resulting from comets pushing into the plasma membrane. One example is shown in the inset. As the comet pushes into the plasma membrane it becomes enveloped in PHPLCδ-positive plasma membrane. Scale bar full size: 10 µm; inset: 1 µm. (C) Sequential confocal images of a patient cell expressing untagged M1R, GFP-PHPLCδ and mCherry-CHUtrophin showing that in response to plasma membrane PI(4,5)P2 hydrolysis and increase in cytosolic Ca2+ induced by OxoM, actin comet disassemble and the PI(4,5)P2 probe relocates to intracellular vesicles. As actin reassembles, mCherry-CHUtrophin displaces the PI(4,5)P2 probe. (D) Model depicting the impact of the lack of OCRL in Lowe syndrome patients on clathrin-mediated endocytosis. Absence of the 5-phosphatase activity of OCRL delays endocytosis by stalling late-stage pits, impairs uncoating and triggers the nucleation of comets from clathrin vesicles that retain PI(4,5)P2 and fail to uncoat.
Figure 7—figure supplement 1
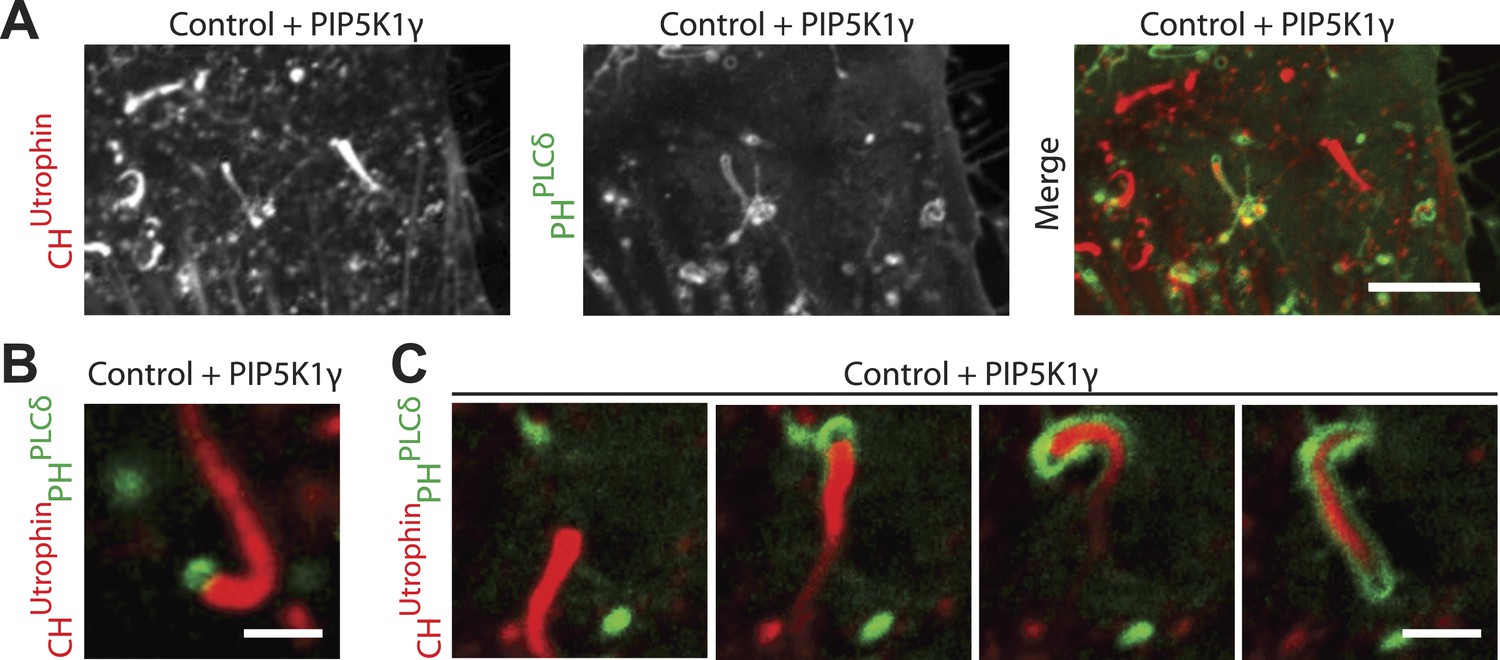
Overexpression of PIP5K1γ (a PI4P 5-kinase) in wild type fibroblasts induces actin comets.
(A) Confocal microscopy image of a control wild type fibroblast co-transfected with mCherry-CHUtrophin, GFP-PHPLCδ and untagged PIP5K1γ showing comets similar to those found in patient cells. Note the presence of actin comets negative for GFP-PHPLCδ moving through the cytosol while at the same time one comet has evaginated the plasma membrane and is encapsulated in GFP-PHPLCδ-marked plasma membrane. (B) Example of a comet positive for GFP-PHPLCδ at its head in a wild type cell expressing mCherry-CHUtrophin, GFP-PHPLCδ and untagged PIP5K1γ. (C) Sequential images of a comet negative for GFP-PHPLCδ that pushes against the GFP-PHPLCδ-positive plasma membrane and becomes enveloped by it as it deforms the membrane into a filopodium-like structure. Note the hollow tip of the comet, which is not labeled by GFP-PHPLCδ, even though this probe robustly labels the plasma membrane encapsulating the comet.
Videos
Video 1
Sequential recruitment of SNX9 and OCRL at clathrin-coated pits.
Wild-type skin fibroblast co-transfected with mCherry-OCRL and GFP-SNX9 showing the punctate localization of SNX9 and OCRL at clathrin-coated pits and the sequential recruitment of SNX9 followed by OCRL at the pit.
Video 2
Clathrin and OCRL dynamics in wild type fibroblasts.
Wild-type skin fibroblast co-transfected with GFP-OCRLWT and RFP-CLC showing the recruitment of OCRL to clathrin-coated pits at the end of their lifetime.
Video 3
Clathrin and OCRL dynamics in patient fibroblasts.
Lowe syndrome patient fibroblast co-transfected with the catalytically inactive GFP-OCRLD523G and RFP-CLC showing the presence of OCRL at almost every pit and the lack of dynamic turnover of clathrin and OCRL.
Video 4
Expression of wild type OCRL rescues clathrin dynamics in patient fibroblasts.
Lowe syndrome patient fibroblast co-transfected with the GFP-OCRLWT and RFP-CLC showing the rescue of clathrin and OCRL dynamics at the pit in the presence of exogenously expressed wild type OCRL.
Video 5
Comets in Lowe syndrome patient fibroblasts.
Control and Lowe syndrome patient fibroblast transfected with the F-actin probe mCherry-CHUtrophin. The control cell shows the characteristic stress fibers and small actin puncta typically associated with sites of clathrin-mediated endocytosis. Stress fibers are lost in patient cells, which instead exhibit actin comets that rocket through the cytosol.
Video 6
Catalytically inactive OCRL localizes to the tips of actin comets.
Lowe syndrome patient fibroblast co-transfected with the F-actin probe mCherry-CHUtrophin and the catalytic dead GFP-OCRLD523G showing that the machinery necessary to recruit OCRL is present on the vesicles at the tip of the comets.
Video 7
SNX9 is found on vesicles pushed by actin comets.
Lowe syndrome patient fibroblast co-transfected with the F-actin probe mCherry-CHUtrophin and GFP-SNX9 revealing the presence of this endocytic factor on the vesicles at the tip of the comets.
Video 8
Selective depletion of plasma membrane PI(4,5)P2 abolishes the comets.
Lowe syndrome patient fibroblast co-transfected with the F-actin probe mCherry-CHUtrophin, GFP-PHPLCδ (not shown) and the untagged muscarinic receptor M1R. The cell is treated with 10 µM OxoM at 1m44s, which stays in the imaging media for the duration of the acquisition, followed by 50 µM atropine at 7m24s. Upon the addition of OxoM there's a rapid depolymerization of F-actin due to a rise in cytosolic calcium followed by the rapid reformation of the comets. Upon the continued presence of OxoM however, the comets gradually disappear due to the continued depletion of plasma membrane PI(4,5)P2. This effect is reversed upon the addition of the antagonist Atropine, which allows the reformation of PI(4,5)P2 at the plasma membrane, leading to the resurgence of the actin comets.
Video 9
Actin comets come into contact with and evaginate the plasma membrane.
Lowe syndrome patient fibroblast co-transfected with the F-actin probe mCherry-CHUtrophin and GFP-PHPLCδ showing the presence of comets that come into contact with the plasma membrane and evaginate it to create filopodia-like structures, akin to those observed upon Lysteria infection. Note that comets are not positive for GFP-PHPLCδ until they come into contact with the GFP-PHPLCδ positive plasma membrane. At that point the comet pushes out the plasma membrane and is enveloped by it (see cartoon of Figure 7).
Additional files
-
Supplementary file 1
List of OCRL interaction partners recovered through quantitative label-free mass spectrometry proteomics. (A) Specific interaction partners of OCRL from label-free pulldowns of HeLaM-GFP vs HeLaM-GFP-OCRL near endogenous levels. (B) Specific interaction partners of OCRL from label-free pulldowns of HeLaM-GFP vs HeLaM-GFP-OCRL at 5X endogenous levels.
- https://doi.org/10.7554/eLife.02975.024
Download links
A two-part list of links to download the article, or parts of the article, in various formats.
Downloads (link to download the article as PDF)
Open citations (links to open the citations from this article in various online reference manager services)
Cite this article (links to download the citations from this article in formats compatible with various reference manager tools)
A role of OCRL in clathrin-coated pit dynamics and uncoating revealed by studies of Lowe syndrome cells
eLife 3:e02975.
https://doi.org/10.7554/eLife.02975


