A structural model of the active ribosome-bound membrane protein insertase YidC
- Ludwig-Maximilians-Universität München, Germany
- University of Illinois at Urbana-Champaign, United States
Figures
Figure 1 with 1 supplement
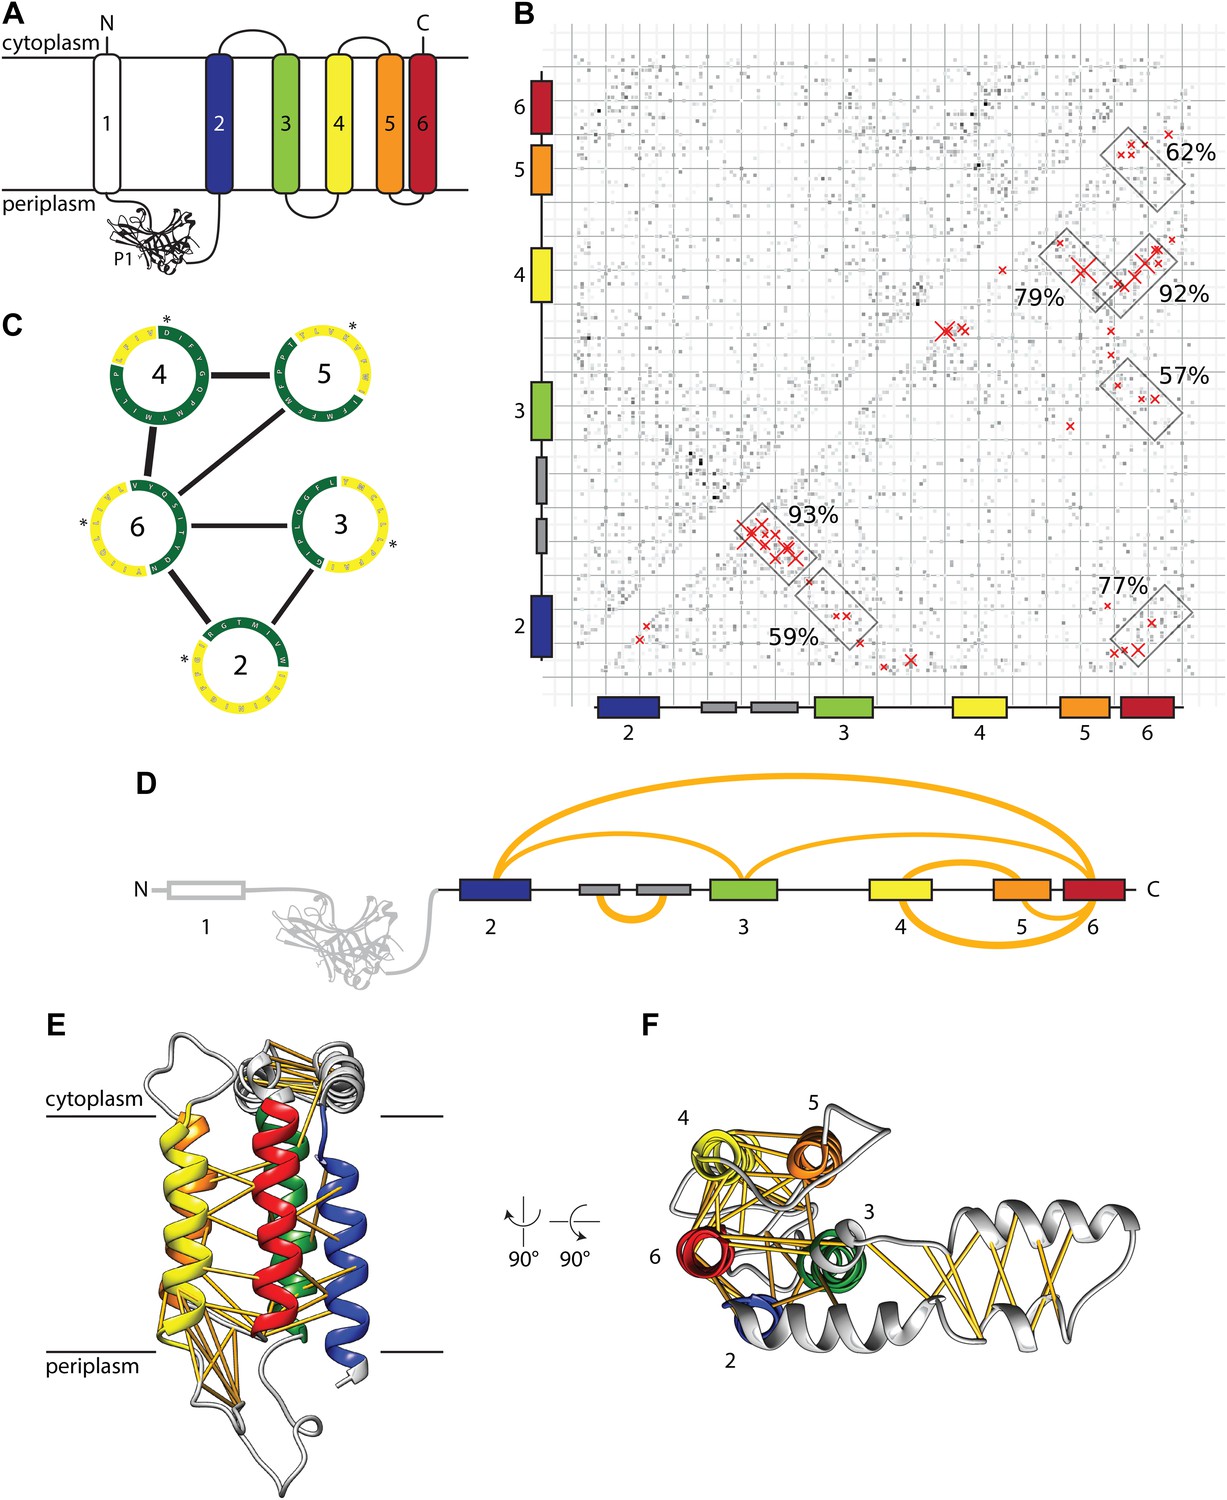
Evolutionary covariation based structural model of E. coli YidC.
(A) Membrane topology of YidC, with helix coloring as in all subsequent Figures. (B) Matrix of coupling strengths between pairs of YidC residues based on an alignment of 2366 non-redundant sequences. Helix–helix pairs with posterior probabilities higher than 57% are outlined in boxes; the 50 residue–residue pairs with highest coupling coefficients are indicated with red crosses. (C) Overall arrangement of TM helices viewed from the cytoplasm based on the prediction of helix–helix pairs (black lines) and exposure to lipid (yellow) or protein (green). The first residue of each helix is indicated with an asterisk. (D) Linear representation of YidC with the seven most probable helix–helix pairs indicated by arches, with thicknesses approximating posterior probabilities. (E and F) Side view and cytoplasmic view, respectively, of the E. coli YidC model based on covariation analysis, with predicted residue–residue pairs indicated by yellow pseudobonds.
Figure 1—figure supplement 1

Evaluation of possible helix-helix contacts.
(A) Calibration plots for the prediction of helix–helix interactions. Calibration plots for dataset #2 (left), dataset #3 (middle) and combined datasets #2 and #3 (right). The empirical fraction of true positives is plotted depending on the uncalibrated probability (raw score) obtained from our method. Points correspond to empirical averages over bins of 60 predictions (ordered by increasing uncalibrated probability). Lines correspond to maximum likelihood fits of the calibration plots using a transformed Bernoulli distribution with 4 parameters. (B) Histogram of posterior probabilities for helix–helix interactions. Distribution of predicted calibrated posterior probabilities for YidC (TM2–TM6) which contains seven predicted helices, thus 21 possible helix–helix contacts. The histogram of predicted probabilities shows the specificity of the predictions: there is a large gap between 15% and 55% probability and most possible contacts have probability <15%.
Figure 2 with 1 supplement
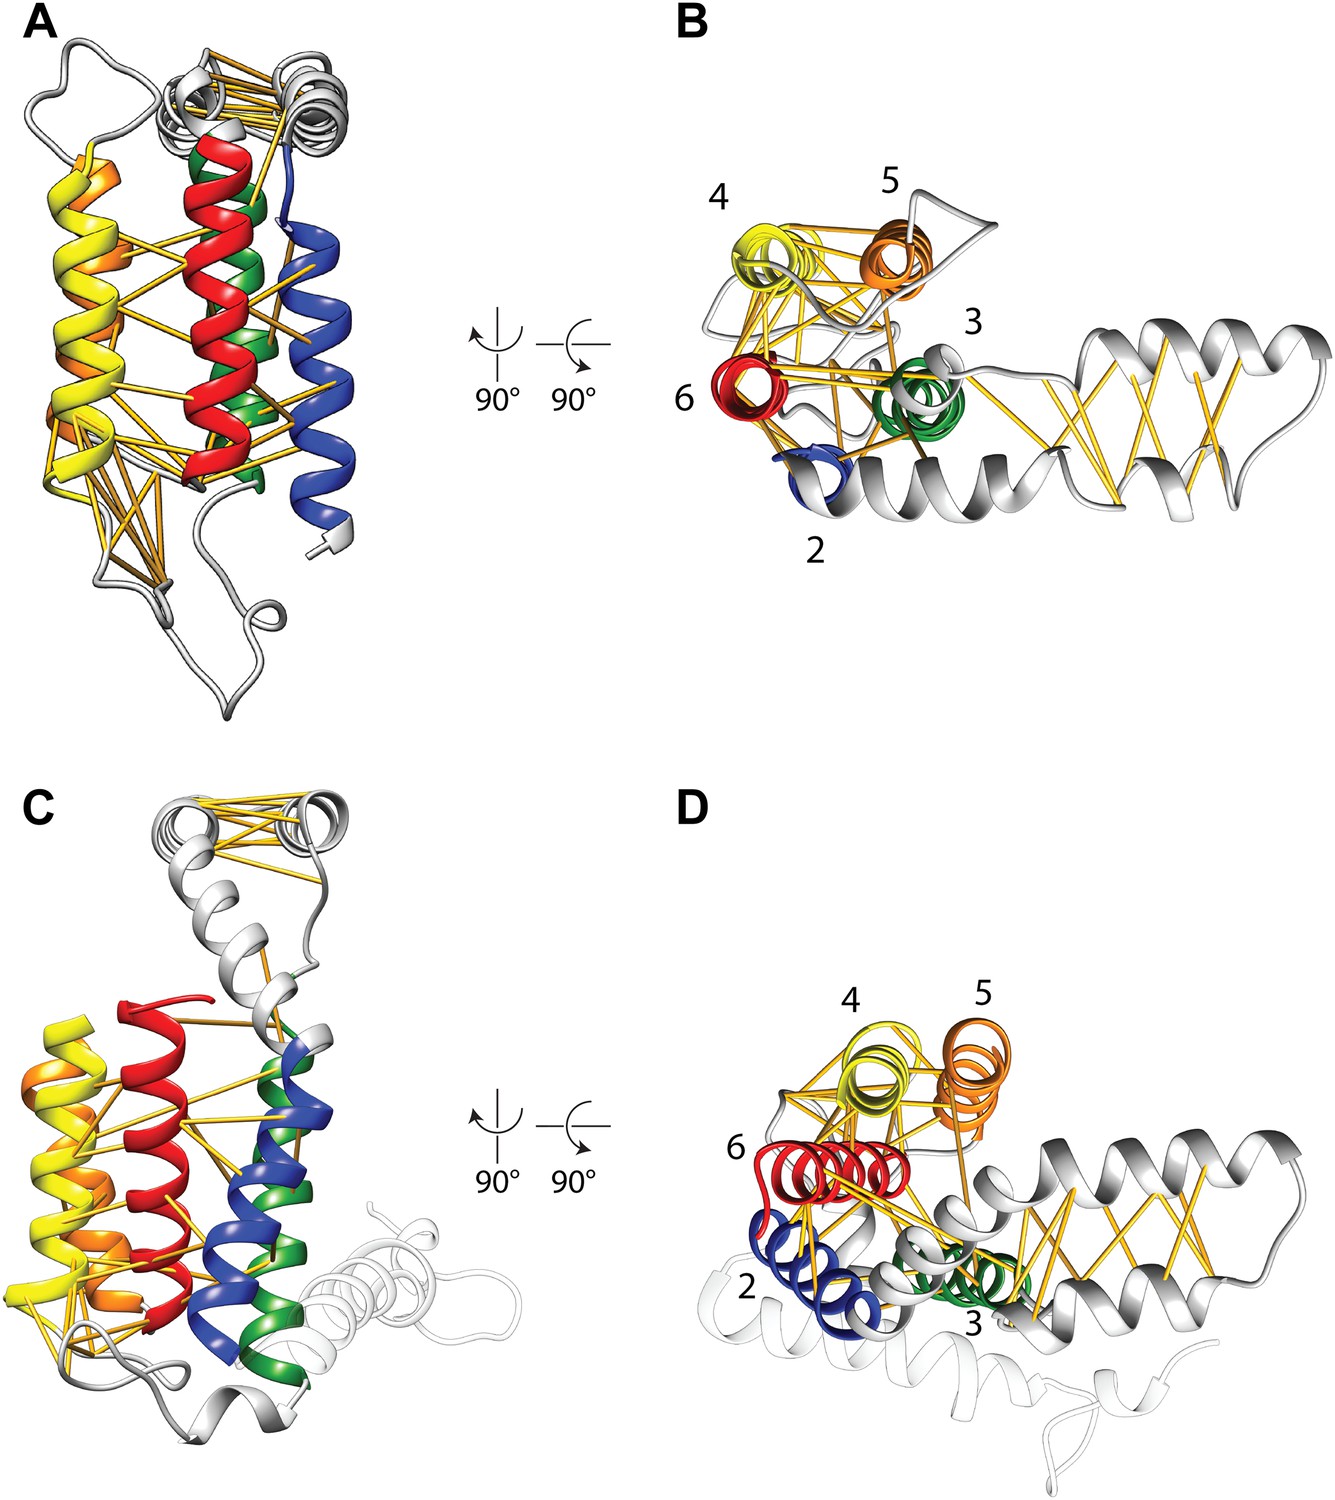
Covariation-based model vs homology model.
Comparison of the E. coli YidC covariation-based model (A and B) to a homology model of E. coli YidC based on the crystal structure of BhYidC2 (3WO6) (C and D). Predicted residue–residue pairs are indicated by yellow pseudobonds. Note that extracellular helix 1 (white) was not present in our multiple sequence alignment and is thus not included in the model.
Figure 2—figure supplement 1
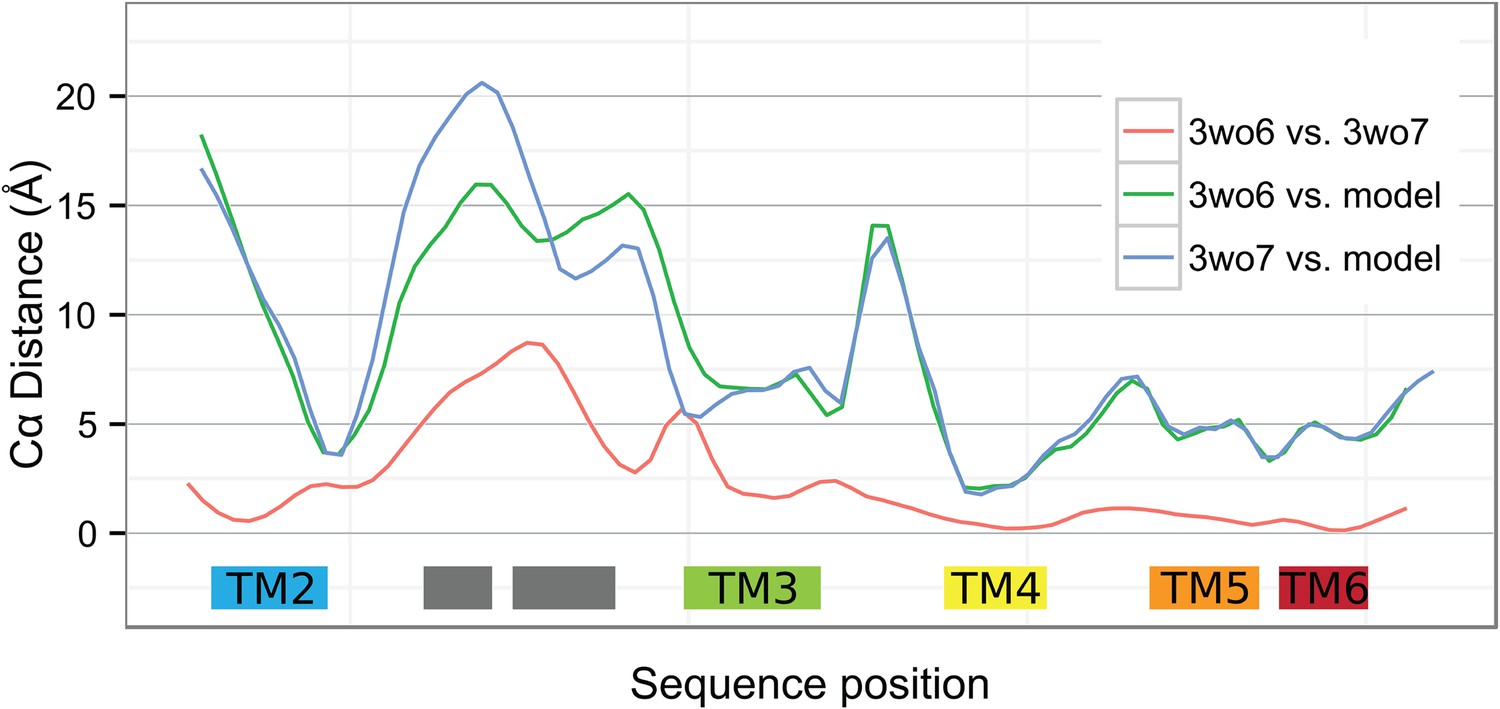
Local deviations among YidC structures.
Smoothed Cα distances between the two BhYidC2 crystal forms (3WO6 vs 3WO7, red), between our model of E. coli YidC and 3WO6 (green) and between our model and 3WO7 (blue).
Figure 3 with 2 supplements
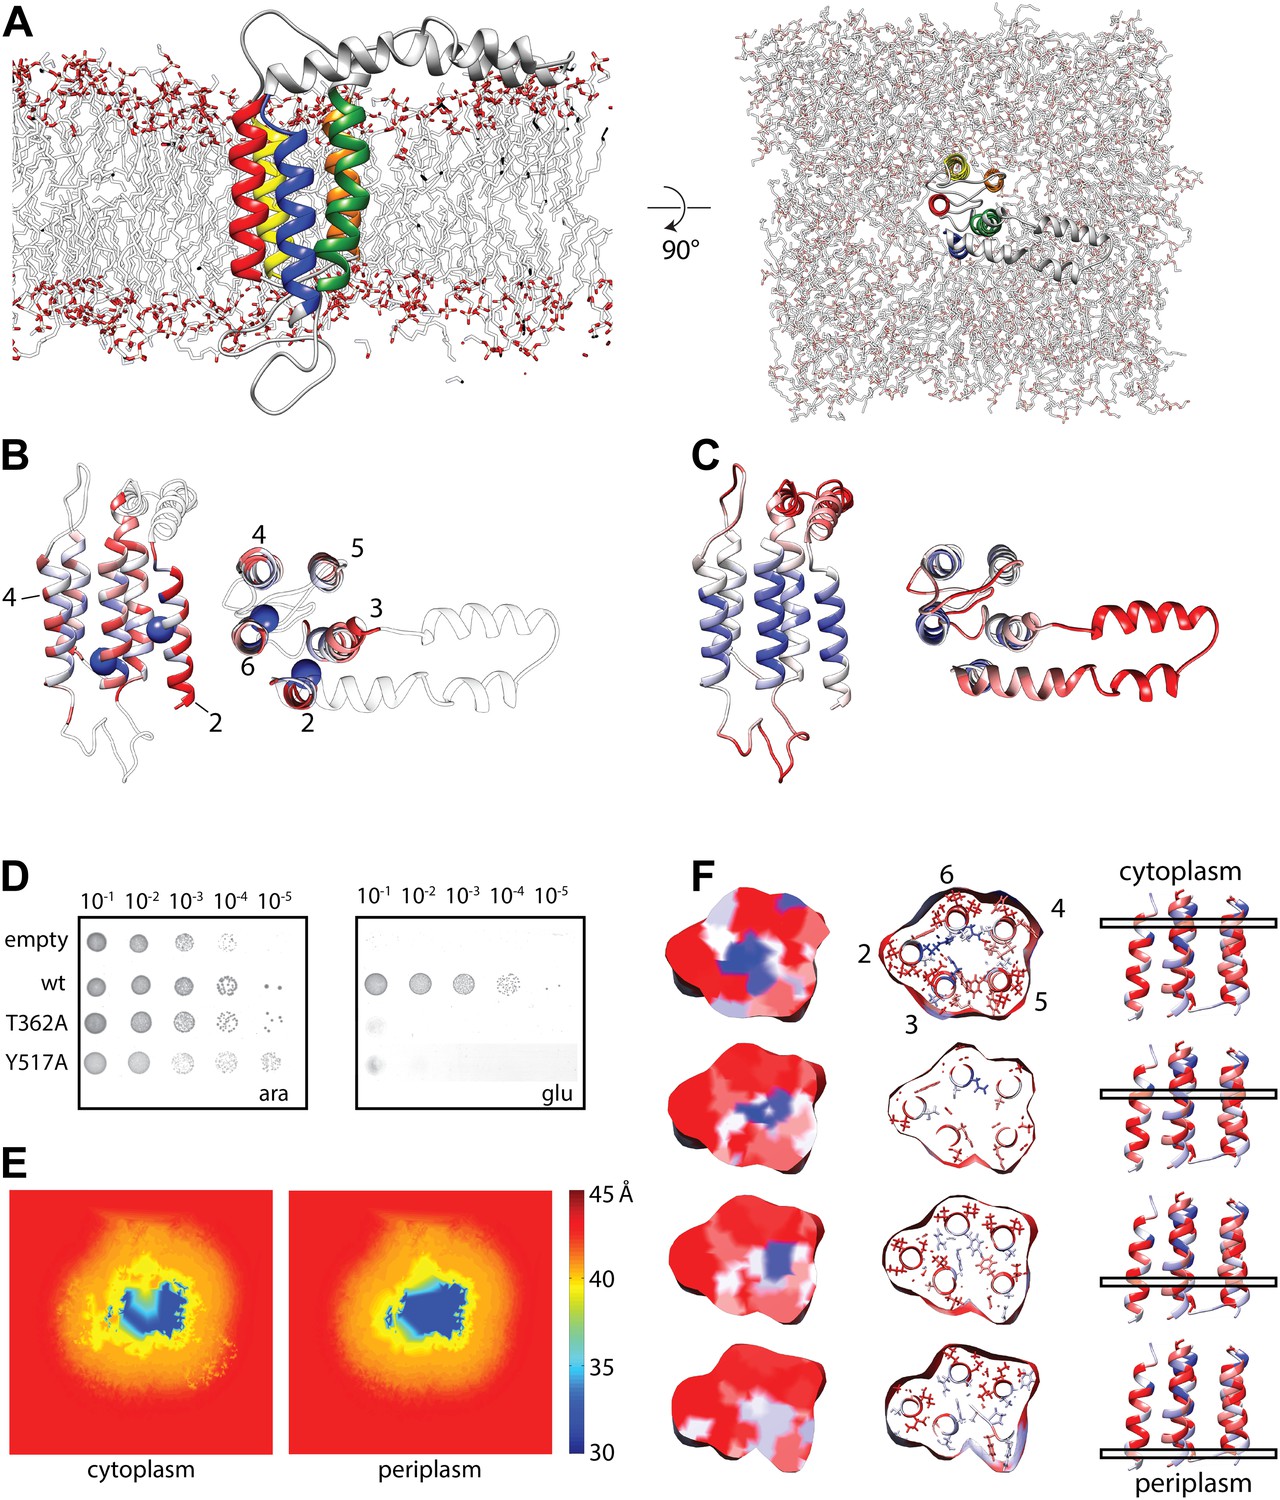
Molecular dynamics simulation of the YidC model.
(A) Side view (left) and cytoplasmic view (right) of the stable YidC model after a 500 ns MD simulation in a lipid bilayer composed of 3:1 POPE:POPG. (B) Ribbon representation of the stable model according to inter-helix energy (in kcal/mol), blue: −7.5 to −1; white: −1 to −0.002; red: ≥ −0.00.2. Residues that inactivate YidC upon mutagenesis are indicated by spheres. (C) Ribbon representation of the stable model according to flexibility (in Å2), blue: 0.04 to 0.09; white: 0.09–1; red: ≥1.0. (D) In vivo complementation assay of YidC mutants T362A (TM2) and Y517A (TM6). (E) Thickness of the cytoplasmic and periplasmic leaflet of the simulated bilayer after 500 ns, highlighting the membrane thinning effect in the vicinity of YidC. The membrane surface is defined by positions of polar head groups in the lipids, and thickness at a given point on the surface is taken to be the shortest distance between the head groups from opposite leaflets. The thickness values are averaged over the MD trajectory and presented as a contour plot on the membrane surface with a color-scale from red, indicating thicker region representing bulk bilayer lipids, to blue showing thinned regions close to YidC suggesting hydrophobic mismatch. (F) Distribution of hydrophobic (red) and hydrophilic residues (blue) in YidC at various heights of the membrane, highlighting the hydrophilic environment in the center of YidC on the cytoplasmic side.
Figure 3—figure supplement 1

Complementation of MD-based mutants.
In vivo complementation assay of YidC mutants identified as structurally important by MD simulations. Positions in YidC that were also identified by covariation analyses are indicated in the right column.
Figure 3—figure supplement 2
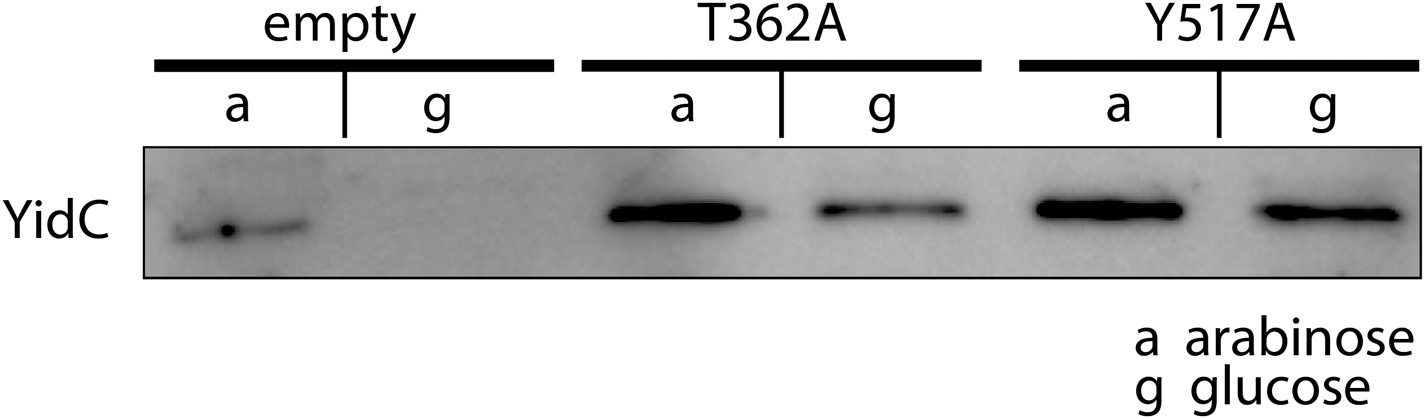
Expression of MD-based mutants.
Western blot of whole FTL10 cells grown on arabinose or glucose, showing the stable expression of inactive YidC mutants that were identifed by MD simulations.
Figure 4 with 2 supplements
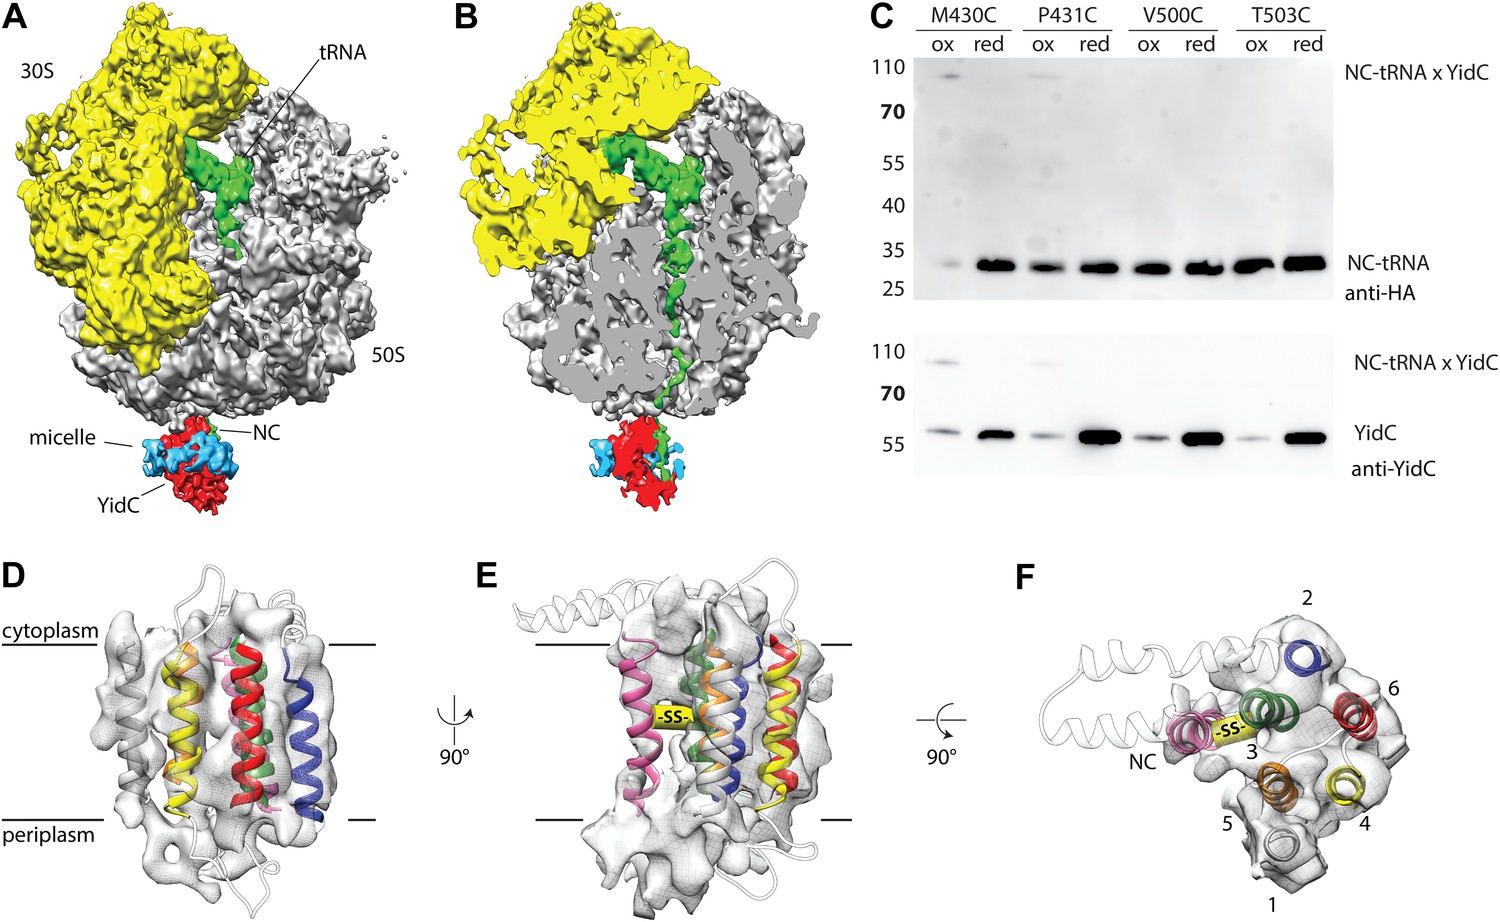
Cryo-EM structure of RNC bound YidC and structural model of the active state.
(A) Side view of the ∼8 Å resolution cryo-EM based electron density of the RNC:YidC complex, with the small subunit depicted in yellow, the large subunit in gray, P-site tRNA and nascent chain in green, YidC in red and the detergent micelle in blue. (B) As in A, but sliced through the ribosomal exit tunnel. (C) Validation of the active state model by disulphide crosslinking. RNCs carrying the mutant FOc(G23C) were reconstituted with the indicated single cysteine YidC mutants, oxidized, applied to a linear sucrose gradient and harvested from the 70S peak before SDS-PAGE and western blotting. Immunodetection was performed with antibodies raised against the HA-tag (located in the nascent chain inside the ribosomal exit tunnel) and anti-YidC antibodies. YidC, nascent chain-tRNA (NC-tRNA) and the expected crosslink product (NC-tRNA x YidC) are indicated. (D–F) Structural model of YidC during membrane protein insertion, viewed from two sides within the membrane (D and E) and from the cytoplasm (F). The detergent micelle was removed for clarity, the TM helix of FOc is depicted in magenta, and the disulphide crosslink between YidC and FOc with -SS-.
Figure 4—figure supplement 1
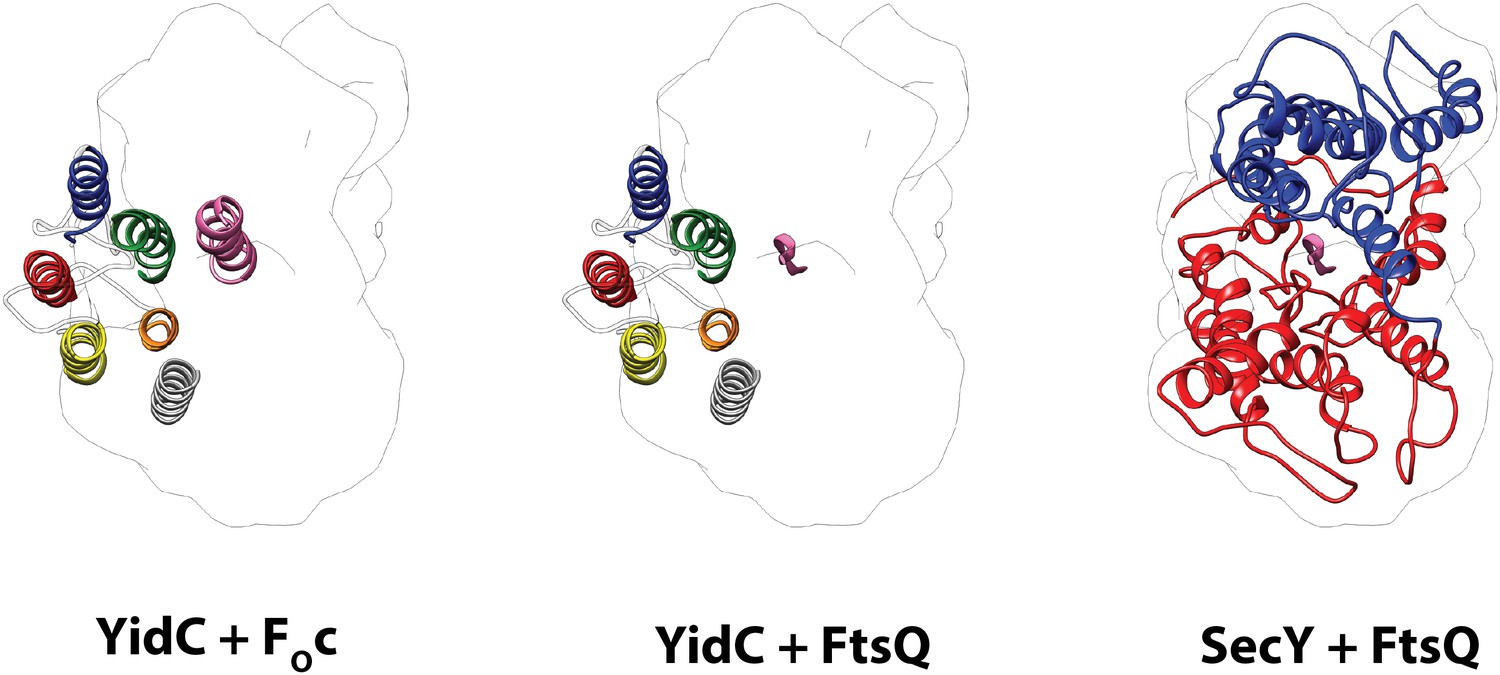
Comparison of the active states of YidC and SecY.
Left: molecular model of YidC during co-translational translocation of FOc, and the contour of active SecY. Middle: composite model of active YidC with FOc replaced by the hydrophilic part of nascent FtsQ as found in active SecY. Right: molecular model of SecY during co-translational translocation of FtsQ. For clarity, the N-terminal signal anchor of FtsQ was omitted.
Figure 4—figure supplement 2
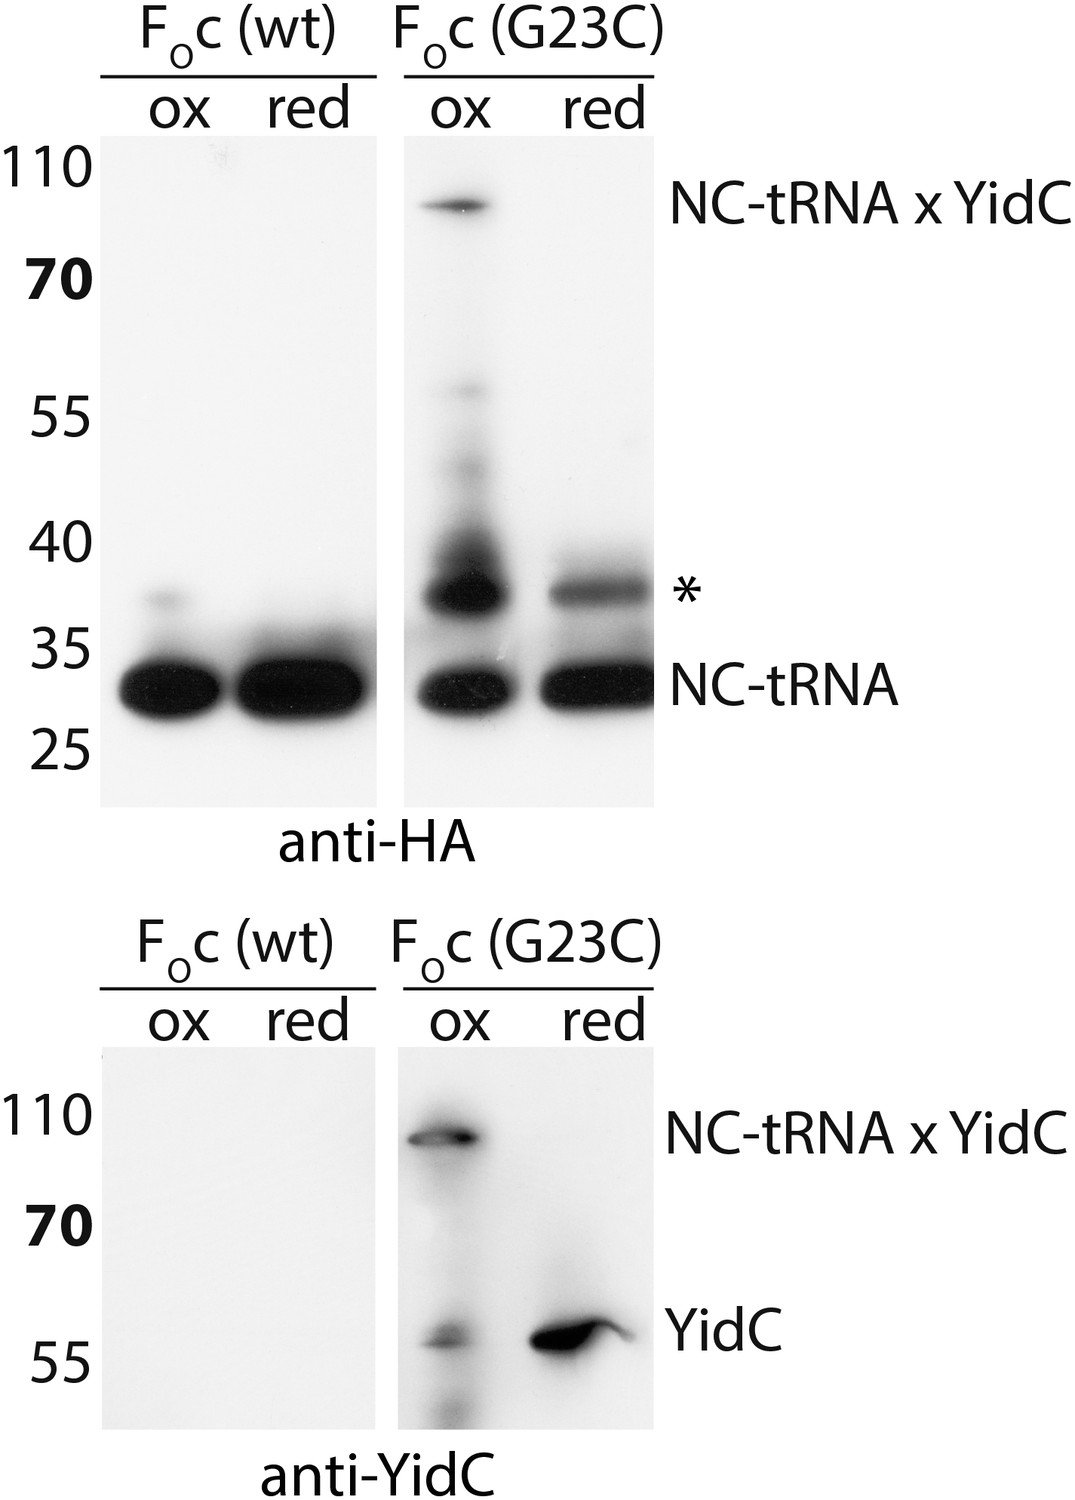
Negative control for RNC-YidC crosslinking.
Crosslinking was performed with a cysteine-less FOc RNC as described in the legend to Figure 3C. A poorly reproducible unknown product is indicated with an asterisk.
Figure 5 with 2 supplements

Contacts between active YidC and the ribosome.
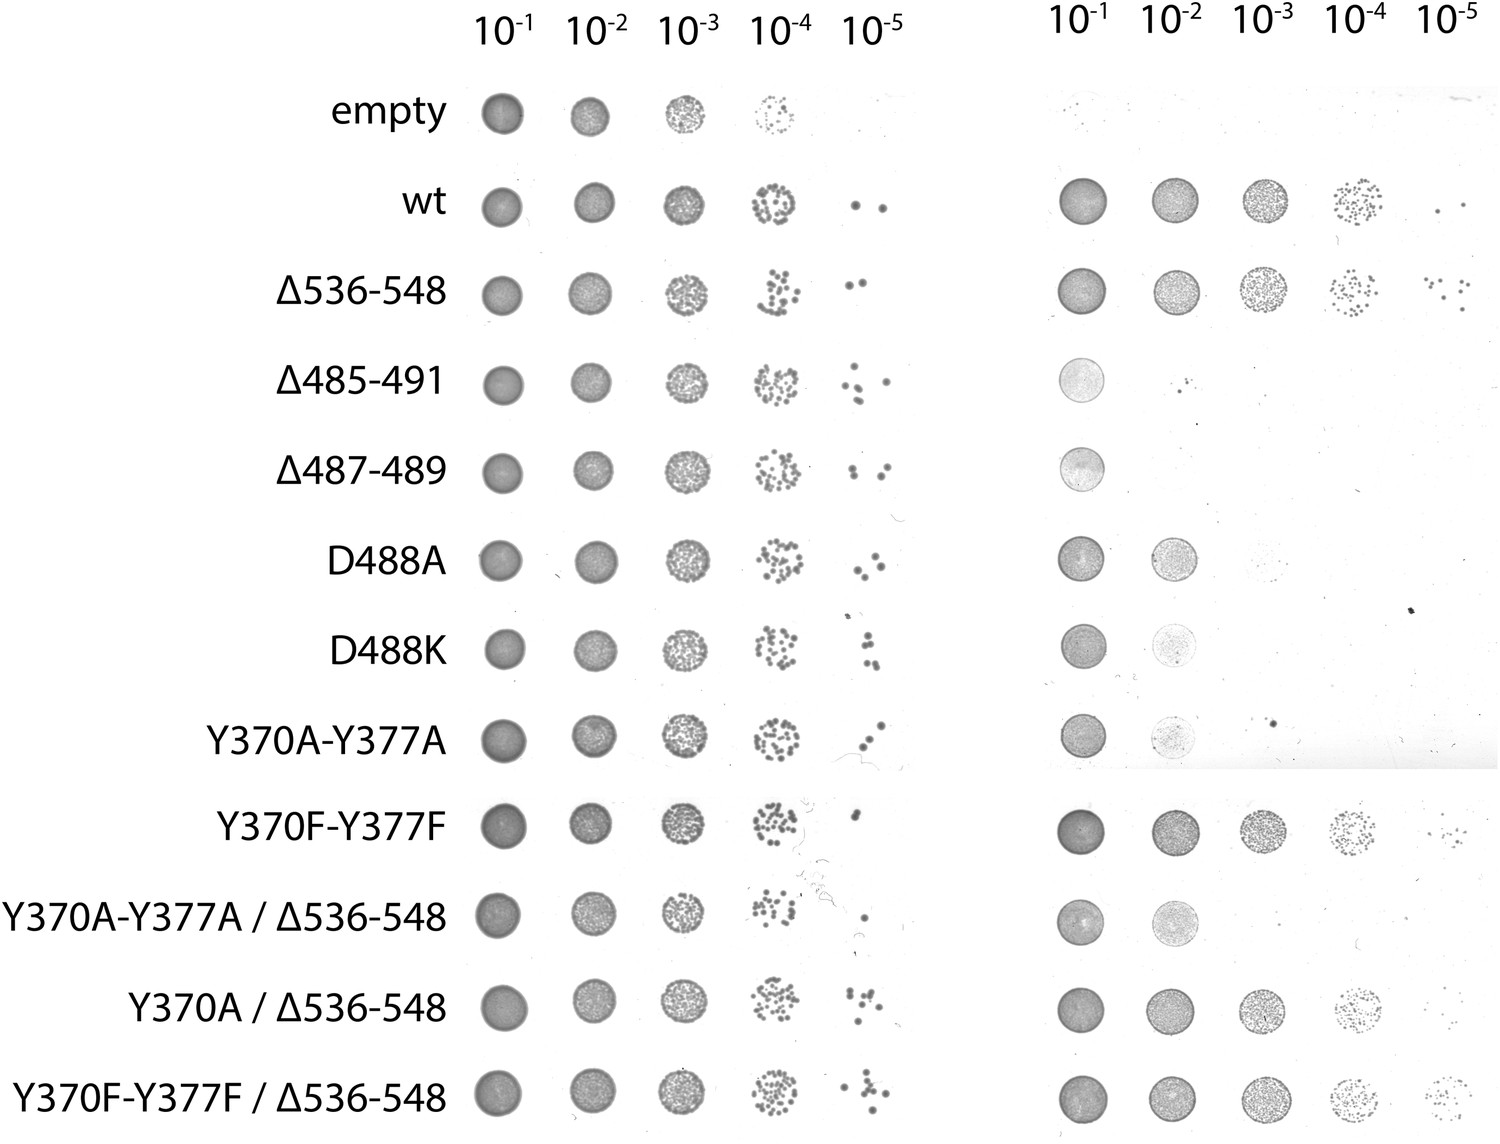
(A and B) Close-up views from within the membrane region highlighting the contact between H59 of the ribosome and the 2/3 loop of YidC (A) and ribosomal protein uL23 and the 4/5 loop of YidC (B). Residues that inactivate YidC upon mutagenesis or deletion are indicated by magenta spheres. (C) In vivo complementation assay of YidC point mutants D488A, D488K, deletion mutant Δ487-489 and the double mutants Y370A/Y377A and Y370F/Y377F. (D) Periplasmic view of the active ribosome-bound YidC model, with the YidC contour outlined in red. The polypeptide exit tunnel is indicated with an asterisk. (E) Cartoon based comparison of active SecY (left) and active YidC (right) during membrane insertion of FtsQ and FOc, respectively. The ribosome is depicted in gray, the aqueous channel in SecY as well as the hydrophilic environment within YidC are shaded blue, hydrophobic TM domains of the substrates are depicted magenta, hydrophilic parts in green and the P1 domain by a dashed oval.
Figure 5—figure supplement 1
Complementation of ribosome interaction mutants.
In vivo complementation assay of YidC mutants involved in ribosome binding.
Figure 5—figure supplement 2
Expression of ribosome interaction mutants.
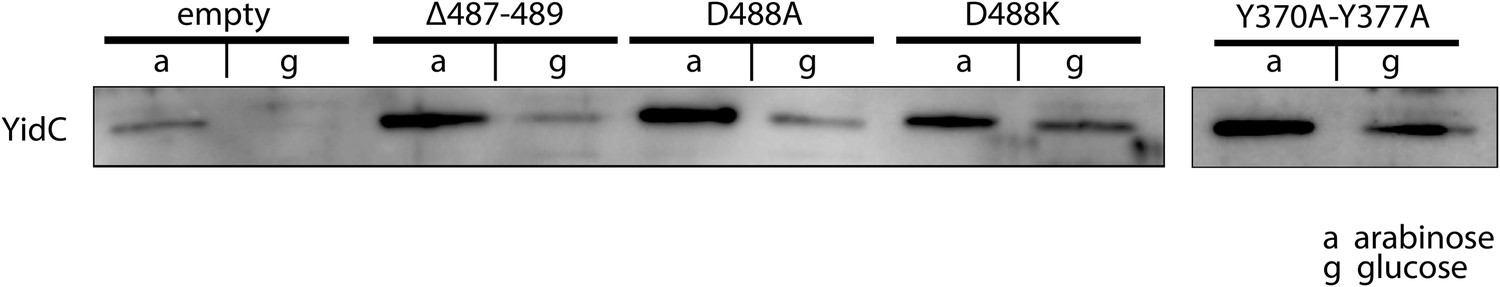
Western blot of whole FTL10 cells grown on arabinose or glucose, showing the stable expression of inactive YidC mutants that interact with the ribosome.
Videos
Video 1
Conformational states of YidC.
Animation showing conformational differences in YidC starting from BhYidC2 crystal form 1 (3WO6), towards crystal form 2 (3WO7) and ending with our covariation based YidC model. Views are from within the membrane (left) and from the cytoplasm (right). Note the movement of the HPD and the closing of the hydrophilic groove between TM3 (orange) and TM5 (green).
Tables
Table 1
Deviations among YidC structures
| RMSD (Å) | RMSD (Å) (TM core) | ||
|---|---|---|---|
| 3WO6 | 3WO7 | 3.1 | 1.8 |
| 3WO6 | model | 9.4 | 7.5 |
| 3WO7 | model | 9.8 | 7.3 |
-
Overall root mean square deviations (RMSD) between (the TM helices of) our model of E. coli YidC and the two BhYidC2 crystal forms.
Table 2
Top 50 scoring residue–residue pairs in covariation analysis
| Residue 1 | # Residue 1 | Region | Residue 2 | # Residue 2 | Region | dmodel (Å) | d3WO6 (Å) | Reason for exclusion | |
|---|---|---|---|---|---|---|---|---|---|
| TRP | 354 | TM2 | – | – | – | indel | |||
| GLY | 355 | TM2 | – | – | – | indel | |||
| PHE | 356 | TM2 | – | – | – | indel | |||
| PHE | 356 | TM2 | ARG | 533 | c-term | topology violation | |||
| ILE | 358 | TM2 | <–> | GLY | 512 | Loop5-6 | 9.1 | 6.1 | |
| ILE | 359 | TM2 | <–> | VAL | 519 | TM6 | 6.5 | 5.2 | |
| ILE | 359 | TM2 | <–> | LEU | 515 | TM6 | 8.5 | 7.9 | |
| ILE | 359 | TM2 | – | – | – | indel | |||
| ILE | 361 | TM2 | <–> | LEU | 436 | TM3 | 7.9 | 8.2 | |
| THR | 362 | TM2 | PRO | 371 | TM2 | intrahelical | |||
| PHE | 363 | TM2 | <–> | VAL | 523 | TM6 | 5.2 | 6.1 | |
| GLY | 367 | TM2 | <–> | VAL | 523 | TM6 | 6.0 | 8.2 | |
| MET | 369 | TM2 | <–> | ILE | 432 | TM3 | 9.9 | 8.4 | |
| Leu | 372 | Loop2-3 | PRO | 510 | Loop5-6 | topology violation | |||
| SER | 379 | Loop2-3 | <–> | PRO | 425 | TM3 | 10.2 | 9.9 | |
| LEU | 386 | Loop2-3 | <–> | VAL | 417 | Loop2-3 | 7.5 | 7.1 | |
| LEU | 386 | Loop2-3 | <–> | LEU | 411 | Loop2-3 | 6.2 | 6.1 | |
| PRO | 388 | Loop2-3 | GLN | 429 | TM3 | topology violation | |||
| LYS | 389 | Loop2-3 | <–> | ALA | 414 | Loop2-3 | 10.5 | 9.8 | |
| LYS | 389 | Loop2-3 | <–> | GLU | 415 | Loop2-3 | 11.2 | 10.0 | |
| ILE | 390 | Loop2-3 | <–> | MET | 408 | Loop2-3 | 6.8 | 6.2 | |
| MET | 393 | Loop2-3 | <–> | ILE | 404 | Loop2-3 | 7.9 | 7.4 | |
| MET | 393 | Loop2-3 | <–> | LEU | 411 | Loop2-3 | 8.2 | 7.7 | |
| ARG | 394 | Loop2-3 | <–> | ILE | 404 | Loop2-3 | 8.5 | 8.1 | |
| ARG | 396 | Loop2-3 | <–> | GLU | 407 | Loop2-3 | 8.9 | 8.4 | |
| CYS | 423 | TM3 | <–> | GLN | 528 | TM6 | 16.2 | 20.9 | |
| PRO | 425 | TM3 | <–> | PRO | 499 | TM5 | 10.2 | 20.5 | |
| PHE | 433 | TM3 | <–> | THR | 524 | TM6 | 11.0 | 14.9 | |
| LEU | 436 | TM3 | <–> | GLY | 512 | Loop5-6 | 7.6 | 8.3 | |
| TYR | 437 | TM3 | <–> | LEU | 513 | Loop5-6 | 9.8 | 6.4 | |
| TRP | 454 | Loop3-4 | <–> | ASP | 462 | Loop3-4 | 6.6 | 7.0 | |
| TRP | 454 | Loop3-4 | <–> | PRO | 468 | TM4 | 16.0 | 11.5 | |
| TRP | 454 | Loop3-4 | <–> | SER | 511 | Loop5-6 | 9.8 | 8.3 | |
| ILE | 455 | Loop3-4 | <–> | LEU | 467 | TM4 | 9.8 | 10.1 | |
| ILE | 455 | Loop3-4 | <–> | ILE | 466 | TM4 | 11.0 | 8.0 | |
| ASP | 462 | Loop3-4 | <–> | PRO | 468 | TM4 | 12.5 | 6.8 | |
| ASP | 462 | Loop3-4 | <–> | SER | 511 | Loop5-6 | 11.1 | 4.2 | |
| TYR | 465 | TM4 | <–> | LEU | 507 | TM5 | 10.4 | 8.7 | |
| LEU | 467 | TM4 | <–> | LEU | 515 | TM6 | 11.6 | 6.6 | |
| PRO | 468 | TM4 | <–> | LEU | 513 | TM6 | 14.5 | 8.8 | |
| LEU | 470 | TM4 | <–> | ILE | 518 | TM6 | 6.3 | 5.4 | |
| MET | 471 | TM4 | <–> | PHE | 502 | TM5 | 8.8 | 4.9 | |
| GLY | 472 | TM4 | <–> | THR | 503 | TM5 | 6.7 | 5.3 | |
| GLY | 472 | TM4 | GLN | 479 | TM4 | intrahelical | |||
| THR | 474 | TM4 | <–> | ASN | 521 | TM6 | 4.7 | 3.7 | |
| THR | 474 | TM4 | <–> | ILE | 525 | TM6 | 6.7 | 7.8 | |
| ILE | 478 | TM4 | <–> | ILE | 525 | TM6 | 9.0 | 5.0 | |
| THR | 485 | Loop4-5 | – | – | – | indel | |||
| PHE | 506 | TM5 | <–> | VAL | 514 | TM6 | 14.4 | 4.2 | |
| GLY | 512 | Loop5-6 | GLN | 532 | TM6 | topology violation | |||
| Ø | 9.3 | 8.1 |
-
Table showing the 50 residue–residue pairs with the highest covariation scores, and the distances between the Cβ atoms in the final model of the 39 pairs that were used as constraints for model building. For comparison, the corresponding distances in 3WO6 are also given. The 11 residue–residue pairs that were excluded for model building are in italics, with the reason for their exclusion indicated on the right.
Download links
A two-part list of links to download the article, or parts of the article, in various formats.
Downloads (link to download the article as PDF)
Open citations (links to open the citations from this article in various online reference manager services)
Cite this article (links to download the citations from this article in formats compatible with various reference manager tools)
A structural model of the active ribosome-bound membrane protein insertase YidC
eLife 3:e03035.
https://doi.org/10.7554/eLife.03035


