Nutritional control of body size through FoxO-Ultraspiracle mediated ecdysone biosynthesis
- Instituto Gulbenkian de Ciência, Portugal
- Lake Forest College, United States
- Michigan State University, United States
Figures
Figure 1 with 1 supplement

Nutrition regulates the timing of the critical weight ecdysone peak and exogenous ecdysone eliminates developmental delays in pre-critical weight larvae.
(A) Nutrition is necessary to induce a small ecdysone peak at the early L3. We used 30–38 w[1118] larvae for each sample and three biologically independent samples for each time point. Each point indicates the mean ecdysone concentration ± SEM. Points sharing the same letter indicate the mean concentration at the time ±2 hr are statistically indistinguishable from one another; points that differ in letters are significantly different (p < 0.05). The arrowhead along the x axes indicates the age at which w[1118] larvae reached critical weight from Figure 1B. (B) Exogenous ecdysone administration throughout the L3 eliminates developmental delay in starved, pre-critical weight w[1118] larvae. The larvae were continuously fed a fly medium containing 0.15 mg/g 20E or transferred at given time points on to a starvation medium (1% agar) containing the same concentration of 20E. Inset shows the weight ±95% confidence intervals at which larvae reach critical weight. The age and size at which larvae reach critical weight was determined using breakpoint analysis and means and ±95% confidence intervals were calculated from 1000 bootstrap datasets.
Figure 1—figure supplement 1
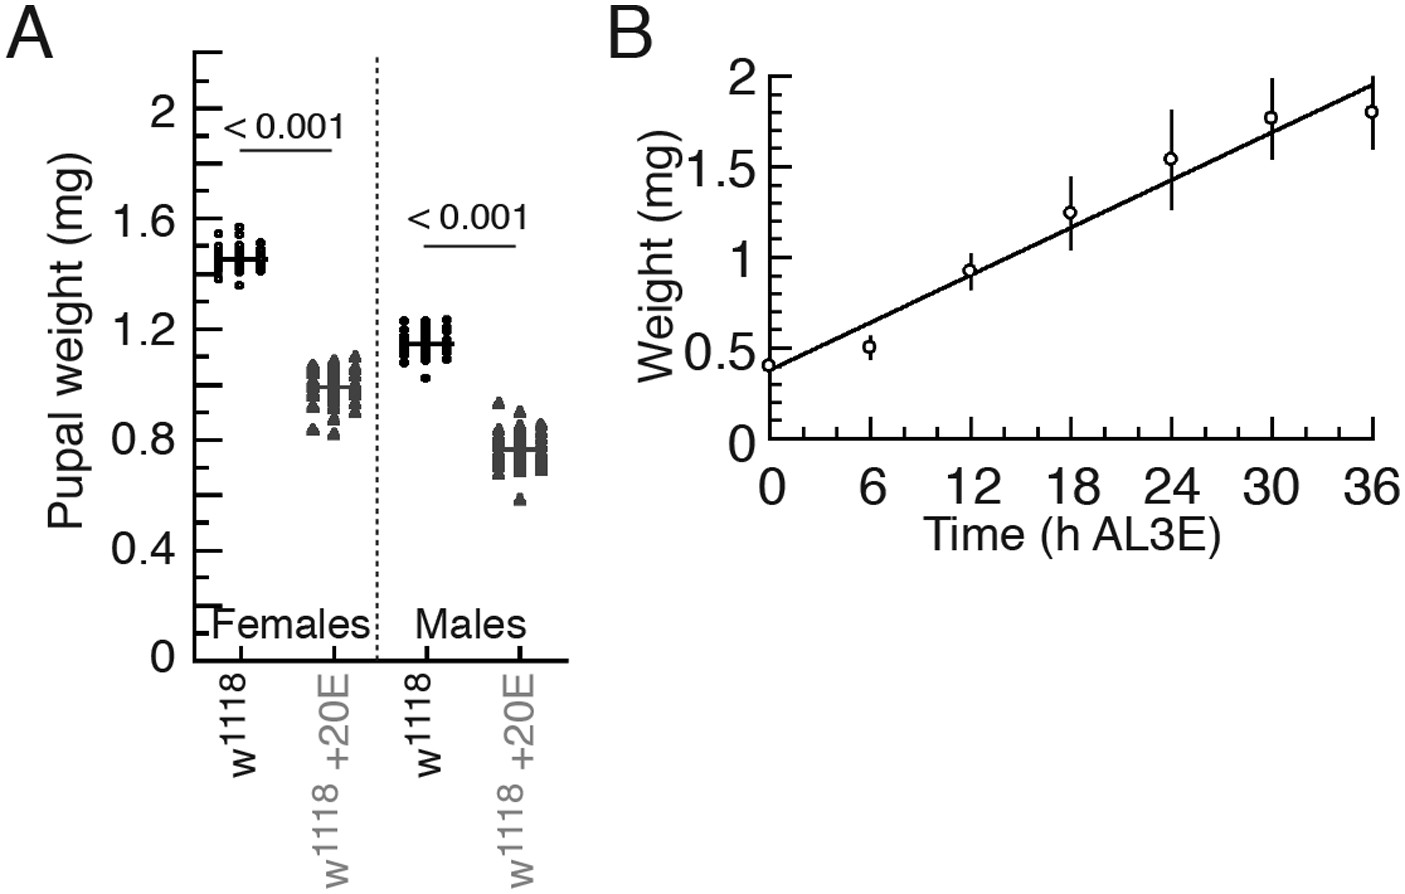
Ecdysone administration reduced body size.
(A) Feeding larvae with 20E-supplemented fly medium reduces body size in w[1118] animals. The numbers indicate p-values by ANOVA and pairwise t tests. (B) Continuously fed w[1118] larvae show linear growth curve during their feeding period. Each point indicates the mean weight ± S.D. N = 12–16.
Figure 2
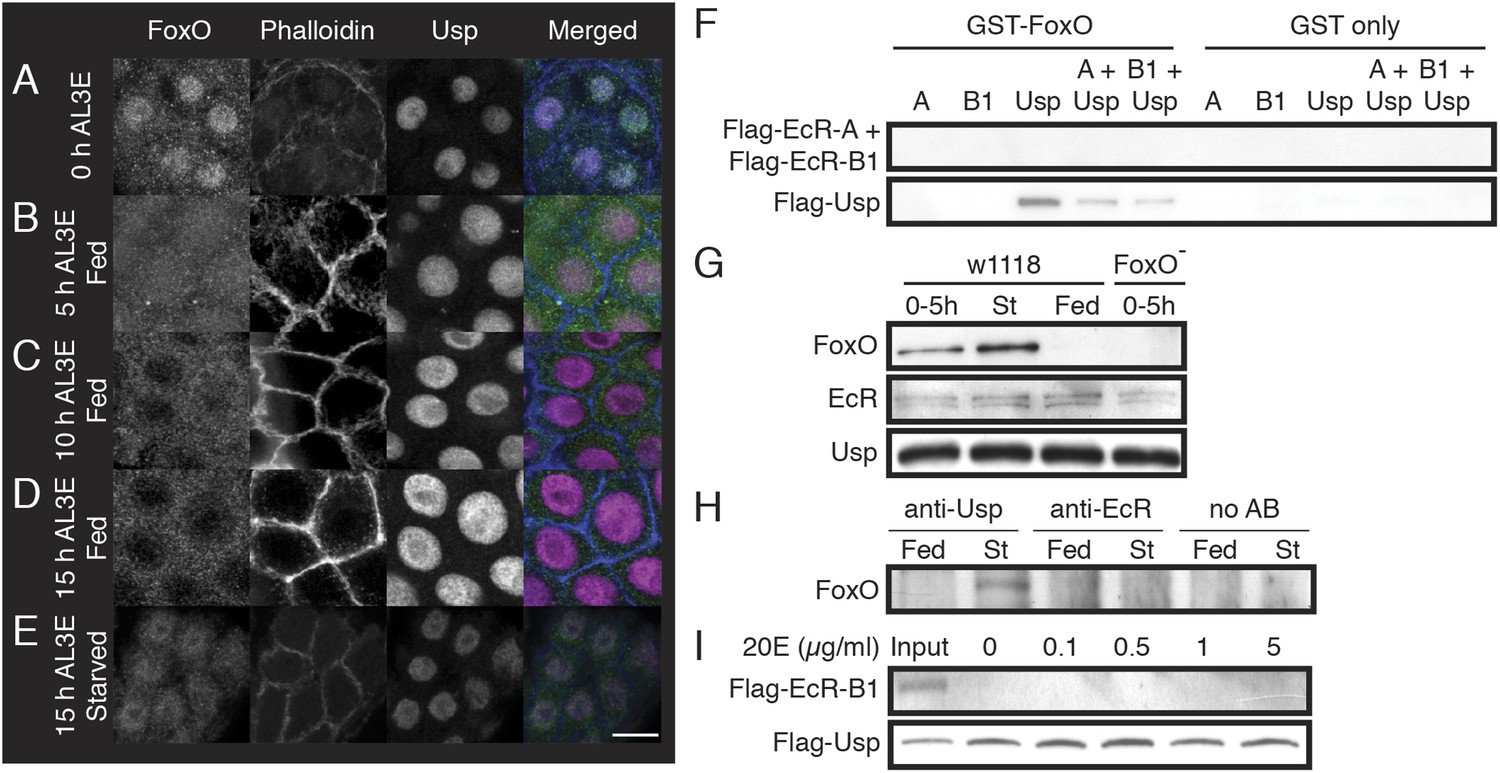
FoxO co-localizes with Usp in the PGs of pre-critical weight larvae and FoxO binds to Usp.
(A–E) FoxO progressively moved out of the nuclei and into the cytoplasm of the PG cells in response to nutrition. PGs from w[1118] larvae at the onset of the L3 (A), fed for 5 (B), 10 (C) and 15 hr (D) or starved for 15 hr (E) were immunostained for FoxO, Usp and phalloidin. The scale bar is 10 µm. (F) GST-pulldown shows that FoxO binds to Usp but not to EcR. (G) FoxO associates with Usp before larvae reach critical weight but does not affect EcR–Usp association. Newly molted w[1118] larvae (0–5 hr AL3E) were either protein-starved (St) on 20% sucrose solution or fed on a standard fly medium (Fed) for additional 24 hr, and then the anterior halves of larvae without the fat body and salivary glands were used for protein extraction. We also examined pre-critical weight FoxO mutant (FoxO Δ94/Df(3R)Exel8159) larvae (0–5 hr) as a negative control. Precipitation was performed using the anti-Usp antibody. (H) Usp but not EcR associates with FoxO in co-immunoprecipitation assays using anti-Usp and anti-EcR antibodies. No AB indicates the no-antibody control. Protein extracts were prepared as in (G). (I) Presence of 20E neither changes FoxO–Usp binding properties nor induces FoxO–EcR association in a GST-pulldown assay.
Figure 3 with 1 supplement

Manipulating FoxO and/or Usp in the PGs changes the timing of critical weight.
(A–C) Age at which animals are starved in relation to the time to pupariation from the onset of starvation for Phm>FoxO (A), Phm>Usp (B), Phm>FoxO, Usp (C) animals and their parental controls (Phm>+ and no driver, ND). (D) Critical weight was compared when either or both FoxO and/or Usp were overexpressed in the PGs. (E–G) Age at which animals are starved in relation to the time to pupariation from the onset of starvation for Phm>dsFoxO (E), Phm>dsUsp (F), and Phm>dsFoxO, dsUsp (G) and their parental controls. (H) Critical weight was compared when either or both FoxO and/or Usp were knocked down in the PGs. Insets show the size at critical weight ±95% confidence intervals. The age at which larvae reached critical weight ±95% confidence intervals was determined by breakpoint analysis. Points or columns sharing the same letter indicate the groups that are statistically indistinguishable from one another; points or columns that differ in letters are significantly different (Permutation Test, p < 0.05).
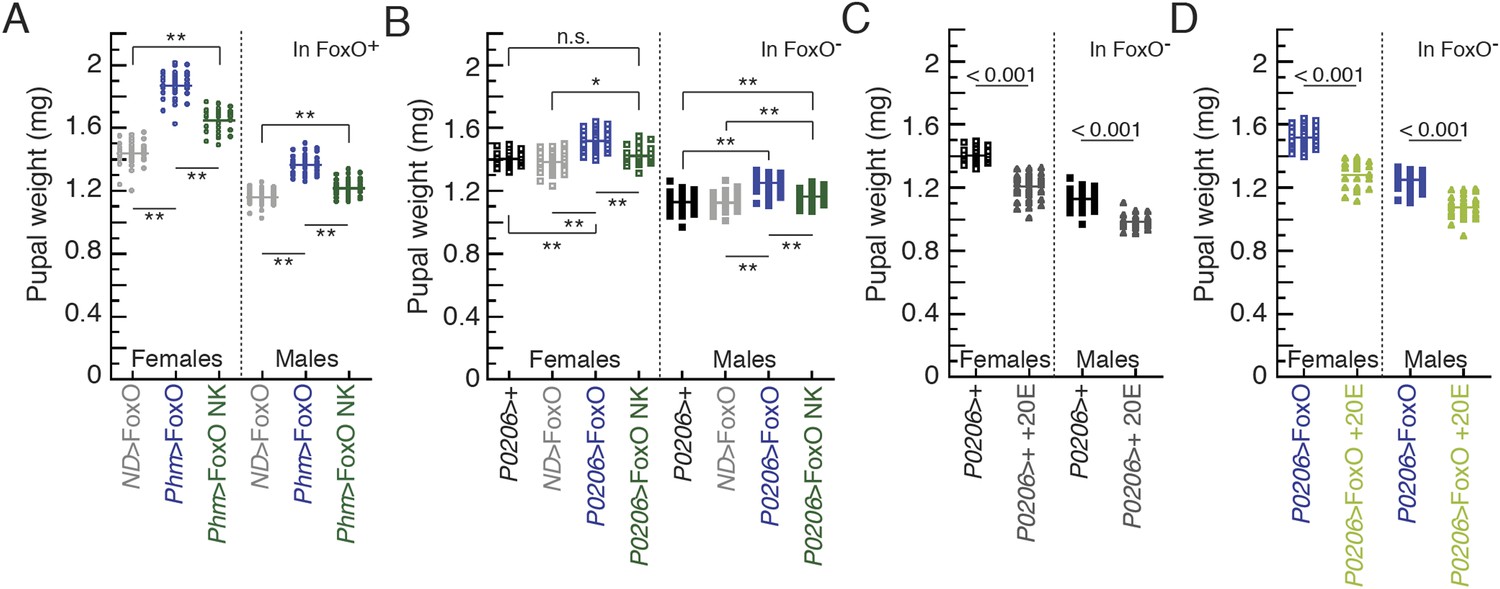
Figure 3—figure supplement 1
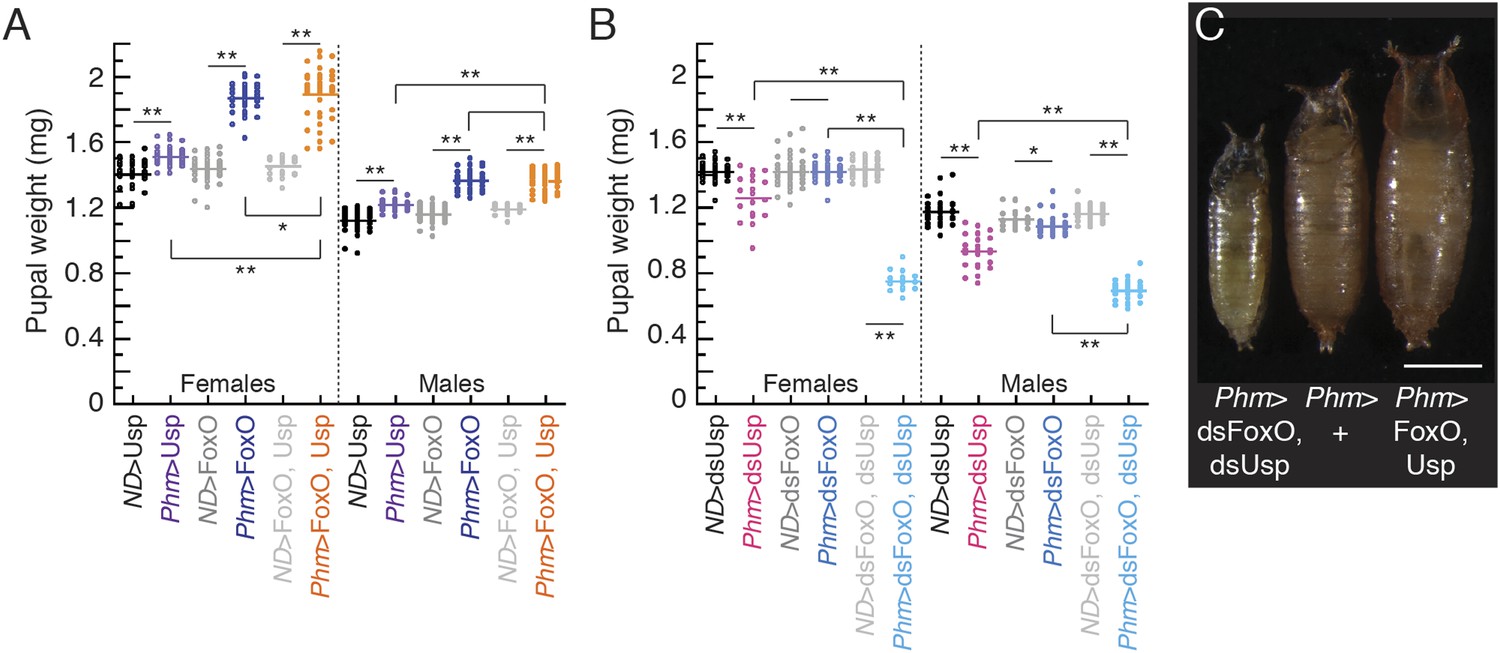
Manipulating FoxO and/or Usp in the PGs changes the body size.
(A) Overexpressing FoxO and/or Usp in the PGs increases body size. (B) Knocking down both FoxO and Usp in the PGs decreases body size. One and two asterisks indicate p < 0.05 and p < 0.01, respectively, by ANOVA and pairwise t-tests. (C) Knocking down both FoxO and Usp in the PGs reduces body size while overexpression of both genes increases size of pharate adult females. From left to right, the pupae are Phm>dsFoxO, dsUsp, Phm>+ and Phm>FoxO, Usp. The scale bar is 1 mm.
Figure 4
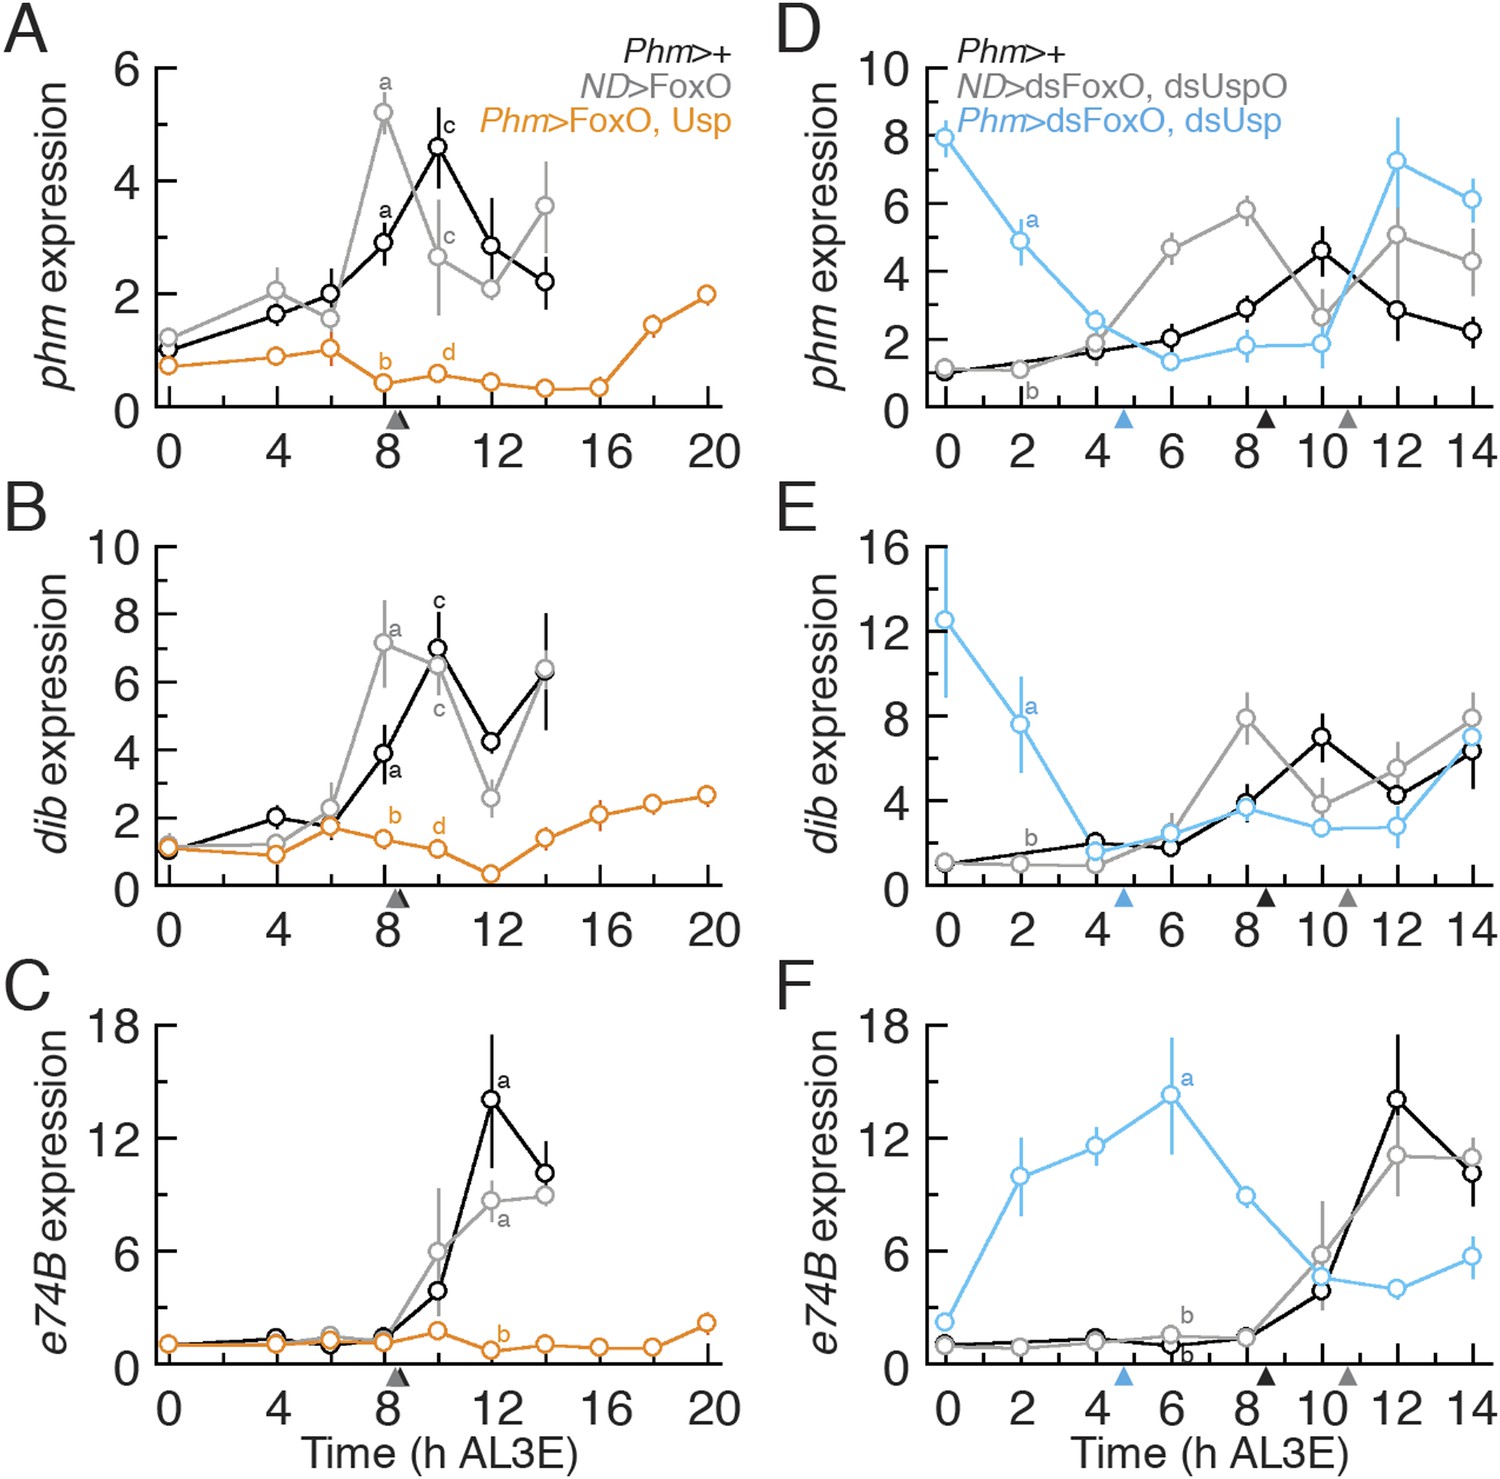
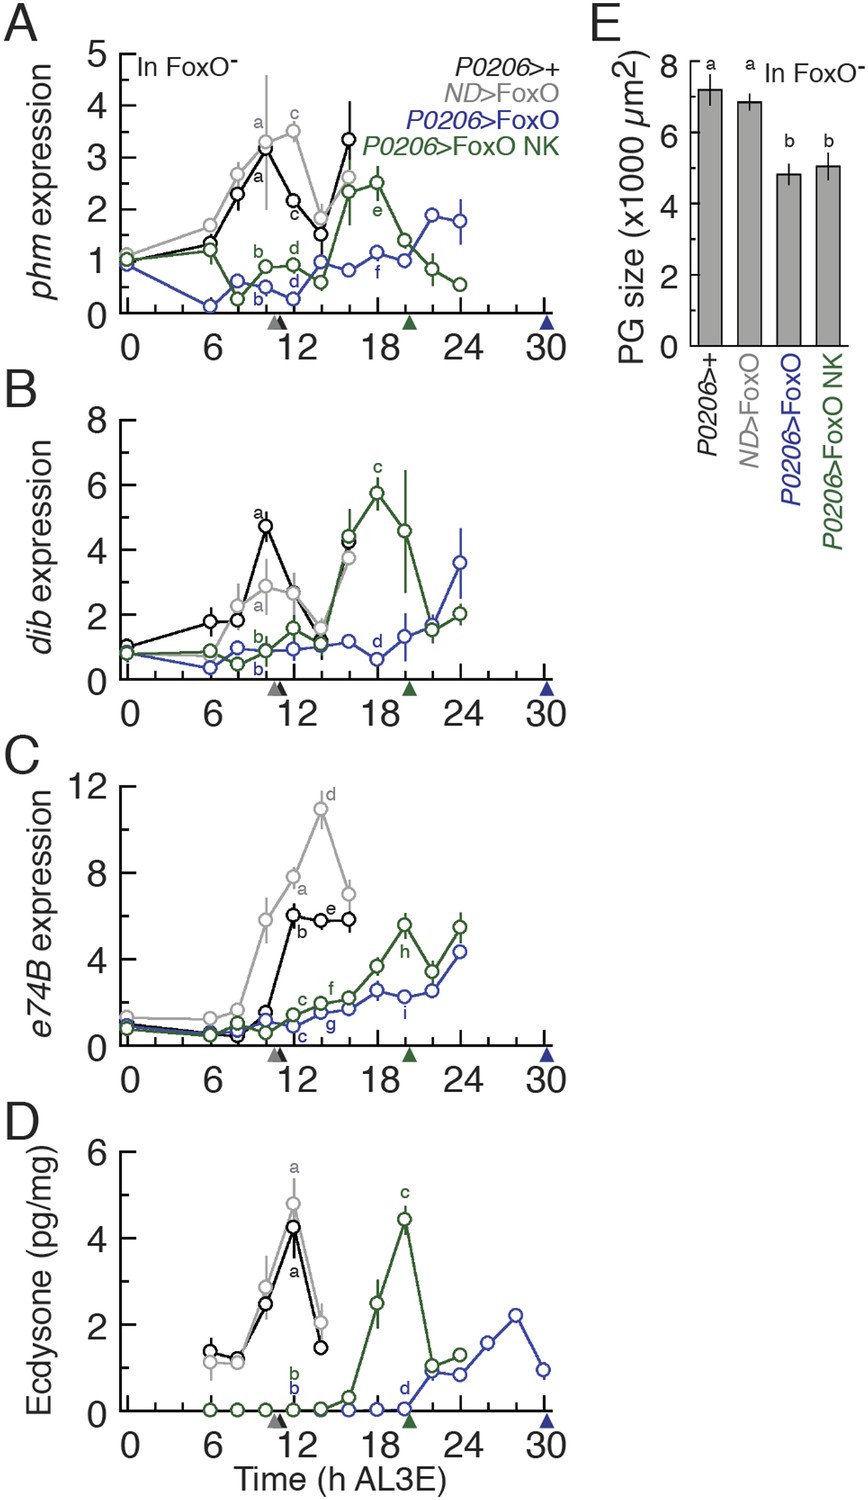
Altering FoxO and Usp expression also alters phm, dib and e74B expression.
(A–C) Relative phm (A), dib (B) and e74B (C) mRNA expression in Phm>FoxO, Usp animals were quantified by quantitative PCR. (D–F) Relative phm (D), dib (E) and e74B (F) mRNA expression in Phm>dsFoxO, dsUsp animals were quantified by qPCR. We normalized the values using an internal control, RpL3. Then, we standardized the expression level of each gene by fixing the values at 0 hr in Phm>+ animals as 1 in all figures. We used 4–6 larvae for each sample and three biologically independent samples for each time point. Each point indicates the relative mean expression ± SEM. Points sharing the same letter indicate the mean expression at the time ±2 hr are statistically indistinguishable from one another; points that differ in letters are significantly different (p < 0.05). Arrowheads along the x axes indicate the age at which each genotype reached critical weight from Figure 3A,C,G.
Figure 5 with 3 supplements
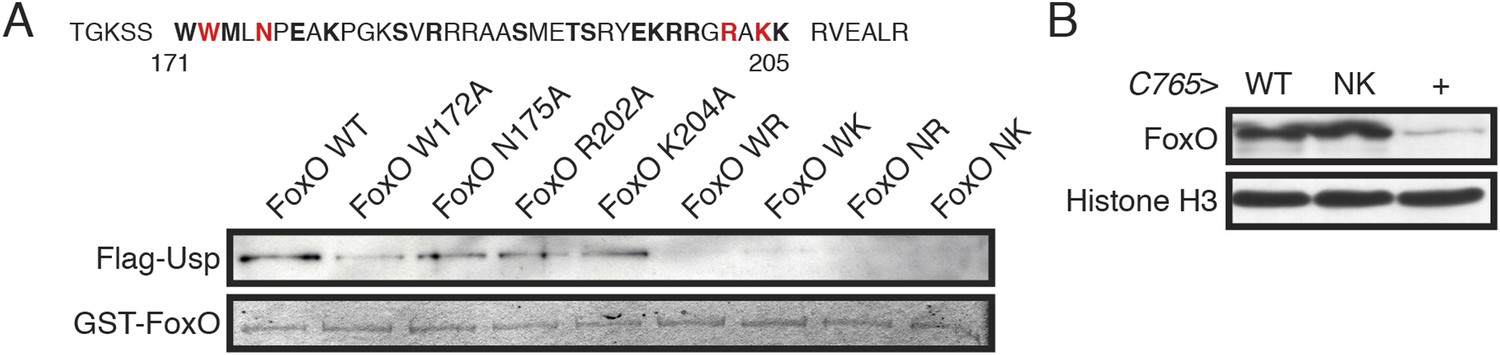
The Usp binding site in FoxO protein was identified and FoxO NK mutation showed reduced binding affinity to Usp.
(A) Point mutations were induced in the FoxO protein at site of the amino acids indicated in bold. Point mutations indicated in red showed reduced binding affinity to Usp. For a loading control, we used Coomassie Brilliant Blue staining to detect GST-FoxO fusion protein. (B) UAS FoxO and UAS FoxO NK transgenes show similar expression levels. We overexpressed either FoxO or FoxO NK using C765-Gal4. The wing discs were dissected from early white prepupae. We used C765>+ as a parental control, and Histone H3 as a loading control.
Figure 5—figure supplement 1

Amino acid sequence alignments of the Usp binding motif across arthropods and with non-arthropods.
All FoxO sequence information except for Daphnia pulex FoxO was obtained from the NCBI and aligned using the ClustalW2. The NCBI Reference numbers are: XP_001662969.1 (Aedes aegypti), XP_001122804.2 (Apis mellifera), HE648216.1 (Blattella germanica), JQ081294.1 (Bombyx mori), NP_996204.1 (Drosophila melanogaster), XP_002433432.1 (Ixodes scapularis), XP_001607658.2 (Nasonia vitripennis), EEZ98556.1 (Tribolium castaneum), NP_001021597.1 (Caenorhabditis elegans, Daf-16) and NP_062713.2 (Mus musculus, FoxO1). Daphnia pulex FoxO sequence was obtained from Grigoriev et al., 2012.
Figure 5—figure supplement 2
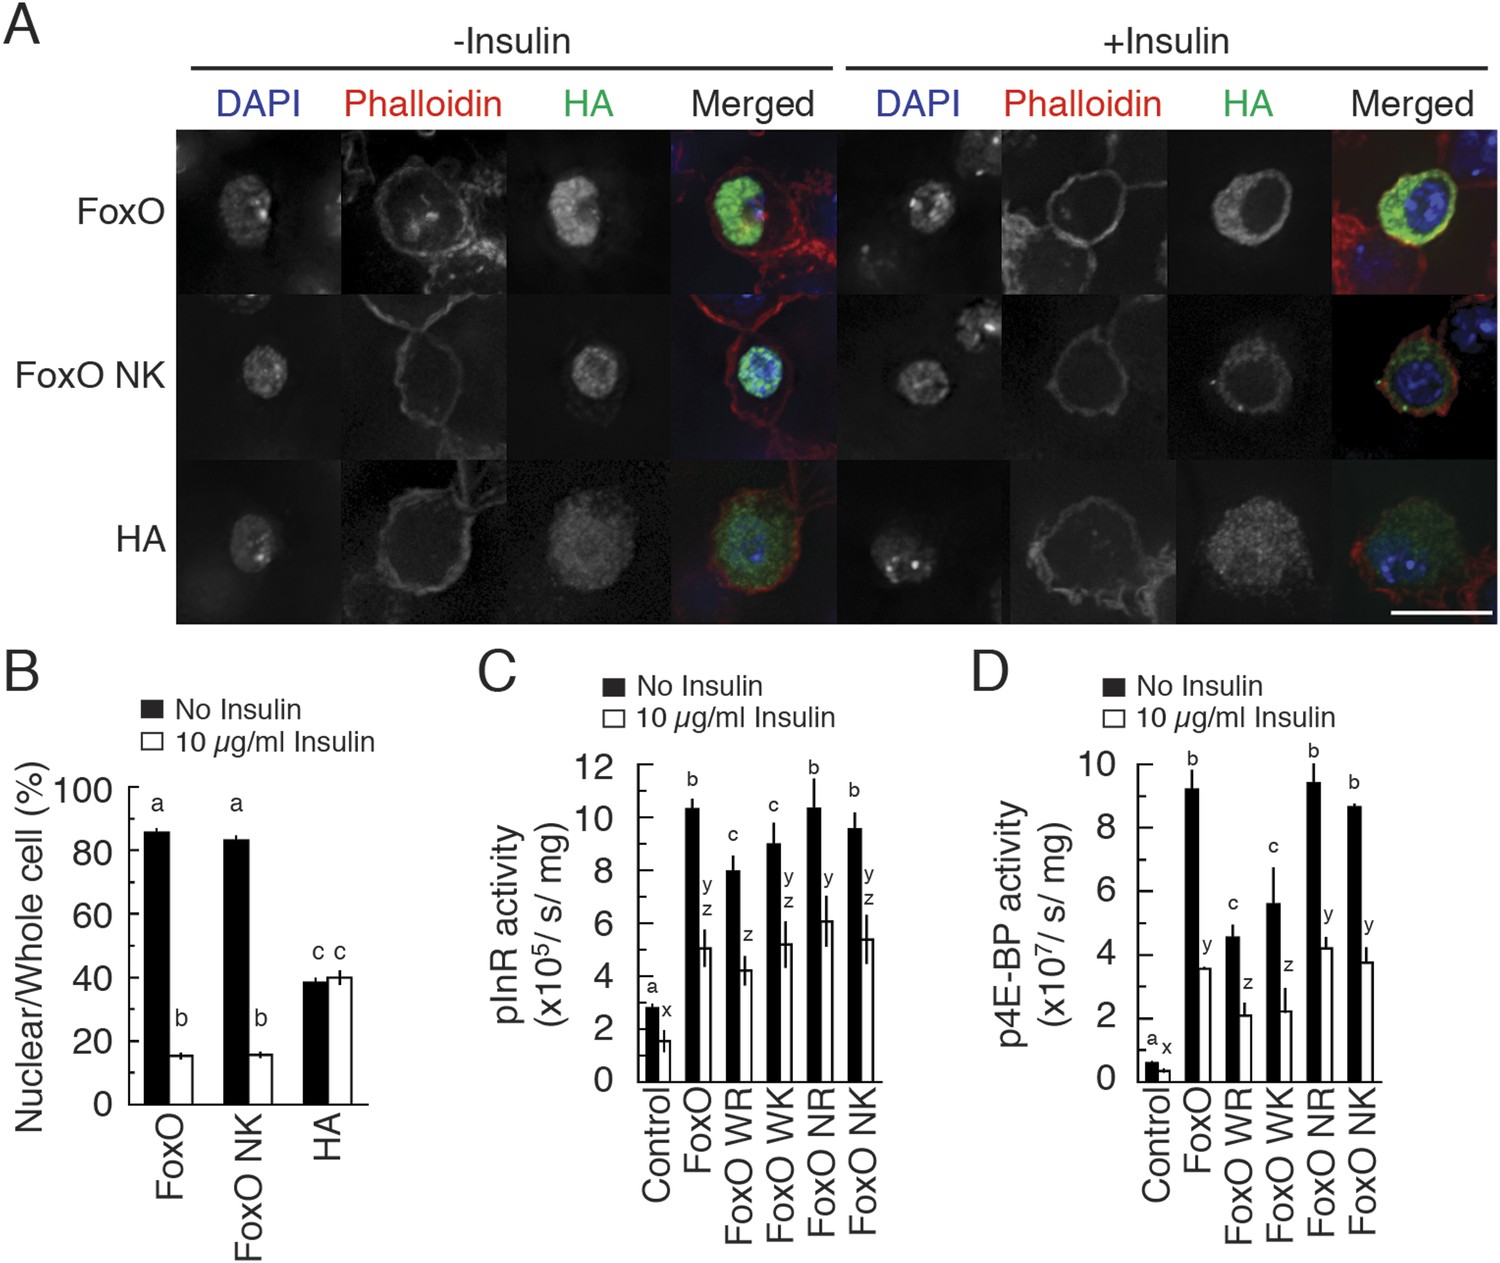
FoxO NK does not change the Usp-independent function of FoxO.
(A and B) FoxO NK protein translocated to the cytoplasm in the presence of insulin. In all conditions, Dmel cells were transfected with 0.4 µg of plasmid. 66 hr after transfection, cells were split into two groups on cover glasses and one was treated with 10 µg/ml bovine insulin for additional 6 hr. These cells were then fixed and processed for immunocytochemistry against HA-tag followed by DAPI and phalloidin staining (A). The scale bar is 10 µm. The HA-tagged FoxO signal intensity in nucleus and entire cell was quantified using ImageJ (B). N = 27–41. Values indicate mean % ± SEM. Columns sharing the same letters indicate the groups that are statistically indistinguishable from one another; columns with different letters are significantly different (p < 0.05). (C and D) FoxO NK activates FoxO target genes in luciferase assays. FoxO NK activates both the InR (C) and 4E-BP (D) promoters (N = 4). We used the ampr construct to transfect an equal amount of plasmid in all treatments. Values indicate Luciferase activity/s/mg protein ± SEM. Columns sharing the same letters indicate the groups that are statistically indistinguishable from one another; columns with different letters are significantly different (ANOVA, p < 0.05).
Figure 5—figure supplement 3
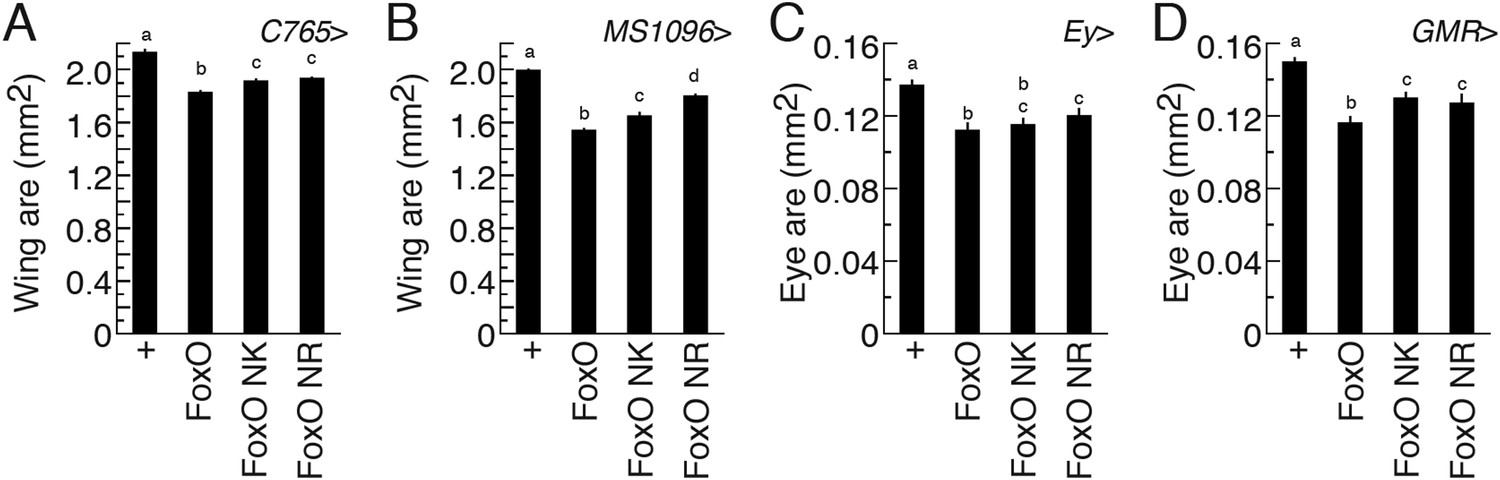
FoxO NK shows Usp-independent FoxO activity in transgenic flies.
Adult wing size was quantified in the animals in which transgenes were overexpressed using either C765- (A) or MS1096- (B) Gal4. Right wings from females were mounted and photographed, and then wing area was measured by ImageJ. N = 12–16 for (A) and N = 16–22 for (B). Values indicate mean area (mm2) ± SEM. Adult eye size was quantified in the animals in which transgenes were overexpressed using either eyeless- (Ey-) (C) or GMR- (D) Gal4. Left eyes of females were photographed, and then eye area was measured by ImageJ. N = 13–23 for (C) and N = 15–29 for (D).
Figure 6 with 2 supplements
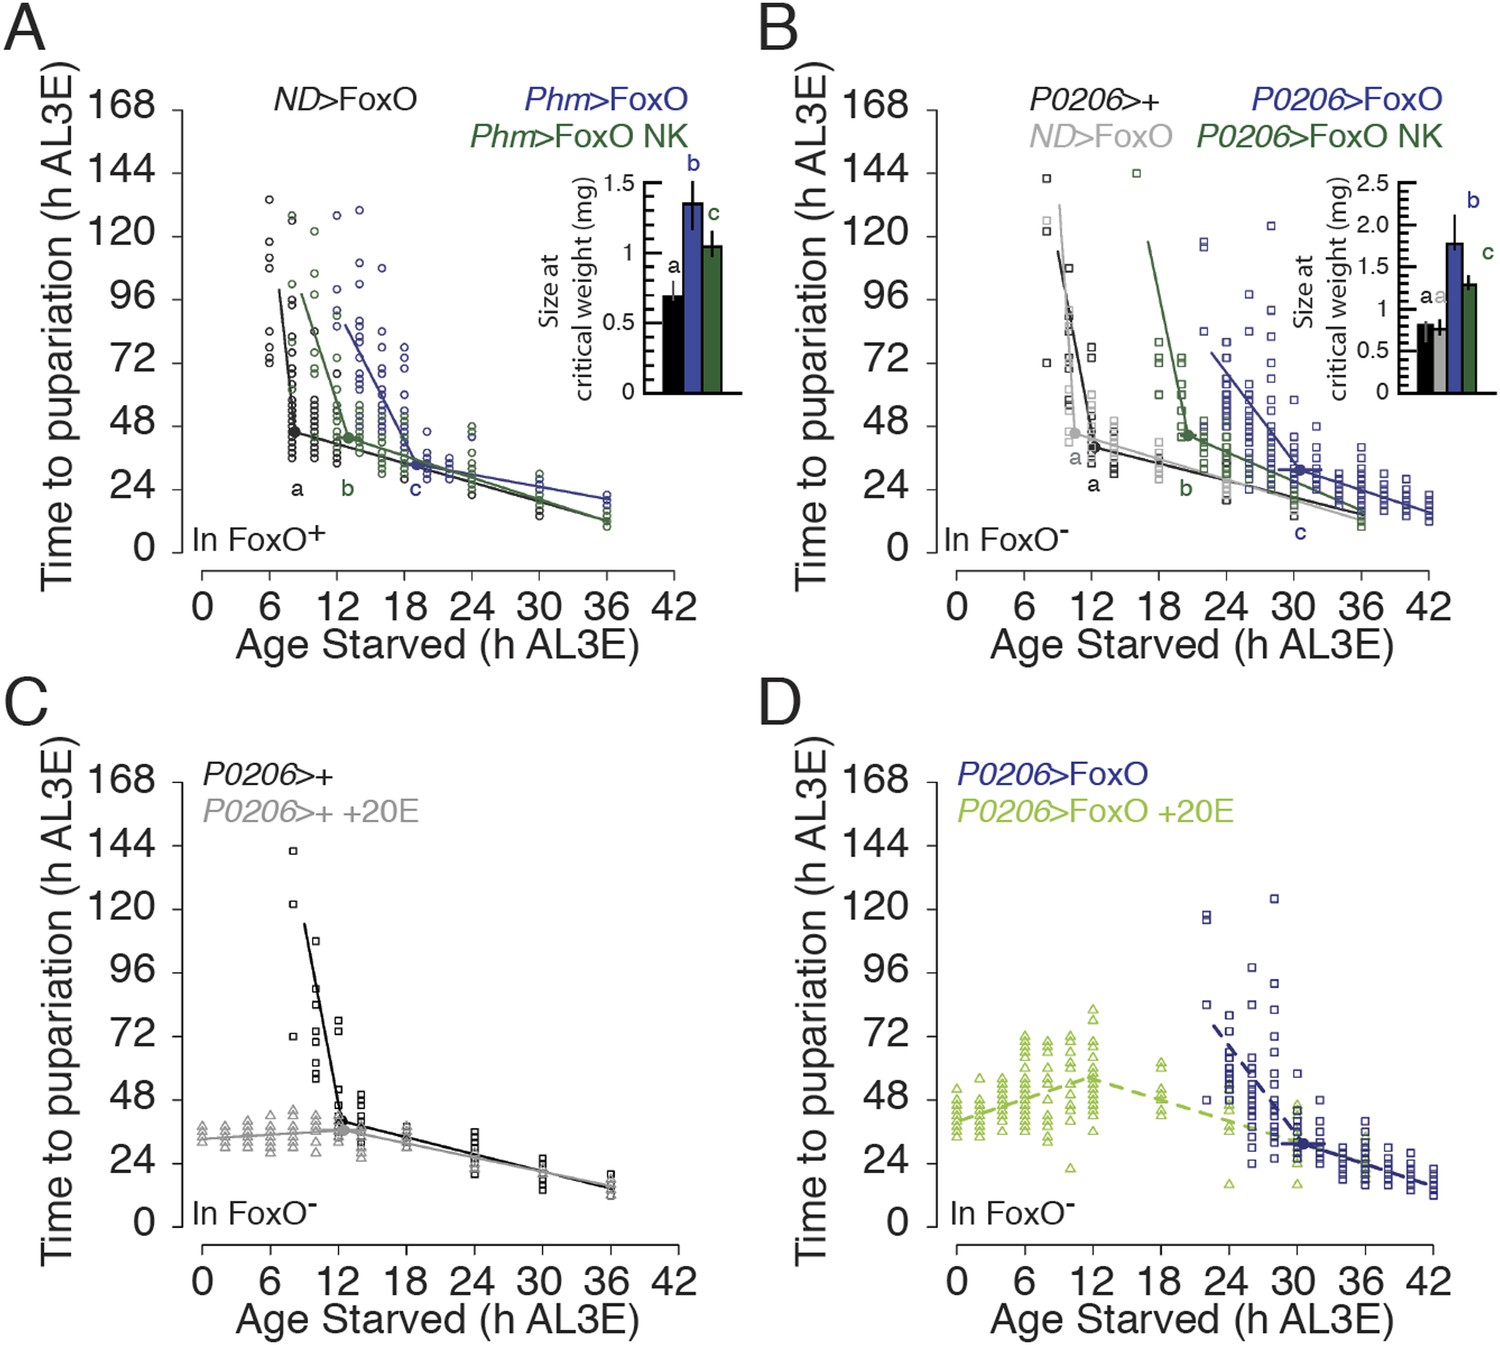
Interfering FoxO–Usp association changes the timing of critical weight.
(A and B) Age at which animals are starved in relation to the time to pupariation from the onset of starvation for Phm>FoxO and Phm>FoxO NK in the FoxO wild type background (A), and P0206>FoxO and P0206>FoxO NK in the FoxO mutant background (B) and their parental controls. (C and D) Feeding ecdysone throughout the L3 eliminates developmental delay in P0206>+ (C) and in P0206>FoxO (D), FoxO mutant larvae. The larvae were continuously fed 0.15 mg/g 20E as described in Figure 1. Data for ND>FoxO and Phm>FoxO in A and for the non-20E-treated data in C and D were re-plotted from Figure 3A and Figure 6B, respectively. Insets show the size at critical weight (mg) ±95% confidence intervals. The age at which larvae reach critical weight ±95% confidence intervals was determined by breakpoint analysis. Points or columns sharing the same letters indicate the groups that are statistically indistinguishable from one another; points or columns that differ in letters are significantly different (Permutation Test, p < 0.05).
Figure 6—figure supplement 1
FoxO NK overexpression in the PGs reduced the body size phenotype.
(A and B) FoxO NK overexpression in the PGs reduced the body size phenotype in FoxO wild type (A) and FoxO mutant (B) animals. (C and D) Feeding 20E reduces body size in P0206>+ (C) and in P0206>FoxO (D), FoxO mutant animals. One and two asterisks indicate p < 0.05 and p < 0.01, respectively, and the numbers indicate p-values by ANOVA and pairwise t tests. n.s. indicates no significance.
Figure 6—figure supplement 2
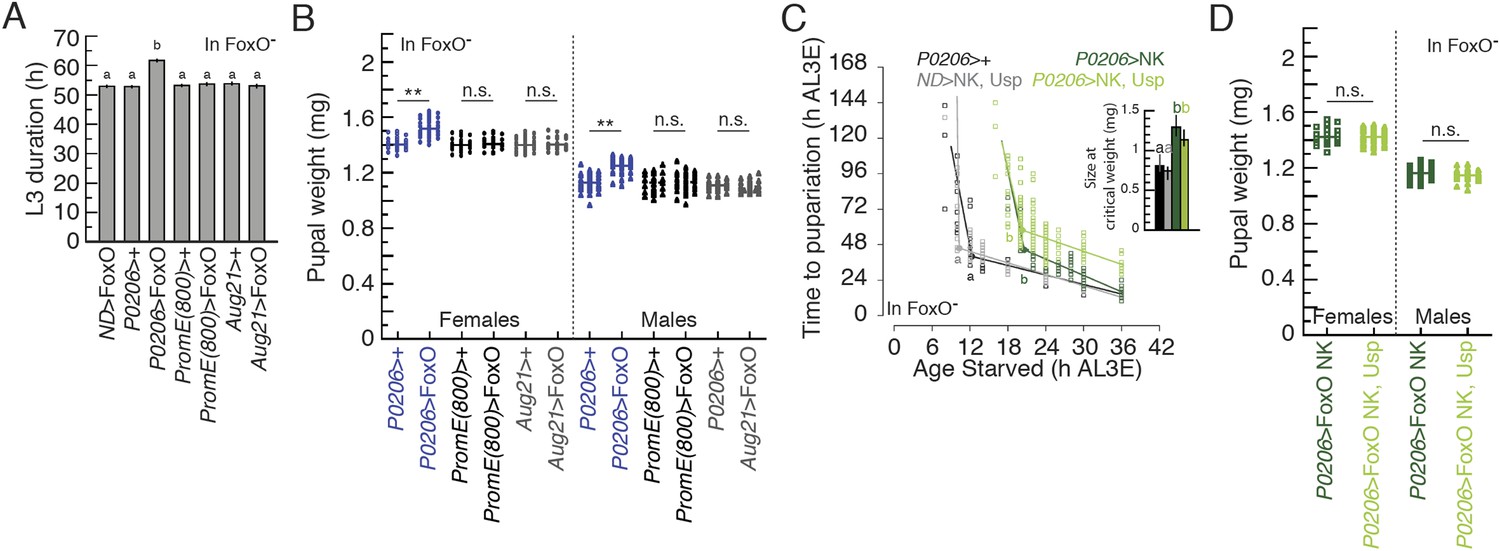
The effects of overexpressing FoxO using P0206-Gal4 is due to the function of FoxO in the PGs and FoxO NK shows proper Usp-independent transcriptional activity.
(A) Overexpressing FoxO in the oenocytes or corpora allata does not affect developmental timing. We used PromE(800)-Gal4 as an oenocyte specific driver and Aug21-Gal4 as a corpora allata specific driver. Values indicate average L3 duration ± SEM. Columns sharing the same letters indicate the groups that are statistically indistinguishable from one another; columns with different letters are significantly different (ANOVA, p < 0.05). N = 60–137. (B) Overexpressing FoxO in the oenocytes or corpora allata does not affect body size. N = 27–45. Two asterisks indicate p < 0.01 by ANOVA and pairwise t tests. n.s. indicates no significance. (C) Overexpressing Usp with FoxO NK did not show any additional delay of the timing of critical weight. (D) Overexpressing both Usp and FoxO NK in the ring gland (using P0206-Gal4) of FoxO null animals did not significantly change female or male pupal weight when compared to overexpressing FoxO NK alone.
Figure 7 with 1 supplement
The FoxO/Usp complex suppresses critical weight through inhibiting ecdysone biosynthesis in the PGs.
(A–C) Relative phm (A), dib (B), and the ecdysone response gene e74B mRNA expression (C) in the FoxO mutant backgrounds were quantified by qPCR. We normalized the values by an internal control, ribosomal protein large subunit 3 (RpL3). Then, we standardized the expression level of each gene by fixing the values at 0 hr in P0206>+ animals as 1. We used 5–6 larvae for each sample and three biologically independent samples for each time point. Each point indicates the relative mean expression ± SEM. Points sharing the same letters indicate the mean expression at the time ±2 hr are statistically indistinguishable from one another; points that differ in letters are significantly different (p < 0.05). (D) The FoxO/Usp complex suppresses ecdysone biosynthesis during critical weight period in larvae with FoxO mutant backgrounds. We used 32–46 larvae for each sample and three biologically independent samples for each time point. Each point indicates the mean ecdysone concentration ± SEM. Points sharing the same letter indicate the mean concentration at the time ±2 hr are statistically indistinguishable from one another; points that differ in letters are significantly different (p < 0.05). Arrowheads along the x axes indicate the age at which each genotype reached critical weight from Figure 6B. (E) Overexpressing FoxO or FoxO NK equally reduces the PG size of the FoxO null mutant larvae. The PGs were dissected at 24 hr AL3E and stained with phalloidin. After photographing, these areas were quantified using the ImageJ. Each bar indicates the mean area ± SEM. N = 7–10. Columns sharing the same letter indicate the groups that are statistically indistinguishable from one another; columns that differ in letters are significantly different (p < 0.05).
Figure 7—figure supplement 1
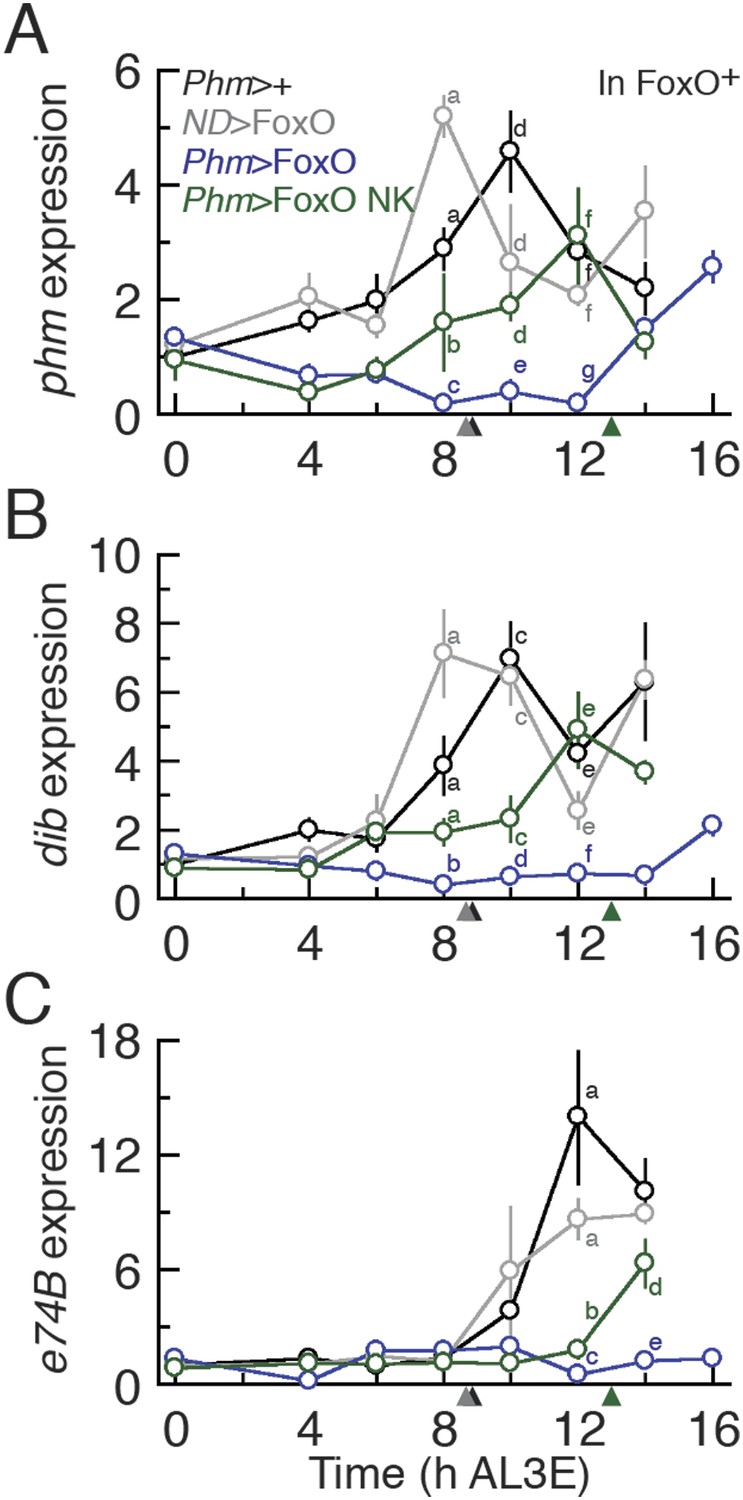
The FoxO/Usp complex delays ecdysone synthesis and ecdysone response gene expression in the FoxO wild type background.
Relative phm (A), dib (B) and e74B (C) mRNA expression in Phm>FoxO and Phm>FoxO NK animals were quantified by qPCR. We normalized the values using an internal control, RpL3. Then, we standardized the expression level of each gene by fixing the values at 0 hr in Phm>+ animals as 1 in all figures. We used 4–6 larvae for each sample and three biologically independent samples for each time point. Each point indicates the relative mean expression ± SEM. Points sharing the same letter indicate the mean expression at the time ±2 hr are statistically indistinguishable from one another; points that differ in letters are significantly different (p < 0.05). Arrowheads along the x axes indicate the age at which each genotype reached critical weight from Figure 3A,6A.
Figure 8
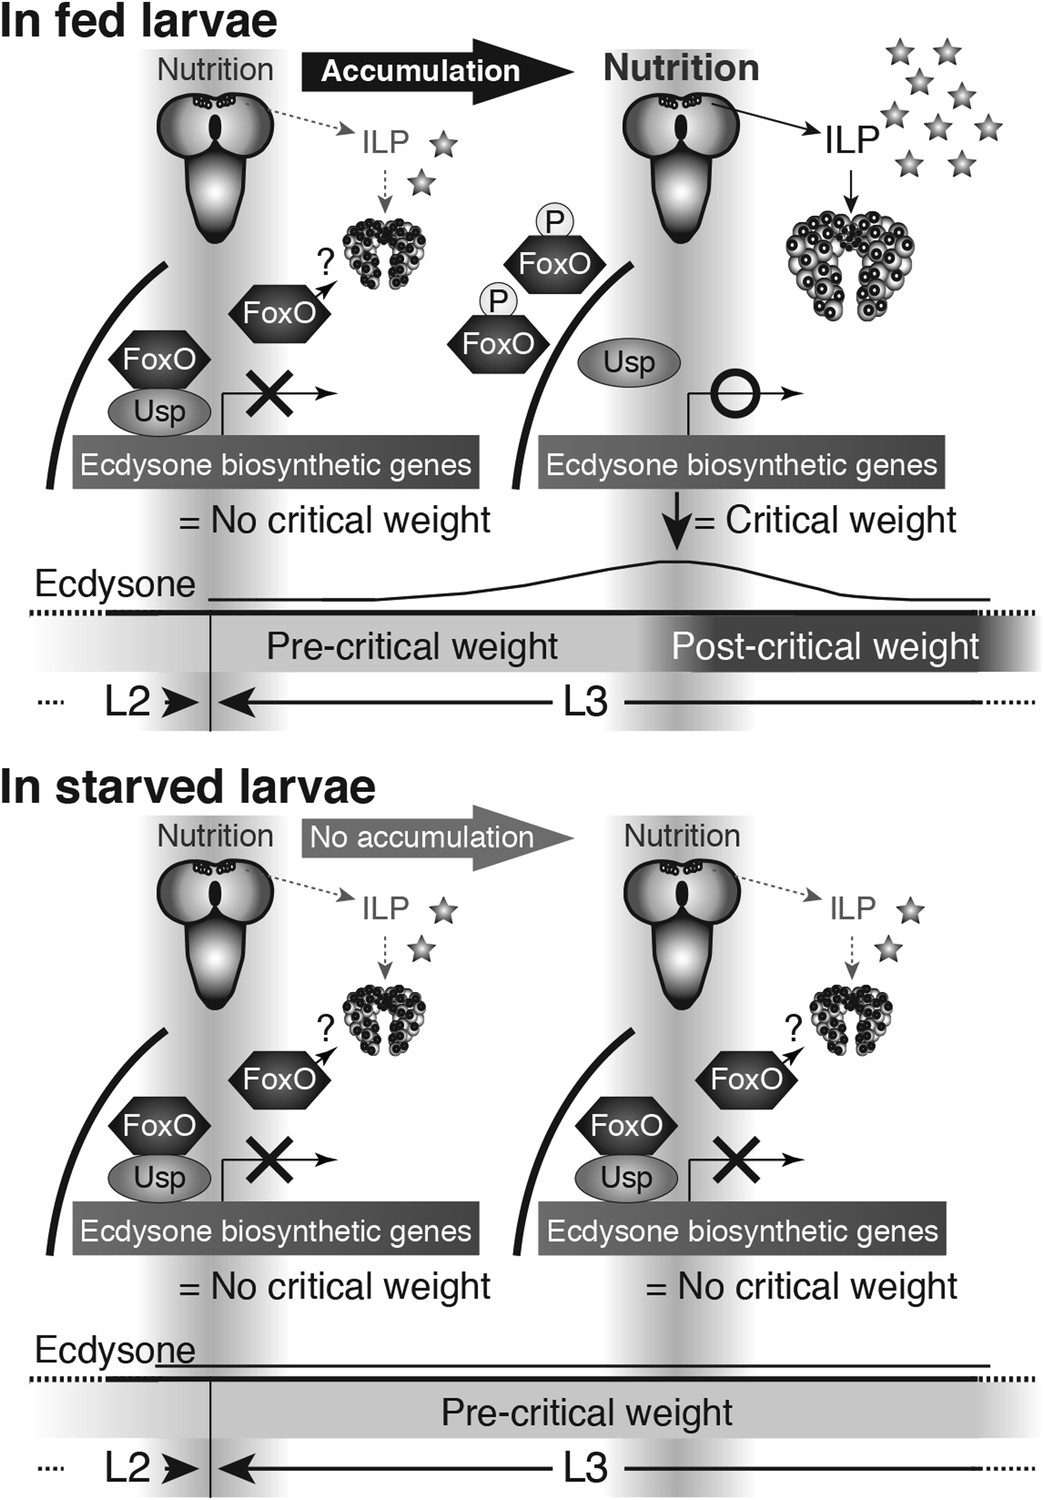
Proposed model: Nutrition regulates ecdysone biosynthesis during critical weight through FoxO/Usp.
At the onset of the L3 (left), IIS/TOR signaling is reduced in the PG cells and the FoxO/Usp complex suppresses ecdysone biosynthesis either directly, as drawn, or indirectly. As the larvae feed, FoxO becomes phosphorylated and transported out of the nucleus, thereby dissociating FoxO/Usp complexes. As a result, ecdysone biosynthesis becomes derepressed (upper right). After critical weight, ecdysone reduces its own biosynthesis through a negative-feedback loop. In starved conditions, the IIS/TOR signaling activity in the PGs remains low, thereby unphosphorylated FoxO remains inside of nuclei forming complexes with Usp (lower right). This inhibits ecdysone biosynthetic gene expression, thereby repressing ecdysone biosynthesis and delaying metamorphosis. FoxO on its own or with an unknown partner(s) may also regulate ecdysone biosynthesis.
Additional files
-
Supplementary file 1
Means for age and size at critical weight and time to metamorphosis from critical weight ±95% confidence intervals. Statistical comparisons for age at critical weight and size at critical weight between genotypes and treatments are shown in Figures 3, 6 and Figure 6—figure supplement 2. Genotypes fed on ecdysone-supplemented medium (+20E) do not show delays in development and therefore age at critical weight cannot be determined (na). For time from critical weight to pupariation, mean times to pupariation within the same shaded box that share the same letter are statistically indistinguishable. Those that differ in letter are significantly different, as determined by Permutation tests (p < 0.034).
- https://doi.org/10.7554/eLife.03091.019
-
Supplementary file 2
Primers used for quantitative PCR.
- https://doi.org/10.7554/eLife.03091.020
-
Supplementary file 3
Primers used for Luciferase constructs.
- https://doi.org/10.7554/eLife.03091.021
Download links
A two-part list of links to download the article, or parts of the article, in various formats.
Downloads (link to download the article as PDF)
Open citations (links to open the citations from this article in various online reference manager services)
Cite this article (links to download the citations from this article in formats compatible with various reference manager tools)
Nutritional control of body size through FoxO-Ultraspiracle mediated ecdysone biosynthesis
eLife 3:e03091.
https://doi.org/10.7554/eLife.03091


