Adult-born granule cells mature through two functionally distinct states
- Institute of Experimental Medicine, Hungarian Academy of Sciences, Hungary
- Semmelweis University School of PhD Studies, Hungary
- University of Zurich, Switzerland
Figures
Figure 1
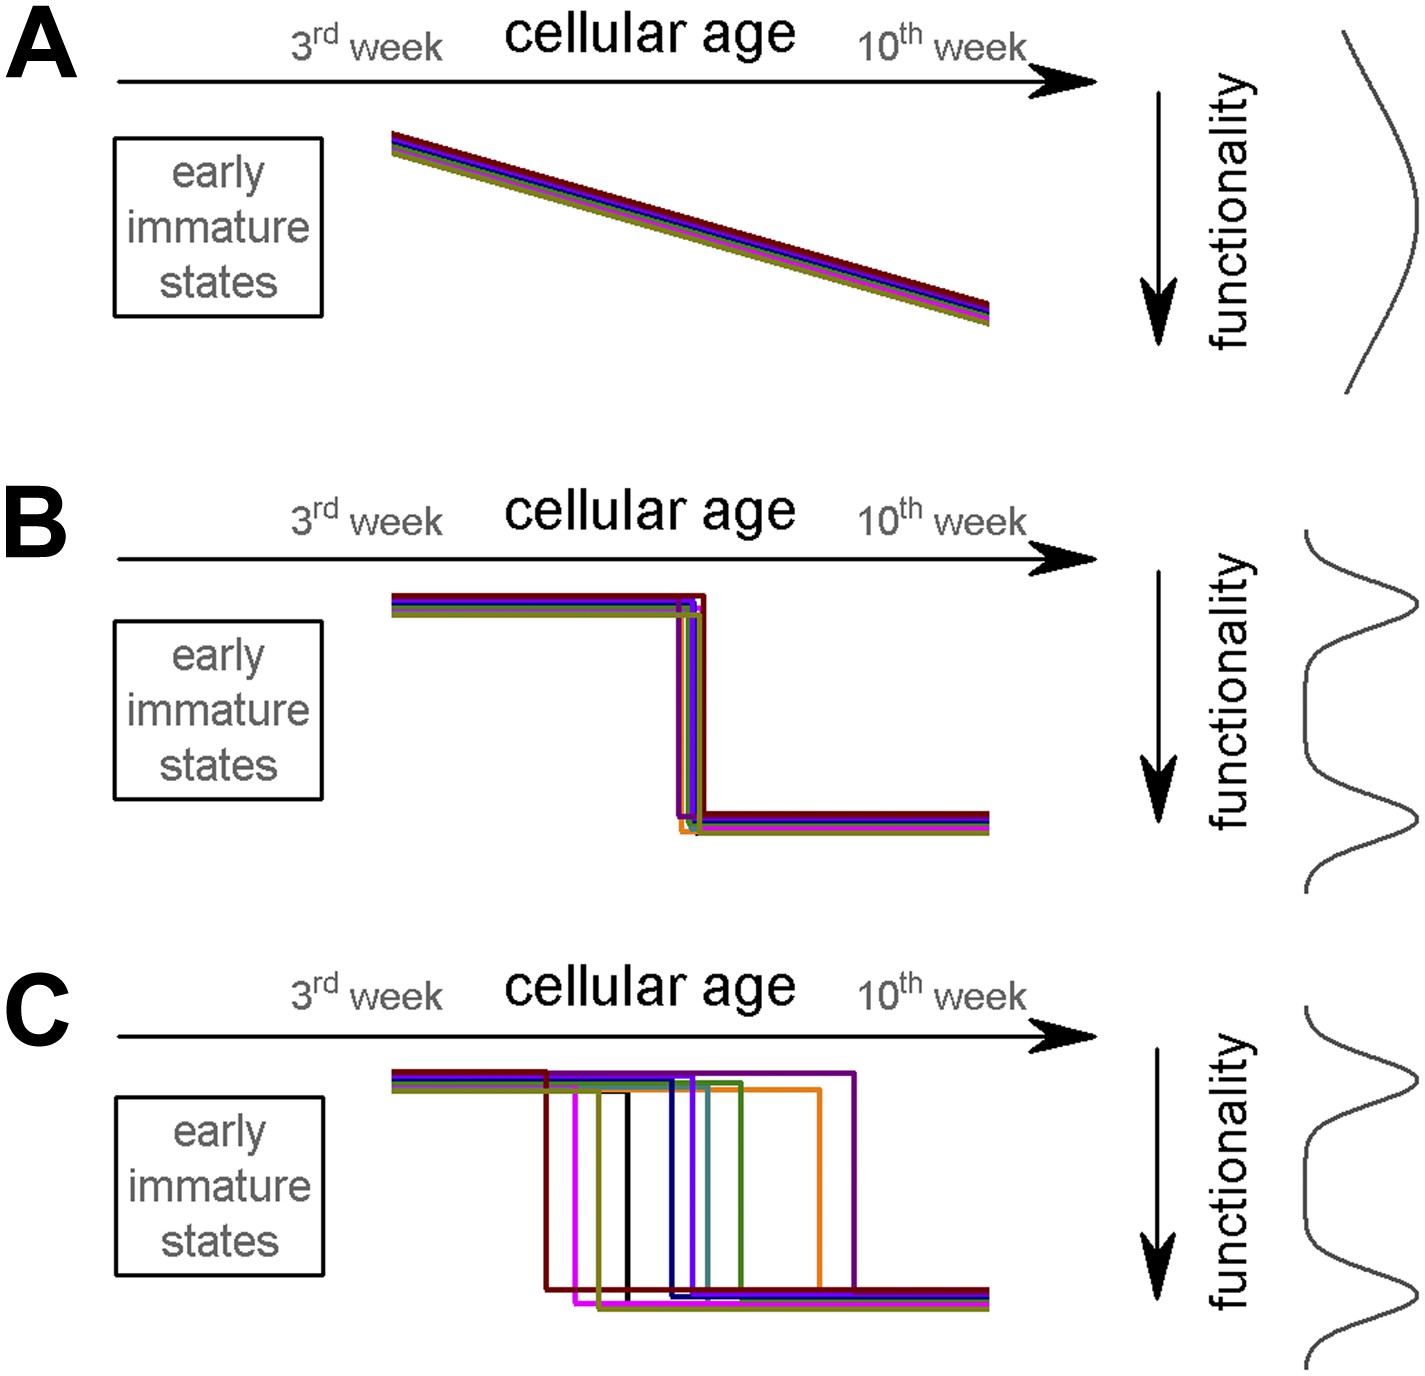
Potential theoretical modes of postmitotic maturation of functional properties.
Each colored line represents the age-dependent change of a theoretical parameter from individual ABGCs. (A) Gradual maturation of the properties results in widely distributed functional continuum. (B) Temporally predefined functional switch. (C) The functional switch occurs in an extended temporal window.
Figure 2
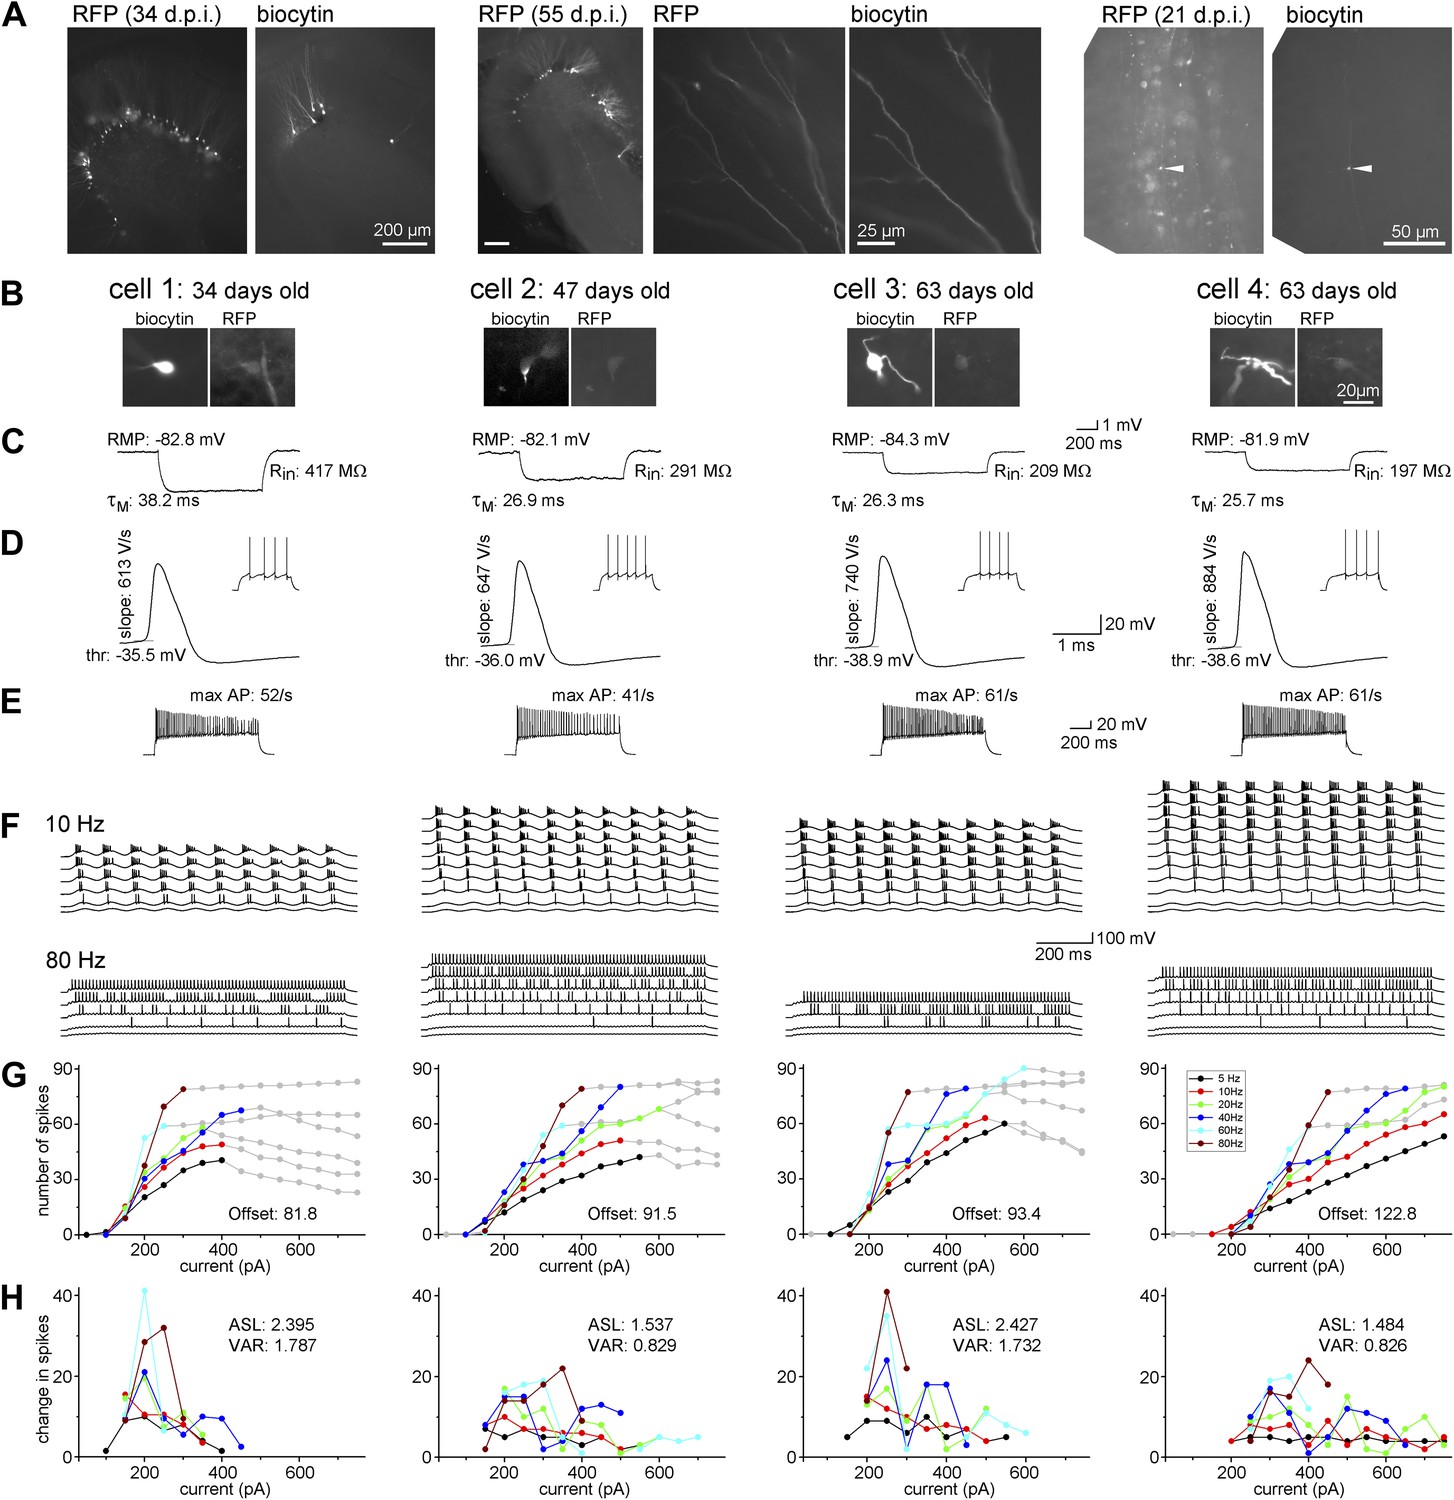
Maturation of the biophysical and integrative properties of ABGCs.
(A) The RFP and biocytin-labeled cells in the dentate gyrus (left panels, d.p.i.: day after virus injection), spiny dendrites (middle panels), and typical mossy fiber terminals in the stratum lucidum of the CA3 region (right) confirm granule cell identity. (B) Four representative RFP-expressing granule cells 34, 47, and 63 days after CAG-RFP virus labeling. The 63-day-old AGBCs were recorded from the same slice. (C) Average subthreshold voltage responses of the example cells to small (−10 pA) current steps. Input resistance (Rin), membrane time constant (τM), and resting membrane potential (RMP) of the cells are indicated. (D) Spike parameters of the example cells at lower current intensities (dV/dt: maximal rate of rise, thr: action potential threshold). (E) Maximal firing rate of the four cells in response to square pulse current injection. (F) Responses of the cells to sinusoidal current injections with increasing amplitude (Δ50 pA) at 10 and 80 Hz. The traces are shown until the firing reached saturation. (G) Number of spikes generated in the example cells as a function of the peak amplitude of the injected sinusoid currents at the all tested frequencies. Gray symbols indicate values that were omitted from the analysis due to lack or saturation of spiking. Offset values describe the minimum input intensities to reach 50% spiking output. (H) Increments of the firing (i.e., the first derivative of the curves in panel F) of the cells. These values were used for the calculation of the average slope (as mean, ASL) and the variance of firing (as variance, VAR). Note that cells 1 and 3 have exceptionally large values at certain input intensity ranges indicating that these cells were more sensitive to certain input intensities. This characteristic is quantified by the large VAR value.
Figure 3
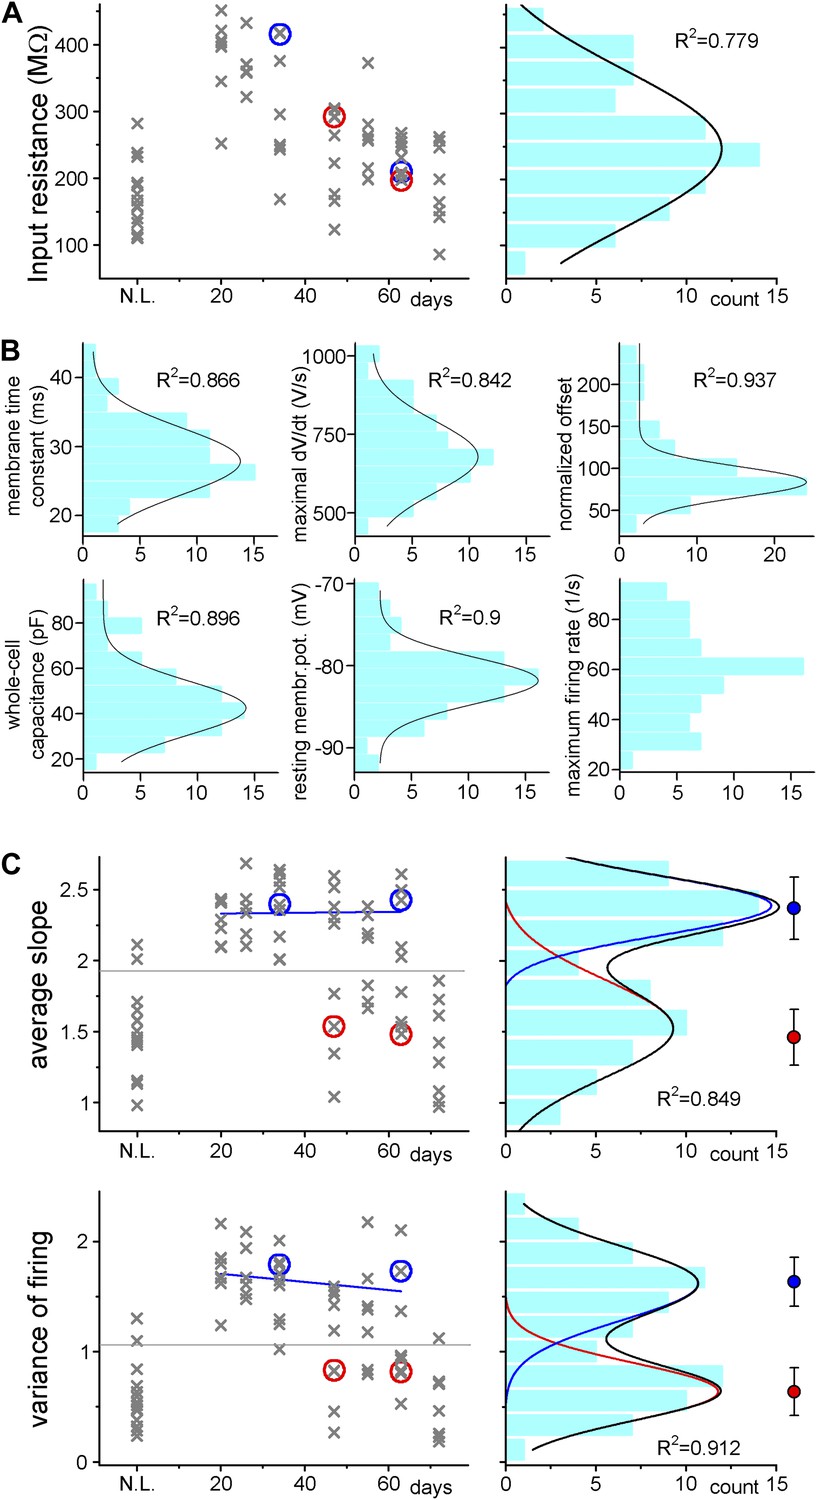
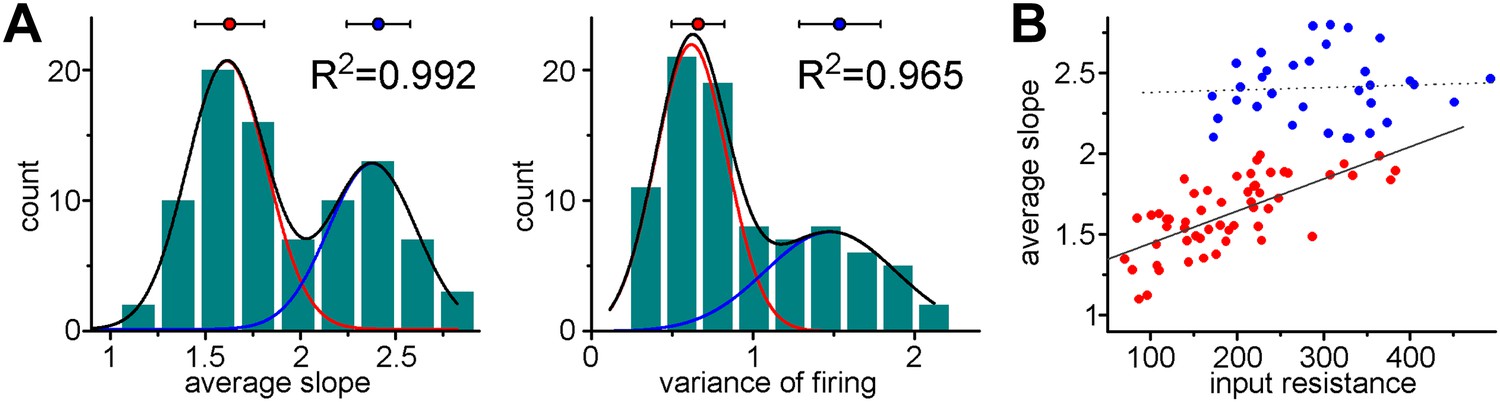
Adult born granule cells (3–10 week old) can be divided into two distinct populations based on cell-to-cell differences in input–output transformation.
(A) Left, input resistance of individual ABGCs with various ages (gray crosses). Red and blue circles (S- and L-group members, respectively) highlight the values for the example cells shown in Figure 1. N.L.: not labeled control cells. Right, probability distribution of the data set shows single peak (single Gaussian fit: F = 0.0001). (B) Monotonous probability distribution of membrane time constant, whole cell capacitance, resting membrane potential, maximal rate of rise of spikes, relative offset of the input–output curves, and action potential threshold data from the same set of cells as above. (C) Left, average slope (top) and variance of the slope (bottom) of the same individual ABGCs as above with various ages (gray crosses). Blue lines indicate the lack of correlation between the gain of the input–output functions and the age of individual cells within the S-group (linear fit, ASL: R2 = −0.029, p = 0.89, VAR: R2 = 0.01, p = 0.257). Right, two population emerges from the distribution of the average slope values of individual cells (two peaks Gaussian, ASL: F = 0.0014, VAR: F = 0.0001). The centers of the two clusters and average distance values from the centers (error bars) are shown on the right (K-means analysis, F < 10−9, horizontal gray lines on the left panels indicate the separation by the K-means analysis).
Figure 4 with 2 supplements
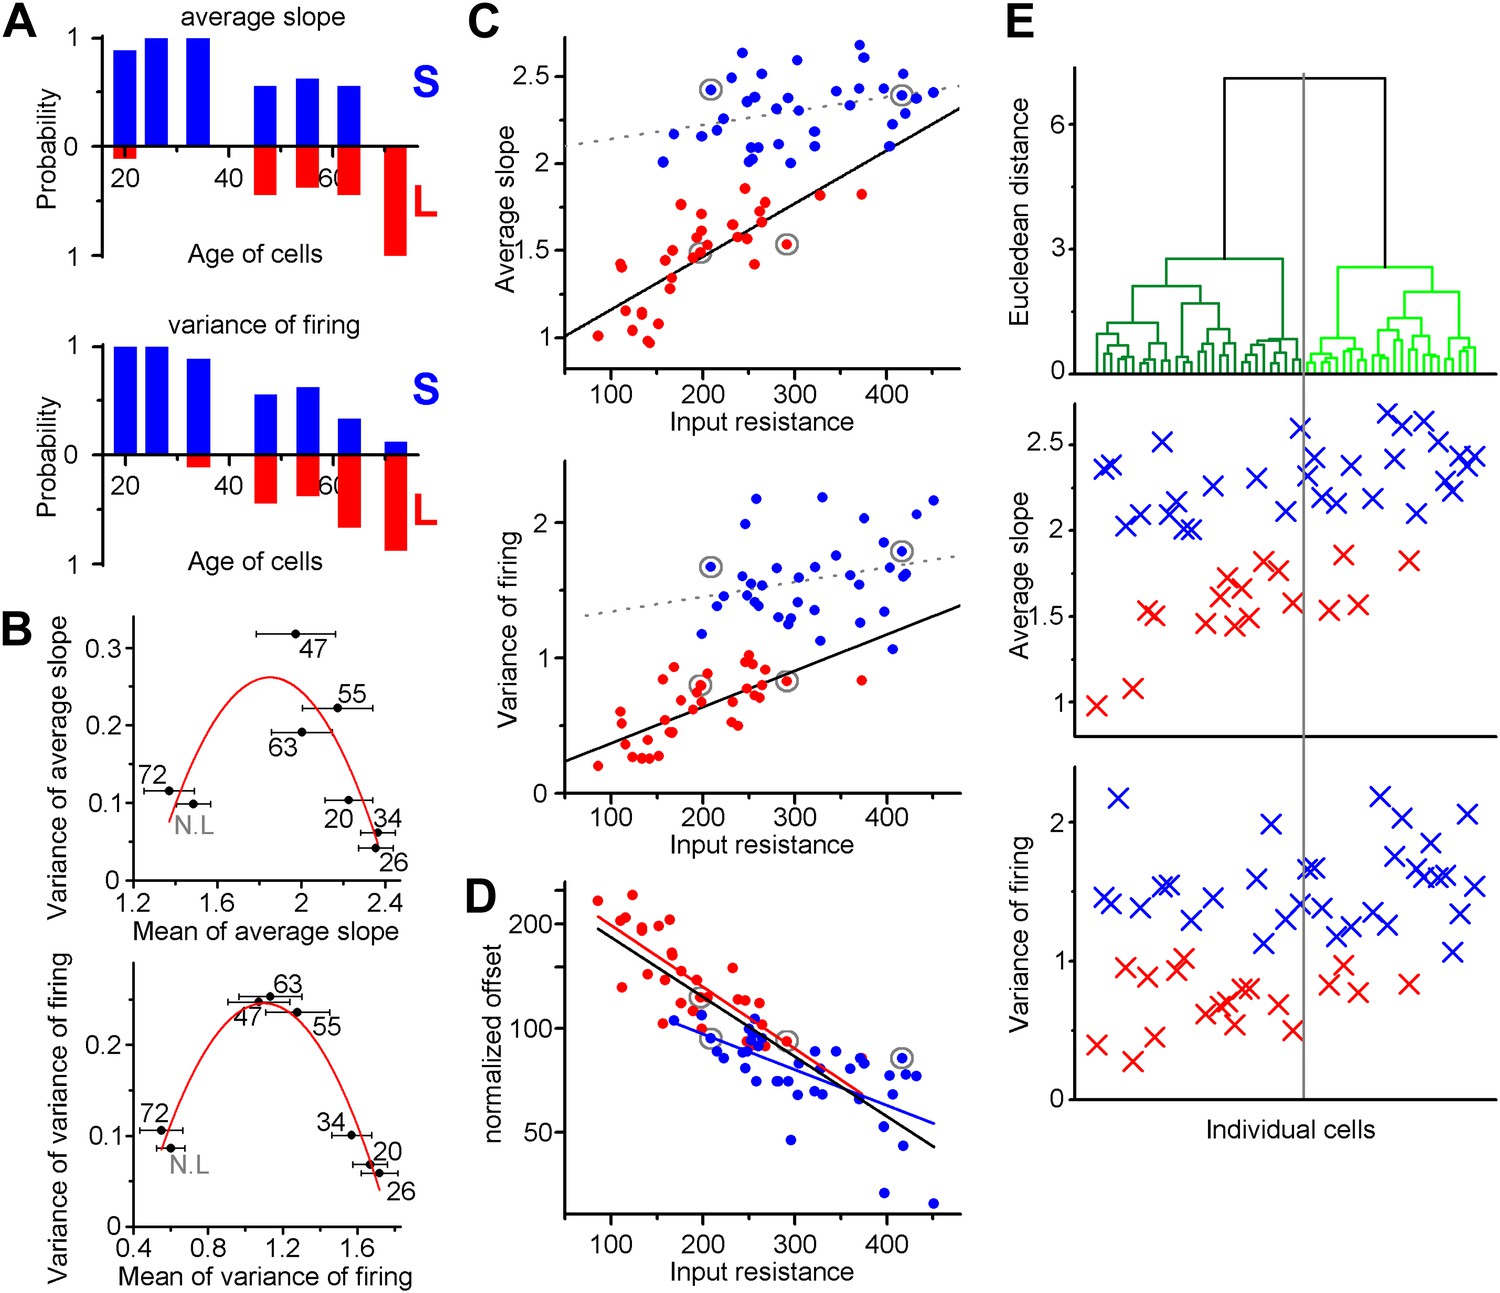
Independence of the output properties of individual ABGCs from age and input resistance.
(A) Probability of the members of the clusters defined by the K-means analysis continuously shifts from S-group (blue) toward L-group (red) during maturation indicating the higher prevalence of ABGCs with shallow and invariable input–output function. (B) The population level functional switch is also suggested by the higher variance of the input–output parameters during the transition age period and low variance in the youngest and most matured populations (parabolic fit, ASL: R2 = 0.611, F(ANOVA) = 0.0035; VAR: R2 = 0.853, F = 0.00017). Numbers indicate the age of the data sets. (C) Correlation of the integrative parameters to the input resistance within the two functionally different groups (red and blue symbols) defined by K-means cluster analysis (see Figure 3). Gray circles indicate the four example cells from Figure 2 (linear fits, ASL: R2 = 0.087, p = 0.045 for S-group, R2 = 0.576, p = 2.9 × 10⁻⁷ for L-group; VAR: R2 = 0.02, p = 0.19 for S-group R2 = 0.467, p = 2.6 × 10⁻⁶ for L-group). (D) Correlation between the normalized current needed to reach output that is half of the input frequency and input resistance of individual ABGCs belonging to the two functionally different groups (R2 = 0.39, p = 0.0001 for S-group; R2 = 0.607, p = 2 × 10⁻⁸ for L-group; R2 = 0.682, p < 10−8 for both groups). (E) Considering multiple membrane parameters of the individual cells (resting membrane potential, membrane time constant, whole cell capacitance, input resistance, threshold, peak dV/dt, maximal firing rate) for hierarchical cluster analysis (Ward method with normalized values) were not sufficient to predict the functional identity of the cells. Data from individual cells are aligned vertically (lines in the upper panel and symbols in the middle and bottom panels). Thus, the order of the points along the X-axes is determined by the results of the cluster analysis.
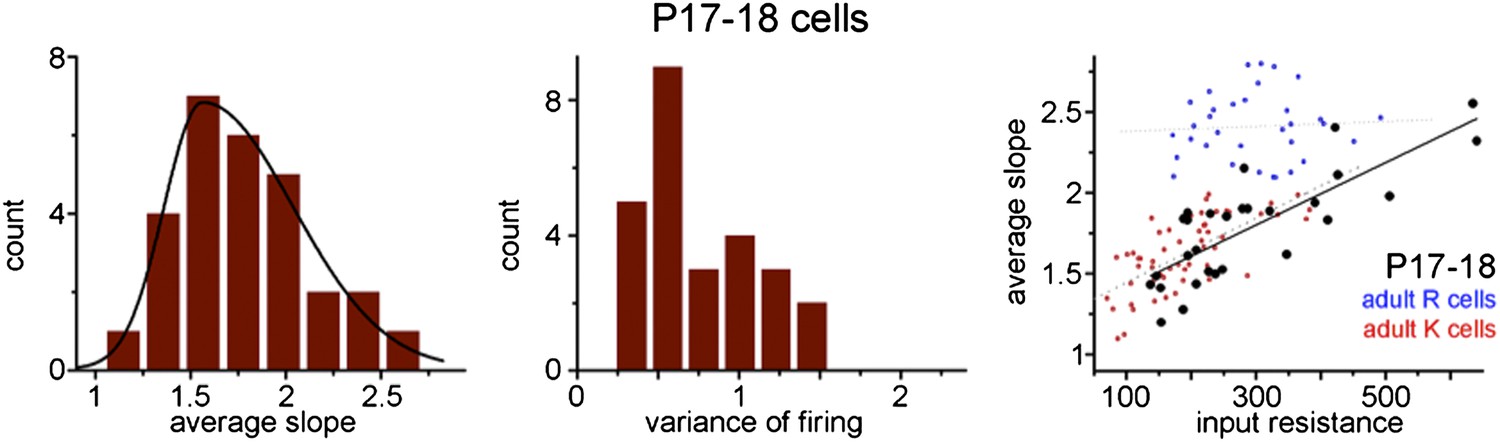
Figure 4—figure supplement 1
Coexistence of S- and L-functionalities among granule cells from non-labeled animals.
(A) Non-labeled granule cells (thus unknown cellular age) were randomly recorded (albeit in the lower half of cell layer of adult dentate (P68–101, not subject of virus injections)). The peaks of the double Gaussian distributions in the birth-dated sample (Figure 3C) and in this new non-labeled sample were very similar (ASL: 1.522 ± 0.056 and 2.389 ± 0.028 vs 1.611 ± 0.008 and 2.377 ± 0.013; VAR: 0.638 ± 0.046 and 1.621 ± 0.052 vs 0.616 ± 0.02 and 1.477 ± 0.09) and the K-means analyses also predicted similar centers and average distance from centers (ASL: 1.461 ± 0.197 and 2.37 ± 0.219 vs 1.627 ± 0.182 and 2.409 ± 0.168; VAR: 0.637 ± 0.217 and 1.643 ± 0.223 vs 0.659 ± 0.163 and 1.536 ± 0.251). (B) The observed unusual and group-specific dependence (or lack of thereof) of the slope on the input resistance was similar in birth-dated ABGCs (see Figure 4C) and in the non-representative sample (unknown age) from non-labeled cells.
Figure 4—figure supplement 2
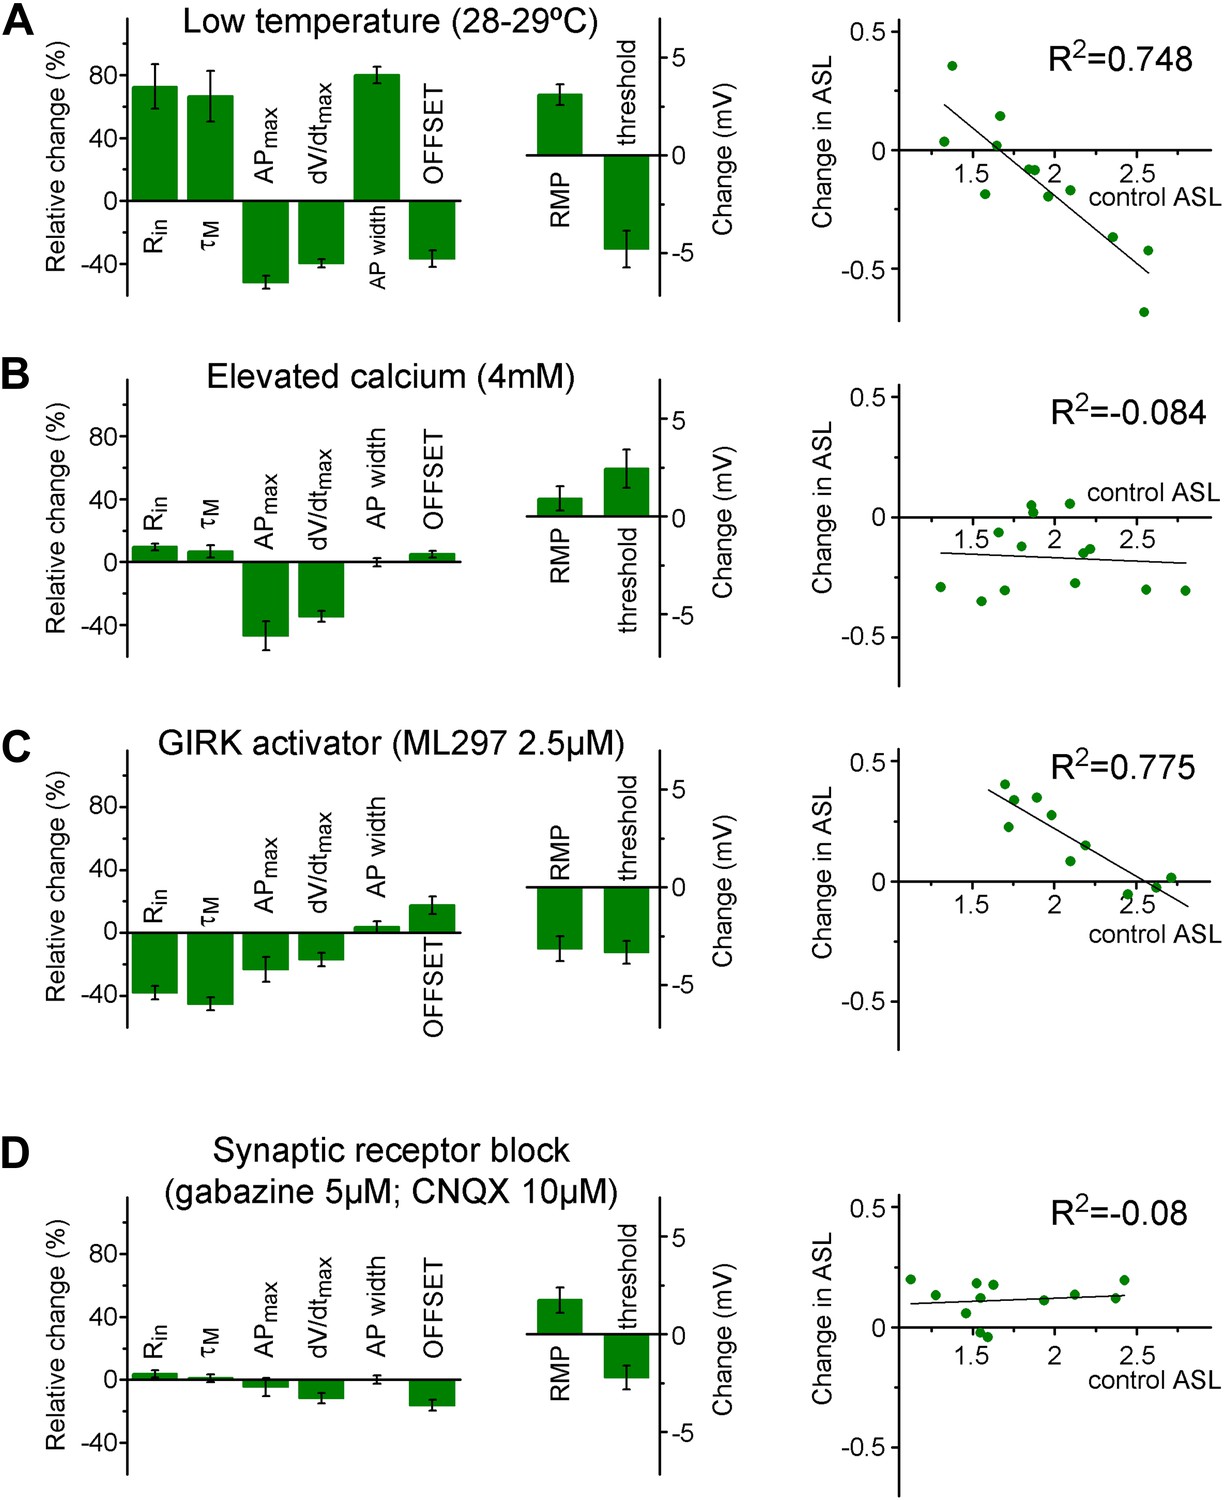
The input–output transformation of individual cells is maintained in two stable states by complex mechanisms.
(A) Lowering the recording temperature resulted in the elimination of the separation between individual granule cells (non-labeled adult animals, see 'Materials and methods' and Figure Supplement 1) based on the ASL and VAR when the same granule cells were analyzed at 28–29°C after establishing its parameters in physiological temperature. With this intervention, practically the same mechanisms (such as voltage-gated channels) were available during the two recording conditions, but the cellular excitability is altered in a complex manner. For example, changes in the classical excitability parameters (e.g., Rin, threshold) suggested increased excitability; whereas the capability to elicit high frequency firing is decreased. Left column graphs show the relative changes and absolute voltage shifts in the biophysical properties of the recorded cell. The right graph shows the change in the ASL during lower temperature plotted against the initial ASL value of individual cells. (B) When the excitability of the cells was challenged by proportionally enhancing calcium-dependent mechanisms by 4 mM extracellular calcium (relative to the 2 mM control condition), the effect on the ASL did not depend on the initial values (i.e., there was no group specific effect); even though the calcium elevation has similar effects on the general excitability parameters of the cells as the lowered temperature. (C) GIRK channel activation by ML297 (2.5 µM) increased the ASL only in a subset of the recorded cells, which had low ASL during control conditions (like the L-group cells). In spite of the similar group specific effects on ASL, GIRK activation, and lower temperature had largely opposite effects on the biophysical properties. (D) Application of GABAA and AMPA/kainate receptor antagonists, gabazine (5 µM) and CNQX (10 µM) slightly increased the ASL value. However, the effect was not depended on the initial state of the tested cells indicating that S- and L-group properties are established independent of the spontaneous synaptic activity.
Author response image 1
Additional files
-
Supplementary file 1
Measured parameters from individual ABGCs—Brunner Neubrandt data ABGC.xlsx.
- https://doi.org/10.7554/eLife.03104.009
Download links
A two-part list of links to download the article, or parts of the article, in various formats.
Downloads (link to download the article as PDF)
Open citations (links to open the citations from this article in various online reference manager services)
Cite this article (links to download the citations from this article in formats compatible with various reference manager tools)
Adult-born granule cells mature through two functionally distinct states
eLife 3:e03104.
https://doi.org/10.7554/eLife.03104


